In What Types of Markets Can Technical Analysis Be Used?
Types of Contracts
Cash Market
Derivative Markets
Swaps and Forwards
How Does a Market Work?
Who Are the Market Players?
How Is the Market Measured?
Price-Weighted Average
Market Capitalization Weighted Average
Equally Weighted (or Geometric) Average
Conclusion
Review Questions
6 Dow Theory
Chapter Objectives
Dow Theory Theorems
The Primary Trend
The Secondary Trend
The Minor Trend
Concept of Confirmation
Importance of Volume
Criticisms of the Dow Theory
Conclusion
Review Questions
7 Sentiment
Chapter Objectives
What Is Sentiment?
Market Players and Sentiment
How Does Human Bias Affect Decision Making?
Crowd Behavior and the Concept of Contrary Opinion
How Is Sentiment of Uninformed Players Measured?
Sentiment Indicators Based on Options and Volatility
Polls
Other Measures of Contrary Opinion
Unquantifiable Contrary Indicators
Historical Indicators
Unusual Indicators
How Is the Sentiment of Informed Players Measured? Insiders
Sentiment in Bonds
Treasury Bond Futures Put/Call Ratio
Treasury Bond COT Data
Treasury Bond Primary Dealer Positions
T-Bill Rate Expectations by Money Market Fund Managers
Gold Sentiment
Conclusion
Review Questions
8 Measuring Market Strength
Chapter Objectives
Market Breadth
The Breadth Line or Advance-Decline Line
Double Negative Divergence
Traditional Advance-Decline Methods That No Longer Are Profitable
Advance-Decline Line to Its 32-Week Simple Moving Average
Breadth Differences
Breadth Ratios
Breadth Thrust
Summary of Breadth Indicators
Up and Down Volume Indicators
The Arms Index
Volume Thrust with Up Volume and Down Volume
Ninety Percent Downside Days (NPDD)
10-to-1 Up Volume Days and 9-to-1 Down Volume Days
Net New Highs and Net New Lows
New Highs Versus New Lows
High Low Logic Index
Hindenburg Omen
Using Moving Averages
Coppock Curve
Number of Stocks Above Their 30-Week Moving Average
Very Short-Term Indicators
Breadth and New Highs to New Lows
Net Ticks
Conclusion
Review Questions
9 Temporal Patterns and Cycles
Chapter Objectives
Periods Longer Than Four Years
Kondratieff Waves, or K-Waves
Population Waves
17–18-Year Alternating Stock Market Cycles
Decennial Pattern
Periods of Four Years or Less
Four-Year or Presidential Cycle
Election Year Pattern
Seasonal Patterns
January Signals
January Barometer
January Effect
Events
Conclusion
Review Questions
10 Flow of Funds
Chapter Objectives
Funds in the Marketplace
Money Market Funds
Margin Debt
Funds Outside the Security Market
Household Financial Assets
Money Supply (M1 & M2)
Money Velocity
Yield Curve
Bank Liquidity
The Cost of Funds and Alternative Investments
Short-Term Interest Rates
Long-Term Interest Rates (or Inversely, the Bond Market)
Corporate Bond and Stock Market Yield Spread
The Misery Indices
Fed Policy
The Federal Reserve Valuation Model
Federal Funds
Free Reserves
Three Steps and a Stumble and Two Tumbles and a Jump
Conclusion
Review Questions
Part III: Trend Analysis
11 History and Construction of Charts
Chapter Objectives
History of Charting
What Data Is Needed to Construct a Chart?
What Types of Charts Do Analysts Use?
Line Charts
Bar Charts
Candlestick Charts
What Type of Scale Should Be Used?
Arithmetic Scale
Semi-Logarithmic Scale
Point and Figure Charts
One-Box (Point) Reversal
Box Size
Multibox Reversal
Time
Arithmetic Scale
Logarithmic Scale
Cloud Charts (Ichimoku Kinko Hyo)
Other Charting Methods Independent of Time
Kagi Chart
Renko Chart
Line-Break Chart (2 or 3 Lines)
Conclusion
Review Questions
12 Trends The Basics
Chapter Objectives
Trend The Key to Profits
Trend Terminology
Basis of Trend Analysis Dow Theory
How Does Investor Psychology Impact Trends?
How Is the Trend Determined? Peaks and Troughs
Determining a Trading Range
What Is Support and Resistance?
Why Do Support and Resistance Occur?
What About Round Numbers?
How Are Important Reversal Points Determined?
How Do Analysts Use Trading Ranges?
Directional Trends (Up and Down)
What Is a Directional Trend?
How Is an Uptrend Spotted?
Channels
Internal Trend Lines
Other Types of Trend Lines
Trend Lines on Point and Figure Charts
Speed Lines
Andrews Pitchfork
Gann Fan Lines
Conclusion
Review Questions
13 Breakouts, Stops, and Retracements
Chapter Objectives
Breakouts
How Is Breakout Confirmed?
Can a Breakout Be Anticipated? Stops
What Are Entry and Exit Stops? Changing Stop Orders
What Are Protective Stops?
What Are Trailing Stops?
What Are Time Stops?
What Are Money Stops?
How Can Stops Be Used with Breakouts?
Using Stops When Gaps Occur
Placing Stops for a False (or “Specialist”) Breakout
Retracements
Pullbacks and Throwbacks
Waiting for Retracement
Calculating a Risk/Return Ratio for Breakout Trading
Conclusion
Review Questions
14 Moving Averages
Chapter Objectives
What Is a Moving Average?
How Is a Simple Moving Average Calculated?
Length of Moving Average
Using Multiple Moving Averages
What Other Types of Moving Averages Are Used?
The Linearly Weighted Moving Average (LWMA)
The Exponentially Smoothed Moving Average (EMA)
Wilder Method
Geometric Moving Average (GMA)
Triangular Moving Average
Variable EMAs
Strategies for Using Moving Averages
Determining Trend
Determining Support and Resistance
Determining Price Extremes
Giving Specific Signals
What Is Directional Movement?
Constructing Directional Movement Indicators
Using Directional Movement Indicators
What Are Envelopes, Channels, and Bands?
Percentage Envelopes
Bands
Trading Strategies Using Bands and Envelopes
Channel
Conclusion
Review Questions
Part IV: Chart Pattern Analysis
15 Bar Chart Patterns
Chapter Objectives
What Is a Pattern?
Common Pattern Characteristics
Do Patterns Exist?
Behavioral Finance and Pattern Recognition
Computers and Pattern Recognition
Market Structure and Pattern Recognition
Bar Charts and Patterns
How Profitable Are Patterns?
Classic Bar Chart Patterns
Double Top and Double Bottom
Rectangle (Also “Trading Range” or “Box”)
Triple Top and Triple Bottom
Standard Triangles
Descending Triangle
Ascending Triangle
Symmetrical Triangle (Also “Coil” or “Isosceles Triangle”)
Broadening Patterns
Diamond Top
Wedge and Climax
Patterns with Rounded Edges Rounding and Head-and-Shoulders
Rounding Top, Rounding Bottom (Also “Saucer,” “Bowl,” or “Cup”)
Head-and-Shoulders
Shorter Continuation Trading Patterns Flags and Pennants (Also “Half-Mast Formation”)
Long-Term Bar Chart Patterns with the Best Performance and the Lowest Risk of Failure
Conclusion
Review Questions
16 Point and Figure Chart Patterns
Chapter Objectives
What Is Different About a Point and Figure Chart?
Time and Volume Omitted
Continuous Price Flow Necessary
“Old” and “New” Methods
History of Point and Figure Charting
One-Box Reversal Point and Figure Charts
Consolidation Area on the One-Box Chart (Also “Congestion Area”)
Trend Lines in One-Box Charts
The Count in a One-Point Chart
Head-and-Shoulders Pattern
The Fulcrum
Action Points
Three-Point (or Box) Reversal Point and Figure Charts
Trend Lines with Three-Box Charts
The Count Using Three-Box Reversal Charts
The Eight Standard Patterns for Three-Box Reversal Charts
Other Patterns
Conclusion
Review Questions
17 Short-Term Patterns
Chapter Objectives
Pattern Construction and Determination
Traditional Short-Term Patterns
Gaps
Spike (or Wide-Range or Large-Range Bar)
Dead Cat Bounce (DCB)
Island Reversal
One- and Two-Bar Reversal Patterns
Other Multiple-Bar Patterns
Volatility Patterns
Intraday Patterns
Summary of Short-Term Patterns
Candlestick Patterns
One- and Two-Bar Candlestick Patterns
Multiple-Bar Patterns
Candlestick Pattern Results
Conclusion
Part V: Trend Confirmation
18 Confirmation
Chapter Objectives
Analysis Methods
Overbought/Oversold
Failure Swings
Divergences
Reversals
Trend ID
Crossovers
Classic Patterns
Volume Confirmation
What Is Volume?
How Is Volume Portrayed?
Do Volume Statistics Contain Valuable Information?
How Are Volume Statistics Used?
Which Indexes and Oscillators Incorporate Volume?
Volume Spikes
Examples of Volume Spikes
Open Interest
What Is Open Interest?
Open Interest Indicators
Price Confirmation
What Is Momentum?
How Successful Are Momentum Indicators?
Specific Indexes and Oscillators
Conclusion
Review Questions
Part VI: Other Technical Methods and Rules
19 Cycles
Chapter Objectives
What Are Cycles?
Other Aspects of Cycle Analysis
Translation
How Can Cycles Be Found in Market Data?
Fourier Analysis (Spectral Analysis)
Maximum Entropy Spectral Analysis
Simpler (and More Practical) Methods
Projections
Projecting Period
Projecting Amplitude
Conclusion
Review Questions
20 Elliott, Fibonacci, and Gann
Chapter Objectives
Elliott Wave Theory (EWT)
Ralph Nelson Elliott
Basic Elliott Wave Theory
Impulse Waves
Corrective Waves
Guidelines and General Characteristics in EWT
Projected Targets and Retracements
Alternatives to EWT
Using EWT
The Fibonacci Sequence
Fibonacci
The Fibonacci Sequence
The Golden Ratio
Price and Time Targets
W D Gann
Conclusion
Review Questions
Part VII: Selection
21 Selection of Markets and Issues: Trading and Investing
Chapter Objectives
Which Issues Should I Select?
Trading (Swing and Day)
Choosing Between Futures Markets and Stock Markets
Which Issues Should I Select for Investing?
Top-Down Analysis
Secular Emphasis
Cyclical Emphasis
Stock Market Industry Sectors
Bottom Up Specific Stock Selection and Relative Strength
Relative Strength
Academic Studies of Relative Strength
Measuring Relative Strength
Examples of How Selected Professionals Screen for Favorable Stocks
William O’Neil CANSLIM Method
James P. O’Shaughnessy Method
Charles D Kirkpatrick Method
Value Line Method
Richard D Wyckoff Method
Conclusion
Review Questions
Part VIII: System Testing and Management
22 System Design and Testing
Chapter Objectives
Why Are Systems Necessary?
Discretionary Versus Nondiscretionary Systems
A Complete Trading System
How Do I Design a System?
Requirements for Designing a System
Initial Decisions
Types of Technical Systems
How Do I Test a System?
Clean Data
Special Data Problems for Futures Systems
Testing Methods and Tools
Test Parameter Ranges
Optimization
Methods of Optimizing
Measuring System Results for Robustness
Conclusion
Review Questions
23 Money and Portfolio Risk Management
Chapter Objectives
Risk and Money Management
Testing Money-Management Strategies
Money-Management Risks
Concepts
Reward to Risk
Normal Risks
Unusual Risks
Money-Management Risk Strategies
Protective Stop
Trailing Stop
Other Kinds of Stops
Targets
Execution
Monitoring Systems and Portfolios
If Everything Goes Wrong
Conclusion
Review Questions
Part IX: Appendices
A Basic Statistics
Appendix Objectives
Returns
Probability and Statistics
Descriptive Statistics
Measures of Central Tendency
Measures of Dispersion
Relationships Between Variables
Inferential Statistics
Modern Portfolio Theory
Performance Measurement
Advanced Statistical Methods
Artificial Intelligence
Review Questions
B Types of Orders and Other Trader Terminology
An Order Ticket
Acknowledgments
To Richard D Kirkpatrick (deceased), my father, and ex-portfolio manager for Fidelity beginning in the 1950s. Heintroducedmeto technical analysis at theageof 14 by askingmeto updatehis charts. Intheyearof his retirement, 1968, he managed the best-performing mutual fund in the world: the Fidelity International Fund.
To the Market Technicians Association, through which I have met many of the best innovators and practitioners of technical analysis, and especially to staff members Cassandra Townes and Marie Penza, for theirsupport andassistanceinmakingavailabletheMTAlibrary
To Skip Cave (deceased), past dean of the Fort Lewis College School of Business Administration, for allowing me to assist him in teaching a course in technical analysis, for getting this project going by introducing me to other textbook authors, such as the Assistant Dean Roy Cook, and for providing office spaceduringtheinitial writingandresearchingforthis book.
To Thomas Harrington, past dean of the Fort Lewis College School of Business Administration, for allowing me to maintain an office at the college, for allowing me special privileges at the college library, and foraskingmeto continueteachingacourseintechnical analysis
To my students in class BA317 at Fort Lewis College School of Business Administration, for being my teachingguineapigs andforkeepingmeonmy toes withquestions andobservations.
To my students in class FIN 235F at Brandeis International Business School, for their initial skepticism andlaterenthusiasm about technical analysis.
To my friends andcolleagues at thePhiladelphiaStock Exchange, specifically VinnieCasella, past president, who taught mefrom theinsidehow markets really work.
To thededicatedpeopleat PearsonEducation, specifically Jim Boyd, executiveeditor(sinceretired); Jeanne Glasser Levine, executive editor; Kristen Watterson, editorial assistant; Betsy Gratner, senior project editor; KarenGill, copy editor; andall theothers behindthescenes whom Ihavenot knowndirectly
To Phil Roth and Bruce Kamich, both past presidents of the Market Technicians Association, professional technical analysts, and adjunct professors teaching courses in technical analysis at universities in the New York area, foreditingthematerial inthis book andkeepingmeinline.
To Julie Dahlquist, my coauthor, and her husband, Richard Bauer, both professors steeped in the ways of academia, for bringing that valuable perspective to this book and for their time and help in straightening out my understandingof theEfficient Markets Hypothesis.
To my wife, Ellie, who has had to put up with me for 54 years and has always done so pleasantly and with love
To my children, Abby, Andy, Bear, andBradlee, fortheirloveandsupport
And to my grandchildren, India and Mila, who didn’t do anything for the book but who pleaded to be mentioned.
I thank you and all the many others from my lifetime of work in technical analysis for your support, friendship, andwillingness to impart yourknowledgeof tradingmarkets.
Charles Kirkpatrick Kittery, Maine
The assistance and support of many people contributed to turning the dream of this book into a reality. Fred Meissner was the one who initially introduced me to my coauthor, Charlie, at a Market Technicians Association chapter meeting. After I worked with Charlie on several projects and we served together on the Market Technicians Association Educational Foundation Board, he bravely agreed to a partnership in writing this book. Charlie has beenthe ideal coauthor positive, patient, and persistent. It has beenan honor to work with someone so knowledgeable and an incredible experience to work with someone so willing to share his knowledge.
The faculty and staff in the Department of Finance at the University of Texas at San Antonio College of Business have been a pleasure to work with while this book has been in process. Keith Fairchild, Lulu Misra, andRobert Lengel havebeenespecially supportive
Theexpertiseof thededicatedteam at PearsonEducationhas beeninvaluableinhelping Charlieandmeget our ideas into this final format. Thanks to Jeanne Glasser Levine, Kristen Watterson, Betsy Gratner, Karen Gill, and the entire Pearson Education team for their gentle prodding, their continued encouragement, and theirtireless commitment to this project.
My husband, Richard Bauer, assisted inmore ways thancanever be counted. He graciously wrote the Basic Statistics appendix for this book. He served as a sounding board for many of the ideas in this book. He read drafts and made many helpful suggestions to the manuscript. However, his support goes far beyond his professional expertise. Richard untiringly took care of many household tasks as I spent time working on this project His help made it easy for me to travel to meet with Charlie and work on this project I am blessed to receivehis unwaveringemotional support andencouragement.
My two children, Katherine and Sepp, have also been a source of blessing and inspiration. They demonstrated extreme patience through this entire process. They also reminded me of the need for fun, laughter, andagoodhugwheneverIwas temptedto work too hard.
Julie Dahlquist San Antonio, TX
About the Authors
Charles D Kirkpatrick II, CMT, relativeto technical analysis, is orhas been:
President, Kirkpatrick & Company, Inc, Kittery, Maine a private firm specializing in technical research; editorandpublisherof theMarket Strategist newsletter.
Authorof several otherbooks onaspects of technical analysis inthetradingmarkets.
Adjunct professor of finance, Brandeis University International School of Business, Waltham, Massachusetts.
Director and vice president, Market Technicians Association Educational Foundation, Cambridge, Massachusetts a charitable foundation dedicated to encouraging and providing educational courses intechnical analysis at thecollegeanduniversity level.
Editor, Journal of Technical Analysis, New York, New York the official journal of technical analysis research
Director, Market Technicians Association, New York, New York an association of professional technical analysts.
In his life in the stock and options markets, Mr. Kirkpatrick has been a hedge fund manager, investment advisor, advisor to floor and desk traders and portfolio managers, institutional stock broker, options trader, desk and large-block trader, lecturer and speaker on aspects of technical analysis to professional and academic groups, expert legal witness on the stock market, owner of several small businesses, owner of an institutional brokerage firm, and part owner of a CBOE options trading firm His research has been published in Barron’s and elsewhere. In 1993 and 2001, he won the Charles H. Dow Award for excellence in technical research, and in 2009, he won the MTA award for his contributions to technical analysis. In 2012, he and Julie Dahlquist together won the Mike Epstein Award from the Market Technicians Association Educational Foundation for their dedication to expanding technical analysis courses into college and university graduate schools and for creating this textbook to be used in professional courses on technical analysis Educated at Phillips Exeter Academy, Harvard College (A.B.), and the Wharton School of the University of Pennsylvania (M.B.A.), he was also a decorated combat officer with the 1st Cavalry Division in Vietnam. He currently resides in Maine withhis wife, Ellie, andtheirvarious domesticanimals.
Julie R. Dahlquist, Ph.D., received her B.B.A. in economics from University of Louisiana at Monroe, her M.A. in theology from St. Mary’s University, and her Ph.D. in economics from Texas A&M University. Dr Dahlquist has taught at the collegiate level for three decades Currently, she is an associate professor of professional practice in economics and finance at the M. J. Neeley School of Business at Texas Christian University Dr Dahlquist is a frequent presenter at national and international conferences She is the coauthor (with Richard Bauer) of Technical Market Indicators: Analysis and Performance (John Wiley & Sons) and Technical Analysis of Gaps (Pearson). Her research has appeared in Financial Analysts Journal, Journal of Technical Analysis, Managerial Finance, Applied Economics, Working Money, Financial Practice and Education, Active Trader, andtheJournal of Financial Education. Sheis arecipient of the Charles H Dow Award (2011) and the Epstein Award (2012) She serves on the Board of the Market Technicians AssociationEducational Foundationandas editorof theJournal of Technical Analysis. She and herhusband, RichardBauer, havetwo children, KatherineandSepp.
Part I: Introduction
Chapter 1. Introduction to Technical Analysis
Technical analysis these words may conjure up many different mental images Perhaps you think of the stereotypical technical analyst, aloneinawindowless office, slouched over stacks of hand-drawncharts of stock prices. Maybe you think of the sophisticated multicolored computerized chart of your favorite stock you recently saw. Possibly you think of a proprietary trader in front of multiple computer screens displaying graphics of each trade in a series of futures markets. Perhaps you begin dreaming about all the money you could make if you knew the secrets to predicting stock prices Or, maybe you remember sitting in a finance class and hearing your professor say that technical analysis “is a waste of time.” In this book, we examine some of theperceptions andmisperceptions of technical analysis.
If you are new to the study of technical analysis, you might be wondering just what technical analysis is. In its basicform, theanswer is that technical analysis is thestudy of prices infreely traded markets withtheintent of making profitable trading or investment decisions. Technical analysis is rooted in basic economic theory. Consider the assumptions presented by Robert D Edwards and John Magee in the classic book Technical Analysis of Stock Trends:
•Stock prices aredeterminedsolely by theinteractionof demandandsupply.
Technical analysts study the action of the markets rather than of the goods in which the market deals. The technical analyst believes that “the market is always correct. ” In other words, rather than trying to consider all the factors that will influence the demand for Gadget International’s newest electronic gadget and all the items that will influence the company ’ s cost and supply curve to determine an outlook for the stock’s price, the technical analyst believes that all thesefactors arealready factoredinto thedemandandsupply curves and, thus, the price of the company ’ s stock. We find that stock prices (and prices for any security in freely traded markets) are influenced by psychological factors as well, most of them indecipherable. Greed, fear, cognitive bias, misinformation, expectations, and other factors enter into the price of a security, making the analysis of the factors nearly impossible. The technical analyst disregards all these imponderables and instead studies the way the marketplace is accepting the multitude of exogenous information and beliefs with the intention of findingpatterns inthat actionthat havepredictivepotential.
Students new to any discipline often ask, “How can I use the knowledge of this discipline?” Students new to technical analysis are no different. Technical analysis is used in two major ways: predictive and reactive. Those who use technical analysis for predictive purposes use the analysis to make predictions about future market moves. Generally, these individuals make money by selling their predictions to others. Market letter writers in print or on the Web and the technical market gurus who frequent the financial news fall into this category. The predictive technical analysts include the more well-known names in the industry; these individuals likepublicity becauseit helps market theirservices.
Ontheother hand, those who usetechnical analysis inareactivemodeare usually not well known. Traders and investors use techniques of technical analysis to react to particular market conditions to make their decisions. For example, a trader may use a moving average crossover to signal when a long position should be taken Inotherwords, thetraderis watching themarket andreacting whenacertaintechnical conditionis met
These traders and investors are making money by making profitable trades for their own or clients’ portfolios. Someof them may evenfindthat publicity distracts them from theirunderlyingwork.
The focus of this book is to explain the basic principles and techniques of technical analysis. We do not attempt to predict the market, nor do we provide you with the Holy Grail or apromise of amethod that will make you millions overnight Instead, we offer background, basic tools, and techniques that you will need to beacompetent, reactive, technical analyst.
As wewill seewhenwestudy thehistory of technical analysis, theinterest intechnical analysis intheUnited States dates back more than150 years, whenCharles H Dow beganto write newsletters that later turned into the Wall Street Journal and developed the various Dow averages to measure the stock market. Since that time, muchhas beenwrittenabout technical analysis. Today, thereareentireperiodicals, suchas theTechnical Analysis of Stock and Commodities and the Journal of Technical Analysis, devoted to the study of the subject. Inaddition, therearemany articles appearing inother publications, including academicjournals. There are even a number of excellent books on the market As you can see from this book’s extensive bibliography, which is inno way acomplete list of every published item ontechnical analysis, amassive quantity of material about technical analysis exists.
So why does the world need another book on technical analysis? We began looking through the multitude of materials on technical analysis a few years ago, searching for resources to use in educational settings. We noticed that many specialized books existed on the topic, but there was no resource to provide the student of technical analysis with a comprehensive summation of the body of knowledge We decided to supply a coherent, logical framework forthis material that couldbeusedas atextbook andareferencebook.
Our intent in writing this book is to provide the student of technical analysis, whether a novice college student or an experienced practitioner, with a systematic study of the field of technical analysis. Over the past century, much has been written about the topic. The classic works of Charles Dow and the timeless book by Edwards andMageestill containvaluableinformationforthestudent of technical analysis. The basicprinciples of these early authors are still valid today However, the evolving financial marketplace and the availability of computer power have led to a substantial growth in the new tools and information available to the technical analyst.
Many technical analysts learned their trade from the mentors with whom they have worked Numerous individuals who are interested in studying technical analysis today, however, do not have access to such a mentor. In addition, as the profession has advanced, many specific techniques have been developed. The result is that the techniques and methods of technical analysis often appear to be a hodgepodge of tools, ideas, and evenfolklore, ratherthanapart of acoherent body of knowledge.
Many books on the market assume a basic understanding of technical analysis or focus on particular financial markets or instruments Our intent is to offer the reader a basic reference to support a lifelong study of the discipline. We have attempted to provide enough background information and terminology that you caneasily read this book without having to refer to other references for background information. We have also included a large number of references for further reading so that you can continue learning in the specialized areas that interest you.
Another unique characteristic of this book is the joining of the practitioner and the academic. Technical analysis is widely practiced, both by professional traders and investors and by individuals managing their own money. However, this widespread practice has not beenmatched by academic acknowledgment of the benefits of technical analysis. Academics have been slow to study technical analysis; most of the academic studies of technical analysis have lacked a thorough understanding of the actual practice of technical analysis It is our hope not only to bring together apractitioner-academicauthor team but also to provide abook that promotes
discussionandunderstandingbetweenthesetwo groups
Whether you are a novice or an experienced professional, we are confident that you will find this book helpful. For the student new to technical analysis, this book will give you the basic knowledge and building blocks to begin a lifelong study of technical analysis. For the more experienced technician, you will find this book to be an indispensable guide, helping you to organize your knowledge, question your assumptions and beliefs, andimplement new techniques.
We begin this book with a look at the background and history of technical analysis. In Part I, “Introduction,” we discuss not only the basic principles of technical analysis but also the technical analysis controversy the debate between academics and practitioners regarding the efficiency of financial markets and the merit of technical analysis. This background information is especially useful to those who are new to technical analysis and to those who are studying the subject in an educational setting. For those with more experience with the field or with little interest in the academic arguments about market efficiency, a quick readingof this first part will probably suffice
In Part II, “Markets and Market Indicators,” we focus on markets and market indicators Chapter 5, “An Overview of Markets,”is abasicoverview of how markets work. Market vocabulary andtrading mechanics are introducedinthis chapter. Forthestudent who is unfamiliar with this terminology, athorough understanding of this chapter will provide the necessary background for the remaining chapters. Our focus in Chapter 6, “Dow Theory,” is on the development and principles of Dow Theory. Although Dow Theory was developed a century ago, much of modern-day technical analysis is based on these classic principles A thorough understandingof thesetimeless principles helps keepthetechnical analyst focusedonthekey concepts that lead to making money in the market. In Chapter 7, “Sentiment,” the psychology of market players is a major concept. InChapter8, “MeasuringMarket Strength,” we discuss methods for gauging overall market strength. InChapter9, “Temporal Patterns and Cycles,” we focus on temporal tendencies, the tendency for the market to move in particular directions during particular times, such as election year cycles and seasonal stock market patterns. Because the main fuel for the market is money, Chapter 10, “Flow of Funds,” looks at measures of market liquidity andhow theFederal Reservecaninfluencethat liquidity.
Part III, “TrendAnalysis,” can be thought of as the heart of technical analysis. If we see that the market is trending upward, we can profitably ride that trend upward. If we determine that the market is trending downward, we can even profit by taking a short position. In fact, the most difficult time to profit in the market is when there is no definitive upward or downward trend Over the years, technical analysts have developed a number of techniques to help them visually determine when a trend is in place. These charting techniques are the focus of Chapter11, “History and Construction of Charts.” In Chapter 12, “Trends The Basics,” we discuss how to draw trend lines and determine support and resistance lines using these charts. In Chapter13, “Breakouts, Stops, and Retracements,” we focus on determining breakouts. These breakouts will help us recognize a trend change as soon as possible Moving averages, a useful mathematical technique for determiningtheexistenceof trends, arepresentedinChapter14, “MovingAverages.”
Part IV, “Chart PatternAnalysis,”focuses ontheitem that first comes to mindwhenmany peoplethink of technical analysis In Chapter 15, “Bar Chart Patterns,” we cover classic bar chart patterns; in Chapter 16, “Point and Figure Chart Patterns,” we focus on point and figure chart patterns. Finally, short-term patterns, includingcandlestick patterns, arecoveredinChapter17, “Short-Term Patterns.”
Part V, “Trend Confirmation,” deals with the concept of confirmation. We consider price oscillators and momentum measures in Chapter 18, “Confirmation.” Building upon the concept of trends from earlier chapters, welook at how volumeplays aroleinconfirmingthetrend, givingus moreconfidencethat atrendis indeed occurring We also look at oscillators and indexes of momentum to analyze other means of confirming
pricetrend.
Next, we turn our attention to the relationship between cycle theory and technical analysis in Part VI, “Other Technical Methods and Rules.”InChapter19, “Cycles,” we discuss the basic principles of cycle theory and the characteristics of cycles. Some technical analysts believe that cycles seen in the stock market have a scientific basis; for example, R N Elliott claimed that the basic harmony found in nature occurs in the stock market. Chapter 20, “Elliott, Fibonacci, and Gann,” introduces the basic concepts of Elliott Wave Theory, a school of thought that adheres to Elliott’s premisethat stock pricemovements form discerniblewavepatterns.
Onceweknow thebasictechniques of technical analysis, thequestionbecomes, “Whichparticularsecurities will we trade?” covered in Part VII, “Selection.” Selection decisions are the focus of Chapter 21, “Selection of Markets and Issues: Trading and Investing.” In this chapter, we discuss the intermarket relationships that will help us determine on which market to focus by determining which market is most likely to show strong performance. We also discuss individual security selection, measures of relative strength, and how successful practitioners haveusedthesemethods to construct portfolios
As technical analysts, we need methods of measuring our success After all, our main objective is making money. Although this is a straightforward objective, determining whether we are meeting our objective is not quite so straightforward. Proper measurement of trading and investment strategies requires appropriate risk measurement andanunderstanding of basicstatistical techniques. That’s wherePart VIII, “System Testing and Management,” comes into play. The last couple of chapters help put all the tools and techniques we present throughout the book into practice Chapter 22, “System Design and Testing,” is devoted to developing and testing trading systems. At this point, we look at how we can test the tools and indicators covered throughout the book to see if they will make money for us our main objective in the particular way we would like to trade. Finally, Chapter23, “Money and Portfolio Risk Management,” deals with “ stops ” to protect individual investments from loss andwithmoney management to avoidoverall capital loss.
For those who need a brushup in basic statistics or want to understand some of the statistical concepts introduced throughout the book, Richard J Bauer, Jr, PhD, CFA, CMT (Professor of Finance, Greehey School of Business, St. Mary’s University, San Antonio, Texas), provides a tutorial on basic statistical techniques of interest to thetechnical analyst inAppendix A, “BasicStatistics.”
For those who are unfamiliar with the terms and language used in trading, Appendix B, “Types of Orders and Other Trader Terminology,” offers brief definitions of specific order types and commonly used terms in orderentry.
A comprehensive bibliography positioned before the index at the back of the book provides not only historic reading references but also contemporary studies by academic institutions as well as recent books and articles onvarious aspects of technical analysis bothpractical andtheoretical.
As with all skills, learning technical analysis requires practice. We have supplied a number of review questions and problems at the end of the chapters to help you begin thinking about and applying some of the concepts on your own. (A study guide, available separately, provides the answers to the questions.) The extensive bibliography will direct you to further readings in the areas of technical analysis that are of particular interest to you
Another way of honing your technical skills is by participating inaprofessional organizationthat is focused on technical analysis. In the United States, the Market Technicians Association (MTA) provides a variety of seminars, lectures, and publications for technical analysis professionals It has 23 US and 16 foreign chapters, three levels of membership (student, affiliate, and full), and a well-stocked library of technical analysis books and other publications. The MTA also sponsors the Chartered Market Technician (CMT) program. Professionals wanting to receive the prestigious CMT designation must pass three examinations and adhere to
a strict code of professional conduct. More information about the MTA and the CMT program may be found at the Web site www.mta.org. The International Federation of Technical Analysts, Inc. (IFTA) is a global organization of market analysis societies and associations. IFTA and its 21 member associations worldwide sponsor a number of seminars and publications IFTA offers a professional certification, the Certified Financial Technician (CFTe), and a masters-level degree, the Master of Financial Technical Analysis (MFTA) The details of these certifications, along with contact information for IFTA’s member associations aroundtheworld, canbefoundat theirWeb site: www.ifta.org.
Technical analysis is a complex, ever-expanding discipline. The globalization of markets, the creation of new securities, and the availability of inexpensive computer power are opening evenmore opportunities inthis field Whether you use the information professionally or for your own personal trading or investing, we hope that this book will serveas astepping-stoneto yourstudy andexplorationof thefieldof technical analysis.
Chapter 2. The Basic Principle of Technical Analysis The Trend
Chapter Objectives
Afterreadingthis chapter, youshouldbeableto
•Definetheterm trend
•Explainwhy determiningthetrendis important to thetechnical analyst
•Discuss someof thebasicbeliefs uponwhichtechnical analysis is built
The art of technical analysis for it is an art is to identify trend changes at an early stage and to maintain an investment position until the weight of the evidence indicates that the trend has reversed. (Pring, 2002)
Technical analysis is based on one major assumption: Freely traded, market prices, in general, travel in trends.
Based onthis assumption, traders and investors hope to buy a security at the beginning of anupward trend at a low price, ride the trend, and sell the security whenthe trend ends at a higher price Although this strategy sounds simple, implementingit is exceedingly complex.
For example, what length trend are we discussing? The trend in stock prices since the Great Depression? The trend in gold prices since 1980? The trend in the Dow Jones Industrial Average (DJIA) in the past year? The trend in Merck stock during the past week? Trends exist in all lengths, from long-term trends that occur overdecades to short-term trends that occurfrom minuteto minute.
Trends of different lengths tend to have the same characteristics. Inother words, atrend inannual datawill behavethesameas atrend infive-minutedata Investors must choosewhichtrend is most important for them based on their investment objectives, their personal preferences, and the amount of time they can devote to watching market prices Oneinvestormight bemoreconcerned about the business cycle trend that occurs over several years. Another investor might be more concerned about the trend over the next six months, and athird investor might be most concerned about the intraday trend. Although individual investors and traders have investment time horizons that vary greatly, they canuse the same basic methods of analyzing trends because of thecommonalities that exist amongtrends of different lengths.
Trends are obvious in hindsight, but ideally, we would like to spot a new trend right at its beginning, buy, spot its end, and sell However, this ideal never happens, except by luck The technical analyst always runs the risk of spotting the beginning of a trend too late and missing potential profit. The analyst who does not spot the ending of the trend holds the security past the price peak and fails to capture all the profits that were possible. On the other hand, if the analyst thinks the trend has ended before it really has and sells the security prematurely, the analyst has then lost potential profits. The technical analyst thus spends a lot of time and brainpower attempting to spot as early as possible whenatrend is beginning and ending This is the reasonfor studying charts, moving averages, oscillators, support and resistance, and all the other techniques we explore in this book.
The fact that market prices trend has been known for thousands of years Academics have disputed that
markets tendto trendbecauseif it weretrue, it wouldspoil theirtheoretical models. However, recent academic work has shown that the old financial models have many problems when applied to the behavior of real markets. In Chapter4, “The Technical Analysis Controversy,” we discuss some of the new academic findings about how market prices behave and some of the evidence against the old finance theories Academics and others traditionally have scorned technical analysis as if it were a cult; as it turns out, however, the almost religious belief intheEfficient Markets Hypothesis has becomeacult itself, withadherents unwilling to accept the enormous amount of evidence against it. In fact, technical analysis is very old, developed through practical experiencewiththetradingmarkets, andhas resultedinsomesizablefortunes forthosefollowingit.
How Does the Technical Analyst Make Money?
Several requirements are needed to convert pure technical analysis into money. The first and most important, of course, is to determine when a trend is beginning or ending The money is made by “jumping” onthetrendas early as possible. Theoretically, this sounds simple, but profitingconsistently is not so easy.
The indicators and measurements that technical analysts use to determine the trend are not crystal balls that perfectly predict the future. Under certain market conditions, these tools might not work. Also, a trend can suddenly change direction without warning. Thus, it is imperative that the technical investor be aware of risks andprotect against suchoccurrences causinglosses.
From a tactical standpoint, then, the technical investor must decide two things: First, the investor or trader must choosewhento enter aposition, and second, hemust choosewhento exit aposition Choosing whento exit a position is composed of two decisions. The investor must choose when to exit the position to capture a profit when price moves in the expected direction. The investor must also choose when to exit the position at a loss when price moves in the opposite direction from what was expected. The wise investor is aware of the risk that the trend might differ from what he expected. Making the decisionof what price level to sell and cut losses beforeevenenteringinto apositionis away inwhichtheinvestorprotects against largelosses
One of the great advantages in technical analysis, because it studies prices, is that a price point can be established at which the investor knows that something is wrong either with the analysis or the financial asset ’ s price behavior. Risk of loss can therefore be determined and quantified right at the beginning of the investment. This ability is not available to other methods of investment. Finally, because actual risk can be determined, money management principles can be applied that will lessen the chance of loss and the risk of what is calledruin
Insum, thebasicstrategy to makemoney usingtechnical methods includes
•“The trend is your friend” Play thetrend
•Don’t lose Control risk of capital loss
•Manage your money Avoidruin
Technical analysis is used to determinethetrend, whenit is changing, whenit has changed, whento enter a position, when to exit a position, and when the analysis is wrong and the position must be closed. It’s as simpleas that.
What Is a Trend?
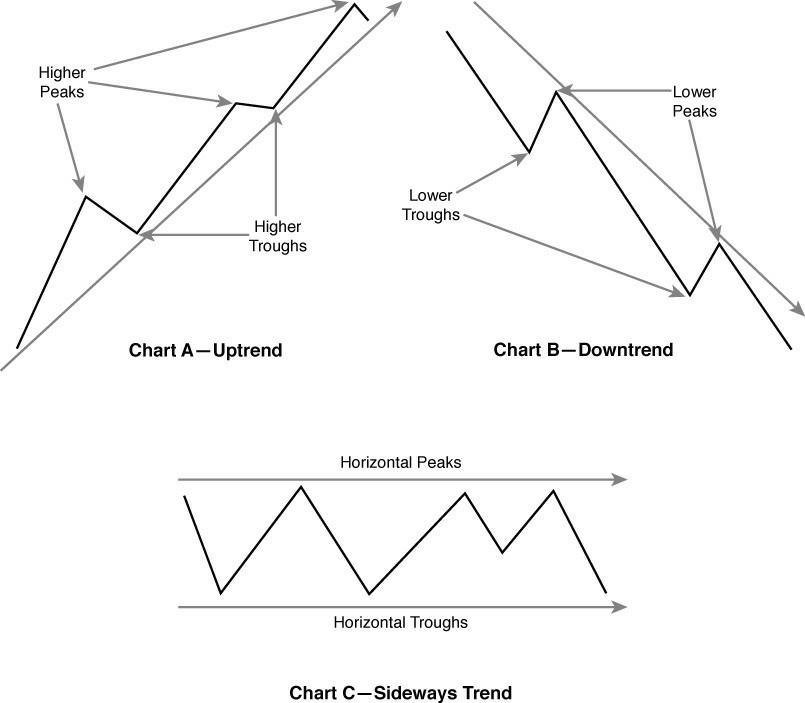
What exactly is this trend that theinvestor wants to rideto makemoney? Anupwardtrend, or uptrend, occurs when prices reach higher peaks and higher troughs. An uptrend looks something like Chart A in Figure 2.1. A downward trend, or downtrend, is the opposite: when prices reach lower troughs and lower peaks. Chart B in Figure 2.1 shows this downward trend in price. A sideways or flat trend occurs when prices trade in a range without significant underlying upward or downward movement. Chart C in Figure 2.1 is an exampleof asideways trend; prices moveupanddownbut onaverageremainat thesamelevel
FIGURE 2.1 Thetrend
Figure2 1 shows atheoretical example of anuptrend, downtrend, and sideways trend But defining atrend in the price of real-world securities is not quite that simple. Price movement does not follow a continuous, uninterrupted line. Small countertrend movements withinatrend canmake the true trend difficult to identify at times. Also, rememberthat therearetrends of differing lengths. Shorter-term trends areparts of longer-term trends.
From a technical analyst’s perspective, a trend is a directional movement of prices that remains in effect long enough to be identified and still be profitable Anything less makes technical analysis useless. If a trend is not identified until it is over, we cannot make money from it. If it is unrecognizable until too late, we cannot make money from it In retrospect, looking at a graph of prices, for