Clinical Pathology: Clinical Chemistry
Patricia A. Schenck
EVALUATION OF RENAL FUNCTION
I. Blood urea nitrogen (BUN)
A. Decreased glomerular filtration rate (GFR) results in increased BUN
B. Affected by urea production in the liver and the rate of excretion by the kidney
C. Increased dietary protein and gastrointestinal (GI) bleeding both increase BUN
II. Creatinine
A. An elevation indicates that less than 25% of the original functioning renal mass remains
B. A normal serum creatinine concentration does not exclude the possibility of renal disease
C. Young animals have lower serum creatinine concentrations than do older animals
D. Cachexia often causes lower serum creatinine concentrations
III. Serum phosphorus concentration
A. An increase in serum phosphorus is not seen until more than 85% of nephrons are nonfunctional in chronic renal diseases
B. Tubular reabsorption of phosphorus is regulated by parathyroid hormone. Renal secondary hyperparathyroidism tends to keep the serum phosphorus concentration within normal limits by excreting more phosphorus into the urine until renal disease is advanced
C. Serum phosphorus concentrations can be much higher in immature animals because of bone growth
IV. Renal clearance (estimation of GFR)
A. Endogenous creatinine clearance determination
1. Collect all urine for 12 or 24 hours (record volume), and determine serum and urine creatinine concentrations
2. Performed when renal disease is suspected but both BUN and serum creatinine concentrations are normal
B. Exogenous creatinine clearance
1. Creatinine is administered subcutaneously or intravenously (IV); then urine is collected via catheterization three times at 20-minute intervals
CHAPTER
2. Better method than endogenous creatinine clearance and approximate inulin clearance in dogs
C. Single-injection methods for estimation of GFR
1. Post-iohexol clearance
a. Give iohexol IV, and collect plasma at 2, 3, and 4 hours postiohexol
b. Plasma clearance is calculated using the area under the plasma concentration vs. time curve
2. Inulin clearance is considered the gold standard for measurement of GFR, but inulin is not easily measured and is not available at commercial laboratories
V. Urine osmolality
A. There is usually a linear relationship between urine osmolality and specific gravity
B. Urine osmolality depends on the number of osmotically active particles present in urine
C. If urine contains a large amount of larger-molecularweight solutes such as glucose, mannitol, or radiographic contrast agents, the urinary specific gravity will be disproportionately high compared with the osmolality
VI. Fractional excretion of electrolytes
A. Sodium
1. Useful in the differentiation of prerenal and primary renal azotemia
2. In animals with prerenal azotemia and volume depletion, there should be sodium conservation with a very low fractional excretion of sodium
3. In animals with primary renal disease, the fractional excretion of sodium should be higher than normal
B. Potassium
1. May be useful in the evaluation of chronic renal failure patients with hypokalemia to determine whether the kidneys are contributing to the hypokalemia
2. Varies considerably depending on diet
C. Phosphorus
1. May be useful during treatment of chronic renal failure to determine whether dietary or drug therapy is effective with a reduction in fractional excretion of phosphorus
2. Does not offer any advantage in diagnosis of chronic renal failure
VII. Urinary enzymes
A. -glutamyltransferase (GGT) is a membranebound enzyme specific for renal tubular damage
B. N-acetyl- -D-glucosaminidase (NAG)
1. Lysosomal enzyme produced by many tissues but not filtered normally
2. Increases in urinary NAG are specific for renal tubular damage
VIII. Urinalysis
A. Physical properties
1. Color
a. Normally colorless to deep amber in color (if very concentrated). Deep amber color may also be due to bile pigments
b. Red or reddish brown color is due to intact red blood cells (RBCs), hemoglobin, or myoglobin
c. Dark brown to black is most likely due to the conversion of hemoglobin to methemoglobin
d. Yellow-brown to yellow-green is due to bilirubin
e. Green color may be due to Pseudomonas infection or to oxidation of bilirubin to biliverdin
2. Appearance
a. Urine is normally clear in dogs but may be cloudy in about 20%
b. Cloudy urine usually contains increased cells, crystals, mucus, or casts
c. Horse urine is typically cloudy because of mucus
d. Rabbit urine is white and opaque because of the high concentration of calcium carbonate
3. Odor
a. The normal odor of urine is due to volatile fatty acids
b. An ammonia odor is due to release of ammonia by urease-producing bacteria
4. Urine specific gravity (USG) is the weight of urine compared to that of distilled water
a. USG estimated by dipstrip is NOT accurate. USG should be estimated by refractometry. Make sure the refractometer is temperature compensated and has different scales for different species
b. First-morning urine samples typically have the highest urinary concentration
c. Dogs or cats with any detectable dehydration should elaborate maximally concentrated urine (USG 1.040)
B. Chemical examination
1. pH
a. Measurement by pH meter is superior to dipstrip methods
b. Urine pH varies with diet and acid-base balance. Urine pH is usually acidic in carnivores and alkaline in herbivores
c. Causes of acidic urine include meat diets, administration of acidifying agents, metabolic
acidosis, respiratory acidosis, or paradoxical aciduria in metabolic alkalosis with potassium and chloride depletion
d. Causes of alkaline urine include plant-based diets, urine that has been allowed to stand open to air at room temperature, postprandial alkaline tide, urinary tract infection (UTI) by urease-positive organisms, contamination of sample with bacteria during or after collection, administration of alkalinizing agents, metabolic alkalosis, respiratory alkalosis, stress induction of respiratory alkalosis (cats), and distal renal tubular acidosis
2. Protein
a. Trace to 1 protein is normal in urine with high USG
b. Dipstick methods are more sensitive to albumin than globulins
c. False positives occur in very alkaline urine or in urine contaminated with benzylalkonium chloride
d. Renal proteinuria may result from increased glomerular filtration of protein, failure of tubular reabsorption of protein, tubular secretion of protein, protein leakage from damaged tubular cells, or renal parenchymal inflammation
e. Persistent moderate or heavy proteinuria in the absence of urine sediment abnormalities suggests glomerular disease
f. Active sediment with mild to moderate proteinuria suggests inflammatory renal disease or lower urinary tract disease
3. Glucose
a. Normally not present in dog and cat urine
b. Glucose appears in urine if plasma glucose exceeds approximately 180 mg/dL in the dog and 300 mg/dL in the cat
c. Causes of glucosuria include diabetes mellitus (most common), stress or excitement (especially in cats), chronically sick cats in the absence of hyperglycemia, renal tubular disease, administration of glucose-containing fluids, and severe urethral obstruction in some cats
4. Ketones
a. Not normally present in dog and cat urine
b. Inadequate consumption of carbohydrates or impaired utilization of carbohydrates can lead to ketone production
c. Causes of ketonuria include diabetic ketoacidosis (most common), starvation or prolonged fasting, glycogen storage disease, low carbohydrate-high fat diet, and persistent hypoglycemia (decreased insulin induces ketone formation)
5. Bilirubin
a. Only conjugated bilirubin appears in the urine. A small amount of bilirubin may normally be seen in concentrated urine samples from normal male dogs. It is not normally found in cat urine
b. Bilirubin is derived from the breakdown of heme by the reticuloendothelial system
c. Bilirubin may appear in the urine prior to the observation of hyperbilirubinemia
d. Causes of bilirubinuria include hemolysis, liver disease, extrahepatic biliary obstruction, fever, and starvation
6. Blood
a. Positive earlier than the observation of hematuria
b. Dipstick tests do not differentiate from intact RBCs or hemoglobin
c. Causes of hemoglobinuria from hemolysis include transfusion reaction, immune mediated hemolytic anemia, disseminated intravascular coagulopathy (DIC), splenic torsion, severe hypophosphatemia, heat stroke, zinc toxicity, and phosphofructokinase or pyruvate kinase deficiency
C. Urinary sediment
1. Sediment preparation
a. Perform on fresh urine samples
b. Centrifuge 5 to 10 mL of urine at 1000 to 1500 rpm for 5 minutes. Stain with Sedi-Stain
c. Number of casts is recorded per low-power field, and cells are recorded per high-power field
2. RBCs
a. Occasional RBCs are normal
b. Excessive number of RBCs is called hematuria, but origin cannot be determined
c. Lipid droplets are often confused with RBCs, especially in cats
d. Causes of hematuria include trauma, urolithiasis, neoplasia, UTIs idiopathic feline lower urinary tract disease, chemically induced cystitis, systemic diseases associated with hemorrhage, renal infarct, nephritis, nephrosis, parasites, renal pelvic hematoma, or genital tract contamination
3. White blood cells (WBCs)
a. Occasional WBCs are normal
b. Excessive WBCs in urine sediment is called pyuria and indicates inflammation somewhere in the urinary tract or contamination from the genital tract
c. Clumped WBCs are typically due to infectious organisms
d. Causes of pyuria include urinary tract inflammation or genital tract contamination
4. Epithelial cells
a. Squamous epithelial cells
(1) Large, polygonal cells with small, round nuclei
(2) Common in voided or catheterized samples
b. Transitional epithelial cells
(1) A small number is normal
(2) Increased in infection, irritation, or neoplasia
(3) Clumps or “rafts” are most common in neoplasia but may occur with inflammation
c. Renal epithelial cells
(1) Small epithelial cells from the renal tubules or pelvis
(2) Appearance in urine is never normal and is observed in patients with ischemic, nephrotoxic, or degenerative renal disease
5. Casts are cylindrical molds of the renal tubules composed of aggregated protein or cells
a. Hyaline
(1) Pure protein precipitates of TammHorsfall mucoprotein
(2) Dissolve rapidly in dilute or alkaline urine
(3) Have the least pathologic significance and may form transiently with fever, exercise, or passive congestion to the kidney
b. Cellular casts
(1) White cell casts suggest pyelonephritis but may also be caused by interstitial nephritis, nephrosis, or glomerulonephritis
(2) Red cell casts are fragile and rarely found. They may be noted in acute glomerulonephritis, renal trauma, or after violent exercise
(3) Hemoglobin casts are casts where the hemoglobin color is retained in the cast
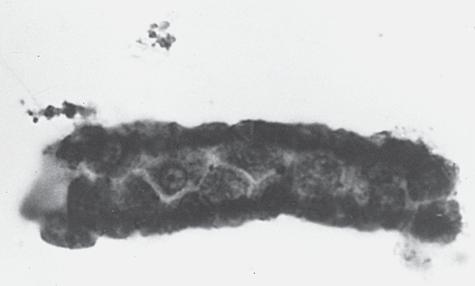
(4) Renal epithelial casts occur with severe tubular injury and suggest acute tubular necrosis or pyelonephritis (Figure 1-1)
(5) Renal fragments are a variant of epithelial casts where portions of the renal tubules slough into urine. Their appearance suggests severe renal injury
(6) Mixed casts contain multiple cell types
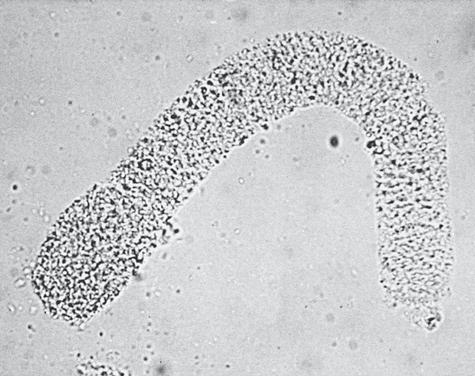
c. Granular casts (Figure 1-2)
(1) Represent the degeneration of cells or precipitation of filtered plasma proteins
(2) Fatty casts are a type of granular cast that may be seen in nephrotic syndrome or diabetes mellitus
Figure1-1 Photomicrograph of an epithelial cell cast in urine. Small renal epithelial cells can be identified in this case (white arrows). (Courtesy Nancy Facklam; from Ettinger SJ, Feldman EC. Textbook of Veterinary Internal Medicine, 6th ed. St Louis, 2005, Saunders.)
Figure1-2 Photomicrograph of a finely granular case in urine.
(From Ettinger SJ, Feldman EC. Textbook of Veterinary Internal Medicine, 6th ed. St Louis, 2005, Saunders.)
d. Waxy casts represent the final stage of degeneration of granular casts. They suggest chronic intrarenal stasis and are found in advanced chronic renal disease
e. Broad casts are wide casts that form in collecting ducts or dilated distal nephron. They suggest severe intrarenal stasis and tubular obstruction
6. Organisms
a. Normal urine is sterile
b. Large numbers of bacteria present (in association with pyuria) in urine collected by catheterization or cystocentesis strongly suggest the presence of UTI
c. The presence of bacteria without pyuria should arouse suspicion for bacterial contamination. However, dogs with hyperadrenocorticism, diabetes mellitus, or immunosuppression and cats with chronic renal disease can have bacteriuria with pyuria
d. The absence of bacteria does not rule out UTI
e. Yeast and fungal hyphae in sediment are usually contaminants
7. Crystals
a. Crystals are often an artifact of storage time and refrigeration
b. Struvite crystals are found in alkaline urine and may be found in normal animals or in those with struvite urinary stones
c. Calcium phosphate crystals are found in alkaline urine
d. Calcium carbonate crystals are found in alkaline urine
e. Amorphous phosphate crystals are found in alkaline urine
f. Ammonium biurate crystals are found in alkaline urine
g. Uric acid crystals are found in acidic urine and are associated with the Dalmatian breed
h. Urate crystals are associated with liver disease and portosystemic shunt
i. Calcium oxalate crystals are found in acidic urine
j. Cystine crystals are found in acidic urine and are associated with cystinuria
k. Bilirubin crystals may be found normally in concentrated dog urine
l. Oxalate monohydrate (“hippurate-like”) crystals are found in acute renal failure owing to ethylene glycol ingestion
8. Miscellaneous
a. Sperm is common in urine from intact males
b. Amorphous debris may be seen in those with acute intrinsic renal failure
c. Mucous threads or fibrin strands may be seen in association with lower urinary tract or genital inflammation
d. Parasite ova from Dioctophyma renale or Capillaria plica are rarely seen
e. Lipid droplets are associated with cellular degeneration
f. Foreign material may be present, especially in voided samples
g. Precipitates of urine stain may look like urinary crystals
FLUIDS AND ACID-BASE METABOLISM
I. Dehydration
A. Status
1. Total body water is about 60% of body weight; about half is extracellular and half is intracellular
2. Very mild dehydration occurs with water loss of 1% to 4% of body weight. Clinical signs are not detectable
3. Mild dehydration occurs with water loss of 5% to 6% of body weight. Clinical signs include dry mucous membranes, slight loss of skin turgor, injected conjunctiva, and inelasticity of skin
4. Moderate dehydration occurs with water loss of 7% to 9% of body weight. Clinical signs include loss of skin turgor with slow return, prolonged capillary refill time (2-3 seconds), enophthalmos
5. Severe dehydration occurs with water loss of 10% to 12% of body weight. Clinical signs include extreme loss of skin turgor, peripheral vasoconstriction, cold extremities, and prolonged capillary refill time ( 3 seconds)
6. Very severe dehydration occurs with water loss of 13% to 15% of body weight; clinical signs include vascular collapse, renal failure, and death
B. Isotonic dehydration occurs with equal losses of water and solute
1. Sodium and chloride concentrations are not affected
2. Increased packed cell volume (PCV) with increased plasma proteins
3. Occurs in some cases of diarrhea and renal disease
C. Hypertonic dehydration occurs when more water than solute is lost
1. Concentration of sodium and chloride increases
2. PCV increases, with increased plasma proteins
3. Occurs most commonly in diabetes insipidus
4. Species that produce hypotonic sweat (cattle) or little sweat (dogs, cats) develop hypertonic dehydration with heat stress
D. Hypotonic dehydration occurs when more solute than water is lost
1. Concentrations of sodium and chloride decrease
2. This results in a contraction of the extracellular fluid (ECF) volume with expansion of intracellular fluid (ICF) volume to restore osmotic equilibrium
3. Most common type of dehydration, where the solute loss induces a secondary loss of water
4. Hypotonic dehydration from heat stress occurs in species that produce hypertonic sweat (horses)
II. Acid-base metabolism
A. Henderson-Hasselbach equation
1. pH pKa log [A-]/[HA]
2. The carbonic acid-bicarbonate system is usually used: pH pKa log [HCO3-]/[H2CO3]
3. pH 6.1 log[HCO3-]/0.03(PCO2)
B. To characterize acid-base disorders, blood pH, HCO3, and PCO2 are measured (Table 1-1)
1. A decrease in pH is acidosis; an increase is alkalosis
2. A decrease in HCO3 is a metabolic acidosis; an increase is a metabolic alkalosis
3. A decrease in PCO2 is a respiratory alkalosis; an increase is a respiratory acidosis
4. If HCO3 measurement is unavailable, total CO2 from a chemistry profile can be used as an estimate. Total CO2 is about 1 to 2 mmol/L greater than the HCO3 concentration
C. Metabolic disorders
1. Characterized by changes in HCO3
2. Compensation is via rapid changes in ventilation to alter PCO2
D. Respiratory disorders
1. Characterized by changes in PCO2
2. Compensation is via a change in urinary acidification to alter HCO3. This process is slower than compensation in ventilation
E. Simple acid-base disorders occur when there is a primary change, but no compensation has taken place
F. Compensated acid-base disorders occur when primary changes are present, along with evidence of a compensatory change in the complementary system. The pH rarely returns to normal with compensation
G. Combined acid-base disorders occur when there are changes in the same direction in both systems
H. Metabolic acidosis
1. Primary change is decreased HCO3
2. PCO2 will decrease in compensation
I. Metabolic alkalosis
1. Primary change is increased HCO3
2. PCO2 will increase in compensation
J. Respiratory acidosis
1. Primary change is increased PCO2
2. HCO3 will increase in compensation
3. There is a larger compensation in chronic respiratory acidosis compared with an acute event
K. Respiratory alkalosis
1. Primary change is decreased
2. PCO2
3. HCO3 will decrease in compensation
4. There is a larger compensation in chronic respiratory alkalosis compared with an acute event
L. Base excess and base deficit
1. Calculated from blood gas parameters by the blood gas analyzer. This calculation is based on human relationships and is probably valid for dogs and cats. This calculation might not be valid for other species
2. Increased values reflect a base excess corresponding to metabolic alkalosis
3. Decreased values reflect a base deficit, corresponding to metabolic acidosis
M. Anion gap
1. Anion gap (Na K) – (Cl HCO3); the objective is to estimate changes in the unmeasured anions and cations without having to measure them
a. Unmeasured anions include sulfate, lactate, phosphate, pyruvate, albumin, and ketoacids
b. Unmeasured cations include primarily calcium and magnesium
2. If the anion gap increases, then unmeasured anions have increased. If the anion gap decreases, then unmeasured cations have increased
III. Osmolality
A. Osmolality is the concentration or number of osmotically active particles in an aqueous solution
B. Osmolal gap is the difference between the actual measured serum osmolality and the calculated estimate of osmolality
Table 1-1 Characteristics of Primary Acid-Base Disturbances
1. Calculated osmolality (mOsm/L) 1.86 [Na (mmol/L)] [glucose (mg/dL)/18] [BUN (mg/dL)/2.8] 9
2. The osmolal gap increases when there is an increase in any osmotically active particles that are not included in the calculated equation
3. The osmolal gap will increase whenever the anion gap is increased
4. Used commonly in cases of ethylene glycol toxicity
a. Ethylene glycol is a small osmotically active particle
b. The osmolal gap correlates well with the concentration of ethylene glycol in serum
ELECTROLYTE METABOLISM
I. Sodium
A. Roles
1. Principal cation in ECF
2. Important in movement of fluids across epithelial surfaces
B. Hyponatremia
1. Pseudohyponatremia
a. Occurs with hyperlipidemia or hyperproteinemia
b. Plasma sample is diluted by the excess lipid or protein and thus the measured sodium concentration is falsely lowered
2. Hyperosmolal, hypervolemic conditions include hyperglycemia and mannitol administration
3. Hypoosmolal hypervolemic conditions
a. Occurs when there is excess water retention with dilution of the plasma
b. Causes include nephrotic syndrome, chronic liver disease, chronic renal failure, and congestive heart failure
4. Hypoosmolal euvolemic conditions include hypotonic fluid infusion,antidiuretic hormone (ADH) administration, inappropriate secretion of ADH, and psychogenic polydipsia
5. Hypoosmolal hypovolemic conditions include the following:
a. Dietary deficiency of sodium
b. GI loss from vomiting or diarrhea
c. Third-space syndrome (GI obstruction, peritonitis, uroabdomen, ascites)
d. Urinary loss from hypoadrenocorticism, nonoliguric acute renal failure, diuretics, and Fanconi syndrome
e. Cutaneous losses (burns)
C. Hypernatremia
1. Pure water deficits occur in dietary deficiency, central or nephrogenic diabetes insipidus, primary hypodipsia, heat stress, and fever
2. Hypotonic fluid loss occurs with the following:
a. GI loss owing to vomiting or diarrhea
b. Third-space syndrome (peritonitis, ascites)
c. Urinary loss from osmotic diuretics (mannitol, diabetes mellitus), chronic renal failure, nonoliguric acute renal failure, postobstructive nephropathy
d. Cutaneous loss (burns)
3. Solute gain occurs with salt poisoning, hypertonic fluid administration, hyperadrenocorticism, hyperaldosteronism
II. Chloride
A. Roles
1. Principal anion in ECF
2. Chloride usually accompanies sodium to maintain neutrality
3. Normal fractional excretion is less than 1% but may be elevated in large animals fed a diet higher in chlorine
B. The same conditions causing hypernatremia and hyponatremia also cause hyperchloremia and hypochloremia
III. Potassium
A. Roles
1. Principal cation of the ICF
2. Determines resting cell membrane potential
B. Hypokalemia (typically associated with alkalosis)
1. Decreased intake
a. Anorexia
b. Dietary deficiency
c. Administration of potassium-free fluids
2. Translocation between ECF and ICF
a. Metabolic alkalosis, respiratory alkalosis
b. Glucose or insulin administration
c. Catecholamines
3. Increased loss
a. GI loss
(1) Vomiting
(2) Diarrhea
b. Third-space syndrome
(1) GI obstruction (especially displaced abomasum)
(2) Peritonitis
(3) Ascites
c. Urinary loss
(1) Hyperadrenocorticism
(2) Acute renal failure (nonoliguric)
(3) Postobstructive diuresis
(4) Chronic renal failure (cats)
(5) Potassium-losing diuretics
(6) Fanconi syndrome
(7) Renal tubular acidosis
(8) Primary hyperaldosteronism
d. Cutaneous loss (burns)
4. Feline kaliopenic nephropathy-polymyopathy syndrome
a. Characterized by hypokalemia, increased fractional excretion of potassium, azotemia, and metabolic acidosis
b. Chronic decrease of potassium leads to decrease in aldosterone, which leads to distal renal tubular acidosis
C. Hyperkalemia (typically associated with acidosis)
1. Pseudohyperkalemia (in vitro translocation of potassium to plasma)
a. Thrombocytosis
b. Leukemia
c. Hemolysis (equine, bovids)
d. Akita dogs
2. Increased intake or oversupplementation of fluids with potassium
3. Translocation between ICF and ECF
a. Respiratory or metabolic acidosis
b. Hyperkalemic periodic paralysis
c. Ischemia or reperfusion injury
4. Decreased urinary excretion
a. Anuric or oliguric renal failure
b. Urinary tract obstruction
c. Ruptured urinary bladder
d. Hypoadrenocorticism
e. Potassium-sparing diuretics
f. Nonsteroidal antiinflammatory drugs (NSAIDs)
g. Angiotensin-converting enzyme (ACE) inhibitors
IV. Phosphorus
A. Roles
1. Found mostly in ICF
2. Regulated through interactions with calcium and calcium metabolic hormones
a. Calcitriol increases phosphorus resorption from bone, increases GI phosphorus absorption, and increases urinary fractional excretion of phosphorus
b. The concentrations of calcium and phosphorus are reciprocally related and are kept relatively constant
B. Hypophosphatemia
1. Increased cellular uptake of phosphorus (glucose administration)
2. Acid-base balance
a. Respiratory alkalosis
b. Metabolic acidosis (enhanced urinary excretion of phosphates); often in diabetic ketoacidosis
3. Abnormalities in renal tubular phosphate reabsorption
a. Hyperparathyroidism
b. Fanconi syndrome
c. Aminoglycoside nephrotoxicosis
4. GI absorption
a. Decreased phosphorus in diet
b. Vomiting
c. Diarrhea
d. Intestinal malabsorption syndromes
e. Excessive ingestion of phosphate binders
C. Hyperphosphatemia
1. Redistribution between ICF and ECF
2. Cellular damage
3. Acute acidosis (chronic metabolic acidosis causes hypophosphatemia usually)
4. Decreased renal blood flow and GFR (resulting in secondary hyperparathyroidism)
5. Ruptured urinary bladder
6. Hypertonic sodium phosphate enemas
7. Excessive dietary intake (with secondary hyperparathyroidism)
V. Magnesium
A. Roles
1. Magnesium is an important cofactor for many enzymatic reactions
2. Influences cell membrane properties
B. Hypomagnesemia
1. Most often occurs after excessive magnesium loss
a. GI tract (malabsorption syndromes, diarrhea)
b. Renal loss (fluid diuresis, diuretic therapy, renal disease)
2. Iatrogenic deficiency occurs during fluid therapy as most fluids contain little or no magnesium
3. Metabolic disorders (diabetes mellitus, primary hyperparathyroidism, primary hypoparathyroidism, hyperaldosteronism, third-space syndrome, hypophosphatemia)
4. Ruminants
a. Milk tetany, in which calves are fed a magnesium-deficient milk diet
b. Grass tetany, which occurs in adults fed on lush, green pasture that is high in potassium, which blocks magnesium absorption from the rumen
C. Hypermagnesemia
1. Renal disease (both acute and chronic)
2. Increased renal tubular reabsorption of magnesium during dehydration, salt depletion, and hypoadrenocorticism
3. Overadministration of magnesium-containing antacids
VI. Calcium
A. Roles
1. Major structural role in the skeleton
2. Important in regulation of ions across membranes
3. Cofactor in many metabolic processes
4. Major role in signal transmission, skeletal muscle contraction, and cardiovascular function
B. Measurement of calcium
1. Ionized calcium should be measured for an accurate assessment of calcium status
2. Adjustment formulas for total calcium should not be used because they do not reliably predict ionized calcium concentration
3. Acidosis increases ionized calcium concentration, and alkalosis decreases ionized calcium concentration
C. Hypocalcemia
1. Primary hypoparathyroidism is characterized by hypocalcemia with a low or low-normal concentration of parathyroid hormone (an inappropriate response). Hypomagnesemia may also be seen. Primary hypoparathyroidism can be spontaneously occurring; result from parathyroiditis or parathyroid adenoma infarction; or occur postoperatively after removal of a parathyroid adenoma or any other neck surgery that can interrupt the blood supply to the parathyroid glands
2. Common causes of hypocalcemia include hypoalbuminemia, chronic renal failure (ionized hypocalcemia), eclampsia, acute renal failure, acute pancreatitis, and urethral obstruction in cats
3. Occasional causes of hypocalcemia include soft tissue trauma, rhabdomyolysis, ethylene glycol poisoning, phosphate enemas, post bicarbonate administration, and critical illness or sepsis
4. Uncommon causes of hypocalcemia include EDTA contamination, dilution with calcium-free IV fluids, intestinal malabsorption, hypovitaminosis D, pancreatitis, citrated blood transfusions, hypomagnesemia, and tumor lysis syndrome
D. Hypercalcemia
1. Neoplasia is the most common cause of ionized hypercalcemia in dogs. Neoplasia is characterized by an elevation of both total and ionized calcium, with parathyroid hormone suppressed into the lower part of or below the reference range (a parathyroid- independent hypercalcemia)
a. In dogs, the most common neoplasm causing hypercalcemia is lymphoma. Other neoplasms include anal sac apocrine gland adenocarcinoma, thymoma, carcinomas (lung, pancreas, mammary gland, skin, nasal cavity, thyroid, adrenal medulla), and hematologic malignancies (multiple myeloma, lymphoma, myeloproliferative disease, leukemia)
b. In cats, the most common neoplasias are lymphoma and squamous cell carcinomas. Other neoplasms include multiple myeloma, leukemia, osteosarcoma, fibrosarcoma, and bronchogenic carcinoma
2. Idiopathic hypercalcemia is the most common cause of ionized hypercalcemia in cats. Idiopathic hypercalcemia is also a parathyroid independent hypercalcemia
3. Renal disease is a common cause of an elevation of serum total calcium but not ionized calcium. With renal disease, serum ionized calcium concentration is typically normal to low
4. Vitamin D toxicity from oversupplementation with vitamin D, ingestion of plants containing calcitriol glycosides (Cestrum diurnum), ingestion of cholecalciferol rodenticides, or ingestion of antipsoriasis cream (Dovonex). Vitamin D toxicity is a parathyroid-independent hypercalcemia, and an elevation in phosphorus is typically observed
5. Primary hyperparathyroidism causes an elevation of both serum total and ionized calcium with lack of suppression of parathyroid hormone production. Parathyroid hormone concentration may be still within normal limits, or it may be elevated
6. Other causes of hypercalcemia include hypoadrenocorticism, osteolytic processes, granulomatous disease, grape or raisin toxicity, dehydration, vitamin A toxicity, aluminum toxicity, excessive calcium carbonate supplementation, intestinal phosphate binders, thiazide diuretics, acromegaly, or severe hypothermia
EVALUATION OF THE LIVER
I. Enzymes in the liver
A. Leakage enzymes: alanine aminotransferase (ALT), aspartate aminotransferase (AST), sorbitol dehydrogenase (SDH), and glutamate dehydrogenase (GLDH)
B. Induced enzymes: alkaline phosphatase (ALP), GGT
II. Tests for hepatocyte injury
A. Alanine aminotransferase (ALT)
1. Previously called serum pyruvic transaminase (SGPT)
2. Not liver specific; leakage enzyme
3. In dogs and cats, ALT is present mostly in hepatocytes, but increases can be seen with muscle injury (especially extensive injury)
4. Horses and ruminants have little ALT in hepatocytes, so elevations of ALT usually indicate muscle damage
B. Aspartate aminotransferase (AST)
1. Previously called serum glutamic oxaloacetic transaminase (SGOT)
2. Present in hepatocytes and in skeletal and cardiac muscle cells
3. Not liver specific; leakage enzyme
4. Increased AST can be due to hepatocyte death, hepatocyte injury, muscle cell death and muscle cell injury
5. Not as specific in the dog and cat as ALT; more specific than ALT in horses and ruminants
C. Sorbitol dehydrogenase (SDH)
1. Liver specific; leakage enzyme
2. Increase suggests hepatocyte death or injury
3. Very short half-life, and values return to normal within a few days
4. Not very stable in serum samples; stable for about 48 hours if frozen
5. In horses and ruminants, SDH is preferable to AST for detecting injury to hepatocytes
D. Glutamate dehydrogenase (GLDH)
1. Liver specific; leakage enzyme
2. Increase suggests hepatocyte death or injury
3. More stable than SDH but still not very stable
III. Tests for cholestasis
A. ALP is an induced enzyme
1. Bone origin (BALP)
a. Mild increase associated with increased osteoblast activity
b. Will be higher in young growing animals
c. May be elevated in association with primary or secondary hyperparathyroidism (effects of PTH on bone)
2. Liver origin (LALP)
a. An increase is associated with cholestasis
b. LALP usually increases before an increase in bilirubin with cholestasis
3. Corticosteroid-induced (CiALP)
a. Induced by corticosteroids and also anticonvulsants
b. Chronic disease (including chronic cholestasis) can induce CiALP
4. In cats, the half-life of ALP is very short (about 6 hours); thus the increase of ALP in cholestatic disease is significantly less than in other species
5. Increases in horses with cholestasis are not well documented
6. In ruminants, increases in ALP are usually due to cholestasis or osteoblastic activity
B. GGT
1. Considered to be an induced enzyme; however, acute injury can cause elevations of GGT
2. Elevated primarily in cholestasis. May also be induced by glucocorticoids and anticonvulsants
3. GGT is superior to ALP in horses and ruminants for the detection of cholestasis
4. GGT is present in very high levels in cattle and sheep colostrums, resulting in very high levels of serum GGT in calves and sheep that have consumed colostrum
IV. Tests of liver function
A. Bilirubin
1. Normal metabolism
a. The heme portion of hemoglobin is split into iron and protoporphyrin
b. Protoporphyrin is converted to biliverdin, then to bilirubin
c. Bilirubin is released from macrophages, attached to albumin or other globulins, transported to the liver, released from albumin or globulins, and enters hepatocytes. This circulating bilirubin is termed unconjugated’
or indirect. Most bilirubin in horses is unconjugated
d. Once in hepatocytes, bilirubin is conjugated, and most is secreted into bile. A small amount passes through the sinusoidal side back into the blood. Conjugated bilirubin is also termed direct bilirubin
2. Abnormal metabolism
a. Historically, both unconjugated and conjugated bilirubin have been measured, but currently a total bilirubin measurement is usually determined
b. Bilirubin is increased when there is increased hemoglobin production (increased RBC destruction), decreased uptake and conjugation of bilirubin by hepatocytes, and a decrease in outflow of conjugated bilirubin (cholestasis, etc.)
c. Bilirubin is not consistently elevated in ruminants with liver disease
B. Bile acids
1. Fasting and postprandial samples are usually collected in dogs and cats
2. The postprandial bile acid concentration is usually greatly exaggerated with portosystemic shunt
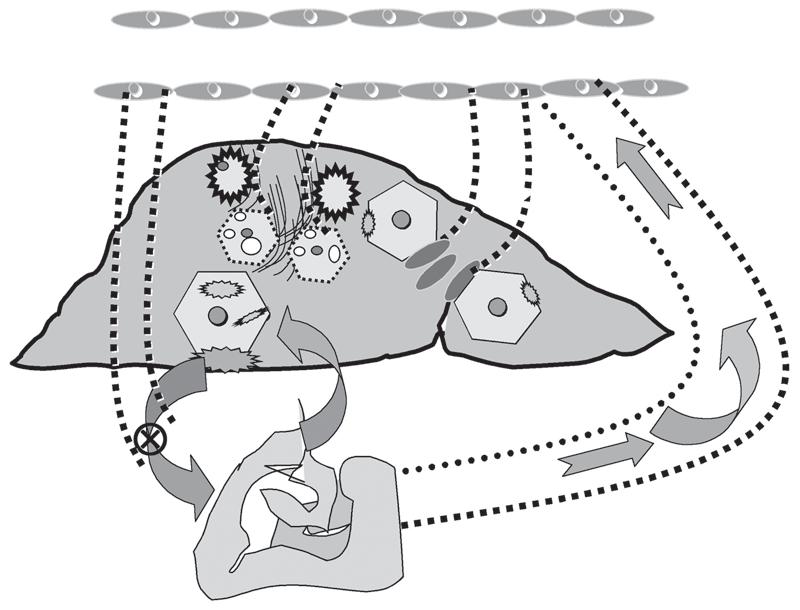
3. Increases in fasting, postprandial, or both samples may occur with portosystemic shunts, cholestasis, cirrhosis, necrosis, hepatitis, hepatic lipidosis, steroid hepatopathy, and neoplasia (Figure 1-3)
4. One sample is collected in horses and ruminants. An increase in bile acids suggests hepatic disease
C. Ammonia concentration is usually increased in those with portosystemic shunts or if more than 60% of liver mass is lost
D. Albumin decreases when 60% to 80% of liver function is lost
E. Globulins may be increased, especially in horses
F. Glucose
1. The liver converts glucose to glycogen
2. Glucose may be increased if there is decreased glucose uptake by the liver
3. Glucose may be decreased if there is decreased gluconeogenesis or glycogenolysis
G. Urea is synthesized in the liver from ammonia
1. BUN decreases with liver failure
2. Blood ammonia concentration increases with liver failure
H. Cholesterol
1. Can be decreased if there is decreased synthesis of cholesterol with liver failure
2. Can be increased if cholestasis is present, which prevents excretion of cholesterol in bile
I. Coagulation factors are commonly decreased in dogs with liver failure
V. Changes in selected liver diseases
A. Portosystemic shunt
1. If portosystemic shunts occur because of severe cirrhosis, then changes as seen in endstage liver disease are expected
2. Early portosystemic shunts do not cause much active hepatocyte damage; thus leakage enzymes are usually not elevated
a. Induced enzymes are also not elevated because there is little cholestasis
b. Typically occurs in young, growing animals, so ALP may be elevated (BALP)
c. Bile acids are markedly elevated
d. Microcytic anemia with low iron concentration is typical
B. Hepatic necrosis
1. If focal, leakage enzymes may be normal or mildly elevated
2. Diffuse necrosis more often results in elevations in both leakage and induced enzymes.
C. Hypoxia or mild toxic damage
1. This process is diffuse, so leakage enzymes are usually mildly to moderately elevated
2. Induced enzymes and bilirubin are not typically elevated
3. Bile acids may be mildly increased
D. Focal lesions
1. Leakage enzymes may be normal to mildly increased
2. Induced enzymes are usually normal unless bile flow is significantly impaired
E. Hepatic lipidosis
1. Leakage enzymes are increased in most cats
2. ALP is also elevated in most, but GGT is elevated in only a small number
3. Serum bilirubin is usually elevated, and bile acids are commonly increased
F. Steroid hepatopathy
1. Most common in dogs
2. Leakage enzymes are mildly increased
3. Induced enzymes are markedly increased
4. Bilirubin may be mildly increased
G. Biliary disorders
1. Induced enzymes are markedly increased
2. Leakage enzymes may be mildly increased as a result of hepatocyte injury from the cholestasis
3. Bilirubin and bile acids are also typically increased
H. Chronic liver disease
1. Leakage enzymes may be increased, depending on the extent and rate of progression of the disease
2. Induced enzymes are usually mildly to moderately increased
3. Bilirubin concentration is normal to mildly increased in those with more advanced disease
I. End-stage liver disease
1. Occurs when 60% to 80% of liver mass has been lost
2. Leakage enzymes may be normal to mildly increased because of the overall loss of liver mass
3. Induced enzymes are moderately to markedly increased, as are bilirubin and bile acid concentrations
4. Many have increased ammonia, decreased BUN, decreased albumin, and abnormal coagulation tests
EVALUATION OF THE PANCREAS
I. Pancreatic injury
A. Serum amylase
1. Dogs
a. Highest concentrations in pancreas and small intestinal mucosa
b. Causes of increased serum amylase include pancreatic injury, renal dysfunction, GI disease, hepatic disease, and neoplasia (lymphoma, hemangiosarcoma)
c. Magnitude of the increase may be helpful. If amylase is elevated more than three-fold greater than the upper reference range limit, pancreatic injury is strongly suggested
2. Other species
a. Amylase is usually normal in cats with pancreatic injury and may be decreased
b. Amylase is only slightly elevated in horses with pancreatic injury and is elevated in most horses with proximal enteritis and other causes of colic
B. Serum lipase
1. Dogs
a. Causes of increased serum lipase include pancreatic injury, renal dysfunction, hepatic disease, GI disease, corticosteroids (dexamethasone can increase lipase five-fold), and neoplasia (lymphoma, hemangiosarcoma)
b. An elevation greater than two-fold is suggestive of pancreatic injury, except if the dog has received corticosteroids
2. Cats with pancreatic injury typically have normal lipase activity
C. Peritoneal fluid
1. If amylase or lipase activity is higher in peritoneal fluid than in serum, pancreatic injury is more likely
2. Consider measuring in cats or horses with suspected pancreatic injury
D. Serum trypsin-like immunoreactivity (TLI)
1. TLI activity is proportional to trypsinogen and trypsin. Trypsinogen is secreted only by the pancreas and is converted to trypsin in the small intestine
2. TLI is increased in pancreatitis and is a more sensitive indicator of early pancreatitis than are amylase or lipase determination
3. TLI is also a sensitive and specific indicator for pancreatitis in the cat
II. Exocrine pancreatic insufficiency (see section below on intestinal absorption)
EVALUATION OF DIGESTION AND INTESTINAL ABSORPTION
I. Fecal parasites
A. Refrigerate fecal sample if cannot examine within 2 hours
B. Direct smears are useful in detecting Strongyloides, Coccidia, Giardia, Balantidium, Entamoeba, and Trichomonas spp.
C. Wet mounts are useful to detect Giardia, Balantidium, and Entamoeba spp.
D. Fecal flotation
1. Best method for detecting parasitic ova and oocysts
2. Different fecal flotation solutions can be used, including a sugar solution, sodium chloride, magnesium sulfate, zinc sulfate, or sodium nitrate solutions
E. Baermann technique is most useful for detection of larvae in feces.
II. Fecal occult blood
A. Performed in animals with chronic diarrhea or loose stools, microcytic anemia, a history of GI tumors, or in those treated with NSAIDs
B. Positive test result suggests upper GI tract inflammation, ulceration, or neoplasia
C. False positives may occur when consuming meats or some vegetables. It is best to restrict the diet (rice and cottage cheese) for a few days before the test
III. Fecal cytology
A. Look for types of bacteria present
B. Evaluate for presence of inflammatory cells
IV. Digestion and absorption tests
A. Fecal starch
1. Stain feces with Lugol solution
2. The presence of undigested starch suggests a deficiency in starch-digesting enzymes or increased intestinal motility
3. Dependent on the quantity of starch in the diet
B. Fecal fat
1. Direct fecal fat detects undigested fat
a. Stain feces with Sudan III or IV on slide and examine
b. The presence of undigested fecal fat indicates a deficiency in lipase
2. Indirect fecal fat detects digested fat
a. Mix feces, acetic acid, and Sudan III or IV on a slide; bring to a boil and examine
b. The presence of digested fat (in the absence of undigested fat) suggests adequate lipase production but inadequate absorption of fat
C. Fecal proteolytic activity can be estimated but is rarely performed anymore since the advent of serum TLI determination
D. Fecal muscle fibers
1. Stain brown with Lugol stain
2. Presence suggests inadequate fecal protease activity
E. Fat absorption test (plasma turbidity test)
1. After a 12-hour fast, orally administer corn oil, then collect hourly plasma samples for a few hours
2. Turbidity of the samples should occur, indicating the absorption of lipid
3. If turbidity does not occur, then repeat test with corn oil that has been preincubated with pancreatic enzymes. If turbidity occurs, then absorption occurred and the problem is with digestion of fat
4. The sensitivity of this test is poor
F. Serum TLI
1. Available for dogs and cats
2. TLI is decreased in dogs and cats with EPI. It is normal in other small intestinal diseases
G. D-Xylose absorption test
1. Measure of intestinal absorption in dogs and horses
2. Xylose absorption is falsely decreased in those with delayed gastric emptying, bacterial overgrowth, and in some with exocrine pancreatic insufficiency (EPI)
H. Vitamin B12 and folate assays
1. Serum folate is decreased if there is malabsorption in the proximal small intestine
2. Serum vitamin B12 is decreased if the malabsorption is primarily in the distal small intestine
3. In cats with EPI, both serum vitamin B12 and folate levels are usually decreased. In dogs with EPI, serum vitamin B12 is usually decreased, and folate is usually normal to increased
4. In small intestinal bacterial overgrowth, vitamin B12 is decreased and folate is increased
EVALUATION OF SERUM AND PLASMA PROTEINS
I. Plasma versus serum
A. Plasma contains albumin, and all globulins, which include antibodies, clotting factors, enzymes, and proteins
B. Serum contains no fibrinogen and only contains albumin and remaining globulins
II. Total protein concentration
A. Can be measured with a refractometer. Excess lipid, hemoglobin, bilirubin, glucose, urea, sodium, or chloride can falsely increase total protein concentration as measured by refractometry
B. Spectrophotometric measurement is more accurate
III. Albumin concentration
A. Measured spectrophotometrically
B. At very low concentrations, albumin may be overestimated
IV. Globulin concentrations
A. Fractions
1. The -fraction includes thyroxine-binding globulin, transcortin, some lipoproteins (LPs), ceruloplasmin, haptoglobin, antithrombin III, and 2-macroglobulin
2. The fraction includes some LPs, transferrin, ferritin, C-reactive protein, complement C3 and C4, plasminogen, and fibrinogen (in plasma only)
3. The -fraction includes the immunoglobulins
B. Measurement
1. The globulin concentration reported on a chemistry profile is calculated by subtracting serum albumin from total protein concentration
2. Accurate measurement is determined by serum protein electrophoresis
3. Estimation of immunoglobulins
a. Refractometry
(1) Not reliable in foals
(2) Cutoff value for plasma protein concentration that indicates adequate passive transfer
(3) Dehydration can falsely elevate plasma protein concentration
b. Sodium sulfite precipitation test
(1) Determines three general ranges for immunoglobulin quantities in calves
(2) Not reliable for foals
c. Zinc sulfate turbidity test
(1) Can be used in both calves and foals
(2) Better tests available
d. Glutaraldehyde coagulation test
(1) Used in calves and foals
(2) Use serum
V. Fibrinogen concentration
A. Most common method is by heat precipitation
B. Can also measure in citrated blood (expensive, not routinely used)
VI. Abnormal concentrations
A. Decreased protein concentrations
1. Hypoalbuminemia with hypoglobulinemia. Causes include blood loss, protein-losing enteropathy, severe exudative skin disease, severe burns, and effusive disease
2. Hypoalbuminemia with normal or increased globulins. Causes include starvation, liver disease, GI parasites, intestinal malabsorption,
exocrine pancreatic insufficiency, and glomerular disease (loss of albumin)
3. Hypoglobulinemia with normal or increased albumin. Causes include failure of passive transfer, and immune deficiencies (inherited or acquired)
B. Increased protein concentrations
1. Hyperalbuminemia occurs only in dehydration
2. Hyperalbuminemia with hyperglobulinemia occurs in dehydration
3. Hyperglobulinemia
a. Increased -globulin concentration occurs most commonly in acute inflammation
b. Increased -globulin concentration occurs in acute inflammation, nephrotic syndrome, liver disease, and immune responses
c. Increased -globulin concentration (gammopathies)
(1) Polyclonal gammopathies are present with chronic antigenic stimulation, immune-mediated disease, liver disease, lymphoma, and lymphocytic leukemia
(2) Monoclonal gammopathies are present with multiple myeloma, extramedullary plasmacytoma, lymphoma, lymphocytic leukemia, chronic pyoderma, plasmacytic enterocolitis, canine ehrlichiosis, visceral leishmaniasis (dog), lymphoplasmacytic stomatitis (cats), and idiopathic monoclonal gammopathy
C. Hyperfibrinogenemia occurs in dehydration, inflammation, renal disease, disseminated neoplasia, and during terminal pregnancy in cattle
DETECTION OF MUSCLE
INJURY
(Figure 1-4)
I. Creatine kinase (CK)
A. Also referred to as creatine phosphokinase
B. Located in the cytoplasm of skeletal muscle, cardiac muscle, and smooth muscle.
1. Considered to be a muscle-specific enzyme even though it is also found in the brain and nerves
2. Increased CK activity has not been observed in injury to the central nervous system
C. May be falsely elevated with hemolysis, hyperbilirubinemia, and muscle fluid contamination of a blood sample during difficult venipuncture
D. Increased CK is caused by skeletal muscle injury, cardiac muscle injury, or with muscle catabolism (especially in cats)
E. The magnitude of the increase in CK does not correlate to the severity of the injury
F. Serum CK rapidly increases after injury and rapidly decreases when the injury ceases (normal within 24 to 48 hours)
II.
Aspartate aminotransferase (AST)
A. Previously known as serum glutamic oxaloacetic transaminase (SGOT)
B. Present in cytoplasm and organelles of hepatocytes, skeletal muscle, and cardiac muscle
Dog and Cat
↑ ALT greater than ↑ AST; no ↑ CK → liver injury
↑ AST greater than ↑ ALT; ↑ CK → skeletal muscle injury
Horse and Ruminant
↑ AST; no ↑ CK → liver injury
↑ AST and ↑ CK → skeletal muscle injury or concomitant skeletal muscle injury and liver injury
Approximate time (days) following severe skeletal muscle injury with resolution
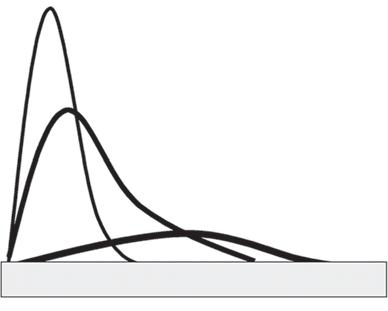
Figure1-4 The approximated magnitude and duration of increase in CK, AST, and ALT levels in the circulation after severe injury to the skeletal muscle in all domestic species are illustrated. In dogs and cats, the relative magnitude of ALT, AST and CK levels help differentiate predominantly liver or skeletal muscle injury. In horses and ruminants, a rise in the AST level with or without a notable change in the CK level is compatible with liver injury.
The AST and CK levels are increased in horses and ruminants with skeletal muscle injury alone or with concomitant liver injury. The latter is indicated by an increase in the sorbitol dehydrogenase or GLD levels. ALT, Alanine aminotransferase; AST, aspartate aminotransferase; CK, creatine kinase.
(From Meyer D, Harvey JW. Veterinary Laboratory Medicine: Interpretation and Diagnosis, 3rd ed. St Louis, 2004, Saunders.)
C. Increases more slowly than CK with injury and persists in the serum longer
D. Useful in combination with CK to determine when muscle damage has occurred.
III. ALT
A. Previously known as SGPT
B. Some elevation may be seen in dogs and cats with muscle injury and no hepatic damage
C. Small amounts of activity in skeletal and cardiac muscle but can contribute to elevated ALT because the muscle mass is large
IV. Lactate dehydrogenase (LDH)
A. Located in the cytoplasm in most cells and thus is nonspecific for muscle
B. Five isoenzymes exist, and analysis of isoenzymes may be more beneficial
V. Myoglobin
A. Released from dead muscle cells into the blood (myoglobinemia) and excreted into the urine (myoglobinuria)
B. Myoglobinuria results in a dark brown to redbrown coloration of the urine
C. Myoglobin is rapidly excreted by the kidneys and thus serum remains colorless to yellow 1. If urine is positive for hemoglobin on a dipstick and serum is colorless to yellow, then myoglobinuria is probably present
2. If urine is positive for hemoglobin on a dipstick and serum is red, then hemoglobinuria is probably present
D. Addition of ammonium sulfate to produce an 80% concentration in urine will cause hemoglobin to precipitate. The resultant supernatant will test negative for hemoglobin because the hemoglobin has precipitated. If myoglobinuria is present, the supernatant will continue to test positive for hemoglobin with dipstrip
EVALUATION OF LIPIDS
I. Lipid metabolism
A. Triglyceride
1. Triglycerides are composed of a glycerol backbone to which three fatty acids (of varying length and characteristics) are attached
2. When ingested, triglycerides are broken down to monoglycerides and free fatty acids for absorption by the intestinal mucosal cells. Absorption requires bile acids and micelle formation. Once in the intestinal mucosal cells, triglycerides are formed from the absorbed monoglycerides and free fatty acids
3. Hypertriglyceridemia normally occurs in the postprandial state. Increases in serum triglyceride concentrations are also noted in some primary lipid disorders and in secondary lipid disorders such as pancreatitis, hypothyroidism, diabetes mellitus, nephrotic syndrome, hyperadrenocorticism, and cholestasis
4. Hypercholesterolemia may falsely decrease serum triglyceride measurement
B. Cholesterol
1. Present only in animal tissues
2. Can be produced in almost any tissue in the body, but the major sites of cholesterol synthesis are the liver and small intestine
3. Absorbed by the small intestine; absorption requires bile acids and micelle formation
4. Hypercholesterolemia is noted in primary lipid disorders and also in association with hypothyroidism, diabetes mellitus, nephrotic syndrome, pancreatitis, hyperadrenocorticism, and cholestasis. Cholesterol is elevated normally in the postprandial period
5. Hypertriglyceridemia and hyperbilirubinemia may falsely lower the serum cholesterol concentration
C. LPs are conglomerates of various apoproteins, cholesterol, triglyceride, and phospholipids
1. Metabolism
a. LPs are classified according to their density as chylomicrons: very-low-density lipoproteins (VLDLs), intermediate-density lipoproteins (IDLs), and high-density lipoproteins (HDLs)
b. Chylomicrons are formed primarily by the small intestine and are composed of high quantities of triglyceride, with low
amounts of protein. They are the least dense of the LPs and will ‘float’ in a serum sample that contains excess chylomicrons (hyperchylomicronemia). Chylomicrons are normally cleared rapidly by the liver after a meal. Lipoprotein lipase is required for proper chylomicron metabolism
c. VLDLs are formed by the liver; they are smaller than chylomicrons and have a higher content of protein and lower triglyceride level. They are heavier than chylomicrons. Once in the circulation, exchanges of proteins and constituents occur between LPs, and IDLs are formed. IDL is rapidly converted to LDL. Lipoprotein lipase activity is required
d. LDLs are heavier and smaller than VLDLs and have a higher protein content and a lower triglyceride content. They are capable of delivering cholesterol to many tissues via the LDL receptor
e. HDLs are formed mostly by the liver and are integral in the return of cholesterol from tissues to the liver (reverse cholesterol transport). HDLs are the heaviest and smallest LPs and have the highest protein and lowest triglyceride content
2. Species differences
a. Most animal species are HDL mammals, meaning that most of the cholesterol is carried by HDLs. HDL mammals include dogs, cats, horses, ruminants, rodents, and most other species. Pigs, rabbits, guinea pigs, hamsters, camels, rhinoceros, most monkeys, and humans are LDL mammals, meaning that most cholesterol is carried by LDLs
b. In LDL mammals, cholesterol ester transfer protein (CETP) transfers most of the cholesterol from HDLs to LDLs; thus LDL is the major carrier of cholesterol
c. HDL mammals have a low level of CETP, and cholesterol is not transferred to LDLs; thus HDL transports most of the cholesterol
d. Lipoprotein characteristics of most animal species are very different from human LPs
II. Diagnostic approach to hyperlipidemia
A. Serum turbidity
1. Hypertriglyceridemia causes serum turbidity
2. The opacity of the serum correlates to serum triglyceride content. Serum with the appearance of whole milk can have triglyceride concentrations as high as 2500 to 4000 mg/dL
B. Refrigeration test
1. Place the serum sample in the refrigerator overnight
2. Chylomicrons will float, forming a “cream layer”
3. If the serum below the chylomicron layer is still turbid, then other LPs (most likely VLDLs or LDLs) are present in excess
C. Lipoprotein electrophoresis
1. Separates LPs based on their charge and mobility on agarose gel
2. If submitting a serum sample for lipoprotein electrophoresis, make sure the laboratory has experience with animal samples and interpretation of LP patterns; otherwise, erroneous interpretations will occur
3. Most useful for monitoring the effectiveness of treatment of lipid abnormalities
III. Hyperlipidemia
A. Postprandial hyperlipidemia is the most common cause of hyperlipidemia
B. Equine hyperlipidemia
1. Occurs primarily in miniature horses, ponies, and donkeys
2. Caused by starvation and chronic illness, creating a negative energy balance with mobilization of triglycerides
C. Primary hyperlipidemia
1. Idiopathic hypercholesterolemia
a. First observed in briards but has been seen in other breeds as well
b. Marked increase in serum cholesterol with generally normal triglyceride concentrations
c. In dogs, an increase in HDL1 is noted
2. Idiopathic or primary hyperlipoproteinemia
a. Most likely, many different syndromes can cause idiopathic hyperlipoproteinemia.
b. One variant in dogs has been shown to be due to a decrease in lipoprotein lipase activity
c. A primary hyperlipoproteinemia in lambs is the result of decreased lipoprotein lipase activity
d. Associated with miniature schnauzers but also occurs in many other breeds (especially Shetland sheepdogs)
3. Hyperchylomicronemia of cats
a. Due to a decrease in lipoprotein lipase activity
b. Clinically well characterized; affected cats have xanthomas, nerve dysfunction, lipemia retinalis, and anemia. Extreme elevations of triglyceride and cholesterol have been noted
D. Secondary hyperlipidemia occurs as a result of other disease processes
1. Causes include hypothyroidism, diabetes mellitus, hyperadrenocorticism, pancreatitis, nephrotic syndrome, cholestasis, and the ingestion of diets very high in fat (sled-dog diets)
2. Most of the lipid abnormalities resolve with treatment of the underlying condition
IV. Hypolipidemia
A. May occur with liver failure
B. Decreases in triglyceride may be seen in association with maldigestion and malabsorption syndromes, lymphangiectasia, and portosystemic shunts
EVALUATION OF GLUCOSE METABOLISM
I. Hypoglycemia. Causes include the following:
A. Starvation or malabsorption; occurs only after long-term starvation
B. Increased insulin production (insulinoma); reported in dogs, cats, and ferrets
C. Insulin overdose
D. Hypoadrenocorticism
1. Occasionally, a mild hypoglycemia is seen
2. A result of decreased gluconeogenesis and increased insulin-mediated uptake of glucose by muscle
E. Growth hormone deficiency
1. Hypoglycemia is uncommon
2. Occurs if current hypoadrenocorticism is present
F. Liver failure
1. From decreased hepatic gluconeogenesis and glycogenolysis
2. Occurs after greater than 70% hepatic function has been lost
G. Portosystemic shunt (if hepatic dysfunction is severe)
H. Extreme exertion (hunting dogs and horses)
I. Juvenile hypoglycemia in toy and miniature dogs
J. Glycogen storage diseases
K. Sepsis
1. More common with advanced sepsis
2. Possibly because of impaired gluconeogenesis and glycogenolysis and increased utilization of glucose by tissues
L. Ketosis (cattle); negative energy balance leads to hypoglycemia with an increase in ketone bodies production
M. Pregnancy toxemia (sheep) from negative energy balance
N. Neonatal hypoglycemia; common in pigs
O. Neoplasia (other than insulinoma)
1. Lymphocytic leukemia, lymphoma, leiomyosarcoma, leiomyoma, hepatocellular carcinoma, mammary carcinoma, pulmonary carcinoma, hemangiosarcoma, hepatoma, plasma-cell tumor, malignant melanoma, and salivary adenocarcinoma
2. May be related to excessive glucose utilization by the tumor or secretion of insulin-like growth factor 1 (IGF-1)
II. Hyperglycemia. Causes include the following:
A. Diabetes mellitus
B. Postprandial hyperglycemia (does not occur in ruminants)
C. Hyperadrenocorticism
D. Stress (most common cause in cats)
E. Administration of corticosteroids
F. Catecholamine release (pain, exertion, excitement, pheochromocytoma)
G. Tumors (glucagonoma, pituitary tumor secreting excess growth hormone)
H. Increased progesterone production
I. Pancreatitis
J. Pituitary pars intermedia dysfunction (Equine Cushing syndrome)
K. Drugs (glucocorticoids, progesterone, xylazine, ketamine, morphine, phenothiazine, adrenocorticotrophic hormone, glucose-containing fluids)
L. Milk fever (cattle)
M. Neurologic diseases (cattle); from increased glucocorticoid and epinephrine concentrations
N. Proximal duodenal obstruction (cattle); causes extreme hyperglycemia due to decreased peripheral glucose use
O. Colic (horses); horses with very high glucose concentrations have a poor prognosis
P. Hyperthyroidism; occurs in a small percentage of cats and may be due to stress or other causes of hyperglycemia
Q. Moribund condition (ruminants)
III. Blood glucose analysis
A. Fast dogs and cats for 12 hours to avoid postprandial hyperglycemia. Do not fast if hypoglycemia is suspected
B. Horses and cattle are typically not fasted
C. Separate serum or plasma from cells within 30 minutes of collection. Glycolysis of RBCs will result in a 10% glucose decrease per hour if not separated
D. Minimize stress and excitement in cats before collecting sample
IV. Urine glucose analysis
A. Glucose appears in the urine when the renal threshold for glucose has been exceeded
1. Dogs and cats; approximately 180 to 200 mg/dL
2. Horses; approximately 180 mg/dL
3. Cattle; approximately 100 mg/dL
B. The renal threshold may be decreased with proximal tubular abnormalities, Fanconi syndrome, amyloidosis in dogs, and exposure to nephrotoxins
V. Glucose tolerance test
A. Useful for detecting decreased glucose tolerance in persistently hyperglycemic animals
B. Avoid chemical sedation
C. Methods
1. Oral
2. IV; superior to oral method because it is not affected by GI disorders
VI. Serum insulin
A. Most useful in hypoglycemic animals, especially if the hypoglycemia is sporadic.
B. Start fasting, and monitor serum glucose until the glucose concentration is below 60 mg/dL. Collect sample for insulin measurement at this time
C. If insulin concentration is in the middle part of the reference range or above in the presence of hypoglycemia, an insulinoma is suspected
D. In horses, an elevated serum insulin concentration with a normal to slightly increased serum glucose concentration is suggestive of metabolic syndrome and insulin resistance
VII. Fructosamine
A. Reflects blood glucose over previous 5 to 8 days
B. Hypoproteinemia decreases and hyperproteinemia increases fructosamine concentration
C. Cannot detect hypoglycemic periods; the Somogyi effect will look like poor control with fructosamine measurement
D. Can be used for an indication of overall control of diabetes if cannot obtain a glucose curve
VIII. Glycated hemoglobin
A. Reflects blood glucose over the lifespan of the RBC
1. 8 to 12 weeks in dogs
2. 5 to 6 weeks in cats
B. Anemia falsely lowers glycated hemoglobin, and polycythemia will increase measurement
C. Measure at a veterinary laboratory
EVALUATION OF LABORATORY DATA
I. Establishment of reference ranges
A. The term normal range should be discarded
B. A reference range for a particular test is derived from the results from a group fitting a stated description or selection criteria. Individuals are selected from a parent population using defined criteria and are then tested
C. Establishment of the mean two standard deviations will provide a range in which 95% of the population should be included. About 2.5% of the population will have values below and 2.5% of the population will have values above this range
D. Establishment of the mean three standard deviations will provide a range in which 99% of the population should be included. About 0.5% of the population will have values below and 0.5% of the population will have values above this range. Although this range will include a higher percentage of individuals, it is often a very broad range with a higher likelihood of overlap with an affected population. Therefore most reference ranges are established using the mean two standard deviations
II. Diagnostic performance of tests
A. Sensitivity
1. Sensitivity is defined as the ability to predict the presence of disease or the fraction of those with a specific disease that the assay accurately predicts
2. It is calculated by dividing the number of true positives (TP) by the total of those with disease (the TP plus the false negatives [FN]); TP/(TP FN) * 100
3. Think of sensitivity as the ability to find positives. If a test has very high sensitivity, all the positives have been found (even if the test identifies some without disease as positive). Those that then test negative have a very high likelihood of being truly negative. Thus, if the sensitivity of an assay is high, then the diagnosis of the negative state can be highly trusted
4. Think of sensitivity in terms of the disease state first. Sensitivity is an indicator of those with disease who also test positive
B. Specificity
1. Specificity is defined as the ability to predict the absence of disease, or the fraction of those without disease that the assay correctly predicts
2. It is calculated by dividing the number of true negative (TN) by the total of those without disease (the TN plus the false positives [FP]); TN/(FP TN) * 100
3. Think of specificity as the ability to find negatives. If a test has a very high specificity, all the negatives have been found (even if the test identifies some with disease as being negative). Thus, if the specificity of an assay is high, then the diagnosis of the positive state can be highly trusted
4. Think of specificity in terms of the disease state first. Specificity is an indicator of those without disease who also test negative
C. Positive predictive value (PPV)
1. PPV is the percent of patients with positive test results who actually have the disease
2. PPV is calculated by dividing the number of TP by the total of those who tested positive (the TP plus the FP); TP/(TP FP) * 100
3. PPV is influenced by the prevalence of the disease in the population; it increases as the prevalence increases
4. Think of PPV in terms of the test result first. PPV is an indicator of those who test positive and also have disease
D. Negative predictive value (NPV)
1. NPV is the percent of patients with a negative test result who do not have the disease
2. NPV is calculated by dividing the number of TP by the total of those who tested negative (the true negatives plus the false negatives); TN/(TN FN) * 100
3. NPV is influenced by the prevalence of the disease in the population; it decreases as the prevalence increases
4. Think of NPV in terms of the test result first. NPV is an indicator of those who test negative and also happen to be without disease
E. Positive diagnostic likelihood ratio (PDLR)
1. PDLR is the probability of a positive test result in those with disease divided by the probability of a positive test result in those without disease
2. PDLR sensitivity/(1-specificity)
3. A higher number indicates a higher probability of being correct with a positive diagnosis
4. PDLR is not influenced by the prevalence of the disease in the population
F. Negative diagnostic likelihood ratio (NDLR)
1. NDLR is the probability of a negative test result in those with disease divided by the probability of a negative test result in those without disease
2. NDLR [FN/(FN TP)]/specificity
3. A lower number indicates a higher probability of being correct with a negative diagnosis
4. NDLR is not influenced by the prevalence of the disease in the population
G. Diagnostic discordance
1. Diagnostic discordance gives an estimate of the overall rate of an incorrect diagnosis
2. Diagnostic discordance in the number of samples with diagnostic disagreement divided by the total number of samples
Supplemental Reading
DiBartola S, Fluid Therapy in Small Animal Practice, 3rd ed. St Louis, 2006, Saunders.
Kaneko JJ, Harvey JW, Bruss ML, eds. Clinical Biochemistry of Domestic Animals, 5th ed. San Diego, 1997, Academic Press.
Thrall MA, ed. Veterinary Hematology and Clinical Chemistry. Philadelphia, 2004, Lippincott Williams & Wilkins. Villiers E, Blackwood L. BSAVA Manual of Canine and Feline Clinical Pathology. Gloucester, UK, 2005, BSAVA. Willard MD, Tvedten H. Small Animal Clinical Diagnosis by Laboratory Methods. St Louis, 2003, Saunders.