Radiotherapy in Practice: Imaging for Clinical Oncology
Radiotherapy in Practice: External Beam Radiotherapy
Edited by Peter Hoskin
Radiotherapy in Practice: Brachytherapy
Edited by Peter Hoskin and Catherine Coyle
Radiotherapy in Practice: External Beam Therapy
Edited by Peter Hoskin
Radiotherapy in Practice: Imaging for Clinical Oncology
Edited by Peter Hoskin, Thankamma Ajithkumar, and Vicky Goh
Radiotherapy in Practice: Physics for Clinical Oncology
Edited by Amen Sibtain, Andrew Morgan, and Niall MacDougall
Radiotherapy in Practice: Radioisotope Therapy
Edited by Peter Hoskin
Radiotherapy in Practice: Radiotherapy and the Cancers of Children, Teenagers, and Young Adults
Edited by Tom Boterberg, Karin Dieckmann, and Mark Gaze
Radiotherapy in Practice Imaging for Clinical Oncology
SECOND EDITION
Edited by Peter Hoskin
Consultant in Clinical Oncology, Mount Vernon Cancer Centre, Northwood, UK; Professor of Clinical Oncology, University of Manchester, UK
Thankamma Ajithkumar
Consultant Clinical Oncologist, Cambridge University Hospitals NHS Foundation Trust, UK
Vicky Goh
Chair of Clinical Cancer Imaging, King’s College London; Honorary Consultant Radiologist, Guy’s & St Thomas’ NHS Foundation Trust, UK
Great Clarendon Street, Oxford, OX2 6DP, United Kingdom
Oxford University Press is a department of the University of Oxford. It furthers the University’s objective of excellence in research, scholarship, and education by publishing worldwide. Oxford is a registered trade mark of Oxford University Press in the UK and in certain other countries
The moral rights of the authors have been asserted
First Edition published in 2010
Second Edition published in 2021
Impression: 1
All rights reserved. No part of this publication may be reproduced, stored in a retrieval system, or transmitted, in any form or by any means, without the prior permission in writing of Oxford University Press, or as expressly permitted by law, by licence or under terms agreed with the appropriate reprographics rights organization. Enquiries concerning reproduction outside the scope of the above should be sent to the Rights Department, Oxford University Press, at the address above
You must not circulate this work in any other form and you must impose this same condition on any acquirer
Published in the United States of America by Oxford University Press 198 Madison Avenue, New York, NY 10016, United States of America
British Library Cataloguing in Publication Data
Data available
Library of Congress Control Number: 2021941848
ISBN 978–0–19–881850–2
DOI: 10.1093/med/9780198818502.001.0001
Printed in Great Britain by Bell & Bain Ltd., Glasgow
Oxford University Press makes no representation, express or implied, that the drug dosages in this book are correct. Readers must therefore always check the product information and clinical procedures with the most up-to-date published product information and data sheets provided by the manufacturers and the most recent codes of conduct and safety regulations. The authors and the publishers do not accept responsibility or legal liability for any errors in the text or for the misuse or misapplication of material in this work. Except where otherwise stated, drug dosages and recommendations are for the non-pregnant adult who is not breast-feeding
Links to third party websites are provided by Oxford in good faith and for information only. Oxford disclaims any responsibility for the materials contained in any third party website referenced in this work.
Contents
Contributors vii
1 Introduction 1
Peter Hoskin and Vicky Goh
2 Principles of imaging 4
Connie Yip, N. Jane Taylor, Anthony Chambers, and Vicky Goh
3 MRI and functional imaging in radiotherapy planning, delivery, and treatment 32
Huiqi Yang and Thankamma Ajithkumar
4 Breast 46
Dinos Geropantas and Victoria Ames
5 Lung and thorax 64
Pooja Jain, Katy Clarke, and Michael Darby
6 Lymphoma 82
Heok Cheow, Peter Hoskin, and Thankamma Ajithkumar
7 Oesophageal tumours 98
Kieran Foley, Carys Morgan, and Tom Crosby
8 Gastric tumours 108
Nicholas Carroll and Elizabeth C. Smyth
9 Hepatic and biliary tumours 114
Marika Reinius, Edmund Godfrey, and Bristi Basu
10 Pancreatic tumours 128
David Bowden and Thankamma Ajithkumar
11 Gastrointestinal stromal tumours 137
Haesun Choi
12 Rectal cancer 148
Vivek Misra and Rohit Kochhar
13 Anal cancer 160
Rebecca Muirhead and Vicky Goh
14 Urological cancers 168
Ananya Choudhury and Peter Hoskin
15 Gynaecological cancers 193
Kate Lankester and Lavanya Vitta
16 Head and neck cancers 208
Gill Barnett and Tilak Das
17 Central nervous system 222
Sara C. Erridge, Gerard Thompson, and David Summers
18 Soft tissue sarcomas 251
Morag Brothwell, Sarah Prewett, Gail Horan, and Emma-Louise Gerety
19 Endocrine tumours 265
Luigi Aloj
20 Primary bone sarcomas 275
Gulshad Begum, Sarah Prewett, Gail Horan, and Emma-Louise Gerety
21 Paediatrics 288
Mark Gaze, Monique Shahid, Paul Humphries, and Francesca Peters
22 Imaging for common complications 315
Helen Addley, Katy Hickman, and Thankamma Ajithkumar
23 Imaging for treatment verification 335
June Dean
24 Radiation protection issues when imaging patients for radiotherapy 356
Simon Thomas
Index 373
Contributors
Helen Addley
Consultant Radiologist
Cambridge University Hospitals NHS Foundation Trust
Cambridge, UK
Thankamma Ajithkumar
Consultant Clinical Oncologist
Cambridge University Hospitals NHS Foundation Trust
Cambridge, UK
Luigi Aloj
Consultant Nuclear Medicine Physician
University of Cambridge School of Clinical Medicine
Cambridge, UK
Victoria Ames
Consultant Radiologist
Norfolk and Norwich University Hospitals NHS Foundation Trust Norwich, UK
Gill Barnett
Consultant Clinical Oncologist
Cambridge University Hospitals NHS Foundation Trust Cambridge, UK
Bristi Basu
Academic Consultant Medical Oncologist
Department of Oncology
University of Cambridge Cambridge, UK
Gulshad Begum
Specialist Registrar in Clinical Oncology
Cambridge University Hospitals NHS Foundation Trust
Cambridge, UK
David Bowden
Consultant Radiologist
Cambridge University Hospitals NHS Foundation Trust Cambridge, UK
Morag Brothwell
Specialist Registrar in Clinical Oncology
Cambridge University Hospitals NHS Foundation Trust Cambridge, UK
Nicholas Carroll
Consultant Radiologist
Cambridge University Hospitals NHS Foundation Trust Cambridge, UK
Anthony Chambers
Consultant Radiologist
Paul Strickland Scanner Centre
Mount Vernon Cancer Centre Northwood, UK
Heok Cheow
Consultant Radiologist
Cambridge University Hospitals NHS Foundation Trust Cambridge, UK
Haesun Choi Professor
Department of Abdominal Imaging
MD Anderson Cancer Center Houston, Texas, USA
Ananya Choudhury
Chair and Honorary Consultant in Clinical Oncology
The Christie NHS Foundation Trust Manchester, UK
Katy Clarke
Consultant Clinical Oncologist
St James’ University Hospital Leeds, UK
Tom Crosby
Clinical Oncologist
Velindre Cancer Centre Cardiff, UK
Michael Darby
Consultant Radiologist
St James’ University Hospital Leeds, UK
Tilak Das
Consultant Neuroradiologist
Cambridge University Hospitals NHS Foundation Trust
Cambridge, UK
June Dean
Associate Radiotherapy Manager
Cambridge University Hospitals NHS Foundation Trust Cambridge, UK
Sara C. Erridge
Consultant Clinical Oncologist
Edinburgh Cancer Centre
Western General Hospital Edinburgh, UK
Kieran Foley
Consultant Radiologist
Royal Glamorgan Hospital & Velindre Cancer Centre
Cardiff, UK
Mark Gaze
Consultant in Clinical Oncology
University College London Hospitals
NHS Foundation Trust London, UK
Emma-Louise Gerety
Consultant Musculoskeletal
Radiologist
Cambridge University Hospitals NHS Foundation Trust Cambridge, UK
Dinos Geropantas
Consultant Clinical Oncologist
Norfolk and Norwich University Hospitals NHS Foundation Trust Norwich, UK
Edmund Godfrey
Consultant Radiologist
Cambridge University Hospitals NHS Foundation Trust
Cambridge, UK
Vicky Goh
Chair of Clinical Cancer Imaging
King’s College London
Honorary Consultant Radiologist
Guy’s & St Thomas’ NHS Foundation Trust
London, UK
Katy Hickman
Specialist Registrar in Radiology
Cambridge University Hospitals NHS Foundation Trust Cambridge, UK
Gail Horan
Consultant Clinical Oncologist
Cambridge University Hospitals NHS Foundation Trust Cambridge, UK
Peter Hoskin
Consultant in Clinical Oncology
Mount Vernon Cancer Centre Northwood, UK; Professor of Clinical Oncology
University of Manchester, UK
Paul Humphries
Consultant Paediatric Radiologist
University College London Hospitals
NHS Foundation Trust London, UK
Pooja Jain
Consultant Clinical Oncologist
St James’ University Hospital Leeds, UK
N. Jane Taylor
Principal Clinical Scientist
Paul Strickland Scanner Centre
Mount Vernon Hospital Northwood, UK
Rohit Kochhar
Consultant Radiologist
The Christie NHS Foundation Trust Manchester, UK
Kate Lankester
Honorary Clinical Senior Lecturer
Sussex Cancer Centre
Royal Sussex County Hospital Brighton, UK
Vivek Misra
Consultant Clinical Oncologist
The Christie NHS Foundation Trust Manchester, UK
Carys Morgan
Clinical Oncologist
Velindre Cancer Centre Cardiff, UK
Rebecca Muirhead
Consultant Clinical Oncologist
Oxford University Hospitals Trust Oxford, UK
Francesca Peters
Consultant Radiologist
East and North Hertfordshire Trust Stevenage, UK
Sarah Prewett
Consultant Clinical Oncologist
Cambridge University Hospitals NHS Foundation Trust
Cambridge, UK
Marika Reinius
Specialist Registrar in Medical Oncology
Cambridge University Hospitals NHS Foundation Trust Cambridge, UK
Monique Shahid
Consultant Paediatric Radiologist
The Leeds Teaching Hospitals NHS Trust Leeds, UK
Elizabeth C. Smyth
Consultant Oncologist
Cambridge University Hospitals NHS Foundation Trust Cambridge, UK
David Summers
Consultant Neuroradiologist
Western General Hospital Edinburgh, UK
Simon Thomas
Consultant Clinical Scientist
Cambridge University Hospitals NHS Foundation Trust Cambridge, UK
Gerard Thompson
Senior Clinical Lecturer in Radiology
Department of Radiology University of Edinburgh Edinburgh, UK
Lavanya Vitta
Consultant Radiologist
Brighton and Sussex University Hospitals NHS Trust Brighton, UK
Huiqi Yang
Consultant Clinical Oncologist
Cambridge University Hospitals NHS Foundation Trust Cambridge, UK
Connie Yip
Senior Consultant Radiation Oncologist
Department of Radiation Oncology
Singapore
Chapter 1 Introduction
Peter Hoskin and Vicky Goh
1.1 Introduction
Imaging is an essential component in the management of any patient with cancer. With perhaps the exception of a small superficial basal cell carcinoma all patients will require imaging evaluation of their malignancy. Therefore, it is essential that the principles of imaging and the specific requirements for each tumour site are clearly understood by those involved in the management of patients with malignant disease to enable optimum use of this essential modality.
1.2 The role of imaging
The role of imaging is extensive and integral to management at any point in the patient’s journey. At their initial presentation imaging may have led to the discovery of a tumour, resulting in an image-guided or surgical procedure to confirm its malignant nature. It will then be essential to assess the full extent of that tumour and define the tumour stage by evaluating pathways of direct, lymphatic, and blood borne spread. The tumour stage is critical to subsequent management and it is therefore vital that full and appropriate imaging is undertaken at this point.
For the patient having radiotherapy, an accurate assessment of the tumour to be treated and of the surrounding organs at risk is critical to planning radiotherapy. Detailed evaluation with diagnostic imaging is essential for delivering optimal radiotherapy. The most important step in radiotherapy planning is tumour localization and, with the few exceptions of readily palpable and visible skin tumours, a full appreciation of the anatomical localization, involvement of surrounding structures, and proximity to critical organs is essential, and can only be provided through appropriate radiological investigations.
Following treatment, further management is based on response assessment and continued surveillance in which imaging will play a major part. It is important to have an understanding of the positive and negative predictive value of a test and the level of reliance that can be placed upon it. This is particularly the case in the setting of response assessment when patients having persistent disease may be subject to major salvage procedures on the basis of failure to achieve a radiological complete response.
1.3 Imaging modalities
X-ray imaging was available soon after the discovery of X-rays by Roentgen in 1895. It is remarkable that despite technical improvements in the production of plain X-ray images and increased understanding of the use of contrast materials it took almost 80 years for the next revolution in imaging to appear in the clinical setting with the introduction of computed tomography (CT).
Since then, there has been a major revolution in imaging, with ever more sophisticated and rapid CT imaging, and progressive integration of magnetic resonance imaging (MRI), and molecular imaging techniques—18F-flurodeoxyglucose positron emission tomography/computed tomography (18F-FDG PET/CT)—in radiotherapy planning.
Simultaneously, radiotherapy techniques have evolved from two-dimensional planning to modern high-precision techniques such as intensity modulated radiotherapy (IMRT), image-guided radiotherapy (IGRT), tomotherapy, volumetric modulated arc therapy (VMAT), adaptive radiotherapy, and proton beam therapy. Imaging modalities such as stereoscopic X-ray, CT scan, and MRI are also integrated with the therapy machines to ensure accurate delivery.
The result of these dramatic technological changes is that a modern cancer centre has a sophisticated range of imaging modalities available for each patient, to provide detailed information on both the anatomical distribution and physiological characteristics of the tumour in question. The challenge in this setting is to optimize the use of each modality in order to obtain the most accurate and reliable information possible with the technology available.
1.4 Integration into the radiotherapy department
Modern radiotherapy is a complex multistep process, optimizing the many features of a modern linear accelerator and, recently, that of particle therapy machines in order to deliver a high dose of radiation to the tumour yet minimizing exposure to surrounding organs at risk, thus ensuring that patients receive accurate reproducible treatment. Imaging is an integral component of many of the stages through which a patient will pass in the radiotherapy department. The technological developments in imaging in recent years have also driven important changes in the radiotherapy department.
Currently, most radiotherapy departments use three-dimensional (3D) CT-based planning systems in which a CT scan is imported into a radiotherapy planning computer system and the treatment volume, together with the organs at risk (OAR), are defined on screen on sequential CT images. The use of intravenous contrast can be useful in radiotherapy planning to distinguish vessels from abnormal soft tissue structures such as lymph nodes. Large volumes of oral contrast to outline bowel are not used because large volumes of contrast can alter the absorption characteristics of the dosimetric calculations.
Four-dimensional (4D) CT scans are useful in situations where tumour movement during respiration is likely. Co-registration of MRI sequences is used where MR is superior to CT in demarcating tumour and normal tissue structures: particular examples
would include the brain and pelvis (for prostate, bladder, and uterine tumours). 18F FDG PET/CT images could improve further the accuracy of treatment volume delineation for lung and head and neck cancers and lymphoma.
During the treatment planning process, radiation physicists and dosimetrists derive an optimal beam arrangement based on the intended radiotherapy volume and delivery technique to achieve a homogeneous dose distribution within the planning target volume (PTV), whilst minimizing dose to OARs. Information from the planning CT scan is used for dosimetric calculations. Currently, MR is not used in radiotherapy dosimetry. This is because of the distortion characteristics at the edge of the MR field so that the patient outline is less accurate and also the fact that the information on X-ray absorption heterogeneities is not obtained in the process of MR scanning. With the evolution of the MRI-Linac, there are increasing efforts to incorporate MRI dosimetry for adaptive radiotherapy, but this remains investigational at present.
1.5 Summary
◆ Imaging is an integral component of patient care throughout the cancer journey, being required for diagnosis and staging, radiotherapy planning, and subsequent response evaluation and follow-up.
◆ The evolution of imaging in recent years with widespread availability of increasingly sophisticated CT, MR, and molecular imaging has driven major changes in radiotherapy practice.
◆ The precise requirements for individual tumours and tumour sites vary and a clear appreciation of the relative strengths and weaknesses of different imaging modalities for a given patient is essential.
◆ It is critical to bear in mind that increased use of ionizing-radiation based imaging exposes the patient to a higher concomitant radiation dose, the long-term sequelae of which are as yet to be fully evaluated.
◆ Clear justification based on sound evidence is essential in this setting for each diagnostic radiation exposure to ensure that the imaging tools are used optimally for each patient.
Chapter 2
Principles of imaging
Connie yip, n. Jane taylor, anthony Chambers, and Vicky Goh
2.1 Introduction
Imaging is fundamentally important to the management of the cancer patient. Anatomical imaging is the mainstay for patient evaluation; however, molecular, functional, and hybrid (combined molecular/functional–anatomical) imaging have acquired an increasing role.
To obtain the most accurate and reliable information possible with the most appropriate imaging modality the relative performance of the imaging test has to be defined. Commonly used measures of test performance include:
◆ Sensitivity: how good the test is at picking up disease (true positive (TP)/TP + false negative (FN)), expressed as a percentage.
◆ Specificity: how good the test is at excluding disease (true negative (TN)/TN + false positive (FP)), expressed as a percentage.
◆ Accuracy: how good a test is at picking up and excluding disease (TP + TN/TP + FP + TN + FN), expressed as a percentage.
Test performance is also affected by the prevalence of disease in the population: test performance will be lower if disease prevalence in the population is low, that is, the positive predictive value (TP/TP + FP) will be lower (Table 2.1). Other parameters that have been used include receiver operator curve (ROC) analysis, frequency of management change, and cost-benefit analysis.
2.2 X-ray
X-ray remains an important part of cancer management, for example for suspected lung cancer. Although it has poor sensitivity and specificity, it is widely available and cheap. Digital systems which have replaced conventional films have the advantage that images can be viewed and distributed with a higher patient throughput. Digital detectors also demonstrate increased dose efficiency and a greater dynamic range, potentially reducing radiation exposure to the patient.
Table 2.1 effect of disease prevalence on the performance of a test with 90% sensitivity and 90% specificity in the population imaged (1000 independent tests)
2.2.1
Production of X-rays
X-rays are produced from an X-ray tube, a glass envelope vacuum with a wire element at one end forming the cathode, and a heavy metal target (e.g. tungsten or copper) at the other end forming the anode. Application of a high voltage at the cathode results in the formation of electrons which are drawn towards the anode. Collision with the heavy metal target produces X-rays.
2.2.2 X-ray quality and intensity
Quality describes the penetrating power of an X-ray beam. Intensity describes the quantity of radiation energy flowing in unit time. In practice an X-ray beam consists of a continuous spectrum of energies up to a maximum determined by the voltage applied between the cathode and the anode, for example a voltage setting of 120 kV will produce a range of X-ray energies up to a maximum of 120 keV.
Factors affecting X-ray tube output include:
◆ Tube kilovoltage: this affects both beam quality and intensity. The higher the kV, the greater the beam penetration: settings ranging from 28 kV to 30 kV are used for mammography, and 70–90 kV for body imaging.
◆ Tube current: this affects beam intensity only. In general, beam intensity is directly proportional to tube current.
◆ Beam filtration: filters are placed into the X-ray beam to improve beam quality by absorbing lower energy radiation, yet transmitting higher energy X-rays. Typical filters include aluminium, copper, molybdenum, or palladium.
◆ Distance from source: an X-ray tube produces a diverging beam, subject to a reduction in intensity with distance obeying the inverse square law.
◆ Tube target material: the proton number of the target affects the intensity of the beam produced. Beam quality is not affected.
2.2.3 Interaction of X-ray with matter
There are two main types of interaction between X-ray and matter at the photon energies produced for diagnostic radiology:
◆ Photoelectric effect: the interaction of X-ray photons with tightly bound electrons which absorb all the energy of the X-ray photon. The electrons are then ejected from the atom, a ‘photoelectron’. Photoelectric interactions occur at lower energies (<1 MeV) and predominate in the diagnostic energy range. The degree of absorption is highly dependent upon the atomic number of the tissue.
◆ Compton scattering: the interaction of X-ray photons with loosely bound orbital electrons. The X-ray photons lose some energy and are deflected or scattered; this interaction predominates in the megavoltage energy ranges used for therapeutic radiation beams. The probability of interaction is independent of atomic number and varies with tissue electron density.
Different tissues in the body attenuate X-rays differently. Tube voltages between 20 kV and 65 kV provide the best contrast for body imaging, with excellent differentiation between soft tissue and bone as the photoelectric effect is dominant. At higher energies, when the Compton effect dominates, image contrast is predominantly due to tissue density.
2.2.4
Image generation and processing
Digital images consist of picture elements or pixels; the 2D representation of pixels in an image is called the matrix. Following exposure of digital detectors to X-rays, the energy absorbed is transformed into electric charges, which are then processed into a greyscale clinical image representing the amount of energy deposited. A digital header file containing patient information is added to the image generated. The following factors influence image quality:
◆ Spatial resolution: in digital radiography, spatial resolution (the minimal resolvable separation of two high-contrast objects) is defined by minimum pixel size. This is in the order of 100–200 microns. The use of direct conversion detectors increases spatial resolution as the scatter of X-ray quanta and light photons within the detector influences spatial resolution.
◆ Dynamic range: this refers to the range of X-ray exposures over which a meaningful image can be obtained. Digital detectors have a wide and linear dynamic range in comparison to previously used screen-film combinations, so that differences in specific tissue absorption (e.g. bone versus soft tissue) can be displayed in a single image without the need for additional imaging.
◆ Detective quantum efficiency: this refers to the efficiency of a detector in converting X-ray energy into an image signal. It is dependent on radiation exposure, radiation quality, spatial frequency, modulation transfer function (the capacity of the detector to transfer the modulation of input signal at a given spatial frequency to its output), and detector material.
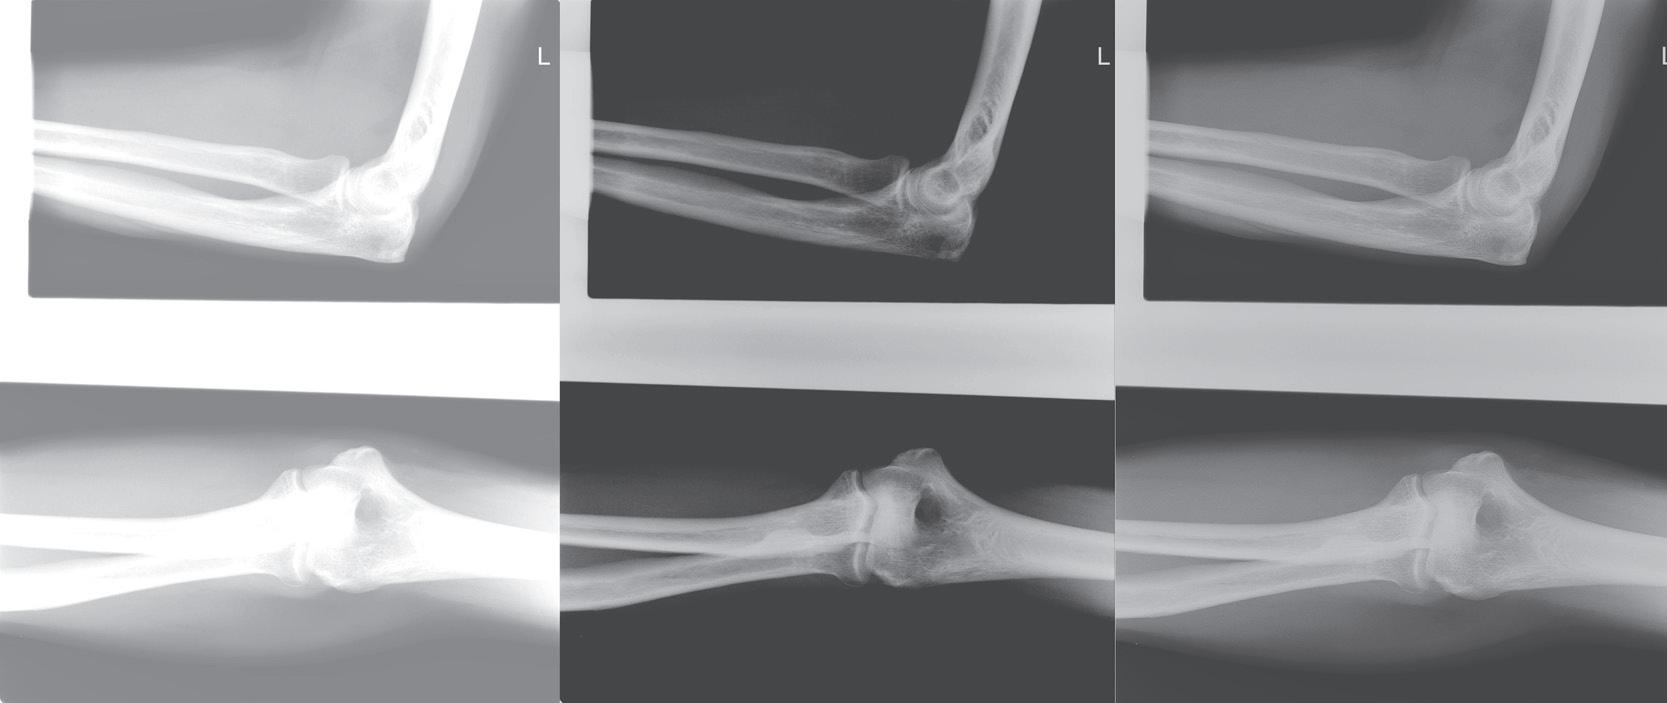
Post-processing is performed following exposure and readout to ensure images are optimized for viewing (Figure 2.1). Spatial resolution is dependent on the detector and cannot be altered by post-processing; however, manoeuvres including contrast optimization, noise reduction, and artefact removal can compensate for poorer spatial resolution. Different algorithms are generally applied to different anatomic regions in order to prevent inadvertent suppression of useful information.
Fig. 2.1 digital radiographs: images can be digitally processed to alter image quality. the effect of contrast enhancement (a), contrast reduction (b), and edge enhancement (c) is shown.
2.3 Computed tomography
CT is currently the most widely used imaging modality for cancer imaging. Since its introduction in 1971, CT technology has evolved rapidly. In general it is a sensitive and specific test, though values vary depending on the body part examined.
2.3.1
Basic principles
CT is an X-ray tomographic technique that provides non-superimposed crosssectional images of the body. As the X-ray tube rotates around the patient, the X-ray beam passes through an axial section of the patient’s body from different directions. Detectors around the patient measure the intensity of the attenuated radiation beam as it emerges from the body. Detectors convert the X-ray intensity into electric signals which are amplified and processed to compensate for inhomogeneities in the detector system and to correct for beam hardening effects. Data are then transformed into X-ray attenuation values producing the CT raw data. These are then reconstructed mathematically to yield the image dataset, for example using filtered back projection. Different convolution kernels can be applied enabling different types of images to be obtained (e.g. soft, smooth, sharp, edge enhanced). More recently, with the increasing use of low dose CT, advances in scanner hardware and increasing computing power, iterative reconstruction techniques are replacing filtered back projection to improve image noise and image characteristics.
During image reconstruction a CT number (Hounsfield unit) is assigned according to the degree of attenuation. This is defined as:
CT=1000/ waterwater ×−() µµ µ
A CT number of -1000 represents air, 0 represents water, around 50 represents soft tissue, and >1000 represents cortical bone. There is no upper limit. Images are displayed as a greyscale image. The resulting CT image is composed of a square matrix ranging in size from 256 × 256 to 1024 × 1024 pixel elements. Each pixel represents
a scanned voxel, each with its own CT number. Axial CT images can be manipulated further to produce reformatted images in any secondary plane and 3D images.
2.3.2 Computed tomography acquisition
CT is currently based on helical CT, which was made possible by the introduction of slip ring technology allowing for a continuously rotating CT gantry. Images are acquired using the continuously rotating X-ray tube by moving the table top on which the patient lies through the scan plane. This results in a helical scan pattern and acquisition of a data volume. Because of the helical acquisition, interpolation has to be performed during image reconstruction to generate a planar dataset for each table position and to produce artefact-free images. Images can be generated from any segment within the scanned volume by overlapping reconstructions as often as required. Different reconstruction intervals (spacing between sections) and section collimations (section thickness) can be used.
Multidetector helical CT, introduced in 1998, has resulted in a large gain in CT performance, including a shorter acquisition duration, longer scan ranges, and thinner sections with near isotropic resolution. Multidetector helical CT uses the radiation delivered more efficiently. The number of detector rows currently stands at 320 for stateof-the-art scanners. Dual-source CT with two X-ray tubes and two corresponding multidetector arrays has also been developed. The acquisition systems are mounted on a rotating gantry with a 90° angular offset. The gantry rotation time is <0.3 s, and dualsource CT can provide temporal resolutions one-quarter of the gantry rotation time. Typical acquisition parameters for general imaging of the thorax, abdomen, and pelvis are summarized in Table 2.2.
◆ Kilovoltage (kV): typically 120 kV is applied for diagnostic body imaging, although more recently kV modulation is possible according to patient habitus. Dual-energy imaging is performed on a dual-source CT using two different kV, for example 140 kV and 100 kV with beam filtration.
Table 2.2 typical Ct acquisition parameters for multidetector Ct (64 rows and above)
Positioning thoracic inlet to below diaphragm above diaphragm to iliac crest
crest to symphysis pubis
◆ Milliampere second (mAs): this is the product of the tube current (e.g. 200 mA) and rotation time of the scanner (e.g. 0.6 s). With multidetector CT this is often quoted as effective mAs which is the product of the tube current and exposure time of one slice (rotation × collimation/feed per rotation). The mAs applied will depend on the body part examined. A higher mAs generally reduces image noise, thus improving the detectability of low-contrast structures, but has to be tempered by patient dose considerations. Current scanners use dose modulation techniques to reduce patient radiation exposure: the dose during each tube rotation is measured and altered depending on the attenuation level, making it possible to reduce the dose by as much as 56%.
◆ Collimation: the radiation beam emitted by the X-ray tube can be shaped using special diaphragms or ‘collimators’ positioned either directly in front of the X-ray source (to shape the emitted beam) or directly in front of the detectors (to reduce the effect of scattered radiation). The collimation and focal spot size determines the quality of the slice profile. Images can be reconstructed with slice thicknesses equal to or greater than the detector collimation.
◆ Increment: the distance between images reconstructed from a data volume. This should be selected as an overlapping increment to lower noise and improve image quality. An overlap of up to 90% can be achieved but an overlap of 30–50% is generally used in clinical practice. For example, if slice thicknesses of 10 mm are reconstructed with a 5 mm increment, slices will overlap by 50%.
◆ Pitch: this traditionally refers to table feed per rotation/collimation for single-slice CT. For multidetector CT, pitch is more complicated. Its value will depend on whether a single section collimation or total collimation of the detector array is used. Good image quality is obtained with a pitch between 1 and 2, defined as table feed per rotation/single section collimation.
2.3.3 Image processing
Multiplanar reformations (MPRs) are 2D reformatted images that are reconstructed secondarily from a stack of axial images, for example in the sagittal or coronal plane. Oblique and curved reformations can also be obtained but require interpolation between adjacent voxels. Curved reformations are needed for structures that pass through multiple axial planes, for example blood vessels and bronchi. Isotropic imaging is ideal for good quality MPRs. MPRs are generally the width of one voxel but can be produced with a greater section thickness to reduce image noise and further improve image quality. An example is shown in Figure 2.2.
Maximum (MIP) and minimum intensity projections (MinIP) are volume rendering techniques. Images are generated by displaying the maximum or minimum CT numbers encountered along the direction of the projection, known as the viewing angle. This ensures that contrast is optimized between high-contrast structures and surrounding tissue.
MIP views are generally used for CT angiography and for specialized pulmonary studies. MinIP images are used mainly for visualizing the central tracheobronchial
system. Volume rendering techniques have become the standard technique for CT angiography and for musculoskeletal imaging. Virtual colonography is a special type of volume rendered dataset giving a perspective view of ‘flying through’ the colon.
2.3.4 Radiation dose
Radiation exposure in CT is dependent on scan parameters, scanner, and patient characteristics. Radiation dose with CT is generally 5–10× higher than corresponding conventional radiography, hence the importance of the ALARA (As Low As Reasonably Achievable) principle in ensuring that the patient receives the lowest possible radiation dose without compromising diagnostic scan quality.
Parameters that are commonly used to describe dose are the volume CT dose index (CTDIvol), the total scan dose (dose length product, DLP), and radiation risk (effective dose).
◆ CTDIvol: this is the average local dose delivered to a phantom cross-section (in milliGray, mGy) and indicates the average local dose delivered to the patient. CTDI will underestimate the dose for children and slim patients, and overestimate this for obese patients.
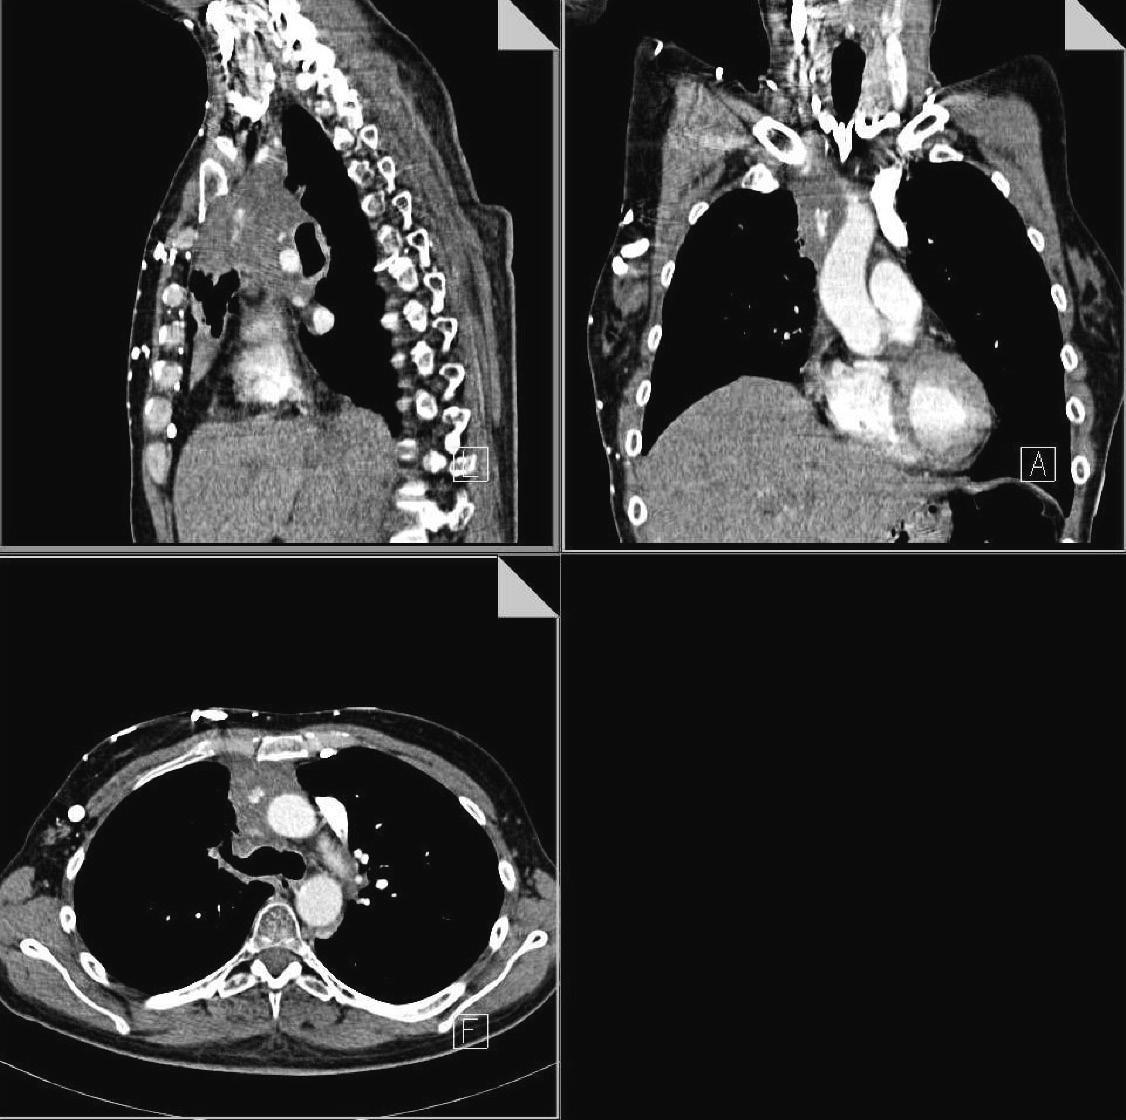
Fig. 2.2 Ct Images of the thorax: multiplanar reformats can be obtained from manipulating the original data set, in this case demonstrating a lung tumour causing superior vena cava obstruction.
◆ DLP: this is a measure of the cumulative dose delivered to the patient (in mGy.cm). It takes into account the average dose in the scan volume and the scan length (L).
DLP=CTDIL vol ×
◆ Effective dose: this is an estimate of the radiation risk to patients (in millisieverts, mSv). Mathematical modelling is used to calculate effective dose appropriately weighted for individual organs for a standard male or female (of 70 kg). Again such estimates of E will underestimate the dose for children and slim patients, and overestimate it for obese patients.
The European guidelines for quality in CT1 and UK national reference doses for CT (2003)2 provide reference doses for CT, indicating the CTDIvol and DLP that should not be exceeded (Table 2.3). The risk of death from radiation-induced cancer has been calculated from BEIR V and IRCP 60 data which extrapolate the risk estimates from accidentally or occupationally exposed groups, therefore reflecting high doses. The risk from diagnostic radiology (much lower doses) has to be extrapolated. The radiationinduced risk of death is approximately 0.5/10,000 persons, while the risk of fatal cancer is 3000/10,000 persons. The radiation-induced risk is age dependent (Table 2.4).
2.4 Ultrasound
US remains one of the most widely used imaging modalities worldwide as it offers realtime imaging, is inexpensive, safe, and portable. In general it has moderate sensitivity and specificity. High-frequency sound beams (usually >20 kHz) are used to generate high-resolution anatomical imaging. Modern US equipment still uses a pulse echo approach with a brightness mode (B-mode) display but performance has been improved by the introduction of tissue harmonic imaging, extended field of view imaging, coded pulse excitation, and electronic section focusing; 3D and 4D imaging is also possible. US can also provide functional information, for example assessment of tissue regional perfusion using Doppler or contrast-enhanced US.
2.4.1 Basic principles
US pulses are generated by an US transducer made from piezoelectric crystals. As an alternating electric voltage is applied, the crystal changes thickness and vibrates,
Table 2.3 national reference dose levels for multi-slice Ct as indicated by uK 2003 national dose review
Table 2.4 Calculated radiation-induced risk of dying from cancer (ICrP 60)
Age (years)
0–10
10–20
20–30
30–40
Risk (death per mSv)
14/100,000
18/100,000
7.5/100,000
3.5/100,000
60 2.0/100,000 80 1.0/100,000
generating a mechanical wave. These mechanical waves range in frequency of 2–15 MHz, travelling through biologic tissue at a velocity dependent upon the medium through which it is travelling. Sound travels more rapidly through tissues which demonstrate medium density and elasticity.
US wavelength (length of a single sine-wave cycle in a medium) is related to frequency and speed of sound as follows:
c=f λ
where c = speed of sound; f = frequency; and λ = wavelength.
As an US beam passes through tissue, it loses energy and amplitude. The following contribute to the attenuation of the US beam:
◆ Transfer of energy to tissue resulting in heating (absorption).
◆ Removal of energy by reflection and scattering.
The attenuation measured in decibels per centimetre (dB/cm)—is proportional to path length and frequency. Longer path lengths and higher frequencies produce greater attenuation. Thus the depth of the field available when imaging at higher frequency is shorter than at a lower frequency: higher frequencies (>10 MHz) are used to image objects near to the skin surface, while lower frequencies (3–5 MHz) are used for tissue deeper within the body.
Echoes are produced from boundaries between tissues with different mechanical properties. The amount reflected from an interface between two tissues depends on the difference in acoustic impedance (Table 2.5), a measure of the tissue’s resistance to distortion by US, in turn determined by the density and elasticity of the tissue. The intensity of the echo is proportional to the difference in acoustic impedance between the two tissues. For example, strong echoes are generated at a muscle:fat interface (intensity reflection coefficient = 1.5%). In most soft tissues, acoustic impedances are fairly similar, so the proportion of a sound pulse reflected at each interface is relatively small and most of the US energy is transmitted further into the body. If an US pulse encounters reflectors that have dimensions smaller than its wavelength (i.e. d < λ), then scattering occurs, with echoes reflected through a wide range of angles. For example, the speckled texture of organs like the liver is the result of interference between multiple
Table 2.5 acoustic impedance values of various tissues Tissue
× 10(6)
1.38 × 10(6)
1.48 × 10(6) liver 1.65 × 10(6) Bone 7.80 × 10(6)
scattered echoes. The depth of any structure giving rise to an echo can be determined from the time taken for the sound pulse to reach it and the time for the echo to return to the surface, because the velocity of sound is very similar in all soft tissue. Echoes returning from greater depths must be amplified to compensate for the attenuation.
2.4.2 Image generation
US pulses required for image generation are produced by transducers consisting of piezoelectric elements which also receive the reflected US pulse producing real-time images. Transducers may be linear, curvilinear, or radial. Most modern US machines use transducers consisting of multiple arrays with as many as 196 elements. The US beam is not uniform, altering in configuration as it moves away from the transducer. Initially the beam converges after leaving the transducer. This corresponds to the near field and is narrowest at its focal distance; it then diverges. The US beam diameter is affected by:
◆ US frequency: higher frequency US provides better image resolution as the near field is longer than at lower frequencies, but it is more heavily absorbed.
◆ Distance from the transducer
◆ Transducer diameter: the near field is longer with larger diameter transducers, thus image resolution is better.
◆ Use of mechanical or electronic focusing: focusing can only be achieved within the near field.
Amplification of received echoes is necessary for image generation. Immediately after echoes are received by the transducer, echoes are pre-amplified uniformly. Noise and clutter are reduced by removal of small signals and demodulation.
2.4.3
Ultrasound methods
Modern US scanners are based on B-mode imaging where echoes of differing magnitudes are displayed as a greyscale. However, different methods can be applied to further improve imaging or obtain functional information.
Tissue harmonic imaging is based on frequencies that are multiples of the frequency of the transmitted pulse (fundamental frequency). The second harmonic (twice the fundamental frequency) is most commonly used to generate an image. Artefacts and
clutter from multiple pulse reflections in surface tissues are also rejected, thus tissue harmonic imaging is ideal for patients with thick body walls who would normally be challenging and sub-optimally imaged.
Spatial compound imaging is a method to reduce speckle. Electronic steering of the US beam is used to image the same tissue multiple times using parallel beams oriented along different directions. Echoes from these multiple acquisitions are then averaged into a single composite image with the effect of reducing speckle and improving contrast and margin definition.
Extended field of view imaging allows a single composite image with a large field of view to be obtained. By slowly translating the transducer laterally across the region of interest, multiple images are acquired which are registered relative to each other to generate a single composite image. This is useful to assess vessels, for example for deep venous thrombosis or stenotic disease.
2.4.4 Doppler ultrasound
The Doppler principle states that there is a shift in frequency of a sound wave as the source of the sound moves relative to an observer. This change in frequency is called the Doppler frequency shift (DFS) which can be depicted by:
DFS=2IFBF/ccos ()ine ×× ×θ
where BF = blood flow; IF = incident frequency; c = speed of sound; θ = angle between the US beam and vascular flow.
This can be exploited to demonstrate tissue or organ vascularity. Doppler techniques include:
◆ Continuous wave (CW) Doppler: velocity is portrayed as a function of time. The blood flow patterns in the arteries can be shown by a simple CW Doppler device with two transducers, one for transmitting and one for receiving.
◆ Pulsed Doppler: the spatial distribution of blood flow can be obtained from Doppler analysis of US pulses. Different velocities are portrayed in a range of colour in a 2D image. By convention, red represents flow towards and blue away from the transducer. Different intensities of colour represent velocity and turbulence.
◆ Colour Doppler: B-mode images with superimposed Doppler information in colour.
2.4.5 Imaging with ultrasound contrast agents
These consist of gas microbubbles, stabilized by a shell of albumin or lipid, that have very different acoustic impedances from soft tissue. As the US contrast agent is injected into a vein and passes through the tissues being imaged the microbubbles are broken up by the US waves. The large number of small bubbles increases scatter, producing more echoes, enabling areas that are well perfused to be identified. For example, microbubbles enable differentiation of a benign liver lesion such as haemangioma or focal nodular hyperplasia from a metastasis (Figure 2.3).
Fig. 2.3 Contrast-enhanced uS images, with corresponding contrast-enhanced Ct showing a benign focal nodular hyperplasia.
2.5 Magnetic resonance imaging
MRI is a versatile technique, capable of multiplanar high-definition imaging of soft tissues with a good sensitivity and specificity. Whilst it does not carry the same risks of ionizing radiation exposure, special precautions to remove all ferromagnetic materials from the patient and to assess prosthetic implants for imaging suitability on online databases is required, for example cardiac pacemakers. It is also important to relate risk to magnetic field strength since an implant safe at one field strength may not be safe at another.
2.5.1
Magnetic resonance principles
Three main types of magnet are used in clinical MRI installations: permanent ferromagnets, and resistive and superconducting electromagnets. The most commonly used superconducting MRI scanners work at a field strength of 1.5 tesla. Lower field strengths may be preferred for specialist applications such as extremity imaging and higher field strengths confer advantages in image signal-to-noise, speed of acquisition or resolution.
MR imaging is based on the principle that positively-charged protons in the body water line up with or against the magnetic field Bo, depending on their energy. A relatively small number of them line up predominantly with the field, and are termed the net magnetization, Mo. For most applications, this is taken to lie along the main (Z) axis of the scanner, and therefore along the patient. The individual protons do not actually line up: they rotate or spin around the Z axis with a frequency directly proportional to the field strength: this is termed the Larmor frequency and is given by the Larmor equation: ωγoo = B
where ω o is the angular frequency of rotation, γ is the gyromagnetic ratio (constant of proportionality: fixed for a given nucleus) and B o the magnetic field strength in tesla