Natural Selection: Domains, Levels, and Challenges
George C. Williams
Behaviour and Social Evolution of Wasps: The Communal Aggregation Hypothesis
Yosiaki Ito
Life History Invariants: Some Explorations of Symmetry in Evolutionary Ecology
Eric L. Charnov
Quantitative Ecology and the Brown Trout
J. M. Elliott
Sexual Selection and the Barn Swallow
Anders Pape Møller
Ecology and Evolution in Anoxic Worlds
Tom Fenchel and Bland J. Finlay
Anolis Lizards of the Caribbean: Ecology, Evolution, and Plate Tectonics
Jonathan Roughgarden
From Individual Behaviour to Population Ecology
William J. Sutherland
Evolution of Social Insect Colonies: Sex Allocation and Kin Selection
Ross H. Crozier and Pekka Pamilo
Biological Invasions: Theory and Practice
Nanako Shigesada and Kohkichi Kawasaki
Cooperation Among Animals: An Evolutionary Perspective
Lee Alan Dugatkin
Natural Hybridization and Evolution
Michael L. Arnold
The Evolution of Sibling Rivalry
Douglas W. Mock and Geoffrey A. Parker
Asymmetry, Developmental Stability, and Evolution
Anders Pape Møller and John P. Swaddle
Metapopulation Ecology
Ilkka Hanski
Dynamic State Variable Models in Ecology: Methods and Applications
Colin W. Clark and Marc Mangel
The Origin, Expansion, and Demise of Plant Species
Donald A. Levin
The Spatial and Temporal Dynamics of Host-Parasitoid Interactions
Michael P. Hassell
The Ecology of Adaptive Radiation
Dolph Schluter
Parasites and the Behavior of Animals
Janice Moore
Evolutionary Ecology of Birds
Peter Bennett and Ian Owens
The Role of Chromosomal Change in Plant Evolution
Donald A. Levin
Living in Groups
Jens Krause and Graeme D. Ruxton
Stochastic Population Dynamics in Ecology and Conservation
Russell Lande, Steiner Engen, and Bernt-Erik Sæther
The Structure and Dynamics of Geographic Ranges
Kevin J. Gaston
Animal Signals
John Maynard Smith and David Harper
Evolutionary Ecology: The Trinidadian Guppy
Anne E. Magurran
Infectious Diseases in Primates: Behavior, Ecology, and Evolution
Charles L. Nunn and Sonia Altizer
Computational Molecular Evolution
Ziheng Yang
The Evolution and Emergence of RNA Viruses
Edward C. Holmes
Aboveground–Belowground Linkages: Biotic Interactions, Ecosystem Processes, and Global Change
Richard D. Bardgett and David A. Wardle
Principles of Social Evolution
Andrew F. G. Bourke
Maximum Entropy and Ecology: A Theory of Abundance, Distribution, and Energetics
John Harte
Ecological Speciation
Patrik Nosil
Energetic Food Webs: An Analysis of Real and Model Ecosystems
John C. Moore and Peter C. de Ruiter
Evolutionary Biomechanics: Selection, Phylogeny, and Constraint
Graham K. Taylor and Adrian L. R. Thomas
Quantitative Ecology and Evolutionary Biology: Integrating models with data
Otso Ovaskainen, Henrik de Knegt, and Maria del Mar Delgado
Mitonuclear Ecology
Geoffrey E. Hill
The Evolutionary Biology of Species
Timothy G. Barraclough
Game Theory in Biology: Concepts and Frontiers
John M. McNamara and Olof Leimar
Adaptation and the Brain
Susan D. Healy
Adaptation and the Brain
SUSAN D. HEALY
School of Biology, University of St Andrews, UK
Great Clarendon Street, Oxford, OX2 6DP, United Kingdom
Oxford University Press is a department of the University of Oxford. It furthers the University’s objective of excellence in research, scholarship, and education by publishing worldwide. Oxford is a registered trade mark of Oxford University Press in the UK and in certain other countries
All rights reserved. No part of this publication may be reproduced, stored in a retrieval system, or transmitted, in any form or by any means, without the prior permission in writing of Oxford University Press, or as expressly permitted by law, by licence or under terms agreed with the appropriate reprographics rights organization. Enquiries concerning reproduction outside the scope of the above should be sent to the Rights Department, Oxford University Press, at the address above
You must not circulate this work in any other form and you must impose this same condition on any acquirer
Published in the United States of America by Oxford University Press 198 Madison Avenue, New York, NY 10016, United States of America
British Library Cataloguing in Publication Data
Data available
Library of Congress Control Number: 2020949282
ISBN 978–0–19–954675–6 (hbk.)
ISBN 978–0–19–954676–3 (pbk.)
DOI: 10.1093/oso/9780199546756.001.0001
Printed and bound by CPI Group (UK) Ltd, Croydon, CR0 4YY
Links to third party websites are provided by Oxford in good faith and for information only. Oxford disclaims any responsibility for the materials contained in any third party website referenced in this work.
Acknowledgements
I want firstly to thank Paul Harvey and Bob May for generously giving me the opportunity to write this book. They had no idea quite how long it would take for me to do realize that opportunity. I am also very grateful to the team at Oxford University Press—Ian Sherman, Charles Bath, Helen Eaton, Bethany Kershaw, and Lucy Nash— whose patience and goodwill I have tried and tested for over a decade. Your endless support finally overcame my seemingly endless prevarications.
I am very grateful to a number of people who gave me invaluable advice and feedback on early drafts of chapters: Rob Barton, Jackie Chappell, Zach Hall, Jo Madden, David Pritchard, Sally Street, Shoko Sugasawa, and Maria Tello Ramos. I am also very grateful to John and Gab Chainey, Leigh and Carol Simmons, and members of the CEB at the University of Western Australia in Perth for being wonderful hosts and providing a fun and intellectually stimulating environment for a sabbatical in 2015, where early versions of chapters were drafted. David Shuker read this version in its entirety, as well as green-penning and emoji-ing several earlier drafts.
Thank you to my lab group and collaborators who have put up with my tirades on brain size analyses for a long, long time. Some have been especially patient/encouraging in offering a sounding board: Ida Bailey, Alexis Breen, Nora Carlson, Sophie Edwards, Andrea Griffin, Lauren Guillette, Zach Hall, Andy Hurly, Eira Ihalainen, Rachael Marshall, Simone Meddle, Kate Morgan, Felicity Muth, David Pritchard, Candy Rowe, Shoko Sugasawa, and Maria Tello Ramos.
Making the miles seem few, my family have always been there supporting my life on the other side of the planet, but they have been especially encouraging over the last few months: Denis, Roger, Conrad, Fiona, and Tash, thank you. Helen would be proud, again.
Thank you to Candy Rowe, without whom this book would not have begun and who has been a fab collaborator on my thinking about brain size. But this book would not be seeing the light of day without the day-in, day-out encouragement and positive critique from my partner, David Shuker. He not only listened to countless harangues on brain size and intelligence but made me explain unfathomable arguments and get rid of the first nearly full draft. Through his constant support he made me make this version so very much better as a result. Thank you. There is a lot of work to be done by those two words, so the least I can do is to say them again. Thank you.
1 Introduction
Why does brain size vary among animal species? Although Aristotle may have considered the heart to be the seat of the intellect, it has been a good long while since we have known that it is our brain that enables us to think all sorts of sensible and crazy things, that causes our dreams, good and bad, happy and sad, that helps us to plan our day, our week, or our year. And when it begins to fail we start to lose something of ourselves. Throughout our lives we know that it is our brain that allows us to learn to read, to spell, to do maths, all abilities that often form the basis of what is collectively called intelligence. Furthermore, when we look at the animals around us, our pets, the birds in our gardens, the cows and sheep in the fields, the spider climbing the wall, the fly buzzing at the window, we think we are smarter than they are. After all, we are the ones doing the reading, the spelling, the maths, the inventing of machines, and the flying of rockets to the moon. And if you did not know it already, it will be perhaps unsurprising to find that we have brains that are in fact pretty large. Indeed, there are few animals on the planet that have brains that are larger, especially if we allow for differences in body size: elephants and whales do have larger brains than we do, but we are smarter than them (witness all the things we do that they do not: maths, rockets, etc.).
For most people, the advantages of our large brains are clear and the evidence unequivocal. But the question then is, why humans? Why don’t all animals have ‘big’ brains? Having invented fire, tools, clothes, house building, machines to transport us over all terrains, we can now occupy almost all parts of the planet. Very few other organisms could say the same (bar the microbiome we carry along with us). What in our evolutionary history has led us to this preeminent position in the animal kingdom, and has enabled us to exploit our planet almost at will (at least for now)?
Academic attempts to figure out how and when we got to be so special have largely been the domain of anthropologists, who look at extant humans and other primates, as well as the fossil evidence of our common ancestors. Evolutionary biologists have perhaps been rather less interested in the specifics of human evolution, although the genomics era has changed that to some extent, as we no longer rely just on haphazard fossil finds. Rather, evolutionary biologists are, typically, interested in explaining patterns of variation, and it is difficult to see a pattern in a single species, especially with a patchy fossil record. Given the patchiness of that record for pretty much every species, an evolutionary biologist interested in seeing how and why some particular trait has evolved, turns either to an experimental system (often invertebrate) where generation times are typically short, or to the comparative method. As the name implies, this
latter method enables the comparison of trait values across a number of species, revealing (or not) a pattern to trait values that is coincident with variation in some possible causal factor. The comparative method in evolution goes all the way back to Darwin, but modern comparative analyses explicitly utilize phylogenetic information to try to separate evolutionary signals from shared phylogenetic noise. Early examples of phylogenetically informed analyses include correlations between age at which female mammals first reproduce and life expectancy (Harvey and Zammuto, 1985), the brightness of male plumage in birds and parasite prevalence (Read, 1987), and the role of diet on carnivore homerange size (Gittleman and Harvey, 1982). Since then, phylogenetic comparative methods have been widely used to examine trait variation across species in a vast array of traits (Harvey and Pagel, 1991). Of specific relevance here is that the comparative method has played, and continues to play, the major role in evolutionary discussions of why brains vary in size, and why some species have bigger brains than others.
The first substantial comparative analyses of brain size were enabled by a number of data sets of bird and primate brain sizes (e.g. Portmann, 1944; Stephan et al., 1981, 1988; Jolicoeur et al., 1984; see Table 2.1). Since the early 1980s tens, if not hundreds, of comparative analyses of variation in brain size have been published, proffering a bewildering array of competing or overlapping explanations. For example, primates with bigger brains live in larger social groups, fruiteating primates have larger brains than do leafeating primates, birds in longterm pair bonds have larger brains than those that are less faithful, bats with small testes have larger brains than bats with large testes, bats that fly through complex habitats have bigger brains than bats that do not need such flight agility, whales that live in social groups have larger brains than whales that live alone or in small groups, and many, many more.
How might one make sense of all of these correlations? Is there really no single factor that is key to changing the size of an animal’s brain? Do birds, mammals, reptiles, fish, amphibia (and invertebrates) all have such different brains and lead such different lives that we need distinct explanations for each taxonomic group? Furthermore, does each lower taxonomic group (e.g. within the mammals: primates, cetaceans, bats) have its own explanation?
In this book I will argue that to date all the attempts to find this one allencompassing explanation have failed. They have failed for one or more of a number of key reasons: (1) it has proved statistically problematic to include all of the possible explanatory variables in unified analyses; (2) the brain size data are themselves problematic, both in terms of precision of measurement and in the function imputed to them (more of this in Chapter 2); and (3) the categorization and quantification of the explanatory variables are open to debate, as we nearly always rely on derived, ‘proxy’ variables that we hope capture the nature of the proposed causal agent.
How to go forward, given these failures? This book represents an attempt to bring together the complicated and diverse history of attempts to explain the evolution of brain size across the last 50 years or so, and to examine critically what these attempts have told us. The aims of this book are therefore fourfold. First, I will describe the limitations of previous iterations of brain size comparative analyses. This is not so
much as to admit defeat up until this point, because some results do indeed seem more robust than others. Rather, it is to highlight that reanalysing the same data, again and again, with similar failings in methods and inference, is not moving us very far forward, however easy it is to plug data into the latest R package. Second, by laying out as many of the possible explanations together in the same place (if not in the same table, at least in the same book), I will provide an opportunity to stand back and see how competing explanations do or do not fit together. For example, just how different are explanations for brain size evolution based on foraging versus sociality, since many social species forage together? Third, throughout I will emphasize where new data, and new approaches, are needed to take our understanding of brain evolution truly forward. Part of this will involve hard thinking, especially when we use terms like ‘foraging’ and ‘sociality’, that in fact are shorthand for a whole variety of adaptations—sensory, locomotor, cognitive—that we might expect will shape the size and structure of components of the brain. Finally, throughout the book, there will be the implicit, and sometimes explicit, critique of the very question at the beginning of the Introduction: why does brain size vary among animal species? If the brain is heterogeneous, controlling countless processes (not all neural), and it outsources various of its functions to sense organs and the periphery, is a holistic notion of brain size even a meaningful concept? Most importantly of all, is brain size a useful proxy of intelligence?
As such, this book is both a review and a critique of the field of brain size evolution. By the end of the book I want the reader to have gained a panoramic view of the work we have engaged in over the last five decades or so, and what has been more or less successful, providing pointers of where we might go next. But I am happy to be candid about the challenge that writing this book comprises. A critique I coauthored with Candy Rowe, well over a decade ago, whilst briefly intellectually satisfying, failed to achieve what we hoped for at the time. Healy and Rowe (2007) provided an indepth critique of the study of brain size evolution, focusing in particular on methodological issues, with the (implicit) intention of reducing the number of analyses undertaken that produced yet another explanation for the variation in brain size. At that time, there were some 20, apparently independent, variables that explained a significant proportion of the variation in brain size for both primates and birds, although the two lists of variables were not exactly the same for the two taxonomic groups. For at least two reasons, this slew of explanations seemed curious to us. Firstly, about 20 years previously, there had been a similar, although substantially smaller, range of explanations proposed to explain variation in brain size, which by 2006 appeared to have been overlooked. Secondly, most of the more recent explanations were being put forward in isolation with regard to the other possibilities and unified statistical analyses were not being attempted. While it is possible that each of these 20 or more factors may make a significant contribution to explaining the considerable interspecific variation in brain size across animals, it seemed at least plausible to us that some of these factors might be closely correlated and, therefore, much less relevant alone than it first appeared. It seemed that the field was due a good dose of critical selfexamination before the next big step could be taken in understanding why brains vary so much in size.
But Healy and Rowe (2007) signally failed to have anything of this sort of effect. It also failed to increase the quality of the data analysed and, really, has had remarkably little impact on the content of the field, although it has been quite well cited (directors of research asked us to write more of the same, such is modern academic life). However, with hindsight, it seems that variation in brain size is both too interesting, and its causal factors too little understood, for such an undertaking as ours to be anything other than doomed to failure.
Here, then, my aims are not nearly so ambitious. Rather I acknowledge at the outset that there is no smoking gun to this story, no murder mystery solved in the concluding chapter. That might seem disappointing, but I would argue that most of us acknowledge that when we answer one problem, in doing so we often become aware of other questions, that emerge from solving that first question. Indeed, that is the hook that keeps us coming back and has us working evenings and weekends: a quest that might seem endless but not fruitless. So, with that more positive outlook in mind, here I attempt to take each explanation at face value and then see how plausible it is when held up in the face of the proposed supportive data. Can some explanations be seen to be less compelling than others, or less well supported? Will it become clearer what is really needed to strengthen the case for any or all of the suggested explanations?
In the laying out of several hundred papers, I decided that the bewildering array of explanations meant that some sort of categorization needed to be imposed. The first was based on the decision that some papers proposed a causal explanation for variation in brain size while others proposed a mechanistic explanation. These latter papers are not considered in what follows and the reasoning is thus: development, physiology, and other mechanistic factors will all have significant impacts on the size of a brain and will explain how brains are able to change in size. It is therefore crucial to understand the mechanism(s) by which brain structures can change in size across evolutionary time. But here I focus on the potential natural selection pressures (in a Tinbergian sense, the functional why) that may have led to some brains being larger than others, i.e. the role adaptation plays in changing brain size. These selection pressures fall into five broad categories: ecology, innovation, technical, sexual, and social, as these represent those most commonly favoured groups of explanations.
Before considering each of these in turn, however, there are two key issues that need to be addressed: (1) the measurement of brain size, and (2) whether brain size represents intelligence. Chapter 2, then, contains a discussion of various ways to measure brain size and their pros and cons, while Chapter 3 contains a discussion of the relationship between brain size and cognitive abilities. In the chapters (Chapters 4–8) that follow I address each of the five selection pressures in turn. In the concluding chapter (Chapter 9) I provide something of a summary and some suggestions for future directions.
The Measurable Brain
Why do some animals have big brains? This book is all about attempts to answer this question using comparative evolutionary analyses. The key to the success of a comparative evolutionary analysis is sample size, the larger the better. To detect a pattern in the occurrence of large brains, we need lots of brains from lots of species. These data have turned out to be pretty challenging to collect, and so the brain size data used in the analyses described in Chapters 4–8 come from a variety of sources (Table 2.1). Researchers have also used a variety of methods for measuring brain size, in particular methods that allow for a high throughput. This has meant that brains have been measured in part, or as a whole, or that they have been sliced, weighed, scanned, and reduced to numbers of neurons in a blender. Both because of the difficulties in getting large numbers of real brains, and the considerable resources offered by museum collections in terms of historical skull collections, a substantial proportion of the comparative analyses of brain size have inferred brain size from skull capacity. In this chapter, to provide some understanding of the data that have been used for the many comparative analyses I will discuss, I will describe the methods that have contributed to the brain size data shown in Table 2.1. The data in Table 2.1 form the large majority of the data used in the analyses discussed in the following chapters. I will also include descriptions of other methods that have been developed more recently which, while they may not have contributed to the data in Table 2.1, have been either the basis for other comparative analyses I describe later, or may be useful sources for providing data in the future.
Brains have been measured in a variety of ways, not least because there are virtues and drawbacks to each method. I will include a brief description of these. I will then consider the relative merits of combining data from more than one source, or more than one kind of measurement. Because the data available for these comparative analyses are typically limited, combining data (e.g. brain weights combined with endocast volumes), or transforming data from one form to another (e.g. brain volume into brain weight) has been reasonably common. Data combined using such techniques may or may not lead to spurious associations (Healy and Rowe, 2007). I also want to use this chapter to get inside the brain itself in order to consider what whole brain size means, in terms of its structure and function. Here, I suggest that we consider a brain as, at the very least, a sum of its parts, rather than necessarily being just a single structure.
Table 2.1 The major sources of data used in the analyses in Chapters 4–8.
Data source
Measurement type
Crile and Quiring 1940
Brain mass
Portmann 1944, 1947 Brain mass
Taxonomic group No. of species/ individuals (if known)
Taxonomic group No. of species/ individuals (if known)
Birds 166/1,812
Birds 82/157
Birds 417/2,577
Birds 1,482/10,364
Birds 39/584
Odontocetes 25
Marsupials 182/1,257
Primates 232/3,813
Primates and cetaceans 930/2,000
Birds 108/2,721
Although there are rapid technological changes afoot to enable live animal, in situ, measurements of brain structure and function (e.g. Hecht et al., 2019), these are yet to encompass sample sizes of the magnitude desirable for comparative analyses. About half of the brain size measurements used in comparative analyses have come from brain tissue from dead animals. But even when brain tissue is available, measurements of actual brain size are often not made in exactly the same way. To begin with, some of the data come from animals that have been killed in order for their brains to be measured, while other data have come from animals that have been acquired serendipitously, e.g. that died or were killed for some other reason rather than to acquire the brain.
If the brain is taken from an animal for the explicit purpose of measurement, it is possible (and generally appropriate) to begin processing the brain prior to measurement, and prior to removal from the skull. One common method is to kill the animal using an overdose of anaesthetic and then perfuse it, first with an anti-coagulant, then with a suitable perfusant (e.g. Krebs et al., 1989 used a lethal dose of sodium pentabarbitone, perfused transcardially with physiological saline, followed by formalin/ saline and then fixed the tissue in 30 per cent sucrose/formalin; Stephan et al., 1981; Day et al., 2005). This should mean that the perfusant will reach into even small
capillaries, resulting in a well-preserved brain that can be sliced and stained for measurement. In addition to the preservation of a structurally sound brain, this method allows for relatively straightforward and accurate, albeit laborious, volumetric measurement, both of parts of the brain as well as the entire brain itself. However, that is only possible if the interior anatomical boundaries of regions of known structure and function can be identified (e.g. Krebs et al., 1989; Stephan et al., 1981; Day et al., 2005). Brain map atlases can help to guide researchers even when the species of interest is not one for which there is an atlas already (e.g. rat: Swanson, 2004; Anna’s hummingbird Calypte anna: Stegeman, 2013; canary: Vellema et al., 2011; pigeon: Güntürkün et al., 2013; zebra finch Taeniopygia guttata: Poirier et al., 2008). Following sectioning into a known number of sections of known width, the area and then volume of the brain slice or identified region(s) on the slice can be measured. In earlier studies this measurement was achieved by projecting the section onto photographic paper, drawing the borders, cutting out the paper, and weighing it (e.g. Stephan et al., 1981). The volumes of successive sections, and thus the volume of the entire region or brain, can then be calculated (in the Krebs et al., 1989 paper the formula of a truncated cone was used to approximate the volumes of the hippocampus and telencephalon).
The downsides (which are not insignificant) of this method include killing the animal, and the skill and specialist equipment required (although this latter can be taken into the field with a bit of preparation: Airey et al., 2000). Furthermore, loss of measurement accuracy can arise from various parts of this process. Among them is that slicing may damage sections, and that staining the sections will often shrink and ruffle them. Moreover, there is a lot of work in preparing the tissue (sectioning the brain, staining, and mounting the sections) and in the quantification of sections. There is also a change in size as a result of the perfusion itself, which may vary depending on the size of brain being prepared, and from laboratory to laboratory. But there are significant upsides to this method. While it is an effective way to measure brain size, volumes calculated from serial sections are especially useful for quantifying parts of the brain (provided there is good neuroanatomical definition of functional areas). Another advantage of this method is that prior to the collection of the brain the individual’s sex, and sometimes age, can be identified. Furthermore, measurement of body size can be matched to brain size on an individual by individual basis (e.g. Healy et al., 1996; Healy and Krebs, 1993), which is important for nearly all of the analyses that follow (see Chapters 4–8). Using species’ averages instead of brain size and body size loses vast amounts of potentially crucial data.
Herculano-Houzel’s isotropic fractionator method of neuron counting deals with some of these issues (e.g. Herculano-Houzel, 2010, 2011, 2016; Herculano-Houzel and Lent, 2005), especially the time and effort spent on preparing the material (which does require perfusion but need not always begin with live animals). This method is unlike any of the other methods so is worth describing in a bit of detail. It works best with tissue that has been fixed in preservative for some period of time (e.g. a couple of weeks or longer), because the method relies on the researcher’s ability to identify and count neurons after the brain has been reduced to its constituent cells (a soup, as Herculano-Houzel, 2016 describes it), which is not possible if fresh, unfixed tissue is
used (the nuclei will not survive the grinding up of the tissue). A fixative like paraformaldehyde, which cross-links protein molecules in the tissue, leaves the tissue hard and mechanically stable. The nuclear membrane becomes especially well fixed because it is protein rich. This fixation is useful because of the mechanical stress that the tissue is put under during the fractionation process. Once well fixed, the whole brain can be cut up into small pieces, or anatomically and functionally meaningful regions can be dissected out first, which can then be cut into small pieces and fractionated separately. The pieces go into Triton X-100 detergent and the solution is poured into a homogenizer, which dissolves cell membranes but leaves the cell nuclei intact. One then removes the nuclei and adds florescent DNA dye plus sufficient saline solution to produce a volume of liquid that can be read accurately on a measuring cylinder, or an immunocytochemical marker such as Neuronal Nuclear antigen. A bit of agitation of the solution to distribute the nuclei evenly and then it just remains to remove an aliquot for counting the nuclei using a florescent microscope. One need not measure all of the nuclei if the agitation really has evenly distributed the nuclei throughout the solution, and it takes only a small number of same-volume aliquots to confirm the repeatability of counts.
The estimation of nuclei number is as accurate as is typical for stereology (Herculano-Houzel et al., 2015; Neves et al., 2019). The upsides of this method are several, including no need for fresh material or for histological processing, rapid processing time (it can take just a day, depending on the amount of tissue to fractionate), there are no concerns over issues such as tissue shrinkage (all nuclei are recovered), the entire brain or region can be sampled, it is as accurate as other, more traditional methods such as stereology, and, finally, counting can be automated using a flow cytometer (Herculano-Houzel et al., 2015). The downsides are far fewer and primarily concern the loss of the tissue in the fractionation process, should there be any interest in the spatial distribution of cells. Although this method has not contributed any of the data to the analyses that follow in Chapters 4–8, it is a method that might enable the collection of data from large numbers of species, including from museum collections (Burger et al., 2019). It does, however, require a better understanding than is current of the ways in which neuron number may vary in function across species. Furthermore, if this analysis is to be done with brain regions rather than whole brains, it will also need some knowledge of brain anatomy.
Both the slicing of perfused brains and the counting of neurons enable some kind of within-brain measurement of different regions, in terms of volume in the first case and neuron number in the second. But the difficulty in obtaining material to measure brain volume using serial brain sections or neuron counting means, however, that relatively few brains have been put through these kinds of measurement procedures. As can be seen from Table 2.1, nearly half of the brain data used in the analyses described in Chapters 4–8 come from brain weights. Weighing brains is a much more straightforward method than either perfusion or neuron counting and takes a lot less time, even than counting neurons. It can also lead to much bigger sample sizes through the use of already dead specimens. But there are a few important limitations. For example, brains taken from dead animals will be in varying states of decay by the
time measurement occurs, as deterioration sets in immediately after death. Standardizing the time between death and measurement will be difficult, if not impossible (and often not reported). Furthermore, brain weights will depend on whether they are weighed fresh or after drying, freezing, or having been kept in preservative. The material, for example, used by Garamszegi et al. (2005a, 2005b) came from birds weighed after freezing, whilst Crile and Quiring (1940) and Garamszegi et al. (2002) used birds post mortem without freezing. It is unclear how comparable such data are.
Finally, it is possible in some cases to measure brain dimensions (length, height, and width) externally. For example, Kotrschal et al. (2013) used dorsal photographs taken through the semi-transparent skull plate of newborn fish, while Gonda et al. (2009) measured not only whole brains of nine-spined sticklebacks Pungitius pungitius but also the bulbus olfactorius, the telencephalon, the optic tectum, the cerebellum, and the hypothalamus, from digital photographs.
Largely because of the difficulty of acquiring live animals, the other half of the data used in most of the analyses (Table 2.1) do not come from any of these methods. Sacrificing a large number of animals for comparative analyses on brain size and structure, always uncommon, is now even rarer. Although one may hope that scanning, e.g. via Magnetic Resonance Imaging (Hecht et al., 2019), which is an even more accurate and less invasive solution than those described above, will eventually solve this problem, scanning methods are currently expensive, access to such facilities is limited, and animals need to be transported to the scanner. Given that measuring actual brain size is a significant barrier to collecting large amounts of data, one solution has been to measure the box in which it is carried, i.e. the skull. Indeed, this looks like by far the most straightforward way to collect lots of data. However, it does assume that skull volume is a close proxy of brain size.
2.2 Measuring skull volumes
The skull has significant advantages over the brain with regard to its measurement, both biologically and logistically. For example, once the animal reaches adulthood, the size of its skull does not change (at least in determinate growers), even as the animal ages or after it dies. The significant logistical advantages to measuring skull size or capacity include the relatively straightforward preparation of the skull for measurement (irrespective of time of death of the animal): one only needs to remove the skin/hair/feathers and then the remains of the brain without concern for keeping it for measurement. Alternatively, using skulls allows measurements of animals that have been both recently and long dead, including now extinct species and fossils, which may increase the sample size, both intra- and interspecifically, to a significant extent (e.g. Aiello and Dunbar, 1993; Burish et al., 2004; Watanabe et al., 2019; Knoll and Kawabe, 2020).
Both the internal capacity of the skull and its external surface have been used to provide brain size measurements. External measurements are typically made using
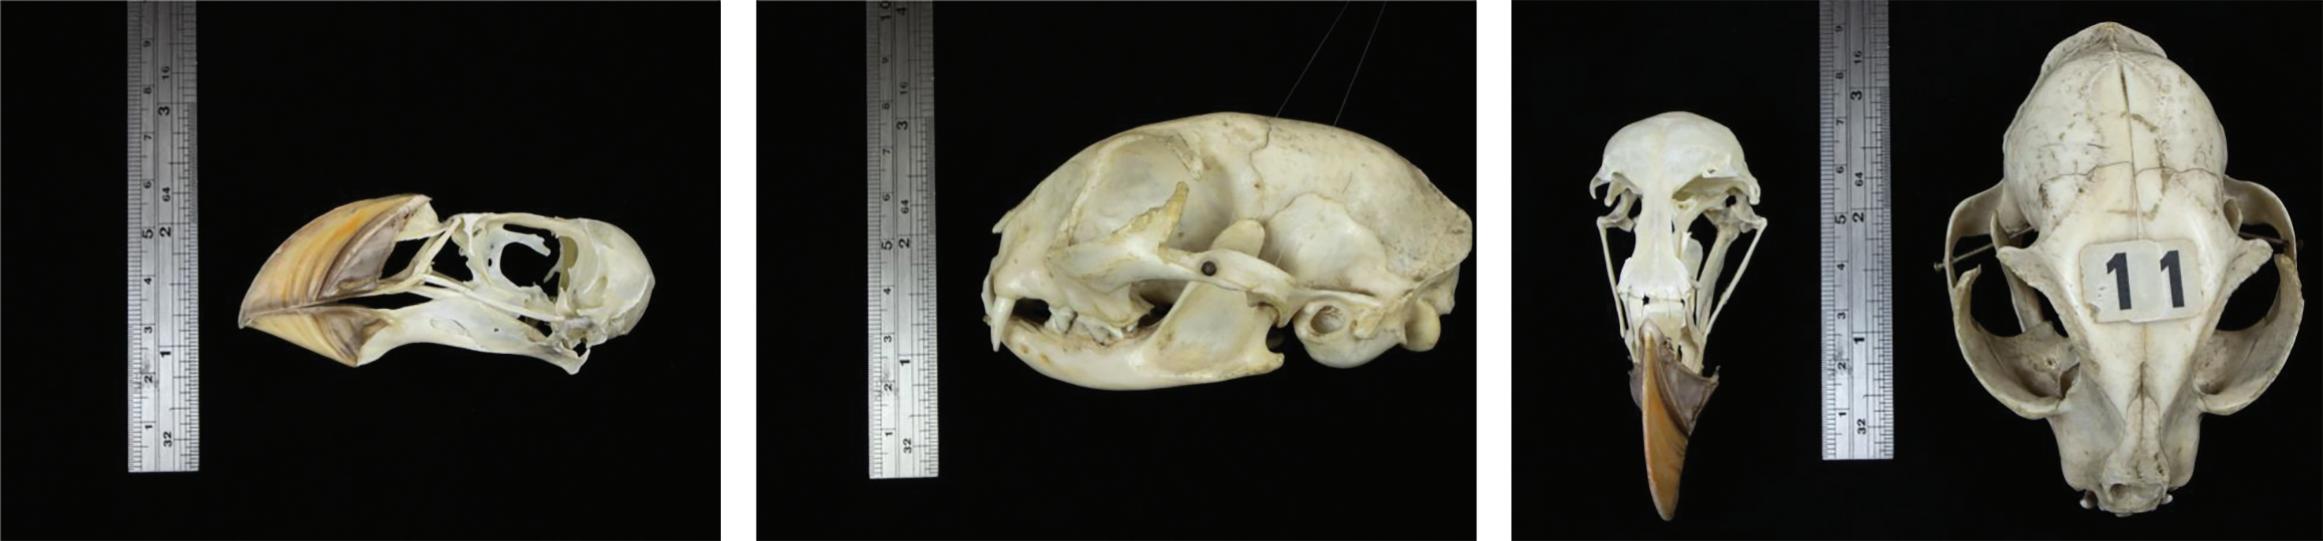
calipers, whereby multiple lengths are measured (e.g. head height, length, breadth: Møller, 2009), or by a tape measure wound around the head at a consistent position (if this seems very old-fashioned, it is). This latter, ‘low-tech’ method has been used primarily for measuring skull sizes within groups of humans (e.g. Mortimer et al., 2003; Wang et al., 2019), and is especially quick and easy. However, using calipers or a tape measure may make comparisons across species a little challenging, for instance when those species have skulls that differ subtly or dramatically in shape, or include features such as heavy brow ridges and other changes to the skull used for defence (e.g. in those mammals whereby the males literally engage in head-to-head combat). The crudity of using a tape measure may seem replaceable by using calipers, which might allow greater precision of measurement of sub-components of the skull. However, due to variation in the shape of skulls, especially through modifications caused by major features such as eye sockets and jaw attachments, these external measures may contain significant measurement error, both within as well as across species. Perhaps more importantly, changes in external features may not map straightforwardly to differences—if any—of the brains inside (Figure 2.1).
By far the most common method for measuring skulls has been to assess their internal capacity by filling the skull case with lead shot, glass beads, seed, and so on. Although use of this method began in the nineteenth century, such measures are still being taken today (e.g. Iwaniuk and Nelson, 2001, 2002, 2003; Marino, 1998, 1999; Iwaniuk, 2001; Isler et al., 2008; Bininda-Emonds, 2000). And it is certainly simple. The skull is filled with the lead shot (for example), which is then decanted into a cylinder for measurement (or weighing: e.g. Isler et al., 2008). This is a hugely appealing method due to its ease: pour the material into the skull, tamp it down a bit, top up as necessary, and then tip out into the measuring cylinder. It can be a rather crude method though, as described by Stephen Jay Gould in his Mismeasure of Man (1996), and researchers reusing skulls by filling with one kind of material may find that they tip out both their material and that from a previous measurer. But it does have considerable advantages over all of the alternatives: it is very cheap, relatively quick to do, the measuring apparatus can be transported to the skulls (which allows access to specimens in geographically widespread collections), and it is relatively straightforward
Source: Photographs by Steve Smart.
Fig. 2.1 Left plate: The left-hand side of a puffin Fratercula sp. skull (with bill). Ruler for scale. Middle plate: The left-hand side of the skull of a domestic cat. Right plate: Top-down photographs of skulls of a puffin and a domestic cat (same skulls as in the photographs to the left and middle).
to assess repeatability in the measure. For example, Iwaniuk and Nelson (2001) estimated a sampling error of 1.2 per cent, after measuring a single specimen 20 times, although repeatabilities are best tested across multiple specimens. Similarly, Eisenberg and Wilson (1978) measured four individuals twice, although they did not provide error measures, while Ashwell reached accuracies of within 0.02 ml for volumes less than 2.5 ml, and around 1.0 ml for volumes up to 100 ml, although it is not clear how much retesting is required for this level of accuracy.
Other, more twenty-first-century, measures, such as x-ray photography (Madden, 2001) or computerized tomography (CT) scanning have also been used to measure skull volume. For example, Madden’s x-ray photography involved firstly aligning the x-ray source so that photographs of skulls were taken from a constant angle, and then taking two orthogonal images, one lateral and one dorso-ventral, with a metal bar of known length placed along the centre of the skull. The length, width, and height of the skull cavity (rather than measures taken from the exterior) were measured and these measures were used to calculate brain-cavity volume using the formula for an ellipsoid (π × length × width × height). A variety of authors have used CT scanning to do something similar (e.g. Sakai, 2011; Logan and Palmstrom, 2015; Carril et al., 2016; Macrì et al., 2019).
Although these modes of measurement are still relatively expensive and involve equipment that is not readily moved from skull collection to skull collection, they are beginning to transform paleoneuroecology (Knoll and Kawabe, 2020). They will also become cheaper and more available, which will be important for the amount of data required for a comparative analysis.
Whether measured inside or out, the skull is the most accessible and non-invasive source of data for estimating the brain size of living animals. Be it by calipers or tape measure, external measures of the skull can be taken from a live animal restrained briefly (although one would want to calibrate such head size measures with skull capacity and the size of the brain itself) and an animal need not be alive at all for measuring its skull volume.
2.3 Variation in brain size measurement
Whichever method is used, it is important that measurements are accurate, and a number of authors have been able to use the same individuals to compare the measurements made by different methods. For example, Iwaniuk and Nelson (2002) weighed brains from 24 budgerigars Melopsittacus undulatus, then filled the skulls of those birds (the pieces were put back together after the brain had been removed) and transformed these endocranial volumes with the value for density of fresh brain tissue (1.036 g/ml). These authors found a strong correlation (Z = 7.77, n = 24, P < 0.01, r = 0.94) between the two sets of measurements. Caution should perhaps still prevail, however, as Taylor et al. (2006) found a considerable difference between data collected from MRI scans of koala Phascolarctos cinereus brains and data collected from cadaver specimens. Furthermore, Logan and Palmstrom (2015) encountered a similar
issue when they measured 40 grackle skulls by using CT scans, external linear measures, and then by filling them with glass beads (they also repeated these measurements twice). These authors found high consistency between the two measurements obtained by CT scan and bead volume, but not for the volumes calculated by external linear measurements (skull length × height × width). The volumes calculated from the linear measurements also did not correlate well enough with volumes calculated from CT scans to resolve individual differences in endocranial volume. There was a similar problem with bead filling. Logan and Palmstrom also found that males had larger volumes than did females, irrespective of measurement method, and that there was an effect of the bird’s age, which depended on sex (smaller volumes for immature than for adult males, but larger volumes for immature than for adult females). This variation among studies in the consistency of volumes measured by different techniques suggests that more effort of this kind should be made, especially in terms of making multiple measurements on the same animals.
But in many instances, the researchers are not in a position to make these kinds of comparison because their data have come from the literature, rather than from brains or skulls they have measured themselves. However, it is still possible to check that data that come from different sources are comparable, and there have been more checks of this kind because, due to the dependence of a comparative analysis on big sample sizes (the more the better), many researchers have combined data from more than one source. Sometimes this has meant a combination of the same kind of data (e.g. brain weight, but just measured by different researchers). Alternatively, this has meant combining different measures (e.g. brain weight together with endocranial volume). How much the differences in measurement method contribute to variation in the data is often not clear though (Sol and Lefebvre, 2000).
Although most authors who have combined data across sources have not had access to different measurements on the same animals, sometimes they have been able to combine data for individuals of the same species, which allows for some kind of assessment of the differences in the two data sets. For example, Burish et al. (2004) combined 138 brain and body weights from Portmann’s (1947) data with 28 species from Boire and Baron (1994), which included 12 species also measured by Portmann. But because Portmann reported his species brain components as ‘indices normalized to the brain core’ of a member of the order Galliformes of comparable brain size, this merging of data sets was not straightforward. The difference between 11 of the species in common was resolved by taking an average for each, while for a twelfth species, the value for the wild chicken was preferred over that for a domesticated chicken, given data on telencephalic reduction in domesticated chicken (Rehkämper et al., 2003).
Others have looked for correlations between the data sets to be combined. For example, Møller and Erritzøe (2015; see also Garamszegi et al., 2005b) found that the data they measured were strongly correlated with data from the literature (e.g. F(34, 206) = 119.37, P < 0.001; r = 0.980 with Crile and Quiring, 1940; Portmann, 1947; Armstrong and Bergeron, 1985). Similarly, Iwaniuk and Nelson (2001) found no differences between the volumes of fresh brains (calculated by dividing brain weight by the density of fresh brain tissue) and endocranial volume data taken from different
individuals of five species of waterfowl (paired t-test, t4 = 0.25, p = 0.81; Wilcoxon signed ranks, t5 = 0.41, p = 0.69). Iwaniuk and Nelson (2002) and Boddy et al. (2012) combined brain mass data together with endocranial volumes by calculating estimated brain mass for a number of bird species for which they had endocranial volumes (brain mass = endocranial volume × the density of fresh brain issue; there was no difference between the values from the two measures in Iwaniuk and Nelson’s comparison of 81 species: t81 = 0.42, p = 0.68). Finally, others have used allometry to impute missing data. For example, given that the scaling of the size of the neocortex with whole brain size is known, then species without neocortex values can be included in analyses if there are whole brain data (whether mass or endocranial volumes) available for those species (e.g. DeCasien et al., 2017).
It appears, then, that when the data sets contain different individuals as well as brain sizes measured by different methods, there is more evidence of compatibility among the data sets than when different kinds of measures are taken from the same individual. This is a little curious but may be because Logan and Palmstrom (2015), in particular, applied a rather stringent criterion for accepting that the measures were the same, which was the ability to identify individuals in the comparison. When they simply looked for correlations between species averages, they did find quite a strong relationship between CT scan data and bead volume data. But because there have been so few cross-method comparisons, it is very difficult to determine what impact they might have on the outcome of comparative analyses. However, if one or the other is to be used as a proxy of an individual’s cognitive ability (for example), then it seems important to know which is the suitable proxy and which is not.
2.4 Body size measurement
Whether the measurements of brain volume or weight or endocranial volume are accurate, it is crucial to understand that body size is the best explanation for brain size: the bigger the animal the bigger its brain is likely to be. And yet, with the exception of the Møller and Erritzøe avian data (some 3,000 individuals), most of the comparative analyses are based on data that come from a range of sources, comprise few individuals per species, and, frequently, the data on body size come from yet other sources in the literature. I am not going to discuss the pros and cons of using absolute or relative brain size, or of some extrapolation of brain size such as the encephalization quotients of Jerison (1973: EQ = brain mass ⁄ 0.12 × body mass2⁄3) or of Martin (1984: EQ = brain mass ⁄ 0.059 × body mass0.76). Not only has this issue been discussed elsewhere, but here the pertinent point is that body size data typically do not come from the same individuals as those from which the brain size data were collected. Rather, the body size data come from diverse literature sources. This requires adult body size to be an invariant feature of a species, even though sexual dimorphism is an obvious source of variation, at least for many mammals (see Chapter 7). Body size also depends on the animal’s geographic location, the season, its age, and more. How this affects our understanding of the variation in brain size is not clear. Iwaniuk and
Nelson (2001) were unusual in considering this issue, as for some of the museum specimens (waterfowl) for which they collected endocranial volumes they also had body weight data. They did not find a difference between the museum body weights and body weight data for the same species cited in the literature (t40 = 1.55, p = 0.13), but a single check on this potential source of variation is not enormously comforting.
2.5 Measuring parts of the brain
All of the discussion above, and almost all of the comparative analyses themselves, are predicated on the assumption that brain size is a coherent entity and that selection acts on it as a whole. But, as will become even more obvious in the examples described in the following chapters, brains can, and do, vary a lot between individuals in the same species and among species to little outward effect with respect to whole brain size. For example, the hippocampus, a part of the brain that processes spatial information, can be >10 per cent larger in some songbirds than it is in other species while there is no detectable difference in whole brain size due to the difference in hippocampal volume (e.g. Krebs et al., 1989; Healy et al., 1996). In such instances, adaptations will only be detected if brain regions can be delineated and quantified separately. This can be done either by slicing or, increasingly, by functional scanning (e.g. Hecht et al., 2019).
2.6 Summary
Although there are a variety of ways that have been used to measure brain size, each with their advantages and disadvantages, most of the data used in the comparative analyses to be described in Chapters 4–8 come from brain masses or from endocranial volumes. Both of these are relatively easy-to-use methods, cheap, quick, and entailing very little expert skill. They can be applied to lots of material and, for endocranial volumes in particular, enable the use of museum specimens. CT scanning seems likely to replace filling skulls with beads and seeds, but more data on the relationship between the volume of the skull and the volume of the brain for the same individual would be useful to confirm that the two measures really do provide the same result. The real crunch comes in Chapter 3, however, when I consider the evidence for whether brain size, however it is measured, is a good or useful proxy of cognitive ability.
3
The Intelligent Brain
Why is brain size and its variation interesting? For most of us the brain is a remarkable structure that somehow manages to enable us to run our lives, something that we notice especially when things start to go wrong. But we are also especially interested in its ability to enable us to be smart. From knowing that our brain is the seat of our intelligence, it is very easy to move to thinking that brain size represents intelligence, and that the bigger the brain, the more intelligent the animal (or person). Conversely, we also flip this around to have a starting assumption that the more intelligent the animal, the bigger its brain should be. This seemingly intuitive relationship is confirmed by data from humans: we have big brains for our body size and we know that we are very intelligent, some would say the most intelligent species on the planet. Ergo big brains equal big smarts. We have of course also been interested in explaining just what caused humans to be especially intelligent, with history littered with a multitude of possible explanations for how and why we came to be so intellectually special. Comparative analyses of brain size have almost entirely been built on just these assumptions, i.e. that brain size is a good measure of intelligence, and that animals with bigger brains are more intelligent. Many of these analyses begin with proposing that a particular selective pressure sets a context in which the smarter the animal the better it will do in getting food, mates, territories, and so on, ultimately gaining greater fitness. In Chapters 4–8 I discuss how well those varied contexts explain variation in brain size. However, in this chapter I want to take a step back and consider the evidence that the correlations we might see between brain size and intelligence indicate some sort of causal relationship. I begin then with an assessment of the assumptions and evidence surrounding brains and intelligence. I follow that up by outlining a framework for the steps needed to establish evidence for a causal association between intelligence and brain size, illustrated by using the relationship between food storing and hippocampal enlargement in birds as a model system. Finally, having discussed whether brain size represents intelligence, I also consider how we might go about determining whether variation in an ecological or social context might (or might not) demand greater intelligence.
3.1 Brain size and intelligence
Whether brain size represents intelligence is a question that has been debated for decades (e.g. Hodos and Campbell, 1969; Macphail, 1982) and is a debate that has