
SPECIAL TOPIC
SPECIAL TOPIC
EAGE NEWS Big changes ahead for First Break
CROSSTALK Too early for CSEM requiem
TECHNICAL ARTICLE Frequency domain AB workflow in AVO interpretation


FIRST BREAK ®
An EAGE Publication www.firstbreak.org
ISSN 0263-5046 (print) / ISSN 1365-2397 (online)
CHAIR EDITORIAL BOARD
Clément Kostov (cvkostov@icloud.com)
EDITOR
Damian Arnold (arnolddamian@googlemail.com)
MEMBERS, EDITORIAL BOARD
• Philippe Caprioli, SLB (caprioli0@slb.com) Satinder Chopra, SamiGeo (satinder.chopra@samigeo.com)
Anthony Day, NORSAR (anthony.day@norsar.no)
• Kara English, University College Dublin (kara.english@ucd.ie)
• Hamidreza Hamdi, University of Calgary (hhamdi@ucalgary.ca)
• Fabio Marco Miotti, Baker Hughes (fabiomarco.miotti@bakerhughes.com)
• Roderick Perez Altamar, OMV (roderick.perezaltamar@omv.com)
• Susanne Rentsch-Smith, Shearwater (srentsch@shearwatergeo.com)
• Martin Riviere, Retired Geophysicist (martinriviere@btinternet.com) Angelika-Maria Wulff, Consultant (gp.awulff@gmail.com)
EAGE EDITOR EMERITUS
Andrew McBarnet (andrew@andrewmcbarnet.com)
PUBLICATIONS MANAGER
Hang Pham (publications@eage.org)
MEDIA PRODUCTION
Saskia Nota (firstbreakproduction@eage.org) Ivana Geurts (firstbreakproduction@eage.org)
ADVERTISING INQUIRIES corporaterelations@eage.org
EAGE EUROPE OFFICE
Kosterijland 48 3981 AJ Bunnik
The Netherlands
• +31 88 995 5055 eage@eage.org
• www.eage.org
EAGE MIDDLE EAST OFFICE
EAGE Middle East FZ-LLC Dubai Knowledge Village PO Box 501711
Dubai, United Arab Emirates
• +971 4 369 3897 middle_east@eage.org
• www.eage.org
EAGE ASIA PACIFIC OFFICE
EAGE Asia Pacific Sdn. Bhd.
UOA Centre Office Suite 19-15-3A No. 19, Jalan Pinang 50450 Kuala Lumpur
Malaysia
• +60 3 272 201 40
• asiapacific@eage.org
• www.eage.org
EAGE LATIN AMERICA OFFICE
EAGE Americas SAS Av Cra 19 #114-65 - Office 205 Bogotá, Colombia
• +57 310 8610709
• americas@eage.org
• www.eage.org
EAGE MEMBERS’ CHANGE OF ADDRESS
Update via your MyEAGE account, or contact the EAGE Membership Dept at membership@eage.org
COPYRIGHT & PHOTOCOPYING © 2026 EAGE
All rights reserved. First Break or any part thereof may not be reproduced, stored in a retrieval system, or transcribed in any form or by any means, electronically or mechanically, including photocopying and recording, without the prior written permission of the publisher.
PAPER
The publisher’s policy is to use acid-free permanent paper (TCF), to the draft standard ISO/DIS/9706, made from sustainable forests using chlorine-free pulp (Nordic-Swan standard).
Monitoring fresh–brackish and brackish-saline groundwater interface depths in the North Limburg Venlo Graben (the Netherlands) using repeated electrical sounding with initial subsurface models
33 A practical frequency-domain AB workflow for reducing ambiguity in Class III AVO interpretation
Ritesh Kumar Sharma, Neeraj Kumar and Satinder Chopra
41 Improving time-lapse OBN seismic through accurate node depths and subsidence measurements
Priyanka Dutta, Denis Kiyashchenko, Kanglin Wang, Audun Libak, Ivar Mathias Grøvik and Hugo Ruiz
47 Monitoring fresh–brackish and brackish-saline groundwater interface depths in the North Limburg Venlo Graben (the Netherlands) using repeated electrical sounding with initial subsurface models
Stefan Carpentier, Sjef Meekes, Eldert Fokker and Jelle Buma
55 Managing CCS subsurface uncertainty through ensemble-driven focused seismic monitoring
Camille Cosson and Elodie Morgan
61 Microseismic monitoring – adaptive network design
Leo Eisner, James P. Verdon, Sherilyn C. Williams-Stroud, Zuzana Jechumtálová and Thomas Finkbeiner
65 Ultra-fast reservoir characterisation and well-performance evaluation enabled by digital permeability twins
Ruud Weijermars and Gregg Williams
74 Calendar
cover: Holographic terrain environment with geomorphology. This month we track the latest innovations in reservoir monitoring.


Environment, Minerals & Infrastructure Circle
Andreas Aspmo Pfaffhuber Chair
Florina Tuluca Vice-Chair
Esther Bloem Immediate Past Chair
Micki Allen Liaison EEGS
Martin Brook Liaison Asia Pacific
Ruth Chigbo Liaison Young Professionals Community
Deyan Draganov Technical Programme Representative
Madeline Lee Liaison Women in Geoscience and Engineering Community
Gaud Pouliquen Liaison Industry and Critical Minerals Community
Eduardo Rodrigues Liaison First Break
Mark Vardy Editor-in-Chief Near Surface Geophysics
Oil & Gas Geoscience Circle
Johannes Wendebourg Chair
Timothy Tylor-Jones Vice-Chair
Yohaney Gomez Galarza Immediate Past Chair
Alireza Malehmir Editor-in-Chief Geophysical Prospecting
Adeline Parent Member
Jonathan Redfern Editor-in-Chief Petroleum Geoscience
Robert Tugume Member
Anke Wendt Member
Martin Widmaier Technical Programme Officer
Sustainable Energy Circle
Giovanni Sosio Chair
Benjamin Bellwald Vice-Chair
Carla Martín-Clavé Immediate Past Chair
Emer Caslin Liaison Technical Communities
Sebastian Geiger Editor-in-Chief Geoenergy
Maximilian Haas Publications Assistant
Dan Hemingway Technical Programme Representative
Carrie Holloway Liaison Young Professionals Community
Adeline Parent Liaison Education Committee
Longying Xiao Liaison Women in Geoscience and Engineering Community
Martin Widmaier Technical Programme Officer
SUBSCRIPTIONS
First Break is published monthly online. It is free to EAGE members. The membership fee of EAGE is € 90.00 a year including First Break, EarthDoc (EAGE’s geoscience database), Learning Geoscience (EAGE’s Education platform) and online access to a scientific journal.
Companies can subscribe to First Break via an institutional subscription. Every subscription includes online access to the full First Break archive for the requested number of online users.
Orders for current subscriptions and back issues should be sent to First Break B.V., Journal Subscriptions, Kosterijland 48, 3981 AJ Bunnik, The Netherlands. Tel: +31 (0)88 9955055, E-mail: corporaterelations@eage.org, www.firstbreak.org.
First Break is published by First Break B.V., The Netherlands. However, responsibility for the opinions given and the statements made rests with the authors.

Here’s the big news you’ve been waiting for! We plan to launch a reimagined First Break online version in time for the Annual in Aberdeen this June. It will combine our traditional content with a reconceptualised approach to Association happenings, a rolling geoscience news section, timely features, geopolitical analysis plus audiovisual content including podcasts. The idea is to provide you, the members, with a comprehensive platform tailored to your professional needs that will offer something new every day.
With this latest development we will not be printing any further issues of First Break
The online edition will continue to carry our core referenced articles and other technical content. You can still look forward to a Topic of the Month with articles grouped
together to offer a state-of-the-art review of a technology. In addition, we will now be able to post contributions on any topic online as and when they come in.
Marcel van Loon, EAGE’s CEO, says: ‘We are embarking on an exciting journey to take advantage of the digital potential of having our flagship publication online; it will be updatable at any time to stay current with anything going on that impacts our professional community. In delivering this new platform, we expect there to be challenges, but we are confident that the end result will be a huge benefit to our membership.’
At the Annual this year members can also look forward to publication of the EAGE 75th Anniversary book now in preparation. We would like to remind
everyone that we are still open to including any special memories you may have of the Association, maybe recounting how our geoscience community and its activities have helped to support your professional career, or even an amusing anecdote.
For those wanting to submit, you should keep your text to one or two paragraphs, so we can include as many contributions as possible. And we would also invite you to send in any relevant photos as we intend this to be a highly illustrated publication.
Please email our publications manager Hang Pham at hpm@eage.org with your memories and questions if you have any.
For those interested in the sponsorship and advertising opportunities available for this unique publication, contact corporaterelations@eage.org.
Aberdeen and Aberdeenshire offer a rare mix of city culture, coastal scenery and easy access to some of Scotland’s most celebrated landscapes. With the 87th EAGE Annual Conference & Exhibition 2026 (8-11 June, 2026) bringing the global geoscience community to the north-east of Scotland, this can become much more than a conference trip, in fact an opportunity to experience a destination that rewards curiosity, whether you stay for a few evenings or extend your visit into a long weekend.
From historic streets and modern galleries to castles, whisky distilleries and dolphin spotting, Aberdeen gives you every reason to arrive early or stay longer. These destinations are all within easy reach for half-day or full-day trips from Aberdeen.
City of Aberdeen
Aberdeen is compact and walkable, making it ideal for delegates with limited time between sessions. In minutes, you can move from
conference venues to beaches, museums and historic neighbourhoods. Highlights in the city include: Old Aberdeen – cobblestone streets, King’s College Chapel and historic university buildings; Aberdeen Maritime Museum – located by the harbour, it tells the story of the city’s deep connection to the North Sea and the energy industry; Duthie Park and the David Welch Winter Gardens – a riverside park with one of Europe’s largest indoor botanical gardens, perfect for a quiet break between meetings; Aberdeen beach and esplanade – a long sandy beach with sea views and coastal walks, bottlenose dolphins are often visible from the shore; Footdee (Fittie) – historic fishing village at the harbour entrance, known for its colourful cottages and strong local character and Aberdeen Art Gallery and Union Street – recently refurbished galleries sit alongside the city’s main shopping and dining district, with restaurants, cafés and relaxed pubs ideal for informal networking. Meanwhile evenings in Aberdeen are low effort and high quality. Good food, live music and welcoming pubs are all within easy reach of the main hotels and the venue.
If you add a day or two to your trip, the wider region delivers some of Scotland’s most iconic experiences such as Dunnottar Castle (Stonehaven) – spectacular cliff-top ruins overlooking the North Sea, one of Scotland’s most photographed castles; Balmoral Castle and Royal Deeside – the royal family’s summer residence and surrounding countryside of rivers, forests and walking trails, with villages such as Ballater and Braemar; Cairngorms National Park Mountains – forests and wildlife, ideal for outdoor activities and photography; New Slains Castle (Cruden Bay) – dramatic coastal ruins linked to the legend of Dracula; and Moray Coast – dolphin watching (Spey Bay or Chanonry Point).

Whisky, golf and focal food
Aberdeen sits at the gateway to three of Scotland’s strongest draws. Number one is whisky and the Speyside distilleries such as Glenfiddich and The Macallan. Then there is golf including two championship links courses both offering dramatic coastal settings. As for food and drink, expect fresh haddock, salmon and scallops, alongside modern Scottish cuisine and excellent whisky bars, particularly around Old Aberdeen and the harbour area.
To help you make the most of your stay, a range of exclusive discounts has been secured for registered delegates. Your conference pass must be shown to redeem in-person offers, making it easier to extend your stay and explore more of Aberdeen and Aberdeenshire. Offers include savings on selected food and drink venues, reduced fares with travel partners including airlines and rail operators, plus discounted local experiences such as day tours departing from Aberdeen. Full details, booking routes and access instructions are available via the dedicated deals page. Learn more at eageannual.org/delegate-discounts/
Near Surface Geoscience Conference & Exhibition (NSG2026) will take place on 20-24 September 2026 in the city of Thessaloniki, Greece. The event will once again bring together geoscientists, engineers, researchers, innovators, and industry professionals from across the global near-surface geoscience community for five days of scientific and commercial exchange, technological insight and professional networking.
The event will be hosted at the ‘Ioannis Vellidis’ Congress Centre, a modern and centrally located conference venue known for its flexibility and state-of-theart audiovisual infrastructure. It is situated
next to the Thessaloniki International Exhibition & Congress Centre and within walking distance of the city centre, the popular seafront promenade and several of Thessaloniki’s most iconic landmarks, including the White Tower. With a wide range of hotels, restaurants, cafés, and cultural venues nearby, attendees will have many opportunities to continue discussions beyond the conference halls while enjoying the city’s lively atmosphere.
Thessaloniki is known for its rich history, dynamic urban life and welcoming Mediterranean character. As Greece’s second-largest city, it offers a blend of ancient heritage and contemporary cul-
ture, making it an ideal destination for international visitors to network.
Accessibility is another key advantage of the venue. Vellidio is well connected by public transportation, including the nearby Sintrivani (University) metro station, allowing easy movement throughout the city. The venue is also conveniently accessible from Thessaloniki International Airport, ensuring straightforward travel for delegates.
If you are considering participation in the technical programme for this outstanding event, submit your abstract by 15 April 2026. For more information visit, www.eagensg.org.
Rapidly unlock subsurface knowledge with DUG Insight’s new AI-powered lithology prediction It delivers consistent geological interpretations efficiently and reliably, directly from raw well logs. It’s just one of many intelligent features that make DUG Insight a powerhouse for seismic interpretation and visualisation. Visit dug.com/dug-insight to discover more.
info@dug.com
DUG Insight 6.1 now available


The Critical Raw Materials Symposium marks a fifth conference to join the EAGE Global Energy Transition (GET) 2026 event in Hannover, alongside the established conferences on CCS, geothermal energy, hydrogen and energy storage, and offshore wind energy.
As the energy transition accelerates, access to critical raw materials has become a defining challenge for Europe and beyond. Minerals and metals are the foundation of renewable energy technologies, electrification and digital infrastructure. Ensuring secure, sustainable and resilient supply chains is now as important as decarbonisation itself.
This symposium will serve as a key forum for addressing the strategic role of resource security in achieving a climate-neutral economy. It will focus on the urgent need for new mineral discoveries, innovative exploration technologies, effective policy frameworks and robust value chains.
Participants will be able to explore advances in mineral exploration and resource assessment, including geophysics
and multiphysics methods, artificial intelligence workflows, satellite remote sensing and drone technologies. Sessions will also cover development and production challenges such as automation, geometallurgy, monitoring and safety, as well as environmental and societal impacts and community engagement.
Beyond technical innovation, the symposium will examine the broader techno-economic and geopolitical context. Topics include markets and industrial demand, business model innovation, regulatory challenges, and the resilience of supply chains. Cross-sectoral solutions such as mineral extraction from geothermal brines, oil and gas produced water, and deep-sea resources will also be covered, alongside sustainability themes including emissions management, circularity and post-mining strategies.
The event welcomes professionals working at the intersection of geoscience, technology, environmental science and policy. Exploration geologists, geophysicists, mining engineers and data scientists will find a strong technical focus, while policy
advisors and supply chain strategists will engage with discussions on resource security and national interests. Contributions from EU-funded projects and innovative case studies are particularly encouraged.
As Peter Schmitz, energy and mining resource advisor at Wood Mackenzie, notes, the focus of the energy transition has shifted. It is no longer only about decarbonisation, but about resilience and energy security. Innovation and the ability to scale new technologies will be central to meeting future demand for critical materials.
Eberhard Folk, president of the International Raw Materials Observatory, highlights the policy dimension. Europe’s Critical Raw Materials Act sets ambitious targets for domestic mining, recycling and international partnerships. However, major gaps remain in processing capacity and supply security, reinforcing the need for coordinated scientific, industrial and political solutions.
The Call for Abstracts is now open for all five technical conferences under GET 2026. Submit your abstract by 15 June 2026 at eageget.org.
Geoenergy journal, the peer-reviewed home for non-hydrocarbon energy geoscience and engineering research, is building a portfolio on themed issues.
Recent and upcoming thematic collections in Geoenergy include: 1) The sustainable future of geoenergy in the hands of early career researchers, championing novel ideas from emerging scientists developing next-generation approaches to geoenergy problems; 2) Sustainable geological disposal and containment of radioactive waste, addressing long-term stewardship of hazardous materials; 3) CCS in the Asia–Pacific region, which will share studies on carbon capture and storage across diverse geological settings in this region; 4) Geothermal energy for decarbonisation: advancing heat and power solutions in the UK and beyond, invites submissions that advance the understanding and application of geothermal energy in the UK, as well as case studies and learnings from international partners; and 5) Microbial aspects of geoscience applications for the energy transition, invites field-based, experimental, and modelling contributions on microbial aspects of geoenergy applications relevant to the energy transition.
Since its launch in 2023, the scope of Geoenergy remains broad, embracing core areas including energy storage (thermal, compressed air, hydrogen), subsurface disposal and containment (CO2, BECCS, radioactive waste), geothermal exploration and modelling, critical minerals for low-carbon technologies, subsurface characterisation for siting windfarms and sustainable resource management.

Looking ahead, the Geoenergy editorial team, under the leadership of editor-in-chief Sebastian Geiger (TU Delft), continues to welcome inter-disciplinary research and spotlight emerging topics. The journal also looks forward to hosting a Dedicated Session at the EAGE Annual Conference in June on Geoenergy: research spotlights in the energy transition
Visit www.earthdoc.org/content/journals/geoenergy to learn more information about Geoenergy and details on how to submit your papers to the journal.
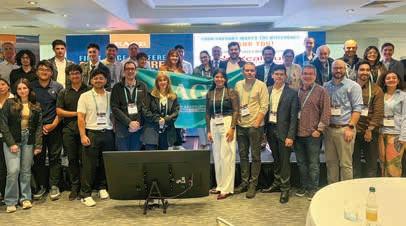
Knowledge exchange and networking, so essential for our geoscience and engineering community, can be challenging when factors such as economic hardship appear and accessing academic resources and professional platforms becomes a struggle. This is why we have a support programme in place to resolve some of these issues. Four of our members had the chance to boost their careers thanks to EAGE’s financial assistance programmes in 2025.
Satyajeet Kumar, undergraduate student at the Rajiv Gandhi Institute of Petroleum Technology in India, received financial support through the PACE programme to attend the EAGE/FESM Conference on Petrophysics meets Geoscience (November 2025 in Kuala Lumpur). He found this conference to be an opportunity to engage with the international geoscience and engineering community.
He tells us: ‘The conference was an incredibly enriching experience. Presenting my research, attending technical sessions and interacting with researchers and industry professionals greatly enhanced my technical understanding and confidence’. He also participated in the Future Energy Leaders (FEL) Programme, which ‘was an inspiring and eye-opening experience’ for young professionals.
Kumar says that, as a student, attending an international conference can be financially challenging, but ‘EAGE’s PACE support made this opportunity accessible and feasible for me’.
Similarly, Alexander Kitchka, leading expert at UkrNDIgaz Res Inst, attended the 2025 EAGE Annual Conference in Toulouse with support through the Ukraine Special Support Programme, launched in 2022, to offer Ukrainian professionals complimentary access to membership, courses and events. He said: ‘The EAGE Annual is a unique event where you are guaranteed to meet your foreign friends and colleagues. Besides presenting the scientific achievements of our research team and acquiring new professional knowledge and information, I also joined a two-day geological excursion to the Pyrenees foothills, which was focused on the search for

natural hydrogen, a topic I’m currently involved in’.
Serhii Levoniuk, geoscience team lead at Ukrgasvydobuvannya, Naftogaz group, also benefited from this programme to attend the 32nd International Meeting on Organic Geochemistry (IMOG 2025), an experience that had a significant impact on his research and professional network. ‘Presenting my work and engaging in technical discussions within the EAGE community was essential for maintaining scientific visibility, receiving expert feedback and staying connected to current developments in geoscience’, Levoniuk explained, adding: ‘The Ukraine Support Programme is exactly the tool that helps us, Ukrainian geoscientists, continue to demonstrate our studies and investigations to the world’.
Continuous professional development programmes, such as online and in-person courses, are additional spaces for professionals to advance in geoscience and engineering research. Farah Yusop, postgraduate researcher at Imperial College London, was at the very beginning of her PhD journey when she learned about the EAGE Masterclass on CO2 Storage in Utrecht, The Netherlands (March 2025). ‘Being new to CCS I was eager to attend the Masterclass,’ she says. ‘I reached out to EAGE to enquire about funding opportunities and was granted a contribution towards an educational programme’. Yusop was able to access discounted registration rates to attend the
four-day programme. ‘With a primary background in hydrocarbon exploration, the Masterclass significantly accelerated my understanding of subsurface carbon storage and supported my PhD research on subsurface characterisation and multi-criteria decision analysis for CCS site selection’.
EAGE invites long-term members experiencing financial difficulties, particularly due to unemployment, to apply for Membership Fee Waivers; Registration Fee Waivers for EAGE events, and discounts to attend EAGE courses (both online or in-person). In addition, prospective or existing members who are struggling to raise the necessary funds to cover their membership can apply to be considered for a Reduced Membership Fee, which provides a 50% discount on the applicable rate.
With these support options, members can remain connected with their colleagues, update their knowledge and boost their skills.
Learn how you can keep engaged with our community through the EAGE Hardship Programme and the PACE Individual Support at eage.org. Please note that these programmes are available for EAGE members, so don’t forget to join or renew your membership.
Join or renew your membership
EAGE is introducing the Volunteering Recognition Programme to celebrate the dedication of its active volunteers. It will formally acknowledge the contributions of our many volunteers and will offer access to exclusive benefits in the following calendar year.
From board members, committee chairs, local or student chapter leaders to faculty advisors, mentors, lecturers, reviewers and convenors, EAGE aims to honor the commitment of volunteers who support the Association across all activities, regions and disciplines. Serving in a wide range of roles and capacities these individuals play a vital part in advancing EAGE’s mission and strengthening its service to members, today and tomorrow.
Based on their contributions throughout the year, volunteers will be recognised across three tiers, each offering increasing levels of recognition and rewards – EAGE Associates, EAGE
Envoys and EAGE Ambassadors. A number of new and exclusive benefits will become available to recognised volunteers. These include the opportunity to advance membership level through active participation and engagement, rather than solely through time.
To kick off the first year of the Volunteering Recognition Programme, EAGE will announce the recognition for the volunteers of 2025. Thereafter, the 2026 volunteers will be recognised in 2027.
If you are interested in volunteering, you can review the current openings on eage.org/about_eage/volunteer or send a message to communities@eage.org with your CV, and a brief explanation of your interests and motivation for volunteering.
EAGE would like to sincerely thank all our volunteers for their dedication, time, and commitment.
Dirk Orlowsky (DMT), community chair of EAGE’s newest Technical Community on Radioactive Waste Storage, reflects on its background, relevance and future outlook.
Meeting the interests of our members, a new EAGE Technical Community on Radioactive Waste Storage has been founded to provide a space for geoscientists to promote research and raise awareness of the role of geosciences and engineering in the search for reposito-
ries. The goal of this community is to support the advancement of geosciences and create technical groups that drive the search for repositories, and foster knowledge exchange across geographic boundaries. The exchange of technical information takes place through meetings, workshops, short courses, and seminars, promoting integration and collaboration between policy, science, and industry.
Following an introductory workshop at the 2024 EAGE Annual Conference in Oslo, further activities were planned, including a joint EAGE/DGG workshop on ‘Innovative geoscientific methods and method-combinations for the exploration of potential deep geologic repositories for nuclear waste’ in Münster, Germany, and a workshop on ‘Radioactive waste management’ scheduled for the 2026 EAGE Annual Conference and Exhibition in Aberdeen, UK.
The search for repositories for high-level radioactive waste is a central issue in Europe. Each affected country
faces the challenge of finding safe solutions for the storage of these wastes, which is considered a societal project of the century. Since the European Union has agreed on the need of safe disposal or permanent storage, each country must develop its own strategies based on its specific geological conditions. Currently, radioactive waste is stored in dry containers, silos or vaults with safety issues often being raised. Geological deep storage is regarded as the best solution, promising long-term safety and many countries have initiated their own programs to explore suitable repository sites.
Geoscientists in Europe emphasise the importance of European and national organisations to promote initiatives to create geological conditions for deep storage. EAGE invites all interested members to join the conversation in the LinkedIn group, where further activities and discussions will be shared.
Every month we highlight some of the key upcoming conferences, workshops, etc. in the EAGE’s calendar of events. We cover separately our four flagship events – the EAGE Annual, Digitalization, Near Surface Geoscience (NSG), and Global Energy Transition (GET).

EAGE Symposium on Subsurface Intelligence: Harnessing AI/ML to maximise asset value
21-23 September 2026 – Kuala Lumpur, Malaysia
The symposium aims to explore how AI can be effectively and sustainably embedded across subsurface workflows – from exploration and field development to production optimisation and carbon storage.
The programme will showcase state-of-the-art AI and ML applications, real-world case studies and lessons learned from deployment in brownfields, frontier plays and low-carbon projects. Beyond technology, the discussions will focus on people, process and organisational readiness, highlighting skills development, human–AI collaboration and new ways of working. The symposium aims to equip participants with practical insights and frameworks to unlock asset value, reduce uncertainty and build AI-ready subsurface organisations for the future.
Submit your abstract by 15 May 2026.

Fourth EAGE Workshop on EOR
7-8 October 2026 – Buenos Aires, Argentina
We are coming once again back to Buenos Aires to bring in experts to discuss new ideas, trends and experiences covering all phases of an EOR project. As mature fields and unconventionals gain global momentum, this edition continues our mission to unlock value across all project phases: research, planning, implementation, and surveillance. Join a premier gathering of operators, service companies, and academia to exchange fundamental insights and first-hand experiences shaping the future of EOR in Latin America.
Call for Abstracts coming soon!


First EAGE Workshop on Mobile Shales: Understanding Processes, Imaging, and Risks
7-9 October 2026 – Bucharest, Romania
The workshop will explore shale mobility across diverse geological settings, including sedimentary basins, fold-and-thrust belts, and continental margins. It will examine how shale deformation, fluid systems, overpressure, and structural architecture influence basin evolution and subsurface interpretation. A key objective is to set priorities for future multi-disciplinary research. Contributions will include field observations, seismic and subsurface imaging, numerical and physical modeling, and characterisation of shale properties, with focus on imaging challenges, scale-dependent processes, and comparisons across settings. The format combines technical presentations, discussions and a field visit to the Pâclele Mud Volcanos.
Submit your abstract by 15 May 2026.

Second EAGE Conference on Energy Opportunities in the Caribbean 11-13 November 2026 – Port of Spain, Trinidad & Tobago
This is the premier forum for shaping the region’s energy future. We invite submissions on key topics: 1) Exploration; 2) Production present highlights and future plans and challenges; 3) Petroleum systems of the Caribbean and Guyana; 4) Geology and Geotectonics of the Caribbean and North-South Atlantic; 5) New and Applied Technologies; 6) Opportunities in the energy transition; and 7) Environmental and regulatory framework.
Submit your work by 3 July 2026.
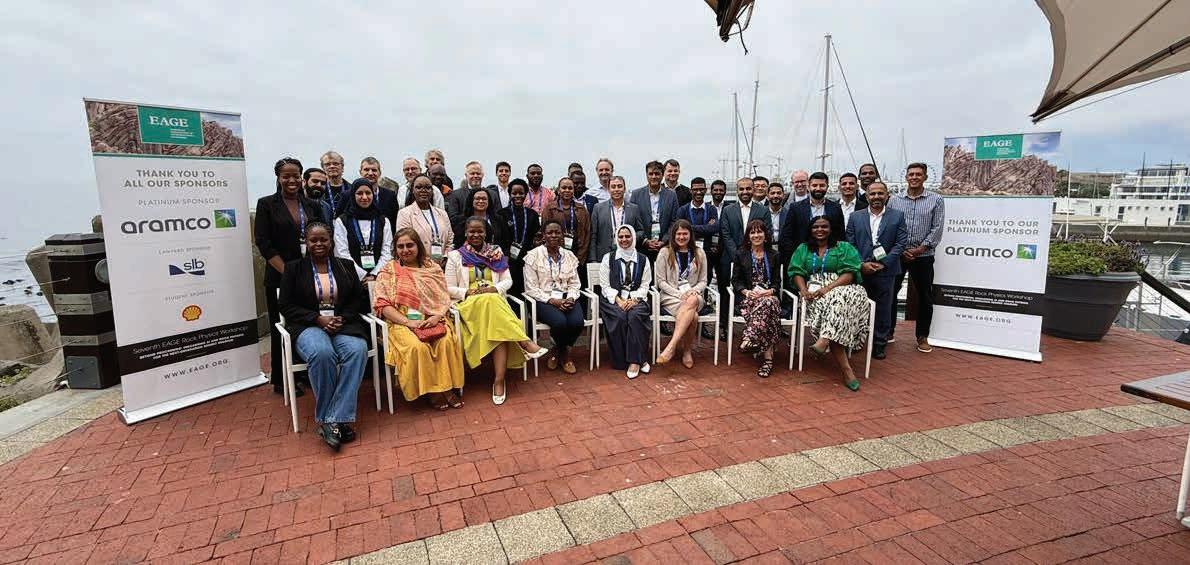
Cape Town, South Africa, was chosen to host the Seventh EAGE Rock Physics Workshop held on 10-12 November 2025 and attracting around 45 participants across multi-disciplinary backgrounds from the oil and gas industry as well as academia.
A one-day field trip prior to the workshop took place, led by Prof Emese M. Bordy from the University of Cape Town (UCT). It focused on the geological formations of the Cape Peninsula, primarily in the Hout Bay area, where delegates explored both modern and ancient geological processes. It demonstrated the principle of uniformitarianism, showcasing how modern landscapes and sedimentary features can help us understand ancient environments, setting the tone for a rich programme for the upcoming days.
Omar Afif (Aramco) delivered the keynote address, titled Revolutionising seismic imaging: The power of rock physics integration. This laid the groundwork for a thought-provoking discussion on the emerging trends in rock physics. Afif’s presentation delved into the transformative potential of integrating rock physics with advanced seismic imaging technologies, such
as full waveform inversion (FWI), and its far-reaching implications for sustainability and mineral resource discovery. He said that the traditional applications of rock physics, although effective, only scratch the surface of what is possible when combined with cutting-edge technologies like AI and high-performance computing. By harnessing these advancements, the industry can unlock new avenues for exploration, optimise resource allocation, and ultimately drive more informed decision-making.
The first keynote by Per Avseth (Dig Technology) set the stage for discussion on applied rock physics diagnostics. He focused on the new insights of combining microstructural analysis with effective medium models to distinguish injectite sands from motherbeds in a North Sea turbidite system, highlighting how variations in elastic properties can be explained by differences in cementation, grain contact, clay content, and sorting. Subsequent presentations highlighted the importance of data conditioning and feasibility studies in rock physics applications, as well as the concept of integrating rock physics with geological scenarios.
Day one closed with a core display exercise led and invigilated by Jelle Boels (Shell) and focused on data integration, interpretation and a blind test appraisal recommendation of a real prospect that had been drilled offshore Africa. This exercise involved discussions on expected rock physics properties and seismic signatures given the seismic sections and geological/petrophysical information that was provided together with the core. The goal was to assess reservoir quality and reduce placement risk and uncertainty.
The second morning started with a keynote by Maurice Gidlow (Rhino Resources) showing some recent work on the importance of utilising far and very far-offset data for better reservoir characterisation and imaging, captivating the audience with his detailed analysis of the benefits of ultra-far offset seismic reflectivity data. Mark Chapman (University of Edinburgh) presented recent work he had completed on modelling time-lapse seismic data in rocks with multiple fracture sets, causing anisotropy and attenuation, and demonstrated its implications for enhancing reservoir characterisation.
Andile Msolo (Rhino Resources) showcased a study utilising relative rock physics to distinguish between different facies and facies prediction in-between the well locations. By computing relative rock properties (such as Lambda and Mu) and creating a rock physics template, the researchers were able to identify boundaries between different clusters of facies (in particular carbonates, source rock and hydrocarbon/water-bearing sands) in relative property space. Ali Alkhunaizi (Aramco) presented a case study that shows the role of integrating rock physics constraints into full waveform inversion (FWI) workflows to address the challenges of land seismic imaging, where complex near-surface geology can lead to uncertainty and ambiguity.
The theoretical and laboratory rock physics session covered a wide range of topics including the rock physics modelling of shale diagenesis constrained by thermal and burial history; applicability of fluid substitution in carbonates; and acoustics response of granular porous media with wettability changes. The Q&A session saw a spirited discussion on the applicability of Gassmann fluid modelling in carbonates and clastics, with participants exploring the intricacies of its implementation, benefits and challenges. The conversation that followed revealed a rich array of perspectives on the role of Gassmann modelling in understanding fluid behaviour in different rock types.
The last keynote by Tor Arne Johansen (University of Bergen) discussed a rock-physics framework for predicting elastic seismic properties for sand-shale mixtures. He linked
geological processes, such as compaction, mineralogy and pore-structure evolution, to elastic behaviour by constructing forward and inverse rock-physics models. He also demonstrated how the elastic properties of frozen and thawing sediments evolve under warming conditions. Using active and passive seismic methods, he monitored permafrost thaw and showed that time-lapse seismic surveys can detect changes in the degree of freezing. Furthermore, he related petrophysical properties - porosity, fluid composition and ice content - to the observed seismic response, thereby providing a means to assess environmental risk in a warming climate.
The final session of the workshop explored the exciting realm of AI and digital transformation in rock physics. One of the highlights of this session was Rudi Lubbe’s (Aramco) presentation on ‘Advancing deep learning predictions with facies-specific porosity realisations’. Lubbe demonstrated how
AI techniques can dramatically improve rock-physics-driven modelling of key reservoir properties. To achieve this, two stochastic approaches and one deterministic approach were implemented to generate a synthetic catalogue comprising tens of thousands of porosity realisations. This geologically diverse, statistically expanded training dataset enabled the deep-learning models to predict three-dimensional reservoir porosity from seismic reflectivity data with far greater accuracy.
The workshop underscored the central role of rock physics in driving advancements in AI, FWI and quantitative interpretation (QI). Key takeaways from the workshop emphasised the importance of continued integration of rock physics into multiple subsurface disciplines, including advanced imaging techniques, mineral exploration, relative rock physics, and enhanced climate change assessments, to unlock new insights and emerging opportunities.
in progress.
We are announcing new dates for the CO2 Storage Masterclass, which will now take place from 1-4 December 2026 in Paris, France.
Over four intensive days, Prof Philip Ringrose, Drs Eric Mackay, Andreas Busch, and Florian Doster will share practical insights into CO2 storage
that can be immediately applied to day-to-day work across the geoscience disciplines.
The programme is designed to combine expert knowledge with real-world relevance, offering a highly engaging learning experience. Adding to the experience, early December is sure to offer an especially festive and inspiring time in Paris. The timing also allows participants to comfortably plan ahead and incorporate the Masterclass into their 2026 learning and development plans.
We therefore invite you to mark your calendar with the new dates and join us in Paris for a Masterclass that promises to be well worth the wait.
Register here

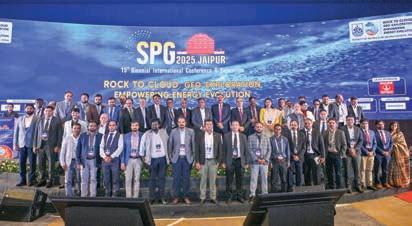
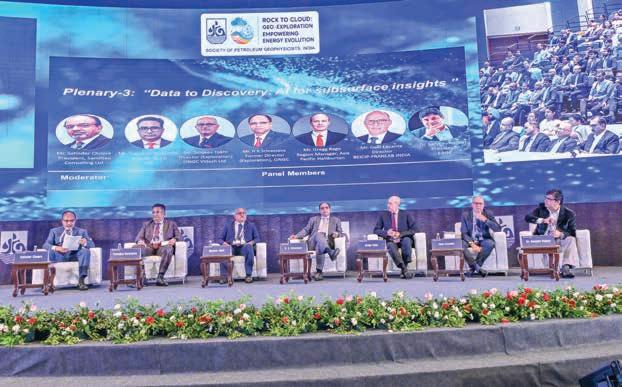
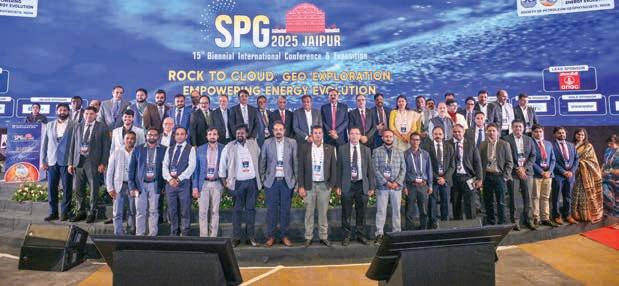
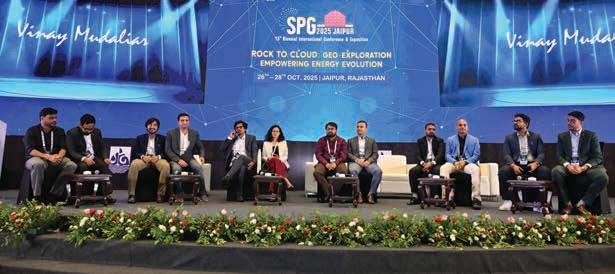
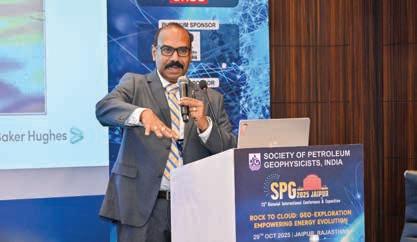
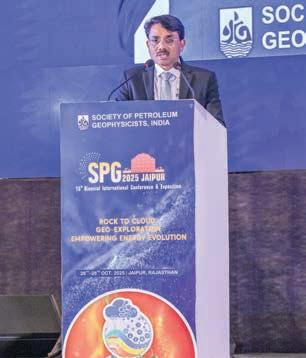
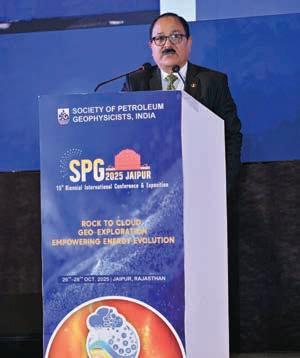
The 15th Biennial International Conference and Exposition of the Society of Petroleum Geophysicists (SPG), India, was held from 26 to 28 October 2025 at the Jaipur Exhibition and Convention Centre and marked a landmark milestone in India’s geoscientific journey.
Organised around the theme Rock to cloud: Geo-exploration empowering energy evolution, SPG 2025 served as a premier platform for advancing geosciences, showcasing cutting-edge technologies, and strengthening collaboration among industry, academia, government bodies, and international societies. With participation from over 900 delegates representing ministries, regulators, national and international oil companies, universities, and research institutions, the event reaffirmed SPG’s leadership in uniting science, technology, and talent to support energy security and transition.
Through pioneering initiatives such as the SPG-SLB Hackathon, Geoscience Career Symposium, plenary dialogues, a comprehensive technical programme, industry exhibition, and continuing education courses, SPG 2025 showcased India’s growing strength in digital subsurface imaging, AI-enabled workflows and sustainable exploration innovation.
A major highlight was the industry exhibition, featuring more than 32 global exhibitors including ONGC, Oil India, SLB, Shearwater, Beicip-Franlab, AspenTech and Eliis. The exhibition demonstrated advances in AI-assisted seismic interpretation, cloud-based data processing, CCUS and hydrogen exploration workflows, energy storage solutions, and smart data integration platforms. These interactions enabled professionals to directly experience next-generation technologies, accelerated data-to-decision workflows, strengthened understanding of low-carbon exploration pathways aligned with India’s net-zero vision, and promoted cross-sector global collaboration.
The technical programme formed the intellectual core of SPG 2025, comprising 180 peer-reviewed papers and 20 keynote lectures by eminent national and international experts. Sessions covered a wide spectrum of themes including full waveform inversion (FWI), AVO studies, basin
modelling, geomechanics, AI/ML applications, advanced seismic acquisition, and energy-transition strategies. Notable case studies addressed high-resolution velocity modelling in Mumbai High, drilling-risk mitigation in the Rajasthan Basin, transition-zone 3D seismic acquisition, nodal sensor deployment, spectral decomposition, 4D seismic monitoring, and advanced attribute analysis for thin-sand reservoir detection. The programme strengthened technical competencies, demonstrated the value of reprocessing legacy data with AI and tomography, and fostered cross-disciplinary learning among interpreters, modellers and drilling professionals.
Industry–academia interaction remained a strong pillar of the conference. The student programme, conducted in collaboration with SEG, EAGE, OSEG and BP, included SPG Mastermind 2025, the Upstream Business Game, and Exploreathon, engaging students in technical challenges and leadership simulations. A Memorandum of Understanding between SPG and EAGE further expanded opportunities for joint research, faculty exchange and collaborative learning, helping align academic curricula with evolving industry needs and building a pipeline of digitally fluent geoscientists.
The Geoscience Career Symposium connected 42 students from leading institutes with recruiters from major energy and service companies, resulting in direct job offers, interviews and mentorship opportunities. Complementing
this, the first-ever SPG-SLB Hackathon engaged over 480 participants in AI-driven problem-solving using real exploration datasets and cloud-based platforms, strengthening data-science capability and industry–student collaboration.
The 2025 SPG-Quiz, held for the first time, brought together over 160 participants from academia and industry in a vibrant celebration of geoscientific knowledge and teamwork, culminating in a thrilling finale where the top 12 finalists competed in dynamic teams of two.
Strategic direction was provided through four plenary sessions featuring leaders from government, NOCs, global operators, and service companies. These sessions explored energy resilience and reform, AI-driven subsurface discovery, innovation in exploration workflows, and the strategic importance of deepwater and ultra-deepwater exploration for India’s energy security.
SPG 2025 also expanded its international footprint through partnerships with SEG, EAGE, OSEG, and AAPG. The release of a special Geohorizons journal issue and post-conference continuing education courses attended by over 250 professionals reinforced lifelong learning, global alignment and inclusive participation across career stages.
SPG 2025 demonstrated India’s ability to integrate science, technology, and strategy to drive exploration excellence. By advancing digital transformation, strengthening professional skills, and fostering collaboration among scientists, innovators, and policymakers, the conference enhanced India’s exploration readiness and elevated SPG’s stature as a global centre of excellence.
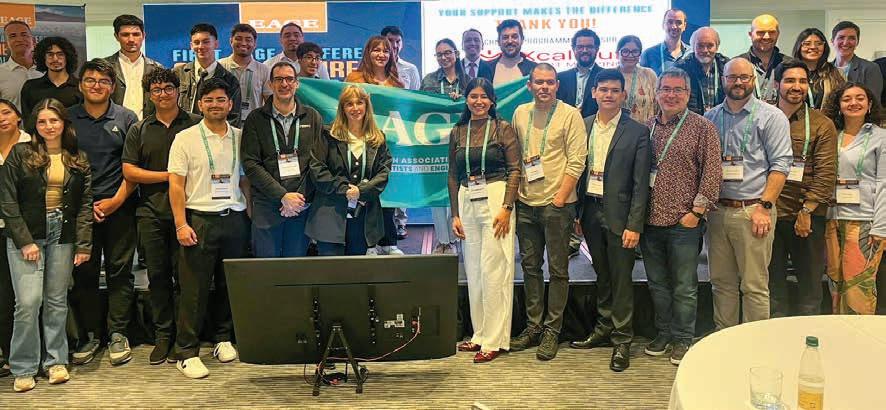
Camilo Sanchez-Yanez and Felipe Espinoza report on the EAGE conference Future of Mineral Exploration: Challenges and Opportunities held recently in Chile.
The 52 attendees and speakers focused on new techniques in mineral exploration and processing with contributions from private companies, Chilean government agencies and academic researchers.
The research presented at the conference was grouped into three main thematic areas: Advanced geophysics and inversion, Mineral resource exploration and Environmental geochemistry and circular economy.
The geophysics-focused theme grouped research addressing new and advanced geophysical acquisition techniques, inversion strategies, and uncertainty reduction methods highlighting methodological innovation as a key driver in modern mineral exploration. In particular, several studies discussed 3D trans-dimensional and probabilistic inversion, joint and multi-physics inversion approaches and explicit uncertainty quantification and model ambiguity reduction. Additionally,
many contributions incorporated machine learning and dimensionality reduction techniques for visualisation and interpretation, combining methodologies such as seismic reflection and full waveform inversion (FWI), electromagnetic methods (CSAMT, FDEM, GPR), and ML-assisted interpretation e.g., clustering and t-SNE. Overall, new geophysical trends applied to mineral exploration emphasise a methodological backbone that provides higher-resolution subsurface models, an

explicit treatment of uncertainty and the transferability of these methods beyond mineral exploration to other domains such as hydrogeology and environmental studies.
The main problems addressed in these groups included: reduction of uncertainty in geological, hydrogeological and geotechnical models; management of uncertainty in exploration beneath sedimentary cover; ambiguity reduction in single-physics subsurface models, and identification and characterisation of groundwater resources.
The second major theme focused on mineral resource exploration, addressing the identification, characterisation and genetic understanding of mineral resources. One of the most relevant aspects of the workshop was the presentation of new exploration frontiers, both on land and in marine environments, targeting commodities such as Cu, Au, Li, Mn, Co, and rare earth elements (REE). The research emphasised the integration of geological, geochemical and geophysical evidence to define prospectivity, update genetic models and support exploration decision-making. These approaches were applied across a wide range of geological settings, from local deposits to regional and ocean-scale systems.
Beyond traditional techniques, recent trends highlighted data-driven approaches and the application of artificial intelligence for prospectivity mapping and exploration. These approaches combined geological and structural mapping, petrology and geochemical interpretation, remote sensing and machine learning. Specific studies within the second group included the regional-scale identification of prospective areas for deep-sea polymetallic nodules using machine learning and environmental proxies; investigation of the origin of evaporitic terraces and early lithium enrichment associated with volcanic–evaporitic salar systems in northern Chile; and integrated assessment of seabed mineral potential and environmental impact using AI-assisted seabed mapping of seafloor massive sulfides and ferromanganese crusts, and the updated genetic models for copper deposits, based on geological mapping, petrography, XRD, and remote sensing, with applications to IOCG and distal Cu deposits. Additionally, government agencies such as the Ministry of Mining and the Chilean Copper Commission (COCHILCO) discussed national strategies for critical minerals and the domestic mineral supply.
The third thematic area addressed the environmental footprint of mining and resource extraction, focusing on impact assessment, mitigation, remediation and resource recovery from mining wastes. Research in this theme covered process understanding, including geochemical reactions, transport and kinetics in post-extraction systems such as slags, leachates, waste rock dumps, and contaminated waters. These new trends combine geochemical modelling, laboratory experiments and the application of novel materials, particularly nanomaterials. In this context, emerging
techniques offer new possibilities to transform mining waste into resources or to reduce legacy contamination, aligning mineral exploration with sustainability and circular economy principles.
The diversity of research presented at the workshop highlights the new possibilities in mineral exploration, spanning improved subsurface characterisation, enhanced understanding of mineral systems, expanded use of artificial intelligence, and the transformation of mining consequences into new resource opportunities through remediation and circular economy approaches.
The workshop included the participation of undergraduate geology students, particularly from the School of Geology at Universidad Mayor, Chile. Students contributed through poster presentations, and one student also participated as an oral speaker. Student research was mainly aligned with the third thematic area: Environmental geochemistry and circular economy. The topics addressed included prediction of acid generation and metal release from waste rock dumps, reuse of mining waste for functional materials, removal of arsenic from mining-impacted waters, and reduction of environmental liabilities through copper recovery.
The methods applied in these academic studies included coupled flow–reactive transport modelling, hydrothermal synthesis and SEM-EDS characterisation of nanoparticles, experimental adsorption tests of arsenic on nanoparticles, and hybrid reactive material batch and column tests for copper recovery. The study environments comprised waste rock dumps, copper smelting slags, mining-impacted waters, and heap-leach residual solutions.
These academic trends highlight the emergence of scientific research strongly focused on remediation, circular economy, and environmental science, demonstrating new opportunities to explore resources through the reuse and revalorisation of mining residues and deposits
Abstracts from the conference are available
many of the present-day structural traps and tilted stratigraphic contacts observed across Arabia cannot be fully understood without considering the interplay between mantle flow and crustal deformation. The keynote received strong engagement from participants, prompting extended discussion on how such deep-time geodynamic concepts can be practically incorporated into reservoir-scale models.
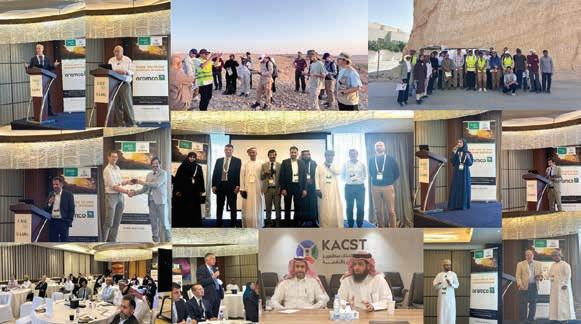
Riyadh became the hub of regional geoscientific dialogue as it hosted the EAGE/ AAPG Workshop on Tectonostratigraphy of the Arabian Plate from 2–5 November 2025.
The event drew a broad community of more than 200 professionals from national oil companies, international operators, research institutions, and service companies, all aiming to advance their understanding of the structural and stratigraphic evolution of the Arabian Plate.
The workshop opened with welcoming remarks from co-chairs Mohammed Saleh and Mohammed Marhoon (Aramco), who emphasised the need for integrating tectonics, stratigraphy and geodynamics into a unified framework to better evaluate basin evolution and hydrocarbon prospectivity across Arabia. Co-chair Abdulaziz Albalushi (PDO) echoed these sentiments, noting that the Arabian Plate continues to reveal new complexities as advances in seismic imaging, stratigraphic modelling and restoration techniques uncover previously unrecognised structural domains.
The first keynote from Simon A. Stewart (Aramco) set the intellectual tone for the workshop. He provided a comprehensive synthesis of mantle dynamics, basement inheritance and tectonic inversion episodes that have shaped the Arabian Plate over Phanerozoic time. His presentation highlighted how deep-seated lithospheric processes – including variations in plate coupling, mantle upwelling, and structural compartmentalisation - directly influence basin geometry, fault propagation and uplift patterns. Stewart underscored that
Abdulkader M. Afifi (KAUST) presented a major keynote, titled ‘Evolution of tectonostratigraphic concepts for the Arabian and Red Sea Basins’. Afifi traced the development of tectonostratigraphic thought in the region from early fault-controlled models to modern interpretations that incorporate eustasy, intraplate stresses and dynamic topography. He mentioned key turning points in the geological record, such as the Late Jurassic–Early Cretaceous rifting, the Late Cretaceous compressional episode and the Cenozoic Red Sea opening. Afifi stressed the importance of recognising plate-edge vs. plate-interior responses, noting that facies distribution, source rock development and salt mobility were intimately linked to the evolving tectonic stress field. His talk drew parallels between outcrop evidence, seismic observations, and well data, providing a multi-scale understanding of basin evolution.
The structural theme deepened soon after, with the keynote by Renas Koshnaw (University of Göttingen), who examined the impact of Arabian Plate lithospheric dynamics on the NW Zagros foreland basin during the Cenozoic. Koshnaw presented new structural cross sections, thermochronology data and balanced restorations that reveal the evolving orogenic load and its flexural imprint on the foreland. He showed how varying convergence rates, basement anisotropy and inherited fault geometries produced complex folding styles and influenced sediment routing systems. His work also revealed feedback mechanisms between subsidence patterns and the trapping architecture of adjacent hydrocarbon systems, drawing clear links between tectonic evolution and petroleum prospectivity.
In the session dedicated to petroleum systems and trap configurations, Shaoqing Sun (C&C Reservoirs) delivered a keynote exploring trap types and their associated tectonic controls across the Arabian Plate. Sun reviewed major trap categories such as basement-involved anticlines, drape-over structures, salt-related closures, inverted fault blocks, and stratigraphic traps conditioned by uplift cycles. He demonstrated how structural inheritance from earlier Paleozoic and Mesozoic phases frequently dictates the geometry of younger traps, providing compelling case studies from Saudi Arabia, Oman and Iraq. Sun noted that a renewed structural understanding of the Arabian Plate is essential for unlocking remaining exploration potential, especially in deeper or structurally complex intervals.
The workshop’s final keynote was presented by Thamer Al Daajani (KACST). He provided an in-depth look at the evolution of a quadruple plate junction along the Afro-Arabian margin. Al Daajani showcased new tectonic reconstructions and kinematic models that illustrate how rift propagation, transform motions and basin subsidence patterns interlinked across the junction. His talk drew significant interest due to its implications for understanding stress field transitions across the Arabian Plate and their consequences for fracture development, reservoir compartmentalisation and geothermal potential. The presentation also noted the emerging role of integrated plate modelling in refining subsurface predictions.
Complementing the technical discussions, the two-day field trip to Riyadh-area outcrops provided participants with firsthand exposure to structural features that underpin many of the workshop’s themes. Stops at Narjis, Aziziyah–Kharj, Heet Cave, Umm-Alshaal anticline, Wadi Mawan, Sahba Nisah, Al-Hair Lakes, and the Edge of the World offered a diverse look at folding styles, fault geometries, fracture networks, tilted units, and unconformities. The field leaders guided participants through examples of stress indicators, kinematic histories and depositional-structural relationships that continue to influence subsur-
face reservoir distribution. Many attendees praised the field trip as a unique opportunity to connect theoretical concepts with realworld structural expressions.
Throughout the workshop, numerous oral and poster contributions explored detailed aspects of the Arabian Plate’s evolution, from Paleozoic salt basins and
Jurassic carbonate platforms to Late Cretaceous–Eocene deformation and modern stress-field modelling. Presenters discussed advances in structural restoration, basin modeling, fracture characterisation, and play-based exploration, demonstrating the depth and breadth of ongoing scientific inquiry in the region.
By the end of the event, a clear narrative emerged: the Arabian Plate remains an active scientific frontier, where evolving tectonostratigraphic concepts continue to reshape exploration strategies, reservoir understanding and assessments of future energy resources.
After spending more than 30 years in the oil industry, Dr Pascal Richard (PRgeology) has created the key ‘must know’ structural geology principles for professionals and academics to learn from in the form of an in-person interactive course that includes a virtual reality field. It takes place this month in The Hague.

Dr Richard believes that knowledge can help companies and teams to avoid costly errors in, for example, drilling development and field management.
He has noticed that a structural geology course strengthens the conceptual understanding that participants can gain with real life examples, especially when participants get to experiment with several subjects like the creation of sandbox models. This leads to a better understanding on the creation of what Dr Richard calls ‘more appropriate 3D models, better maps, improved structural geology understanding for better extrapolations, input to fault seal studies and fracture model elaboration’. He believes more junior structural geologists ‘will better understand what is key when performing structural interpretations and modelling and what can be considered as less essential. This is of tremendous help at a career stage where improving the efficiency of their work becomes crucial’.
For professional seismologists focusing more on production and exploration, Dr Richard says the course is an opportunity ‘to compare what they often solely interpret based on geophysical
data with a fantastic set of analogues (natural outcrops or sandbox experiments). They will also strengthen their conceptual understanding, that should be a minimum required to critically review their work or the work of peers’.
As he designed the course to be beneficial for professionals regardless of their experience level, senior geoscientists will also benefit from the course. According to Dr Richard ‘expert structural geologists will have a unique opportunity to visit world-class outcrops and to examine subsurface examples, enabling them to test their own concepts and probably to dust-off some of their well-admitted paradigms’.
The course includes a virtual reality field of some fractured reservoir locations for participants to visualise their learning experience. ‘It demonstrates how virtual reality can enhance geological field education by improving 3D spatial understanding, structural interpretation and stratigraphic analysis. Through immersive virtual outcrops, participants strengthen core geological skills that are fundamental to both academic training and professional practice’.

The invitation is open to participate in the Structural geology must knows course in the Hague, Netherlands on 23-25 March 2026.

Convenors Mariane Peter-Borie (Look Up Geoscience), Jeanne Vidal (Women in Geothermal) and Azin Karimzadanzabi (EAGE Women in Geoscience and Engineering Community) bring together reflections from the panel discussion ‘Inclusive Energy Transitions: Empowering Women, Advancing Equity’ hosted at EAGE GET 2025.
In this month of March, and on the occasion of International Women’s Day, questions of equity and inclusion are at the heart of our collective reflections. Across the energy sector, the transition underway is not only technological or environmental, but also profoundly social. How we design, govern and lead this transition will determine not only its effectiveness, but also its fairness.
Bringing together perspectives from research, policy, industry, and professional networks, the panel Inclusive energy transitions: Empowering women, advancing equity offered a space to reflect on how energy transitions can empower women while advancing equity and promoting justice across the sector.
Through the voices and experiences of Elke Mugova (Fraunhofer IEG, Women in Mining and Resources Germany), Michelle O’Grady (Geological Survey of Northern Ireland), Cristina Marras (Saipem, UNECE Women in Resource Management Working Group), Suzanne Hangx (Utrecht University), and Katrin Löer (Delft University of Technology), the discussion addressed the living realities of careers in energy and geosciences, the persistence of structural barriers and the opportunities for building a more inclusive future.
Energy is a driver of economic development and decarbonisation and it plays a pivotal role in poverty reduction, health, education, food security, and access to water. Ensuring that everyone can equitably contribute to this transformation is a condition for a successful and fair transition.
Treating everyone ‘the same’ does not lead to fair outcomes when starting points are unequal. Women, particularly in energy and geosciences, continue to face structural barriers that shape access to education, career opportunities, leadership
roles, and decision-making power. Equity therefore requires more than equal rules; it requires rethinking systems, norms and expectations. It is not about preferential treatment, but about creating conditions where talent and ambition can flourish regardless of gender or background.
While gender equity was central to the discussion, the session also highlighted the broader dimensions of inclusion.
launched to build a more diverse and inclusive research and innovation system, such as the UKRI Equality, Diversity and Inclusion Strategy (2022–2026), the UK Government’s Disability Confident Scheme since 2016, and the URGE (Unlearning Racism in Geoscience) project, which together highlight the importance of accountability, accessibility, and the use of research and dialogue to drive structural change.

Energy transitions raise fundamental questions about fairness between regions, generations and communities. In practice, inclusion begins with participation. Bridging Global North–Global South divides, engaging young people and ensuring that marginalised communities benefit from energy projects are essential to ensure that solutions are locally relevant and socially accepted. Excluding a part of the population on the basis of gender, origin or age from leadership and decision-making weakens the sector’s capacity to innovate and adapt.
An inclusive transition ensures that women, local communities and under-represented groups are not merely consulted, but actively shape outcomes. Some intersectional initiatives have already been
Beyond perceptions, women in geosciences also face practical risks and challenges that vary by location and type of work. Fieldwork on remote sites, such as mines, drilling rigs or exploration camps, can present serious safety concerns in some contexts, including inadequate sanitary facilities, lack of privacy and exposure to harassment or assault. Awareness of these realities is essential when planning assignments, implementing protective measures and fostering a culture in which concerns can be raised and addressed without fear. Ensuring the safety of all staff, regardless of gender, is not only a matter of individual well-being, but a core responsibility for organisations committed to inclusive and sustainable energy transitions.
Unconscious biases influence everyday decisions such as who is perceived as leadership material, who is considered ‘available’ for demanding roles, who is trusted with responsibility and who is assumed to be less committed due to family obligations. Because these biases operate below the level of intention, they are often dismissed or denied. Yet they interact with structural barriers as systemic obstacles embedded in policies, institutions, norms, or practices that prevent certain groups from accessing the same opportunities and resources as others, reinforcing inequality over time.
Despite growing awareness, gendered perceptions of performance and leadership remain deeply rooted in the energy sector. Women are often evaluated more harshly and expected to meet higher standards to be considered equally competent, reflecting both external expectations and the pressures they place on themselves. This dynamic is particularly visible during recruitment and promotion processes. Women tend to apply only when they fulfil nearly all listed requirements, while men often apply even when they meet only part of them, supported by a stronger sense of legitimacy. More broadly, attention, authority and perceived legitimacy in professional environments are rarely neutral.
Women frequently report having to exert disproportionately greater effort to be heard, and this challenge is compounded for women of colour, who face the combined effects of gender and racial bias. These differences are not innate; they reflect social conditioning and professional cultures. Addressing these double standards requires more than individual resilience. Tackling unconscious bias requires deliberate action: bias awareness training, diverse selection panels, data-driven monitoring of career progression. Importantly, the session also highlighted a strong and positive message about leadership: diverse teams do not happen by chance. They require active, intentional engagement from those in leadership positions to create environments where different profiles are not only present, but genuinely valued. Institutions and professional networks play a critical role in driving systemic change. Platforms such as UNECE’s Women in Resource Management
Working Group, Women in Mining, and Women in Geothermal provide visibility, mentorship and advocacy, while also influencing policy and industry standards. Their impact lies not only in supporting individuals, but in reshaping narratives and expectations across the sector placing equity at the centre of concerns.
Mental load associated with family responsibilities emerges as a critical point of discussion. Planning, organising and anticipating the needs of others constitute invisible labour for women. Recognising that parenthood does not end at the workplace door is essential for genuine inclusion. Employees are not less committed because they are parents; they simply carry additional responsibilities.
From the perspective of both scientists and mothers, a key shift is needed: flexibility must move from being a negotiated privilege to a recognised right. Flexible working arrangements, parental leave for all genders, and shared responsibility models benefit entire organisations by fostering trust, retention and well-being. Normalising parenthood for both women and men is particularly powerful. When caregiving is no longer seen as a ‘women’s issue’, the career penalty associated with family responsibilities will fade. Moreover, many women have children later in life, whether by choice or because long periods of study and training delay family planning. This can involve additional medical constraints requiring time, flexibility and availability from both parents. These realities inevitably affect professional life, yet they remain difficult to discuss openly in the workplace. Recognising and accommodating them through clear, supportive policies is essential to ensure that career progression is not penalised by family planning or health-related needs.
Besides, career progression in the energy sector has long been associated with geographic mobility and uninterrupted availability. These expectations disproportionately affect women, particularly those with family responsibilities. Many women navigate complex trade-offs, adapting their careers to follow a partner’s professional mobility or to accommodate caregiving responsibilities. Persistent gender pay gaps often reinforce these
dynamics, making it more ‘rational’ for the higher-earning partner, still most often the man, to prioritise his career.
Such patterns force women to reinvent themselves repeatedly, sometimes at the expense of visibility or advancement. These experiences also reveal their adaptability and resilience. Learning from these realities means rethinking what career success looks like and designing pathways that value skills, continuity, and contribution over rigid, linear trajectories. By broadening what is celebrated as leadership, organisations can unlock talent that has long been undervalued and create cultures where no one has to choose between professional ambition and personal life. These principles are already being translated into practice through leadership initiatives such as BRAVE Women in STEM & Arts, rooted at Ulster University. This focuses on developing confidence, adaptability and professional impact through practical, work-based learning.
The reflections shared during this session resonate well beyond the walls of the conference. They remind us that inclusive energy transitions are not solely about targets, technologies, or timelines, but about people, power, and participation.
Creating space for conversations about equity, bias and inclusion is not always comfortable but necessary for changing mindsets and reshaping systems. These topics touch on deeply personal experiences and challenge long-standing norms. What stood out during the panel, however, was its constructive and forward-looking tone when addressing sacrifices, compromises and life choices. While much work remains to be done, the presence of role models showing that it is possible to have children and still pursue a fulfilling and successful career sent a powerful message. Their visibility brings light where there is still uncertainty, and their stories remind us that progress, though uneven, is real.
Ultimately, a transition that is not inclusive cannot be sustainable. By embracing equity, recognising diversity as a strength and ensuring that no one is left behind, the energy sector can move closer to a transition that is not only efficient, but truly just.
How tight and depleted reservoirs can become key enablers for hydrogen storage and play a pivotal role in the subsurface energy transition was the topic of recent evening session organised by LC Stavanger. Title of the talk was Transitioning the Norwegian Continental Shelf (NCS): From Tight and Depleted Reservoirs to Hydrogen Storage with guest speakers from the University of Stavanger.
The presenters explained that the Norwegian Continental Shelf (NCS) plays an important role as a main supply of energy (oil and gas) to western Europe (ca 40%) and at the same time is a perfect laboratory to implement competence and technology for making a net-zero emission oil and gas industry, and at the same time store safely CO2 and greener energies such as hydrogen. This is reflected in the work of the National Centre for Sustainable Subsurface Utilisation of the Norwegian Continental Shelf (NCS2030), a research petrocentre funded by the Research Council of Norway, six NCS energy operators and two technology suppliers. The University of Stavanger is the host institution, and NORCE, IFE and the University of Bergen are research partners. The NCS2030 programme contributes to solving the sustainability dilemma – how best to utilise the nation’s resources to ensure stable energy access, while at the same time reducing greenhouse gas emissions.
The Centre director, Prof Alejandro Escalona, together with three PhD students, Veronika Abdulina, Behzad Amiri and Daniele Blancone, presented some of the centre’s main activities. Prof Escalona introduced the Centre’s vision, research structure and some results with CO2 utilisation and storage, reservoir modeling, digitalization and economy.
Abdulina spoke about unlocking the dual potential of diatomite reservoirs. In this context, tight reservoirs hold a large share of undeveloped oil and gas resources on the NCS. These rocks, characterised by very low permeability,
require innovative methods to unlock their potential. Among them, diatomite stands out as a distinctive and underexplored reservoir type. Formed from the remains of microscopic algae, diatomite combines exceptionally high porosity (around 50%) with extremely low permeability, making it both a challenge for production and a promising candidate for future CO2 storage. The research investigates the fluid–rock interactions that control flow and recovery in such tight formations. Laboratory experiments examined water-based improved oil recovery and the chemical stability of diatomite during CO2 exposure. Spontaneous imbibition tests on diatomite samples showed oil recoveries of 26–44% indicating mixed-wet conditions, where capillary forces dominate and wettability alteration can enhance recovery even when pressure-driven flow is limited. Complementary exposure experiments using carbonated brine revealed no significant chemical changes – neither in the brine composition nor at the rock surface – confirming the chemical stability of diatomite under CO2-charged conditions. These findings demonstrate that Norwegian diatomite can play a dual role – improving oil recovery in the short-term and providing a stable formation for CO2 storage in the longterm, bridging current production with future low-carbon operations.
Behzad followed with his ongoing research on underground hydrogen storage in depleted reservoirs. Depleted reservoirs on the NCS are valuable resources for the energy transition. With decades of production history, these reservoirs are well characterised and benefit from existing infrastructure. This makes them attractive candidates for underground hydrogen storage (UHS), offering largescale and seasonal storage to balance fluctuations in renewable energy supply. They can also serve as dual-purpose sites, enabling both CO2 sequestration and UHS, or even supporting EOR in semi-depleted fields. However, UHS
in depleted reservoirs faces significant challenges. The high diffusivity of H2 increases the risk of leakage through caprock and wellbores, while interactions with reservoir fluids and minerals may affect storage capacity and recovery efficiency. Additional uncertainties arise from reservoir heterogeneity, pressure management and economic feasibility. These issues highlight the importance of site-specific assessment and optimised development strategies.
In a Norne field case study, Bezhad has demonstrated that coupling UHS with CO2-WAG injection improves both oil recovery and UHS efficiency. The application of smart well controls increased hydrogen recovery. In aquifer storage scenarios, he has developed an optimisation framework that achieved up to 96% recovery with a maximum net present value of $15.7 billion. These results illustrate both the promise and the complexity of UHS in depleted reservoirs. By advancing modelling, optimisation, and risk assessment, it is possible to transform these mature assets into key enablers of Norway’s hydrogen future.
Lastly, Daniele Blancone talked about the hydrogen storage potential in salt caverns of the Norwegian North Sea. Salt caverns are man-made cavities created by leaching halite formations with water. In use for over 50 years to store oil and gas, they can reach several hundred metres in height and tens of metres in diameter. These structures are now attracting renewed interest as part of the energy transition. Their impermeability and plasticity make them suitable for underground hydrogen storage (UHS), particularly for balancing the intermittency of renewable energy sources. The research evaluates the UHS potential of the Zechstein Group salt structures in the southern Norwegian North Sea. Seismic and well log data were used to map salt bodies, assess cavern feasibility and estimate storage volumes using the GeoH2 tool. Results indicate that approximately
8700 caverns could be developed across 143 salt domes, providing up to 900 TWh of hydrogen storage. However, this estimate assumes pure halite, which is unrealistic. Common intra-salt heterogeneities - such as anhydrite, carbonates, and potassium-magnesium salts - have lower solubility than halite, leading to irregular cavern geometries. These can reduce storage efficiency, compromise geomechanical stability, and impact performance during charge/ discharge cycles. By integrating well data, at an estimate of an average
22% non-halite content, reduces the effective storage potential to ~699 TWh – nearly three times Norway’s annual energy consumption.
During the Q&A, an audience member noted the potential of thick microfossil formations in Norway for oil recovery but highlighted challenges such as offshore fracking costs and logistical hurdles compared to US shale operations, expressing the hope that ongoing research will provide solutions. Another question addressed salt cavern stability for hydrogen storage, and the
In a welcome back to face-to-face presentations, LC Oslo hosted an evening of talks at the offices of TGS on carbon capture and storage (CCS). Over 20 attendees listened first to Gunhild Myhr, VP of TGS Business Development New Energy Solutions, speak on ‘TGS advances and experiences across the CCS value chain: From prospect screening and lead maturation to monitoring’. She showcased how TGS uses seismic data and technology to support the global energy transition with focus on the CCS value chain from prospect screening and lead maturation to long-term storage monitoring.
Bettina Goertz-Allmann from NORSAR then offered a deep dive into the challenges we face when monitoring CCS sites. Goertz-Allmann is a senior researcher in the applied seismology group. Her presentation ‘Microseismic monitoring of CCS sites’ highlighted the importance of microseismic monitoring to help address the risk of induced seismicity near injection sites in a world with increasing emission capturing to reach the net-zero targets. This was illustrated by several case studies from around the world.
The LC Oslo was encouraged by the turnout and quality of interactions at the event and look forward to organising
speakers confirmed that cushion gas and controlled pressure cycles maintain integrity within safe limits. Research centres such as NCS2030 are paramount for both energy security and climate goals, in addition to the training of new professionals and development of critical competence and technology for the near future. The EAGE Local Chapter Stavanger appreciates having such a broad research group in the neighbourhood and looks forward to future presentations from the NCS2030 researchers.
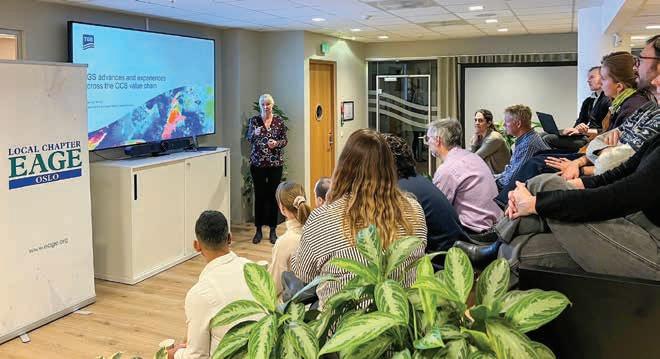
similar events in the future. Such meetings are essential for advancing the collective understanding of geoscience’s role in the energy transition, and with ongoing support from local companies and EAGE, the Chapter will continue to facilitate these valuable opportunities for its members.
The EAGE Student Fund supports student activities that help students bridge the gap between university and professional environments. This is only possible with the support from the EAGE community. If you want to support the next generation of geoscientists and engineers, go to donate.eagestudentfund.org or simply scan the QR code. Many thanks for your donation in advance!

Michiel van der Meulen , chief geologist, Geological Survey of the Netherlands at TNO, was recently awarded the prestigous Medal of Merit by the European Federation of Geologists (EFG) for his outstanding contribution to geology. The honour could not recognise his lifetime involvement with music, these days recording in contemporary modal style inspired by oriental influences.
My first encounters with geology came through my father, a palaeontologist at Utrecht University. I thought he had a very glamorous job, although I secretly felt it would have been even better if he had studied dinosaurs rather than small mammals. When I was about seven, my mother decided she did not want to stay at home during his yearly fieldwork in southern Europe. So in 1977 she took my sister and me out of school, packed us into our Renault 4, and drove all the way to Greece to join him. My job was to read the map. I recall entering Greece by ferry and realising I could not read the road signs: ‘Mum, they write differently here!’ – ‘Ah yes, I forgot; they do.’ A different script, soundscape, landscape, language, food, climate: all of this contributed to the sense of adventure and freedom of this and later field trips. When I became big and strong enough, I became a field hand. We only ever had two traditional family holidays.
Eleven years later, I finished school, did my military service, and enrolled to study geochemistry. I was drawn to Earth sciences but felt that I should not follow in my father’s footsteps too closely. However, it took just one geochemistry class for me to realise that geology was what I wanted, ending up doing a PhD in basin analysis at the very department where my father worked. The university was the first learning environment that suited me – at school I had been bored and unruly. This actually turned out to
pay off: at the age of 17, I was transferred to another school, where I not only managed to graduate, but also fell in love with a girl who is now my wife and mother of our two children.
When I received my PhD in 1999, job opportunities for geologists were scarce. I found a single vacancy at Rijkswaterstaat (Directorate-General for Public Works and Water Management). The job involved providing research support for minerals planning and policy development. Although I knew I would not spend my entire career there, I enjoyed it, learning to see research not as a goal in itself but as a means to an end.
At Rijkswaterstaat, I got to know the Geological Survey of the Netherlands, part of the Dutch research and technology organisation TNO. I moved there in 2003, eventually becoming head of department and chief geologist with responsibility for our public information services. We had already transitioned from traditional surface geological mapping to subsurface mapping. By the time I took on responsibility, it still required consolidation of the workflows and an independent quality-control system. We were pioneers in this shift, which I enjoyed as much as I had enjoyed those childhood drives to Greece. As the survey continued to grow, I stepped down as head of department to focus full-time on developing and expanding our geological
information services. In essence, my role as chief geologist is to consider where we should be heading and make that happen. I like to think I have the best geoscience job in the Netherlands.
We focus on geological resources and hazards. Our work spans the built environment and spatial planning (the upper tens of metres of the subsurface), groundwater (hundreds of metres), geo-energy (thousands of metres) and raw materials. Our agenda is shaped by global change, the energy transition, geopolitical developments and digital revolution.
I love geology, but love music just as much and consider it one of the greatest gifts my parents gave me. My father played the accordion, performing Balkan music — perhaps the closest he could get to the sounds of his youth in the Dutch East Indies. I began with the treble recorder, then learnt the violin, and started to play with and learn from my father. Today I primarily compose contemporary modal music, i.e., music based on oriental modes. I have recently released my fifth album recorded and produced largely in Greece.
For me, science and art are closely related. Both involve collaborating with talented people to create something meaningful. In art, however, you channel inspiration directly into the final product, while in science, you first have to challenge your ideas rigorously. I consider science and art to be mutually reinforcing factors in my life. In fact, my last album is geologically themed. Full circle.
BY ANDREW M c BARNET
Few geoscience technologies can have caused such a sensation as the 2002 commercial launch and subsequent early adoption of the controlled source electromagnetic (CSEM) survey method. It was hailed as the most important marine geoscience innovation since the introduction of 3D seismic.
Who would have thought that nearly 25 years later Electromagnetic Geoservices (EMGS), the Norwegian company that started it all, would be teetering on the brink of going out of business? Last month it stated, ‘It was likely to be dependent on securing additional financing to continue as a going concern beyond the near term’.
This development signalling the virtual disappearance of CSEM from the oil industry toolbox is stunning. The validity of the original concept remains intact, as do future possible applications to meet demands of the energy transition.
CSEM promised a way to enhance seismic data by confirming whether suspected hydrocarbon prospects are actually present in a structure, without going to the expense of drilling a well. As the industry moved into more costly, deeper-water exploration, the promise of fewer dry wells, improved ranking of development prospects, and more accurate or reduced appraisal drilling was enthralling.

dipole source to transmit a low-frequency electromagnetic signal to an array of seabed receivers. As the source is towed over the receiver array, the recording of the variations in the amplitude and phase of the received signal provides the data to determine the resistivity structure of the subsurface. The technology takes advantage of the fact that there is a significant contrast between resistive hydrocarbon-saturated reservoirs and surrounding more conductive layers saturated with aqueous saline fluids, hence the ability to confirm oil finds.
‘Prelude to an unexpected, frenetic investment boom’
EAGE’s First Break in March 2002 carried the first technical presentation under the unassuming title of ‘Sea Bed Logging (SBL), a new method for remote and direct identification of hydrocarbon-filled layers in deepwater’ by Terje Eidesmo and seven co-authors. The article described the method and results of a cruise survey successfully confirming the presence of hydrocarbons over the known oil-bearing Girassol field, offshore Angola. It was the prelude to an unexpected, frenetic investment boom bringing three specialised service companies on to the market, but ultimately with unfortunate consequences.
The initial technique, refined over the years to address different geological settings, involved the relatively simple (though it emerged not cheap) process of deploying a horizontal electric
The first cruise aboard the UK research vessel Charles Darwin was sponsored by Statoil (now Equinor) on the initiative of Eidesmo and Svein Ellingsrud, the company’s lead researchers. Ellingsrud was aboard accompanied by representatives from Scripps Institute of Oceanography (SIO) and its commercial partner AOA and from Southampton University. The two academic research centres supplied most of the source and receiver survey equipment. These had been developed in their continuing respective academic research into the resistivity of the lithosphere deploying offshore EM instrumentation (but not recognising the huge commercial potential). SIO’s Steve Constable had been in on the earliest offshore EM work in the US dating back to the 1970s and 80s. His boss then was
Prof Chip Cox who developed marine technology to investigate the resistivity of volcanic fluid systems in the crust and mantle.
Meanwhile ExxonMobil had been researching somewhat independently CSEM’s hydrocarbon exploration possibilities. Very soon after the Statoil cruise, it commissioned its own trial offshore Angola, with the same Charles Darwin and Sinha’s transmitters. This was led by Len Srnka (later to become EAGE’s only American president in 2012). The company quickly applied the method for real, notably associating it with a series of major finds offshore Angola. Their discoveries using its proprietary Remote Reservoir Resistivity Mapping (3M) technique were featured in a Wall Street Journal article, helping to fuel investor interest in the technology, said to have reached nearly $2 billion in money of the day. Three
service companies sprang up to exploit the new wonder technology, all stemming from that first cruise. First out of the gate was Electromagnetic Geoservices (EMGS), spun out of Statoil, led by the original team of researchers, and the only company that would survive the challenges ahead. Rival operator Offshore Hydrocarbons Mapping (OHM) was a UK company supported by the University of Southampton team, notably Prof Martin Sinha and Dr Lucy MacGregor. Both these entities would enter the stock market via well-supported IPOs. Finally, AOA Geomarine Operations (AGO), associated with Scripps, also began its own commercial services but was soon swallowed up by WesternGeco as seismic contractors soon wanted to add CSEM to their portfolios. OHM would form an alliance with CGG.
By 2007, the peak year for CSEM, hundreds of surveys had been completed worldwide. Leading the pack, EMGS (74% of the market) had carried out more than 300 surveys for companies including Shell, ExxonMobil, Statoil/Hydro, BP, Reliance, ONGC, Petronas, Woodside, and Murphy building a fleet of five vessels in three years with two more planned. Revenue was up from $22 million in 2004 to $140 million, 35 employees had grown to 260. The same year OHM had delivered its quota of surveys, was commissioning its first dedicated CSEM vessel and also acquiring Rock Solid Images, a specialist in interpretation and integration of seismic data with well-log and production data.
were always having to create the market. That same challenge has often affected marine seismic contractors when introducing new technology to a notoriously risk-averse oil industry. In this case a lot of energy was spent on convincing oil companies of the value of the CSEM technique. This was not helped by a series of patent disputes pursued by EMGS claiming its proprietary claims to the technology had been infringed, impacting its rivals but also causing uncertainty in the marketplace.
Most of the early adopters were major oil companies with money to shell out on innovation, encouraged by significant early successes. The initial focus was on data acquisition, accumulated globally at a frenetic pace by three competing contractors, soon diminishing the number of obvious targets. Pressure on margins for operations, considered discretionary spending by their clients, would also take its toll.
‘Extensive research into the optimum value continues apace’
Adding to the mix in 2004, a new company MTEM (Multi-transient Electromagnetic), was launched as a spin-out from research at the University of Edinburgh by Prof Anton Ziolkowski, Bruce Hobbs and David Wright. The company proposed a variant of EM sounding which measured the flow of controlled pulses of electrical current put into the ground and then detailed the resistivity of the rocks and hence the nature of the fluids. Initially aimed at land and shallow water applications, MTEM was potentially attractive to geoscientists being more like seismic in its application technique.
Everything began to unravel in 2008. The financial crisis that year took its toll on the service sector and CSEM was deeply impacted. WesternGeco withdrew from the market the following year, OHM only survived until 2011. Its marine operations were taken over by EMGS, and processing and interpretation morphed back into Rock Solid Images, an early advocate of a multi-physics strategy.
Sifting through the company’s annual reports for the next decade tells the story of EMGS investing in many initiatives to improve the company’s offerings, including multi-client services. But managing a decade of limited oil company exploration spending, with declining interest in CSEM, required constant cost-saving measures and refinancing. The Covid pandemic didn’t help. By 2023 no new vessel work was obtained and only minimal contracts were posted in the next two years.
The warning signs were always present, easy to identify in retrospect. Throughout the first decade, the service providers
Ironically, what denied the concept of CSEM a lasting future were the data results. Outside academic institutions and a few companies, there was little expertise in processing and interpretation of collected data. Much of the onus was on the contractors themselves to point the way. It was soon clear, as Srnka and colleagues wrote in 2006, that ‘Resistivity determination is clearly not a foolproof method for hydrocarbon identification, as many non-hydrocarbon-bearing geologic facies such as evaporites, volcanics, and tight carbonates can exhibit enhanced electrical resistivity relative to their surroundings’.
EMGS itself acknowledged that CSEM was best treated as a complementary tool to be applied in conjunction with marine seismic surveys. In 2012, one of the original researchers, MacGregor, who joined Rock Solid Images as chief technology officer, highlighted the thinking in an SEG honorary lecture tour entitled ‘Integrating well log, seismic, and CSEM data for reservoir characterisation’.
Around 2020 MacGregor was briefly chief technology officer of Ocean Floor Geophysics, a Canadian seabed mapping and site investigation company that continues to develop a multi-physics approach including CSEM. OFG had acquired exclusive rights to the towed-streamer controlled source electromagnetic (CSEM) acquisition system developed by PGS but abandoned in 2018. It was an early entrant into the field, in 2007 acquiring MTEM at considerable cost, hoping to leverage its technology, but never getting beyond a prototype.
As EMGS falters, extensive research into the optimum value of CSEM continues apace, judging from the stream of papers available at EAGE’s EarthDoc geoscience database. The consensus seems to be that CSEM offers several advantages over seismic for some specific use-cases, notably improved sensitivity to gas saturation, robustness in the presence of overburden effects, and the potential for undertaking repeat time-lapse surveys at reduced cost. The commercial challenge is to exploit these advantages at scale for a range of existing and new applications.
Views expressed in Crosstalk are solely those of the author, who can be contacted at andrew@andrewmcbarnet.com.


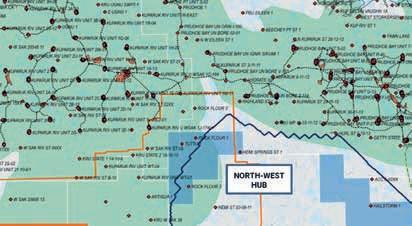
Rystad expects a strong year for high-impact wells driven by exploration in
High-impact wildcat drilling activity is forecast to have another good year after the success rate for high-impact wildcat wells rose to 38% from 23% in 2024. Total discovered volumes increased by 53% year on year to around 2.3 billion barrels of oil equivalent (boe), according to Rystad Energy’s High Impact Well Outlook
Forty two high impact wells are expected to be drilled globally in 2026. Around 40% of planned high-impact exploration wells, will be drilled in Africa, with exploration expected to focus on the Orange Basin in Southern Africa and the Gulf of Guinea in West Africa.
Ultra-deepwater wells account for around 60% of planned drilling, with majors leading these activities, followed by national oil companies (NOCs) and international NOCs (INOCs), which together represent 26%. Most wells are expected to target frontier regions, while roughly 5% will focus on basins with prior discoveries that could develop into hydrocarbon hotspots, and another 5% will test entirely new plays. Africa is set to play a central role, with all onshore high-impact drilling in 2026 expected to take place on the continent except for the recently announced Greenland well, which will test the frontier Jameson Land.
‘What we are seeing in 2026 is a clear shift in where operators are willing to deploy capital. Ultra-deepwater and

frontier plays remain capital-intensive, but they also offer scale and material upside at a time when conventional opportunities are increasingly limited. Africa stands out because it still combines geological potential with the prospect of large, commercially meaningful discoveries, particularly for operators looking to secure long-life resources in a tightening global supply environment,’ said Aatisha Mahajan, head of exploration, oil and gas research, Rystad Energy.
Outside Africa, Asia accounts for eight high-impact wells, led by Indonesia with four, followed by India and Malaysia with two each. ‘While Asia remains a key region for hydrocarbon exploration, opportunities are increasingly clustered in established areas, suggesting that new
high-impact growth will likely depend on unlocking less mature basins or more technically challenging fields,’ said Rystad.
As of now, 2025 stands as the weakest year of the past decade in terms of new volume additions in Asia, with total discoveries hovering around 1 billion boe.
In North America, discoveries in Canada and Mexico have largely stalled, leaving the US Gulf of America as the main source of new volumes, where recent finds remain oil-weighted and concentrated in mature, heavily explored basins. In 2025, total discoveries fell to around 238 million barrels, with Mexico contributing three finds of approximately 68 million barrels and the US Gulf of America adding four finds totalling about 170 million barrels.
TGS has won a 4D streamer acquisition contract in the North Sea, offshore Norway. A Ramform vessel is scheduled to mobilise for the survey in Q2 2026, with the contract expected to run for approximately 65 days.
Kristian Johansen, CEO of TGS, said: ‘We are very pleased to secure this 4D streamer contract for a repeat customer.
We have successfully conducted several monitoring surveys in this area, demonstrating the capabilities of our Ramform-designed vessels and our proprietary GeoStreamer technology.’
Meanwhile, TGS has won an additional ocean bottom node (OBN) contract in Europe from a repeat customer. The company’s node-on-a-rope crew will mobilise
in mid-summer, with the project expected to run for approx. 30 days.
Finally, TGS has won an OBN contract in Europe over a ‘well-established producing field’ for a repeat customer. The company’s node-on-a-rope crew is scheduled to commence acquisition in early April and the contract has a duration of approx. 45 days.
Shearwater GeoServices has won a 3D seismic acquisition contract from Eni covering the PSC TL SO 22-23 area in the Timor Sea.
The project comprises approx. 1500 km2 and is scheduled to commence late in the first quarter of 2026. The two-month survey will be conducted by Shearwater’s high-capacity vessel SW Bly that will deliver data directly from the vessel to the client.
‘This award strengthens Shearwater’s engagement with Eni and demonstrates its confidence in our efficient execution platform, advanced seismic technology and data quality,’ said Irene Waage Basili, Shearwater CEO.
Meanwhile, Shearwater has won a contract for a large 3D seismic acquisition programme for ExxonMobil offshore Trinidad and Tobago.
The deepwater survey will cover approximately 6000 km2 of full-fold area. The acquisition is scheduled to commence in the first quarter of 2026 and is expected to take around five months.
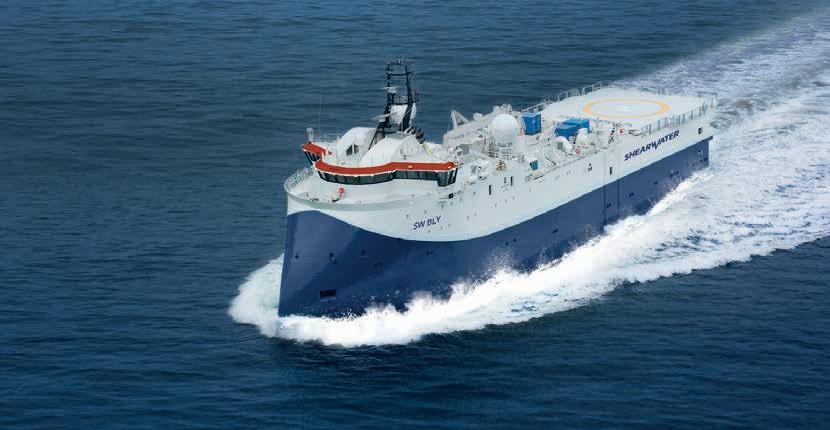
Shearwater’s high-capacity streamer vessel Amazon Warrior will undertake the acquisition, utilising its multi-component Isometrix streamer technology.
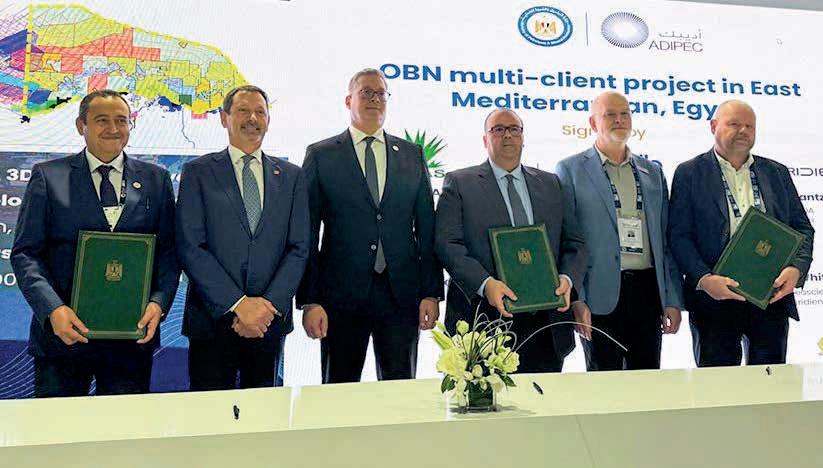
Viridien and SLB are launching a massive multi-client ocean bottom node (OBN) seismic acquisition and imaging
program offshore Egypt’s eastern Mediterranean coast.
The largest project of its kind in the region for client the Egyptian Natural Gas Holding Company (EGAS) will give explorers and investors a clearer understanding of the region’s complex subsurface and help them to identify opportunities for exploration and enhanced production.
Data acquisition is scheduled to begin in the first quarter of 2026.
Mahmoud Abdel Hamid, chairman of EGAS, said: ‘The Egyptian East-
ern Mediterranean has great potential for development but features some of the most challenging environments for seismic imaging owing to the complex faulting and the Messinian evaporite layer that masks deep reservoirs formed from complex channel sand bodies. Our partners Viridien and SLB have decades of specialised imaging expertise in the region and will apply their cutting-edge technologies to deliver the clearest insight into the subsurface to help operators better evaluate and prioritise opportunities.’
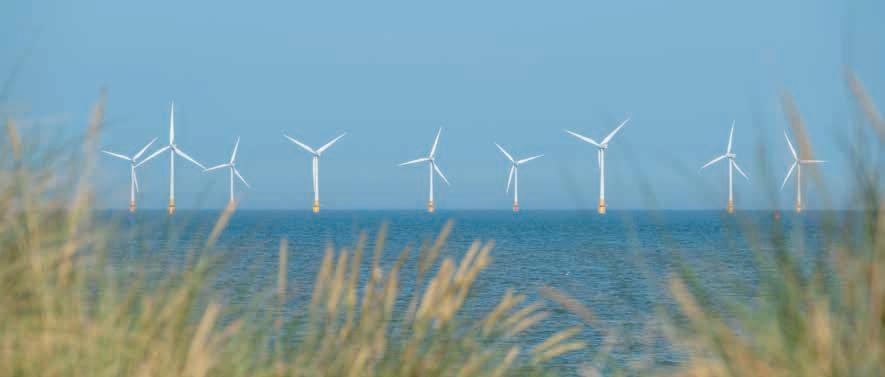
The UK has signed a clean energy security pact – the Hamburg Declaration – with several European countries to bolster energy security.
The deal will drive forward joint offshore wind projects between European countries, including Germany, Norway, France and Denmark.
North Sea countries have agreed to deliver 100 GW of offshore wind power through joint clean-energy projects. These will include new ‘offshore wind hybrid assets’ — wind farms at sea that are directly connected to more than one country through interconnectors.
UK Energy secretary, Ed Miliband, said: ‘We are standing up for our national interest by driving for clean energy, which can get the UK off the fossil fuel rollercoaster and give us energy sovereignty and abundance.’
It is hoped that the declaration will lead to the building of more interconnectors, enabling countries in the North Sea to send clean power to where it’s needed most.
The UK signed a statement of intent with Germany, Belgium, Denmark, the Netherlands to unlock cross-border offshore electricity projects, focusing on joint planning, cost-sharing and market arrangements to speed up delivery.
The UK also agreed a framework to deepen German and UK collaboration on offshore hybrid assets, advanced subsea energy infrastructure that combine offshore wind farm connections with electricity interconnectors.
Ben Wilson, president of National Grid Ventures, said: ‘Today is a step towards a more integrated energy system in the North
Sea. LionLink and projects like those being announced today are important for maximising the efficient use of resources, reducing costs, and minimising the impact on coastal communities.’
Meanwhile, Britain has announced record levels of solar and onshore wind projects as well as tidal energy schemes in its latest renewables auction.
‘Combined with January’s offshore wind auction [which secured 8.4 GW of offshore wind], the government has now delivered a record 201 projects, generating 14.7 GW of new clean power – enough to supply the equivalent of 16 million homes,’ said the UK government in a statement.
This puts the UK on track for its 2030 clean power target. New onshore wind has been agreed at a price of £72.24/MWh and new solar at £65.23/MWh, both under half the £147/MWh cost of building and operating new gas power stations.
The projects, which are expected to unlock £5 billion in private sector investment, include: Imerys Wind Farm in Cornwall – the largest onshore wind project to be successful in England in a decade; Sanquhar II Wind Farm in Dumfries and Galloway in Scotland – the fourth largest onshore wind farm in the UK; and the West Burton solar farm – the largest solar farm ever to win a government renewables contract.
Miliband said: ‘These results shows once again that clean British power is the right choice for our country, agreeing a price for new onshore wind and solar that is over 50% cheaper than the cost of building and operating new gas.’
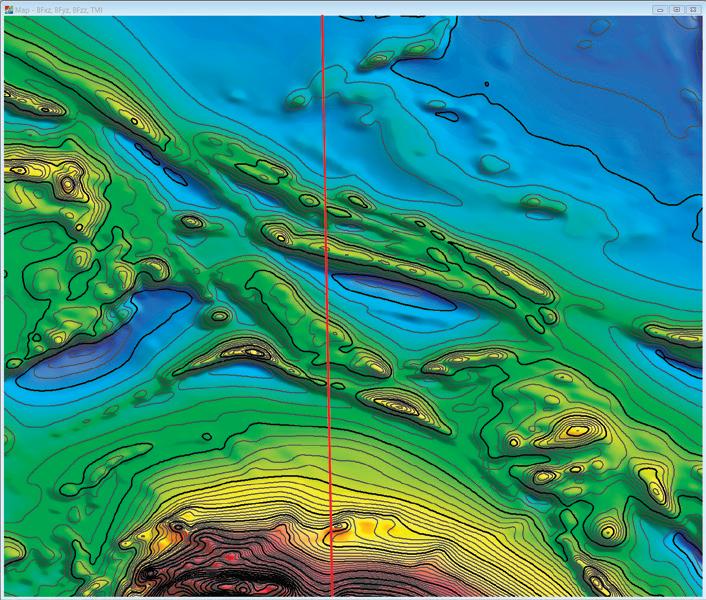
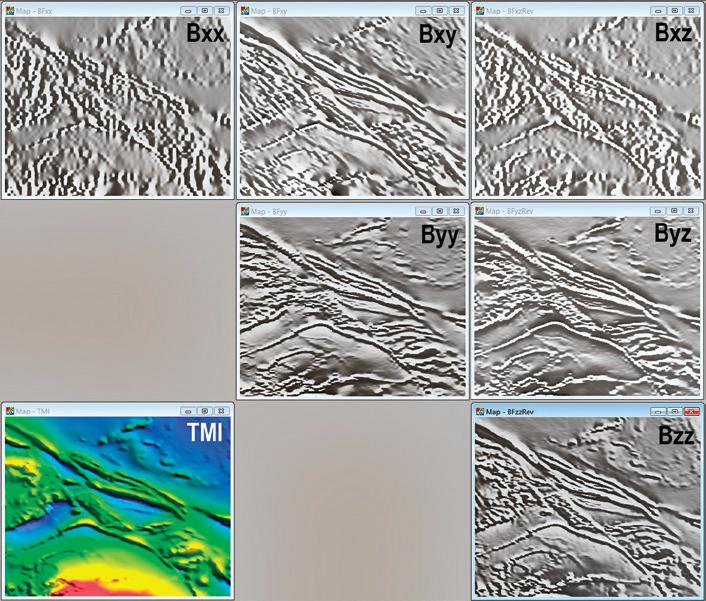
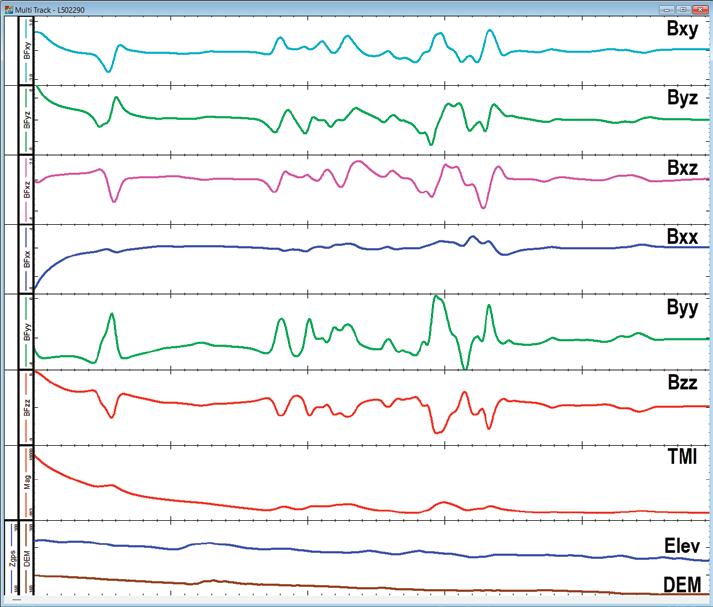

TGS has reported fourth quarter 2025 net income of $7 million on revenues of $363 million compared to net income of $38 million on revenues of $492 million in Q4 2025.
Operating profit of $28 million compared to $90 million in Q4 2024.
Multi-client sales of $264 million in Q4 2025 were slightly up on $261 million in Q4 2024. However, contract sales of $99 million were well down on $231 million in Q4 2024.
The company reported order inflow of $598 million in Q4 2025, increasing order backlog to $706 million. Net cash flow was $206 million in 2025, while net debt has been cut by $73 million to $473 million in 2025.
For the year ahead, TGS is expecting mulit-client investments of $500-575 million, up from $447 million in 2025. Gross operating cost of $950 million for this year will remain at around the same level as 2025.
TGS CEO Kristian Johansen said: ‘Considering the difficult market conditions, I am satisfied with our Q4 2025 results. We gained significant traction with customers, achieving an order inflow of $598 million — our best quarter since before the pandemic. Our multi-client business performed well, and strong momentum at year-end meant our sales-to-investment ratio met our annual goal of 2.0x. Although contract revenues in Marine Data Acquisition were affected by reduced proprietary seismic sur-
88 Energy has acquired the Schrader Bluff 3D seismic dataset, recently released by the Alaska Department of Natural Resources.
The survey provides subsurface coverage across the NorthWest Hub of the South Prudhoe acreage, adjacent to the largest onshore oilfield in the US – the Prudhoe Bay Unit.
The dataset will support the maturation of multiple prospects, inform an internal update to resource estimation and assist in the identification of future well locations adjacent to established producing fields and existing infrastructure.
The Schrader Bluff 3D is expected to enhance 88 Energy’s ability to refine structural and stratigraphic interpretation across the South Prudhoe leases, while improving correlation of key horizons and reservoir intervals with regional fields and discoveries to 88E prospects, strengthening confidence in both existing and emerging prospectivity.
The dataset will advance prospect definition within key Ivishak, Kuparuk, plus the additional Brookian, intervals, which represent stacked, high-potential reservoirs; and de-risk multiple low-to-moderate risk structures identified on 3D datasets already held by 88 Energy and supported by offset well data, including the historical Hemi Springs State-1.
This data is to be incorporated into 88 Energy’s internal exploration database and will support investment for the drilling programme, scheduled for Q1 2027. It will be closely followed by purchase of the Kad River 3D Survey release in March 2026 which covers the new Kad River East leases secured by 88 Energy in the 2025 North Slope Bid Round.
88 Energy leveraged the State of Alaska’s Tax Credit Seismic 3D program, which makes historic 3D seismic datasets
vey activity, our integrated business model allowed us to improve asset utilisation, thanks to increased demand for multi-client projects. The Imaging division benefited from a sharpened strategic approach, producing a 65% growth in pro-forma external revenue for 2025.
‘Due to oil price uncertainty and elevated geopolitical risks, we do not expect notable improvements in market conditions in the near future. However, as the global oil market is expected to move toward a more balanced state in the latter part of 2026, and as our clients increasingly prioritise reserve health and exploration for new resources, I am optimistic about a sustained recovery in demand over the longer term.’
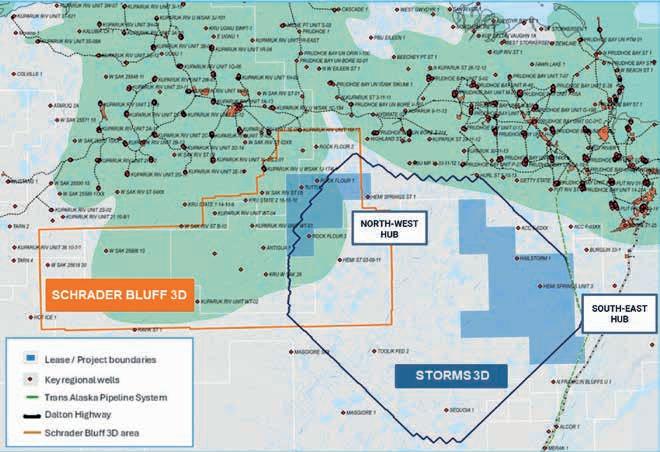
South Prudhoe lease areas: Shown in light blue, which includes the formerly named Project Leonis leases together with the newly purchased Schrader Bluff 3D seismic survey area (orange)and the historically purchased Storms 3D seismic survey.
publicly available at a small fraction of their original acquisition cost in order to encourage exploration investment.
88 Energy will release updated internal prospective resource estimates for the South Prudhoe acreage position in Q1 CY2026. These estimates will follow detailed interpretation of the Schrader Bluff 3D in conjunction with Storms 3D and other licensed datasets.
The updated internal estimates will cover the Ivishak and Kuparuk reservoirs, as well as the shallower Brookian formations.
Petronas has launched the Malaysia Bid Round 2026 (MBR 2026), which includes nine exploration blocks across Malaysia.
The portfolio features an exploration block in the frontier Sandakan Basin, exploration blocks in the emerging West Sarawak Basin and near-field exploration blocks with new play ideas in the mature Malay Basin. The bid round also includes six Discovered Resource Opportunities (DRO) offering ‘ready-to-develop’ pathways for monetisation.
Meanwhile, Petronas has signed a concession agreement with the Government of the Sultanate of Oman and OQ Exploration and Production Batinah Offshore LLC (OQEP) as its partner for the exploration of oil and gas in Block 18. Block 18 offshore northeast Oman spans more than 21,000 km2 and offers ‘sig-
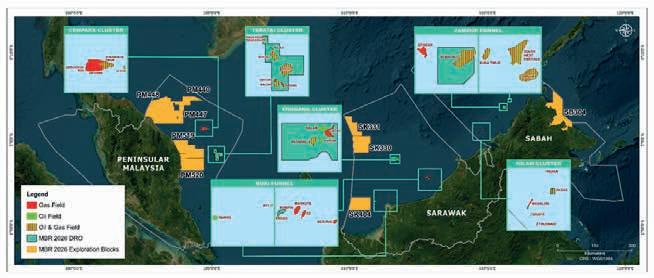
nificant frontier exploration potential’ across diverse geological settings, from shallow to ultra-deep water.
TGS and SLB have launched the latest phase of the companies’ OceanBottom Node (OBN) multi-client campaign in the Gulf of America.
Engagement 9 covers 161 OCS blocks in the Walker Ridge protraction area, one of the Gulf of America’s most prolific deepwater provinces.
‘This new dataset is expected to deliver step change improvements in subsurface illumination across a region
known for its structural complexity and deep hydrocarbon potential,’ said TGS in a statement. ‘Implementation of a low frequency source enables richer low frequency content that significantly enhances FWI and long wavelength velocity model-building.’
The project’s areal coverage includes several of the basin’s most significant producing assets, including Stones, Jack, St. Malo, and Cascade, providing
operators with a modern, high-quality imaging uplift across established production corridors. Engagement 9 is also positioned to unlock infrastructure-led exploration opportunities, offering clients greater subsurface confidence adjacent to existing infrastructure in a region with a strong commercial track record.
Acquisition is projected to conclude in July 2026, with final data products anticipated for release in H2 2027.
Geoex MCG and DUG are reprocessing the legacy offshore Equatorial Guinea regional 2D seismic dataset.
The project, in partnership with the Ministry of Hydrocarbons and Mining Development (MHMD), brings geological clarity to one of West Africa’s least explored offshore regions, enabling operators to assess opportunities across the central deepwater domain – an area historically lacking modern imaging.
The data is being reprocessed by DUG using PSDM workflows enhanced with
FWI – advanced anisotropic model building; simultanewneous reprocessing with its Rio Muni MC3D dataset for imaging consistency; and integration of up to 36 producing and frontier wells to anchor the velocity model and improve interpretive confidence.
‘The resulting PSDM dataset will offer significantly improved imaging of Miocene and Upper Cretaceous-Paleogene plays, fracture zones, deep structural trends, and potential migration pathways,’ said MCG and DUG in a statement.
Producing fields ring the offshore perimeter, but the central offshore remains largely untouched. The project ties wells to frontier areas (multiple regional 2D surveys), illuminating structures and trends previously masked by legacy data.
‘With industry interest rising in deepwater oceanic source rock plays, offshore EG offers a compelling opportunity. The new regional imaging provides the structural and depositional context necessary to evaluate this emerging frontier,’ said Geoex MCG and DUG.
Chevron has won an oil block in the 2025 Libyan Bid Round after bidding for Contract Area 106 located in the Sirte Basin. The company has also signed an MoU with an NOC in Tripoli to evaluate the development and exploration potential onshore Libya.
A consortium of Eni and Qatar Energy have won offshore exploration Licence O1 in Libya’s licensing round. Covering approx. 29,000 km2, the block lies in the Sirte oil and gas province.
SeaBird Exploration, has signed a threemonth contract extension for OBN source work for the vessel Eagle Explorer in the Western Hemisphere. The extension commits the vessel through to mid-May 2026 on the same commercial terms.
Equinor has sold its onshore position in Argentina’s Vaca Muerta basin to Vista Energy in a deal worth $1.1 billion. The transaction includes Equinor’s 30% non-operated interest in the Bandurria Sur asset and its 50% non-operated interest in the Bajo del Toro asset.
The US District of Columbia has granted the preliminary injunction sought by Ørsted to challenge the suspension order on the Sunshine Wind Project issued by US Bureau of Ocean Energy Management (BOEM) on 22 December. The court allowed the project to restart immediately while the underlying lawsuit challenging the BOEM order progresses.
TotalEnergies and Kuwait Oil Company (KOC) have signed an agreement to conducgt studies related to new exploration opportunities in the country.
MOL has signed an agreement with Libya’s National Oil Corporation (NOC) for cooperation in hydrocarbons exploration, technological innovation and crude trading.
Aramco and Microsoft have signed an agreement to help Aramco accelerate industrial artificial intelligence (AI) adoption, using Microsoft Azure.
TGS has started the Nigeria Onshore MegaSurvey covering 28,000 km2 across the Onshore Niger Delta.
The project – in partnership with the Nigerian Upstream Petroleum Regulatory Commission (NUPRC), Petrodata Management Services and Reighshore Energy Services –will deliver merged, continuous, modern 3D seismic coverage across one of Nigeria’s most established hydrocarbon provinces, with final products expected to be available in Q3 2026.
‘The onshore Niger Delta is a mature basin with a long history of exploration and production. However, much of the existing subsurface seismic data coverage is fragmented, limiting the ability of operators to assess opportunities at a regional scale,’ said TGS.
‘The Nigeria Onshore MegaSurvey addresses this challenge by delivering consistent seismic data continuity, enabling operators to review existing fields, evaluate undeveloped discoveries, and progress new exploration opportunities across the basin. By providing a unified regional dataset, the MegaSurvey supports more efficient subsurface evaluation, improved portfolio screening, and accelerated decision-making in an area that remains critical to Nigeria’s oil and gas sector.’
Meanwhile, TGS has launched the Ultra Profundo multi-client 2D survey offshore Angola.
The vessel Ramform Victory started shooting the 12,600 line km survey in Q1. Data acquisition is estimated to be completed in approximately 100 days,
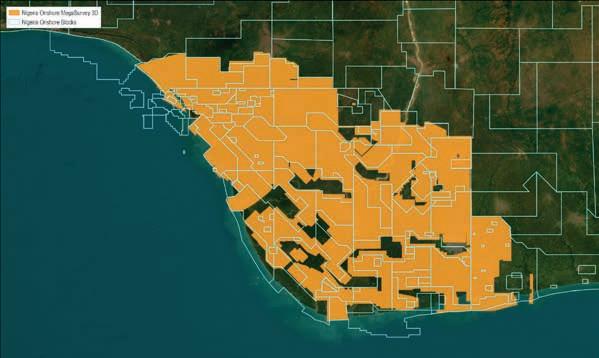
with fast-track products available in Q3. Full data processing is scheduled for completion in Q2 2027.
The Ultra Profundo multi-client 2D survey marks the first 2D multi-client acquisition over Angola’s ultra-deepwater areas since 2015 and targets a highly underexplored region. The survey delivers modern, long-offset seismic data critical for imaging complex pre-salt and top-salt structures as well as basin floor channel systems, significantly enhancing regional geological understanding.
Kristian Johansen, CEO of TGS, said: ‘Angola’s ultra deepwater margin represents one of the most exciting frontier exploration opportunities in West Africa. Our Ultra Profundo multi-client 2D program delivers high-quality seismic coverage needed to unlock pre-salt and sub-salt potential.’
Finally, TGS has signed a letter of intent with the Libya National Oil Corporation (NOC) to expand multi-client data activities in Libya.
A British Geological Survey (BGS) report says that sandstone beneath the central North Sea could provide one of the UK’s largest carbon storage resources.
‘BGS geologists are studying the subsurface geology, sandstone connectivity, and sealing layers to ensure safe, longterm storage,’ said the BGS in a statement. ‘The central North Sea, which represents
about 60% of the UK’s total carbon storage capacity, is relatively under-studied compared with other regions like the southern North Sea and Irish Sea.
‘BGS aims to better understand and characterise this high-potential storage system to accelerate the UK’s CCS industry and help meet the target of storing 170 million tonnes of CO2 per year by 2050.’
ExxonMobil reported fourth-quarter 2025 earnings of $6.5 billion. Earnings excluding identified items were $7.3 billion. Cash flow from operating activities was $12.7 billion and free cash flow was $5.6 billion. For the full-year 2025, the company reported earnings of $28.8 billion and spent $20 billion on share repurchases.
Equinor has reported adjusted operating income $6.2 billion and $1.55 billion after tax in the fourth quarter of 2025. The company reported a net operating income of $5.49 billion and a net income of $1.31 billion. The company delivered 6% production growth in the quarter and 3.4% for the full year. Free cash flow was $4 billion while operating costs have been reduced by 10%. Equinor is expecting 3% oil and gas production growth in 2026.
TotalEnergies has reported fourth quarter adjusted net income of $3.8 bil-
lion. It has generated cash flow of $7.2 billion in the 4th quarter, despite a drop of more than $5/b in oil prices. In 2025, TotalEnergies reports adjusted net income of $15.6 billion, down 15% year-on-year reflecting oil price decrease while cash flow of nearly $28 billion decreased by only 7% year-on-year.
Shell has reported Q4 2025 adjusted earnings of $3.3 billion and CFFO of $9.4 billion. The company has generated free cash flow of $26 billion. More than $3.5 billion of shares have been bought back. Net debt is ~$45.7 billion ($16.8 billion excluding leases) and gearing 20.7%. Shell reported $2 billion of cost reductions in 2025 and $5.1 billion since 2022. Capex in 2025 was $20.9 billion; cash capex outlook for 2026 is $20-22 billion.
Chevron has reported earnings of $2.8 billion for fourth quarter 2025, compared
with $3.2 billion in fourth quarter 2024. Adjusted earnings of $3 billion in the fourth quarter 2025 compared to adjusted earnings of $3.6 billion in the fourth quarter 2024. Cash flow from operations was $10.8 billion.
BP has reported fourth quarter 2025 underlying RC profit of $1.5bn delivered against a weaker oil price environment. Operating cash flow was $24.5bn, including $2.9bn adjusted working capital. The company has suspended its buy back scheme and will focus resources on lowering debt. Full year RC profit was $7.5 billion.
ConocoPhillips has reported fourth-quarter 2025 earnings of $1.4 billion, compared with fourth-quarter 2024 earnings of $2.3 billion. Full-year 2025 earnings were $8 billion, compared with full-year 2024 earnings of $9.2 billion.
Fugro has won a contract to perform geotechnical surveys for the NordSee Energies’ 2GW offshore wind farm being developed by TotalEnergies on the North Sea offshore Germany.
The investigations will provide insights into seabed conditions at planned wind turbine locations and inter-array cable routes.
Fieldwork is already underway, with Fugro mobilising a fleet of five specialist vessels to carry out the surveys approximately 170 km off the German coast, across an area of around 200 km².
The campaign includes investigations at around 140 locations, reaching depths of up to 50 m below the seabed.
Fugro is deploying its Seacalf Mk V seabed cone penetration testing system and after the fieldwork an extensive laboratory testing programme will be carried out. The resulting Geo-data will be delivered through VirGeo, Fugro’s cloud-based Geo-data platform, and used to understand soil behaviour across the different turbine loading areas, as well as to inform the design, installation, and protection of the inter-array cables.
DUG and Searcher are reprocessing multi-client 3D seismic data off the coast of East Sarawak, Malaysia.
The companies will reprocess more than 60 individual legacy 3D surveys covering 45,000 km2 from original field data using its advanced FWI algorithms and
pre-stack imaging workflows to produce one seamless 3D seismic volume.
Seismic reprocessing is expected to commence in the first quarter of 2026 with final deliverables available from mid2027. Interim results will be available to assist with early acreage evaluation.
Alan Hopping, managing director of Searcher said that the data would support the evaluation of hydrocarbon potential.
‘The FWI reprocessing will provide uplifted imagery, enabling increased prospectivity and driving exploration success in the region.’
The UK Government has granted consent for the Outer Dowsing offshore wind farm in the Southern North Sea, 54 km from the Lincolnshire coast, comprising up to 100 turbines and associated infrastructure. Underground onshore cables will carry the power from the landfall site close to Anderby Marsh to a substation at Surfleet Marsh.
TotalEnergies has signed two long-term Power Purchase Agreements (PPA) to deliver 1 GW of solar capacity to supply Google’s data centres in Texas. The power will be generated from TotalEnergies-owned sites in Texas: Wichita (805 MWp) and Mustang Creek (195 MWp).
Copenhagen Offshore Partners have signed an agreement with the UK Crown Estate for the Morecambe offshore wind project in the Irish Sea, while JERA Next bp has signed an agreement for the Mona offshore wind project in the Irish Sea. The projects have a combined capacity of nearly 2GW. Jera Next bp and EbBW have cancelled the Morgan offshore wind project in the Irish Sea.
Scatec’s SNAP joint venture with Aboitiz Renewables is preparing to start construction of the 40 MW Binga (phase 2) and 40 MW Ambuklao battery energy storage systems (BESS) in the Philippines. The battery systems will be co-located with the Binga and Ambuklao hydro power plants in the province of Benguet.
DNV has announced that Adnoc has been awarded a CO2 storage certificate for its West Aquifer CO2 storage development in the United Arab Emirates. It recognises that Adnoc has demonstrated the necessary subsurface characterisation, reservoir understanding, containment assessment, and risk management.
The Dutch-German N05-A gas development, operated by ONE-Dyas, has become the first natural gas production project in the North Sea to be independently certified as meeting the highest grade under MiQ’s methane emissions standard after an assessment by Intertek.
Equinor and its partner ORLEN have discovered gas and condensate in the ‘Sissel’ prospect in production licence 1137 in the North Sea, 5 km southeast of the Utgard field. The discovery is estimated at 6 to 28 million barrels oil equivalent (o.e.). The well’s primary exploration target was to prove petroleum in Middle Jurassic reservoir rocks in the upper part of the Hugin Formation (Vestland Group). The secondary exploration target was to prove petroleum in Middle Jurassic reservoir rocks in the lower part of the Hugin Formation (Vestland Group). Well 15/8-3 S encountered condensate-rich gas in sandstone layers in the upper part of the Hugin Formation with an overall thickness of 148 m, 57 m of which consists of sandstone layers with moderate-to-good reservoir quality. The well proved a hydrocarbon column of about 95 m.
Cairn Oil and Gas has made a gas discovery in its appraisal well in the Ambe2A Miocene-Tarkeshwar formation on the west coast of India.
OKEA and its partners have discovered petroleum in the ‘Knockando Fensfjord’ prospect in the North Sea. Preliminary estimates indicate between 0.5 and 1.5 million
Sm3 of recoverable oil equivalent (o.e.) if the discovery is oil. If it is gas, the estimate is between 0.4 and 0.9 million Sm3 of o.e.
Eni has made a ‘significant’ gas and condensate discovery in the Ivory Coast. The discovery, named Calao South, confirms the potential of the Calao channel with estimated volumes of up to 5.0 Tcf of and 450 million barrels of condensate (approximately 1.4 billion barrels of oil). The discovery was made in high-quality Cenomanian sands. The main hydrocarbon-bearing interval has a gross thickness of around 50 m, with excellent petrophysical properties.
Equinor, Petoro and OMV have discovered oil and gas in the ‘Granat’ prospect near Gullfaks, 190 km northwest of Bergen. Preliminary estimates place the discovery between 0.2 and 0.6 million Sm3 of recoverable oil equivalent (o.e.).
Chevron has found hydrocarbons in multiple reservoir zones in the shallow offshore western Niger Delta.
The government of the Philippines has discovered a ‘major natural gas field’ at the Malampaya East 1 (MAE-1) reservoir. The reservoir is estimated to hold around 98 billion cubic feet of gas in place.
Indonesian energy services company Elnusa has acquired 25,000 Stryde Range+ nodes to accelerate onshore exploration activities across the country.
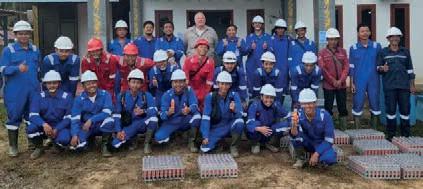
Stryde Range+ nodes are complemented by the Stryde Nimble and Mini acquisition systems, which provide Elnusa with a dual-platform seismic acquisition capability, enabling improved survey design, simultaneous project execution, optimised resource utilisation, and accelerated exploration timelines across Indonesia, said Elnusa.
The Stryde Nimble System will serve as Elnusa’s primary platform for large-scale seismic acquisition. Capable of handling up to 3240 nodes per day, the system is designed to maximise operational efficiency through bulk handling workflows, high-volume charging, and rapid data harvesting, said Stryde.
Stryde’s Mini System is a ‘compact and highly portable solution ideal for parameter testing, early-stage field trials, and small-scale surveys,’ said Stryde. ‘With its lightweight design and minimal crew requirements, the Mini System allows rapid deployment across diverse terrains, supporting agile decision-making in early exploration phases.’
Ritesh Kumar Sharma1*, Neeraj Kumar 2 and Satinder Chopra1
Abstract
Class III AVO (amplitude variation with offset) anomalies are widely recognised as hydrocarbon indicators, with the product of intercept (A) and gradient (B) often used as a direct fluid discriminator. This AB attribute successfully predicted gas-bearing sands at Well A, resulting in a commercial discovery. A follow-up well was proposed to target two zones both exhibiting strong Class III anomalies in the AB attribute. However, the drilling results revealed that while the upper interval did indeed contain hydrocarbons, the lower interval consisted of high-porosity brine sands adjacent to thin coal layers. Well logs and synthetics confirmed that both geological scenarios can yield strong AB anomalies, thus complicating fluid prediction.
We propose two new frequency-sensitive diagnostics to enhance AVO analysis, namely, the Frequency Stability Index (FSI), which measures the stability of AB across frequencies, and the slope of AB versus frequency respectively, which captures its overall trend. Application to both real and synthetic data from one case study demonstrates how the hydrocarbon-bearing sands can be differentiated from coal beds and brine-sands using frequency-dependent attributes and their crossplots. This workflow offers a practical and quantitative method for improving fluid prediction in exploration and appraisal settings.
Introduction
Amplitude variation with offset (AVO) is a foundational technique in quantitative seismic interpretation, with Class III anomalies, defined by a negative intercept and a strong negative gradient, commonly linked with gas sands (Shuey, 1985; Rutherford and Williams, 1989). Among the various AVO-derived attributes, the product of intercept (A) and gradient (B), known as the AB product, has proven particularly effective for delineating hydrocarbon-bearing sands (Fatti et al., 1994; Castagna and Swan, 1997).
In our study area, the AB attribute initially demonstrated promising predictive value. At Well A, a strong Class III AB anomaly successfully identified gas-bearing sands, which
were later confirmed by drilling (Figure 1a). Encouraged by this result, a nearby prospect was drilled at Well B, targeting two intervals that both exhibited pronounced Class III AB anomalies (Figure 1b). However, post-drill results revealed an important limitation: while the upper anomaly corresponded to hydrocarbons, the lower anomaly was associated with high-porosity brine sands adjacent to thin coal beds. Synthetic modelling and log analysis confirmed that both scenarios can generate similar Class III responses, underscoring the risk of relying on AB attribute alone for hydrocarbon discrimination (Figure 2).
This challenge is well documented in the literature. Coal seams can generate strong reflections due to their high elastic
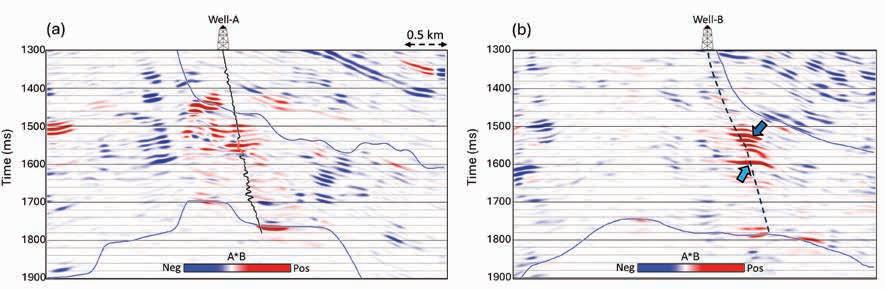
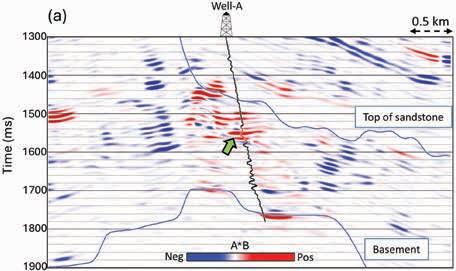
1 SamiGeo | 2 Canacol Energy
* Corresponding author, E-mail: Ritesh.Sharma@samigeo.com DOI: 10.3997/1365-2397.fb2026016
Figure 1 Segment of an inline extracted from the product of intercept and gradient (A×B) volume, passing through (a) Well-A, and (b) Well-B. In (a), the bright red-coloured anomalies intersected by Well-A within the interval bounded by the ‘top of sandstone’ and ‘basement’ markers, were confirmed to be hydrocarbon-bearing zone (green block arrow). In contrast, in (b), although similar red anomalies are present, Well-B encountered hydrocarbons only in the upper anomaly (indicated by the dark-blue block arrow), while the lower anomaly (indicated by the light-blue block arrow) was found to be a highporosity brine sand.
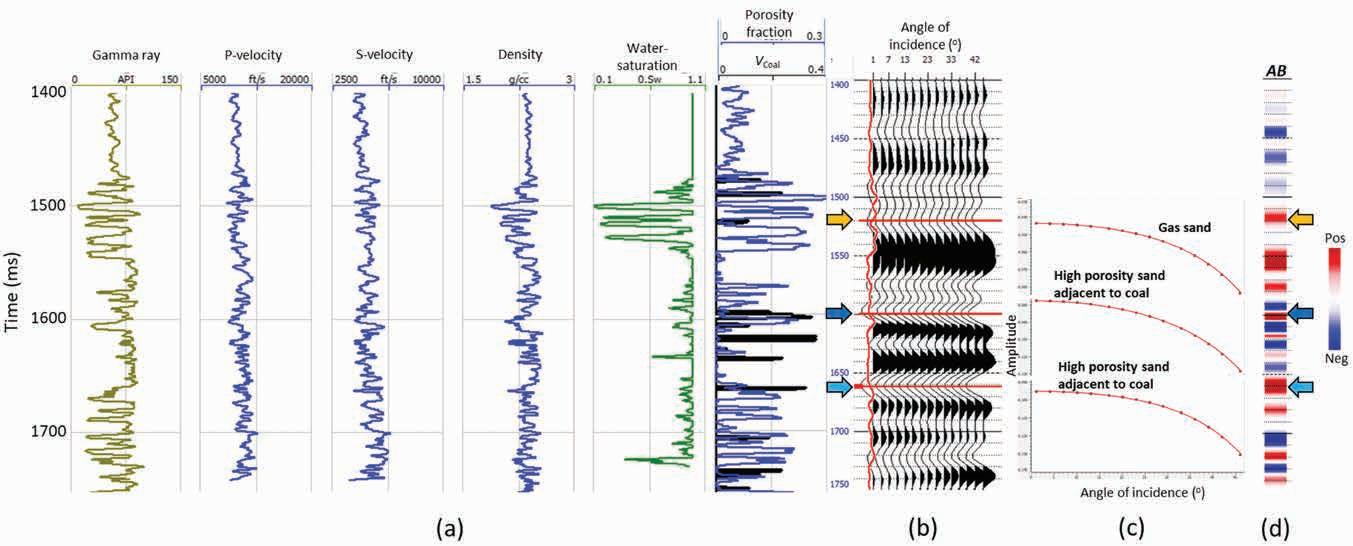
contrast with sandstones, often mimicking the signatures of gas-sands (Ma et al., 2008). Their presence can also obscure reflections underlying sand layers, creating false bright spots that complicate interpretation (Xi and Yin, 2022). Additionally, coal’s relatively strong S-wave response can resemble fluid-related anomalies, further increasing the risk of misinterpretation (Almoghrabi and Lange, 1986). Several studies have confirmed that such coal-related effects can lead to significant ambiguity in AVO and fluid detection analyses, especially when not adequately constrained by well control and petrophysical data (Fawad et al., 2020; Mao, 2022; Punglusamee, 2014).
These observations raise an important question: why do two geologically distinct scenarios, hydrocarbon-bearing sands and brine sands adjacent to coal, both manifest as strong Class III AB anomalies? The answer lies in their elastic properties. Differences in P- and S-wave velocities and Poisson’s ratio can produce similar angle-dependent AVO responses, even when the lithology and fluid content differ (Foster, 2010; Feng and Bancroft, 2006; Gray, 2023). Consequently, relying solely on conventional broadband AB analysis can lead to ambiguity in distinguishing true hydrocarbon anomalies from lithology- or coal-related effects. However, these scenarios exhibit contrasting distinct frequency-dependent behaviour: hydrocarbon-related attenuation produces a smooth decay of higher frequencies, whereas thin-bed tuning and coal layers introduce frequency-selective amplification or oscillations. By extending AB analysis into the frequency domain, these subtle differences can be exploited to resolve ambiguities and improve lithology–fluid discrimination, as demonstrated in prior studies using spectral decomposition of AVO attributes (Han, 2019).
Building on this concept, amplitude variation with frequency (AVF) has been increasingly explored as a diagnostic tool in seismic interpretation (Partyka et al., 1999; Castagna et al., 2003; Chopra and Castagna, 2014). By incorporating frequency sensitivity into traditional AVO analysis, AVF provides an additional dimension of discrimination, particularly valuable in coal-bearing settings where AB alone may yield ambiguous results.
Motivated by these insights, we extend the traditional AB analysis into the frequency domain. Rather than analysing the
full AVF spectrum where some of the spectral components may be noisy, we decompose the data in only a small number of frequency bands, aiming to maintain a high signal-to-noise ratio within each band while being able to capture differences across the frequency bands, tracking the AB product across these bands, and quantifying its behaviour using two new diagnostic measures, the Frequency Stability Index (FSI) and the slope of AB versus frequency. This methodology is evaluated on both synthetic and field data to demonstrate its utility in resolving AVO ambiguities, particularly in settings complicated by lithological tuning or coal-associated effects.
It may be worth mentioning that all displays of seismic data are in the reflectivity domain.
Rationale for frequency-domain AB analysis
The ambiguity observed at Well B highlights a key limitation, namely, that broadband AB products alone are insufficient to distinguish hydrocarbons from lithological or tuning-related artifacts. Since seismic reflectivity is inherently frequency-dependent (Chapman and Liu, 2004), analysing AVO behaviour across frequency bands provides an additional diagnostic dimension. Previous studies have investigated amplitude variation with frequency (AVF), where AVO attributes (such as intercept, gradient, fluid factor) are analysed as functions of frequency (Partyka et al., 1999; Castagna et al., 2003; Chopra and Castagna, 2014). These studies have consistently shown that fluid-related anomalies tend to produce smooth spectral decay, whereas thin-bed tuning and lithological effects generate a pattern of frequency-dependent variations that may be distinct from the smooth spectral decay.
Motivated by these findings, we propose a simpler, attribute-specific extension of AVF analysis: rather than computing full AVF spectra, we examine the intercept–gradient product (AB), already validated as a hydrocarbon indicator in our area, across multiple frequency bands. This targeted approach preserves the sensitivity of AB to Class III anomalies, while adding the ability to characterise frequency-dependent variations, thereby enhancing fluid discrimination.
The proposed methodology extends the conventional AB analysis into the frequency domain through the following sequence of steps.
1. Spectral decomposition of angle stacks. Near, mid, and far angle stacks are decomposed into low-, moderate-, and high-frequency bands using spectral decomposition methods such as the short-term Fourier transform, matching pursuit, or maximum entropy spectral analysis (MESA) (Chopra and Marfurt, 2007; 2024). This step enables explicit evaluation of frequency-dependent behaviours.
2. Computation of intercept (A) and gradient (B). For each frequency band, the linearised AVO equations (Shuey, 1985) are applied to estimate the intercept and gradient attributes, which form the basis of AB analysis.
3. Frequency-dependent AB product. The product of intercept and gradient is then calculated within each frequency band, producing AB volumes that capture how amplitude-offset behaviour varies with frequency.
4. Definition of new diagnostics
• To quantify and interpret the spectral behaviour of AB, we introduce two diagnostic measures: Frequency Stability Index (FSI), defined as:
linear relationship between AB and frequency, which indicates broadband amplitude decay typical of hydrocarbon-related attenuation, whereas a positive or oscillatory slope suggests frequency amplification linked to lithological artifacts.
This structured workflow provides a systematic way to evaluate AVO anomalies beyond conventional broadband analysis, enabling interpreters to discriminate between fluid-related and lithology- or tuning-related responses.
As noted earlier, the motivation for the proposed workflow stems from observations at Well B, where both the gas-bearing sand and a high-porosity brine sand interval adjacent to thin coal layers produced strong Class III AVO responses. Crossplots of intercept versus gradient and the broadband AB product, confirmed that both intervals plotted as negative intercepts coupled with large negative gradients, consistent with typical signatures of fluid anomalies. This overlap made it difficult to reliably distinguish hydrocarbons from lithology- or tuning-related effects using standard AVO attributes alone (Figure 2).
It measures the stability of AB across frequency bands.
Low-to-moderate FSI values reflect smooth amplitude decay, consistent with fluid-related behaviour, whereas high FSI values indicate irregular variations caused by lithology or tuning.
• Slope of AB versus frequency, obtained by fitting a linear regression of the form
where the slope m characterises the frequency trend. A negative slope with high correlation coefficient (R2) implies a strong
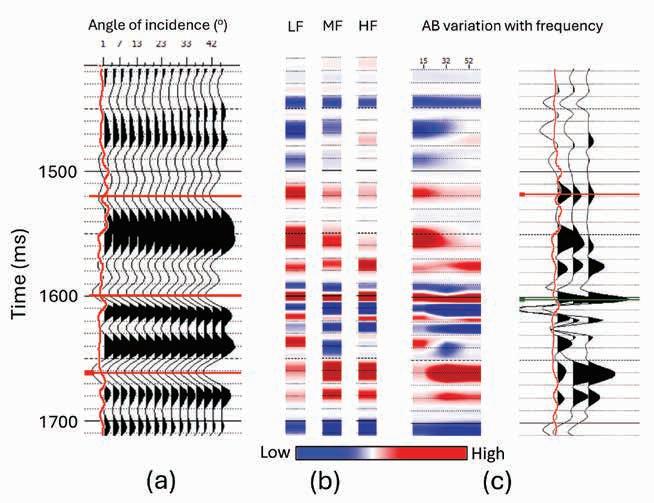
Representative angle gather
To address this ambiguity, the workflow described in the methodology section was applied. Following this workflow, the near-, mid-, and far-angle stacks were first generated from the angle gathers (Figure 3a). Spectral decomposition using the MESA method was then performed to generate low-, moderate-, and high-frequency components for each angle stack. Subsequently, iso-frequency gathers were constructed by combining the corresponding frequency bands from the near-, mid-, and far-angle stacks.
The intercept, gradient, and their product (AB) for each of the three frequency bands were estimated by fitting the two-term Shuey’s equation on the iso-frequency gathers. These results are displayed in Figure 3b, where noticeable variations are observed both vertically and across the low- to high-frequency panels. To better visualise the frequency-dependent behaviour, the individual AB volumes were combined into a composite display (Figure 3c).
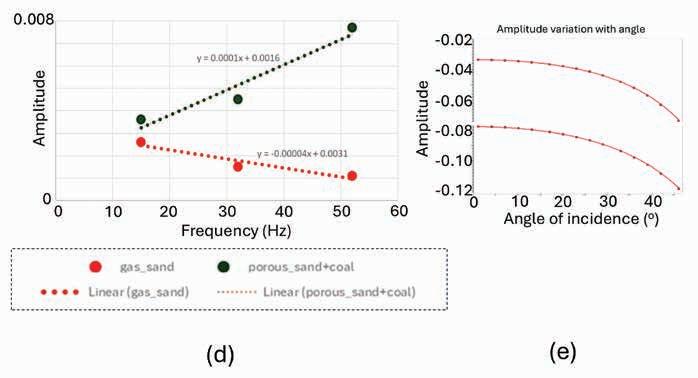
The AVO product AB for low, mid, and high frequency cases. These are derived from spectrally decomposed near-, mid-, and far-angle stacks that are sorted into low, mid and high iso-frequency gathers prior to AVO fitting. (c) AB variation with frequency seen on frequency gathers displays in variable density and wiggle/variable area displays. (d) Variation of AB amplitude with frequency extracted along two representative events, the blue event pertaining to gas sand interval shows a smooth decay with frequency, whereas the lower red event pertaining to brine-coal interval exhibits an increase of amplitude with frequency. (e) Amplitude variation with angle of incidence (adapted from Figure 2c) shown for both events (red and green) shows similar character, suggesting that it will be difficult to distinguish between them, whereas the frequency-dependent AB analysis clearly differentiates between the two scenarios.
Notably, the variation of AB with frequency differs between the gas-sand interval and the brine-saturated sand interval adjacent to coal. For a more quantitative assessment, the variation of AB with frequency was analysed along two representative events, as illustrated in Figure 3d.
The results reveal a clear divergence in frequency-dependent behaviour between the two intervals. In the gas-sand interval, the AB amplitude decreases smoothly with increasing frequency, consistent with fluid-related attenuation. In contrast, the brinesand interval adjacent to coal exhibits frequency amplification, indicative of tuning and coal-related effects. Notably, when analysed solely in the angle domain, both intervals appear nearly identical as Class III anomalies (Figure 3e). Thus, frequency-domain analysis effectively resolves the ambiguity inherent in broadband AVO, providing a more reliable basis for interpretation.
These differences are further quantified using the proposed diagnostic attributes. The gas-sand interval shows a smooth decay pattern, corresponding to a low-to-moderate Frequency Stability Index (FSI) and a gently negative slope of AB versus frequency. In contrast, the brine-coal interval exhibits irregular frequency amplification, resulting in a high FSI and a strongly positive slope (Figure 4a). On the crossplot of FSI versus slope (Figure 4b), the hydrocarbon-bearing sands, brine sands, and coal clusters occupy distinct regions, which could show overlapping when plotted as single attributes. Therefore, the strong discriminative power of these attributes is highly convincing. Back-projection onto the seismic section (Figure 4c) confirms their spatial correlation, demonstrating that Class III anomalies identified in broadband analysis can now be reliably distinguished according to their true fluid or lithologic origins.
This outcome highlights the effectiveness of the proposed frequency-domain AB workflow, providing a more robust interpretational framework and enhanced confidence in differentiating hydrocarbons from lithology- and tuning-related responses.
Encouraged by the synthetic results, the workflow was next applied to real seismic data along an inline intersecting Well B. However, it is important to first account for variations in the frequency spectra of the near-, mid-, and far-angle stacks before applying the workflow to real seismic data. Differences in spectral content can arise from acquisition, processing, or noise and
may obscure whether observed frequency-dependent attribute variations are due to true fluid effects or artifacts (Castagna et al., 1993; Partyka et al., 1999; Yilmaz, 2001).
The spectral balancing procedure of choice was the method first discussed by Marfurt and Matos (2014), also demonstrated by Chopra and Marfurt (2016).
In this method, data are first decomposed into time-frequency spectral components. Then the power of the spectral magnitude, P (t,f) = m(t,f)2, is averaged over all the traces (j = 1, …K) in the data volume spatially and in the given time window, which yields a smoothed average power spectrum, P avg (t,f). Next, we compute the peak of the average power spectrum at each time sample, Ppeak (t) = MAX [Pavg(t,f)]. Both the average spectral magnitude and the peak of the average power spectrum are used to design a single time-varying spectral-balancing operator that is applied to each and every trace in the data:
where ε is the prewhitening parameter. A conservative value would be ε = 0.04. For larger surveys in which the estimate of the average spectra is statistically more robust, one might use values of ε = 0.01 in many cases, further broadening the spectrum. However, as with any filter, the interpreter needs to determine whether such aggressive spectral balancing introduces ringing in the data. Such spectral balancing is amplitude friendly because a single time-varying wavelet is applied to the entire data volume.
To illustrate this, Figure 5 compares the amplitude spectra of the original input angle stacks with the spectra after AVO-consistent balancing. The unbalanced spectra (Figure 5a) show notable differences across angles, whereas the balanced spectra (Figure 5b) are closely aligned, ensuring that subsequent frequency-dependent analyses reflect subsurface properties rather than processing artifacts. This preprocessing step enables confident application of the proposed workflow to real seismic data, minimising the risk of misinterpreting spectral inconsistencies as fluid-related variations (Castagna et al., 1993).
Based on the amplitude spectra of the seismic data, spectral decomposition was performed over three frequency bands: low (5–20 Hz), moderate (20–40 Hz), and high (40–60 Hz). The Shuey’s equation was then applied to compute the intercept, gradient, and their product (AB) for each band, followed by
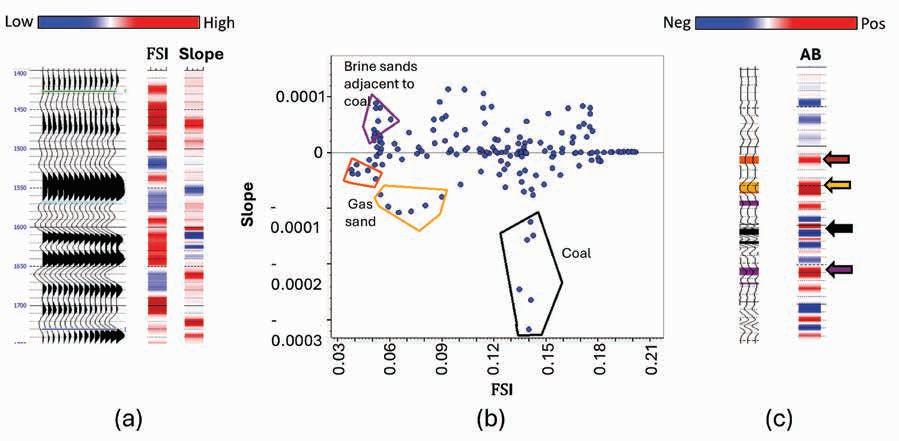
Figure 4 (a) Computed Frequency Stability Index (FSI) and slope of AB for Well B. (b) Crossplot of FSI versus slope, with polygons highlighting data points corresponding to hydrocarbon-bearing sands (red and yellow block arrows), brine sands adjacent to coal (purple block arrow), and coal intervals (black block arrow). (c) Back-projection of these classifications onto the synthetic seismic section, showing that Class III AVO anomalies identified in broadband seismic data are now distinguishable according to their true lithologic and fluid properties.
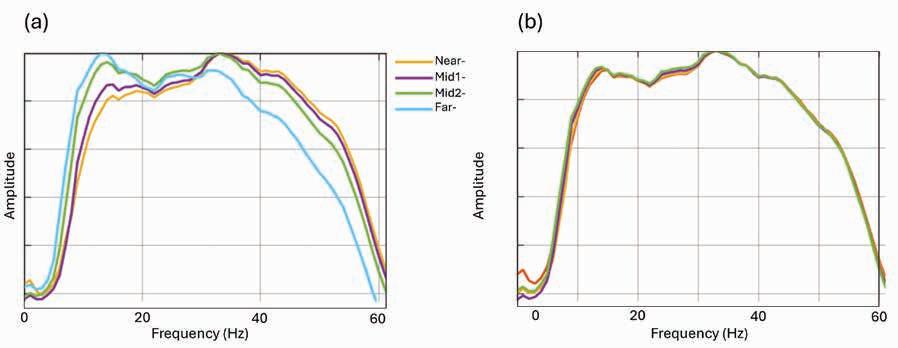
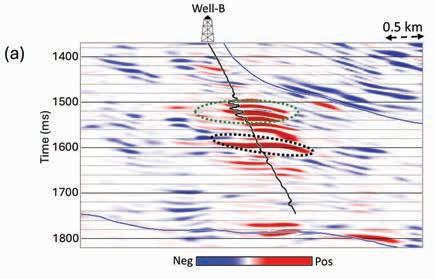
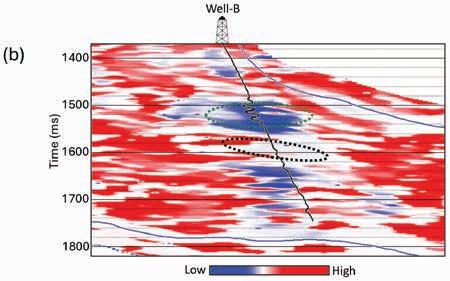
Figure 5 Comparison of frequency spectra for near-, mid1-, mid2- and far-angle stacks, (a) before, and (b) after spectral balancing. Notice that after spectral balancing the frequency spectra are aligned, ensuring reliable computation of frequency-dependent attributes.
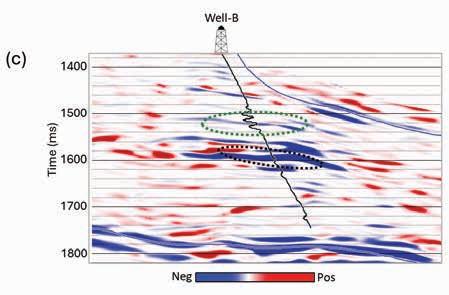
Figure 6 Equivalent inline sections passing through well-B extracted from (a) the AB product attribute, (b) frequency stability index (FSI) attribute, and (c) slope attribute volumes. The AB section in (a) shows two Class III type anomalies seen enclosed by different ellipses. The upper interval corresponds to hydrocarbon-bearing sand, while the lower interval represents a brine-sand adjacent to thin coal layers. The FSI section in (b) and the slope section (c) clearly distinguish these intervals, the gas-bearing sand exhibiting low FSI values and slight negative slope, and the brine sand-coal interval showing higher FSI and negative slope with large magnitude, indicative of lithology/tuning/coal effects as in Figure 4b for the coal samples.
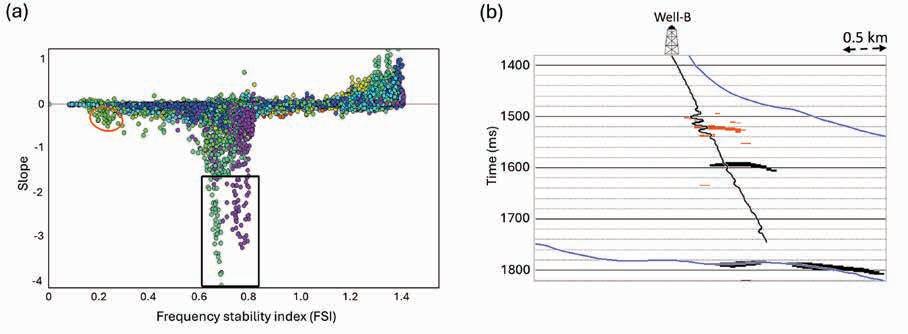
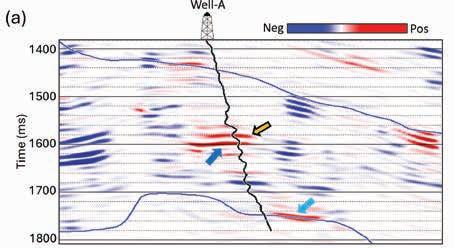
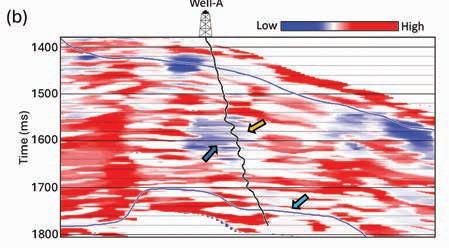
Figure 7 (a) Crossplot of computed FSI versus slope, with polygons highlighting data points corresponding to hydrocarbon-bearing sands (orange ellipse) and brine sands adjacent to coal (black rectangle). (b) Back-projection of these classifications onto the seismic section, showing that Class III AVO anomalies identified in broadband seismic data are now distinguishable according to their true lithologic and fluid properties.
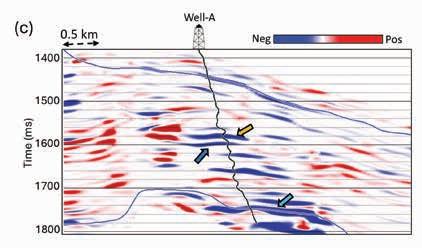
Figure 8 Equivalent nearby inline sections offsetting well-A extracted from (a) the AB product attribute, (b) frequency stability index (FSI) attribute, and (c) slope attribute volumes. Three distinct Class III–type anomalies are visible on the AB section, indicated by the pale-yellow, blue, and cyan block arrows. The anomaly marked by the blue and pale-yellow arrows exhibit low FSI and a low negative slope, consistent with a hydrocarbon-bearing interval, while the lower anomaly at the basement level indicated by the cyan arrow shows high FSI and a large negative slope, characteristic of tuning or lithologic effects (e.g., coal) rather than true hydrocarbon presence.
estimation of the Frequency Stability Index (FSI) and slope of AB as a function of frequency. The estimated FSI and slope of AB were then analysed to evaluate the frequency-dependent behaviour of the different intervals.
Figure 6 illustrates the application of the frequency-domain AB workflow to a seismic inline intersecting Well B. The conventional AB product section highlights two prominent Class III type anomalies enclosed within different ellipses. While these anomalies appear similar in broadband analysis, the computed FSI and slope
attributes provide additional discriminatory power. The upper anomaly corresponds to the hydrocarbon-bearing sand, characterised by low FSI values and a gentle negative slope, consistent with fluid-related attenuation. In contrast, the lower interval represents a brine-sand adjacent to thin coal layers and exhibits higher FSI and a negative slope with large magnitude, indicative of lithology- and tuning-related effects rather than hydrocarbons.
This example demonstrates that combining AB with frequency-dependent FSI and slope analysis allows interpreters
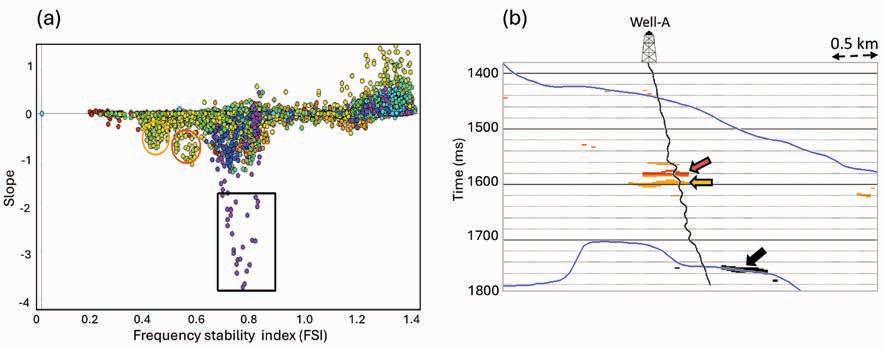
to distinguish fluid-driven anomalies from lithology or tuning artifacts that might otherwise be misclassified in conventional broadband AVO interpretation.
To further validate these observations, a crossplot of FSI versus slope was generated as shown in Figure 7a. Data points exhibiting hydrocarbon-bearing characteristics (low FSI, negative slope) and coal-influenced responses (higher FSI, large negative slope) were enclosed within distinct polygons. To identify their spatial distributions, these clusters were back-projected onto the seismic section (Figure 7b). The hydrocarbon-related points align with the upper reservoir interval, whereas the tuning-related points correspond to the deeper porous sands adjacent to coal.
Encouraged by the results near Well B, the workflow was further tested on another inline offsetting Well A. The choice of this nearby line was made as it offers the clearest expression of the subtle FSI slope differences associated with fluid saturation variations along the deviated well path, as discussed next. Figure 8 illustrates the results of applying the proposed workflow to seismic data near Well A. The conventional AB product (Figure 8a) highlights three strong Class III anomalies (highlighted with arrows), which, in isolation, are difficult to discriminate. However, when complemented with the frequency-dependent attributes FSI (Figure 8b) and slope (Figure 8c), the anomalies exhibit markedly different behaviours.
The lower anomaly at the basement level indicated by the cyan arrow (with high FSI and a large negative slope), seems different from the upper two anomalies. However, there is no obvious difference between the upper and middle anomalies, as both exhibit low FSI and a low negative slope, consistent with a hydrocarbon-bearing interval. To further investigate these differences, a crossplot of FSI versus slope (Figure 9a) was generated around Well A. The middle anomaly shows low FSI and a gentle negative slope, but in contrast the upper anomaly exhibits moderate FSI and a slightly higher negative slope. This response may reflect enhanced hydrocarbon saturation as stronger attenuation of high frequencies is expected to enhance the slope. Also, this observation aligns with the water-saturation (Sw) variations observed in the well logs, lower S w for the upper anomaly and slightly higher S w for the deeper one, suggesting that subtle differences in slope and FSI may be indicative of saturation variations encountered along the deviated well trajectory. Although we do not perform a full validation here, future synthetic modelling or fluid-replacement simulations could further assess the sensitivity of FSI and slope to fluid saturation variations.
These results demonstrate that, although the full-band AB section highlights different anomalies similarly, the proposed frequency-domain workflow effectively separates the hydro-
Figure 9 (a) Crossplot of FSI versus slope around Well A showing three distinct clusters: two corresponding to hydrocarbon-bearing zones (yellow and orange block arrows) and one associated with coalinfluenced intervals (black block arrow). (b) Backprojection of these clusters onto the seismic section confirms their spatial extent, allowing the three Class III type anomalies which are indistinguishable on the broadband AB section, to be reliably separated into hydrocarbon-related and litholoy/tuning-related responses.
carbon-bearing zone from lithology/tuning artifacts, thereby reducing interpretation ambiguity.
Extending AB analysis into the frequency domain demonstrates a practical pathway to resolve ambiguities in Class III AVO interpretation. By introducing the frequency stability index (FSI) and slope attributes, hydrocarbon-bearing sands can be separated from lithology or tuning effects (high FSI, positive or negative slope). This extension preserves the simplicity of AB analysis while adding diagnostic robustness, providing a deployable tool for reducing uncertainty in exploration and reservoir characterisation. Results from Wells A and B demonstrate the internal consistency of the workflow and its ability to resolve ambiguities that remain unresolved using traditional approaches. The primary objective of this study is to introduce the concept and demonstrate its feasibility on a real dataset; due to data permission constraints, only one dataset is presented. Nevertheless, because the workflow is grounded in well-established AVO and attenuation physics, it is expected to be applicable to other datasets of reasonable seismic quality. A systematic evaluation across multiple basins, geological settings, and data qualities is left for future studies to assess broader robustness and generalisation.
The authors thank the management of Canacol Energy Ltd. for granting permission to use the data presented in the illustrations included in this article. They also gratefully acknowledge the two anonymous reviewers for their thorough and insightful reviews of the manuscript, as well as the meticulous review conducted by Clement Kostov.
Almoghrabi, H. and Lange, J. [1986]. Layers and bright spots. Geophysics, 51(3), 699-710. https://doi.org/10.1190/1.1442123.Castagna, J.P. and Swan, H.W. [1997]. Principles of AVO crossplotting. The Leading Edge, 16(4), 337-342. https://doi.org/10.1190/1.1437626.Castagna, J.P., Batzle, M. and Kan, T.K. [1993]. Rock physics—the link between rock properties and AVO response. In Castagna, J.P. and Backus, M. Eds., Offset-Dependent Reflectivity-Theory and Practice of AVO Analysis, Society of Exploration Geophysicists, Houston, 135-171. https://doi. org/10.1190/1.9781560802624.Castagna, J.P., Sun, S. and Siegfried, R.W. [2003]. Instantaneous spectral analysis: Detection of low-frequency shadows associated with hydrocarbons. The Leading Edge, 22(2), 120-127. https://doi.org/10.1190/1.1559038.
Chapman, M. and Liu, E. [2004]., Frequency-dependent azimuthal amplitude variations in reflections from a fractured layer. SEG Technical Program Expanded Abstracts, 147-150. https://doi. org/10.1190/1.1851125.
Chopra, S. and Marfurt, K.J. [2007]. Seismic attributes for prospect identification and reservoir characterization. SEG, Geophysical Developments Series, 11. https://doi.org/10.1190/1.9781560801900.
Chopra, S. and Castagna, J.P. [2014]. AVO. SEG Investigations in Geophysics Series, 16. https://doi.org/10.1190/1.9781560803201.
Chopra, S. and Marfurt. K.J. [2016]. Spectral decomposition and spectral balancing of seismic data. The Leading Edge, 35(2), 176179. https://doi.org/10.1190/tle35020176.1.
Chopra, S. and Marfurt. K.J. [2024] Essentials of seismic attributes and impedance inversion. SEG Geophysical Development, 20. https://doi. org/10.1190/1.9781560804062.
Fatti, J.L., Vail, P.J., Smith, G.C., Strauss, P.J. and Levitt, P.R. [1994]. Detection of gas in sandstone reservoirs using AVO analysis: A 3-D seismic case history using the geostack technique. Geophysics, 59(9), 1362-1376. https://doi.org/10.1190/1.1443695.
Fawad, M., Hansen, J.A. and Mondol, N.H. [2020]. Seismic-fluid detection: A review. J. of Appl. Geophys., 210, 103347, 1-18., https://doi. org/10.1016/j.earscirev.2020.103347.
Feng, H. and Bancroft, J.C. [2006]. Influence of P- and S-wave velocities and density on AVO responses. CREWES Research Report, https:// www.crewes.org/Documents/ResearchReports/2006/2006-34.pdf.
Foster, D.J. [2010]. Elastic property contrasts and their impact on angle-dependent AVO responses. CREWES Research Report, https:// csim.kaust.edu.sa/files/erse210/fosterkeys.pdf.
Gray, D. [2023]. AVO attributes and petrophysical properties: Understanding elastic contrasts in seismic interpretation. CSEG Recorder, https://cseg.ca/wp-content/uploads/FocusArticle-AVOPetrophysicsTutorial.pdf.
Han, C. [2019]. Spectral decomposition AVO attributes for identifying potential hydrocarbon-related frequency anomalies. First Break, 37(5), 89-97. https://doi.org/10.3997/1365-2397.n0027.
Ma, J., Morozov, I. and Cheng, J. [2008]. AVO attributes of a deep coal seam. Geoconvention, https://geoconvention.com/wp-content/ uploads/abstracts/2008/194.pdf.
Mao, Y. [2022]. Application of far-gather seismic attributes in suppressing coal bright spot effect in seismic interpretation. Energies, 15(6), 2206, https://www.mdpi.com/1996-1073/15/6/2206.
Marfurt, K. and M. Matos. [2014]. Am I blue? Finding the right (spectral) balance. AAPG Explorer, https://www.aapg.org/news-and-media/details/explorer/articleid/9522/ am-i-blue-finding-the-right-spectral-balance, accessed January 20, 2026.Partyka, G.A., Gridley, J. and Lopez, J. [1999]. Interpretational applications of spectral decomposition in reservoir characterization. The Leading Edge, 18(3), 353-360. https://doi. org/10.1190/1.1438295.Punglusamee, K. [2014], AVO feasibility study for hydrocarbon detection in coal-bearing reservoirs. BEST Journal, 7, 94-105.
https://ph01.tci-thaijo.org/index.php/bestjournal/article/download/246659/167665/872585.
Rutherford, S.R. and Williams, R.H. [1989]. Amplitude-versus-offset variations in gas sands. Geophysics, 54(6), 680-688. https://doi. org/10.1190/1.1442696.
Shuey, R.T. [1985]. A simplification of the Zoeppritz equations. Geophysics, 50(4), 609-614. https://doi.org/10.1190/1.1441936.
Xi, Y. and Yin, X. [2022], Seismic response models and the AVO simulation of coal-bearing reservoirs. Minerals, 12, 836, 1-22. https://www. mdpi.com/2075-163X/12/7/836.
Yilmaz, O. [2001]. Seismic Data Analysis: Processing, Inversion, and Interpretation of Seismic Data. SEG Investigations in Geophysics Series, 10. https://doi.org/10.1190/1.9781560801580.


To serve the interests of our members and the wider multidisciplinary geoscience and engineering community, EAGE publishes a range of books and scientific journals in-house. Our extensive, professional marketing network is used to ensure publications get the attention they deserve.
EAGE is continually seeking submissions for both book publishing and articles for our journals.
A dedicated and qualified publishing team is available to support your publication at EAGE.

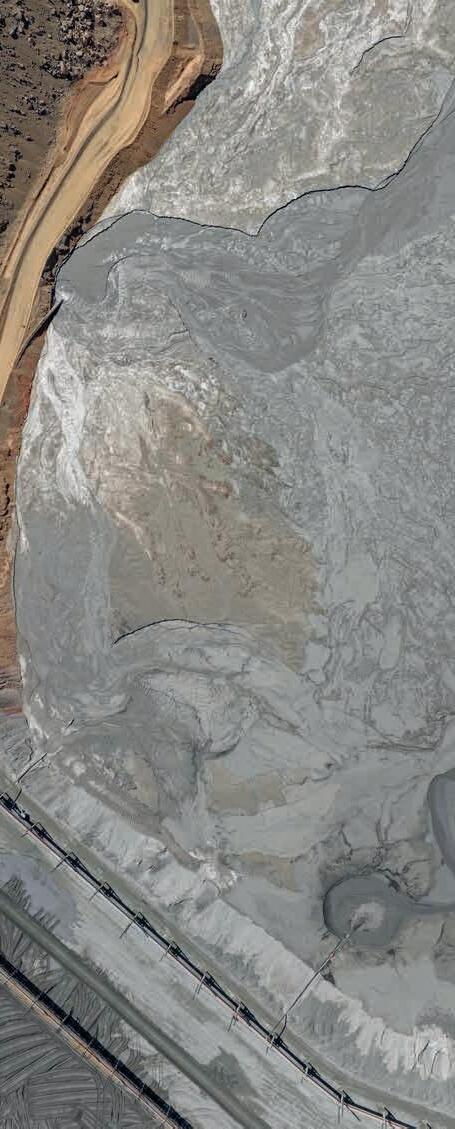
Innovation in reservoir characterisation is crucial as energy companies optimise existing fields and explore new fields that will still be required in the years to come. Meanwhile, characterisation of reservoirs to assess their suitability for carbon capture, storage and utilisation is gathering apace as governments continue to hand out licences.
This month we put the spotlight on technlogies including Vertical Electrical Sounding (VES) curves, automated ensemble-based resevoir modelling as well as techniques to improve 4D surveys.
Priyanka Dutta et al demonstrate how accurate node-depth constraints provide an independent subsidence monitoring capability with broad spatial coverage, while also strengthening 4D seismic results by improving statics and decoupling depth-related effects from water-velocity variability, node timing errors and other acquisition-related sources of non-repeatability.
Stefan Carpentier et al present a working method for the inversion of Vertical Electrical Sounding (VES) curves to estimate the depths of the fresh-brackish and brackish-saline groundwater interfaces (FBSI), enabling the detection of changes in FBSI at depths up to 300 m from repeated VES measurements in a monitoring setting.
Camille Cosson et al present a pragmatic workflow that integrates automated ensemble-based reservoir modelling with frequent, targeted focused seismic acquisitions for risk mitigation.
Leo Eisner et al demonstrate how microseismic monitoring goals can be met by adaptive network designs derived from and informed by geological parameters of the reservoir.
Ruud Weijermars et al report on a fast, analytical Gaussian simulator that enables direct well rate forecasting and inverse estimation of fracture half-length and reservoir properties without relying on finite-difference methods.
First Break Special Topics are covered by a mix of original articles dealing with case studies and the latest technology. Contributions to a Special Topic in First Break can be sent directly to the editorial office (firstbreak@eage.org). Submissions will be considered for publication by the editor.
It is also possible to submit a Technical Article to First Break. Technical Articles are subject to a peer review process and should be submitted via EAGE’s ScholarOne website: http://mc.manuscriptcentral.com/fb
You can find on www.firstbreak.org/guidelines the First Break author guidelines.
January Land Seismic
February Digitalization / Machine Learning
March Reservoir Monitoring
April Underground Storage and Passive Seismic
May Global Exploration
Further Special Topics may be added over the course of the year.
Priyanka Dutta1*, Denis Kiyashchenko1, Kanglin Wang1, Audun Libak 2, Ivar Mathias Grøvik 2 and Hugo Ruiz 2 report how accurate time-lapse node-depth constraints provide an independent subsidence monitoring capability with broad spatial coverage, while also strengthening 4D seismic results by improving statics and decoupling depth-related effects from water-velocity variability, node timing errors and other acquisition-related sources of non-repeatability.
Abstract
Time-lapse seismic remains the most widely applied tool for offshore reservoir monitoring. Its value, however, depends critically on acquisition repeatability and the robustness of processing workflows. In deep-water ocean-bottom node (OBN) surveys, uncertainty in receiver depth has long been a limiting factor, affecting statics, reducing 4D repeatability, and complicating the interpretation of depth-shift and compaction signals. At the same time, independent measurements of seabed subsidence are of increasing interest for calibrating geomechanical models and managing infrastructure integrity but are typically sparse or operationally demanding.
We describe how principles originally developed for gravity-based subsidence surveys have been integrated into OBN operations to address both challenges. Initial work demonstrated that stabilised pressure-sensor systems embedded into node deployment workflows can deliver relative node depths with centimetre-level accuracy (Hatchell et al., 2019). Building on this foundation, the method was later applied across successive OBN campaigns in the same producing fields, enabling direct measurement of seabed subsidence with an uncertainty of approximately 3 cm over several years (Dutta et al., 2023).
We report how accurate time-lapse node-depth constraints provide an independent subsidence monitoring capability with broad spatial coverage, while also strengthening 4D seismic
results by improving statics and decoupling depth-related effects from water-velocity variability, node timing errors and other acquisition-related sources of non-repeatability. This demonstrates how modest operational additions to seismic surveys can enhance reservoir monitoring outcomes.
Offshore reservoir monitoring increasingly relies on integrating multiple data types to constrain dynamic behaviour, geomechanical response, and associated risks to wells and seabed infrastructure. Among these, time-lapse seismic remains the most widespread tool for tracking changes in saturation, pressure, and elastic properties at the reservoir scale. When acquisition and processing repeatability are high, 4D seismic can provide dense spatial coverage and direct sensitivity to reservoir changes.
At the same time, production-induced compaction and associated seabed subsidence are recognised as key elements of the reservoir response (Eiken et al, 2022). Subsidence measurements provide an independent constraint on reservoir compressibility and overburden behaviour and are particularly valuable for calibrating coupled reservoir–geomechanical models. Offshore, however, subsidence monitoring has typically relied on sparse measurements, such as platform-based systems or permanent pressure monitoring tools, or on specialised gravity-subsidence
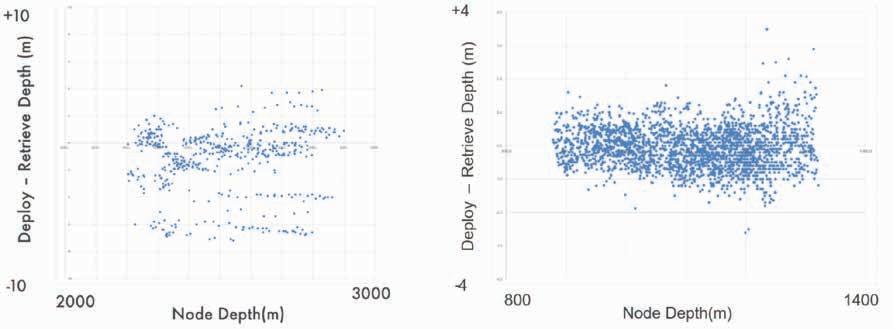
1 Shell International Exploration and Production Inc. | 2 Reach Subsea * Corresponding author, E-mail: Priyanka.Dutta@shell.com DOI: 10.3997/1365-2397.fb2026017
Figure 1 Difference between depths reported at deployment and recovery of nodes during two OBN campaigns at two different fields, one with water depth ranging between 2000 and 3000 m (left) and one with water depths between 800 and 1400 m (right).
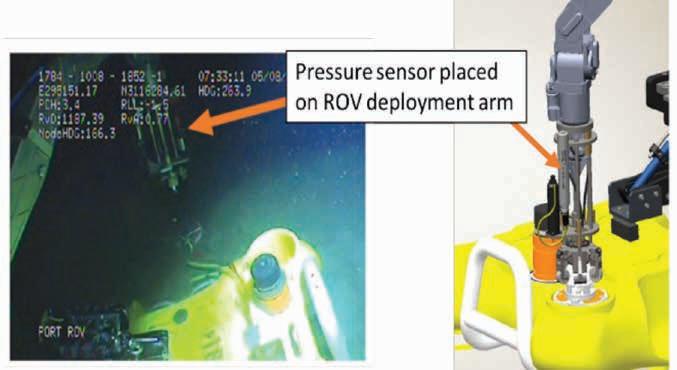
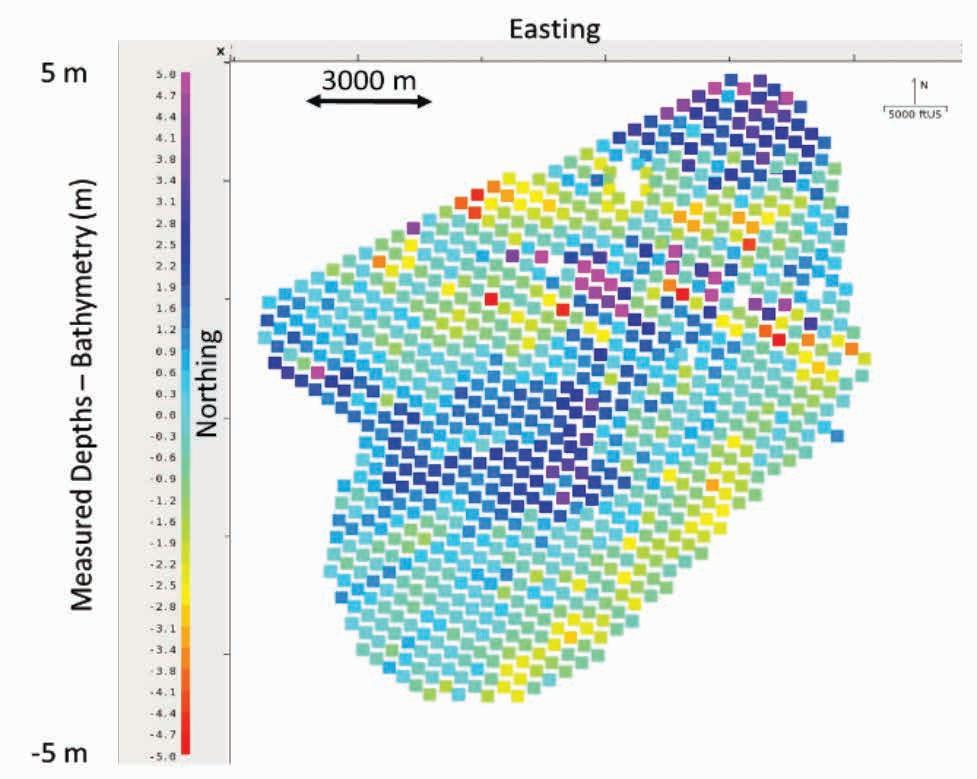
surveys that require dedicated pre-deployed elements and operations (Hatchell et al., 2017).
Deep-water OBN seismic surveys sit at the intersection of these two monitoring needs. They are acquired primarily for seismic imaging and 4D interpretation, but they also involve repeated placement of sensors on the seabed over time. Historically, uncertainty in node depth has been treated as a processing nuisance rather than a monitoring opportunity. Reported node depths at deployment and recovery often differ by metres, and similar discrepancies are common between baseline and monitor surveys. Figure 1 shows the difference between reported node depths at deployment and recovery for two deepwater OBN campaigns in the 2010s, indicating errors in relative depths of the order of several metres.
These uncertainties propagate into statics solutions, reduce seismic repeatability, and complicate the interpretation of depth shifts related to compaction and subsidence.
The work summarised here reframes this problem. Improving the accuracy of node relative-depth measurements not only strengthens 4D seismic results but also unlocks a new, independent subsidence monitoring capability embedded within routine OBN surveys.
High-precision subsidence monitoring has been carried out for more than two decades using gravity-based survey methods, particularly on the Norwegian Continental Shelf (Vatshelle et al., 2017, Ruiz et al., 2022, Vassvåg et al., 2025, Agersborg et al., 2017). These surveys demonstrated that seabed elevation changes can be measured with millimetre-level accuracy over multi-year intervals when pressure sensors are operated under stable thermal and mechanical conditions, and when calibration errors, tides, and sensor drift are handled through reference measurements and careful survey design.
A key insight from this experience is that depth-change accuracy is not limited by the absolute accuracy of the pressure sensors. Instead, it is governed by repeatability, linearity, and the ability to characterise and remove systematic effects.
Hatchell et al. (2019) explored whether the principles of gravity–subsidence surveying could be transferred into a deep-water OBN context. In that work, a dedicated, thermally
and mechanically stabilised set of pressure sensors (DepthWatch) was integrated into ROV systems used for node deployment. Sensors were mounted both in the body of the ROV and on the manipulator arm responsible for placing the node on the seabed, allowing the node depth to be measured directly at the moment of deployment (Figure 2).
Extensive conductivity, temperature, and depth (CTD) scans were collected to constrain water density, and gravity was modelled, accounting for depth, latitude, and free-air anomaly. Reference measurements were repeatedly acquired on a set of fixed seabed frames, serving three purposes: characterising sensor drift, cross-calibrating the systems on different ROVs, and providing an independent estimate of measurement repeatability.
The random uncertainty associated with the full measurement procedure, including drift and tide corrections, was estimated by analysing the repeatability of measurements at the frames to be 1.2 cm. The evaluation of the additional systematic contributions to the uncertainty (sensor calibration, water density, and gravity evaluation) yielded an estimated total uncertainty of 4 cm for relative node depths. While the immediate motivation was improved statics and imaging, the work explicitly anticipated that repeating these measurements in future surveys could enable accurate subsidence monitoring.
The relative node-depth map obtained with the new method revealed discrepancies of up to several metres compared to existing bathymetry data derived from previous work merging AUV multibeam echosounder and seismic surveys (Figure 3).
Figure 4 shows the difference between the originally reported node depths and the results of the new method for a selected time interval in which the originally reported depths were especially stable. Note the metre-level noise and systematic shifts between measurements from the two ROVs for the originally reported depths.
The later work reported by Dutta et al. (2023) describes the impact of accurate node-depth measurements systematically integrated into successive OBN surveys over the same deep-water producing fields, acquired several years apart.
The same DepthWatch dedicated sensor packages were incorporated into the ROV body and the manipulator arm, and the data were monitored in real time during operations. Node depth measurements were performed when the ROV arm was in contact with the node at its final deployment position, either during deployment or recovery. Minor adjustments to node-handling procedures were introduced to ensure repeatable contact and measurement conditions, without materially affecting seismic operations.
Reference measurement locations were again central to the workflow. These consisted of selected nodes or existing seabed infrastructure that could be revisited multiple times during the campaign. Measurements at reference locations were acquired during idle time or with small adjustments to the ROV trajectory, keeping additional operational effort low.
The result of each survey was a map of relative node depths with respect to a chosen reference node, as shown in Figure 5.
To measure seabed subsidence, relative node depths from successive OBN surveys were compared at nominally identical target locations. In practice, operational constraints mean that nodes are not deployed at the same lateral position between surveys. Lateral offsets of a few metres are common, and on a sloping seabed, these offsets translate into apparent depth differences that are unrelated to true subsidence.
Dutta et al. (2023) addressed this by explicitly correcting for limited repeatability in node position using acoustic bathymetry.
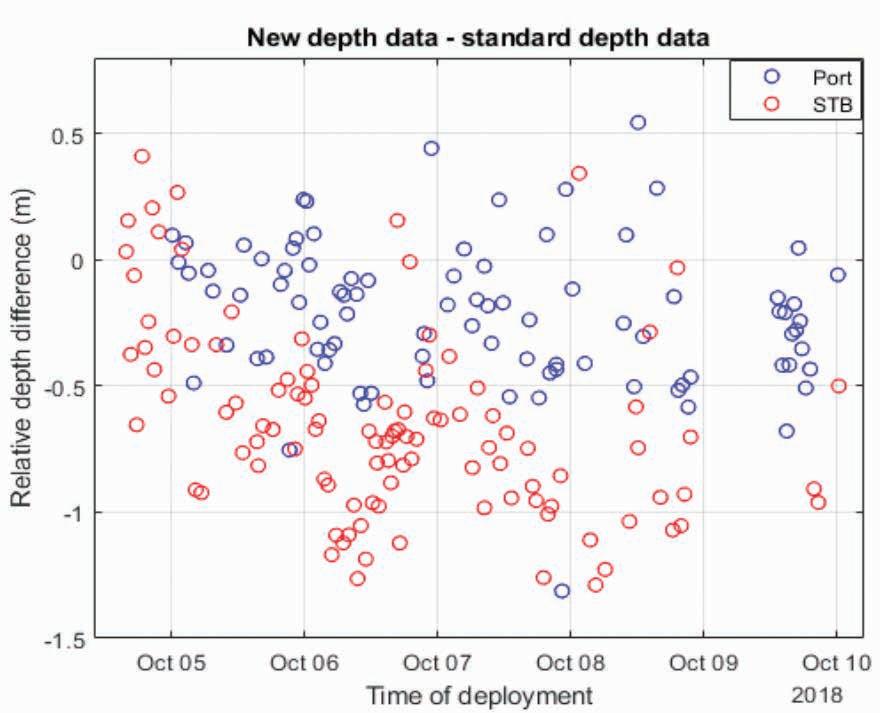
4 Difference between originally reported node depths and the results obtained with the new method. Different colours correspond to the ROVs involved in the operation (port, starboard). From
While bathymetric maps often suffer from inconsistencies in absolute depth over large distances, they generally describe relative depth variations reliably over short spatial scales. The bathymetry was therefore used to estimate and remove the time-lapse depth difference component associated with lateral deployment differences.
The impact of this correction is illustrated in Figure 6. Before correction, the subsidence estimates are noisy and show spatial inconsistencies, particularly in areas of steeper seabed slope. After correction, the subsidence patterns become smoother and more continuous, revealing coherent subsidence bowls consistent with production history.
Note that because subsidence is estimated from relative, rather than absolute, node depth measurements, the results are subject to a constant offset ambiguity. This does not affect the spatial subsidence pattern but prevents direct determination of absolute subsidence levels. An absolute reference can be introduced by assuming negligible subsidence in areas sufficiently distant from the producing reservoir, allowing the offset to be resolved.
The workflows described above have subsequently been applied in additional deep-water OBN surveys at fields operated by Shell, including both new and repeat acquisitions. In those applications, subsidence estimates obtained from repeat nodedepth measurements exhibit spatial patterns that are geologically reasonable and show good agreement with other sources of information on subsidence.
A thorough uncertainty analysis was carried out to quantify the accuracy of the subsidence estimates. Sources of uncertainty
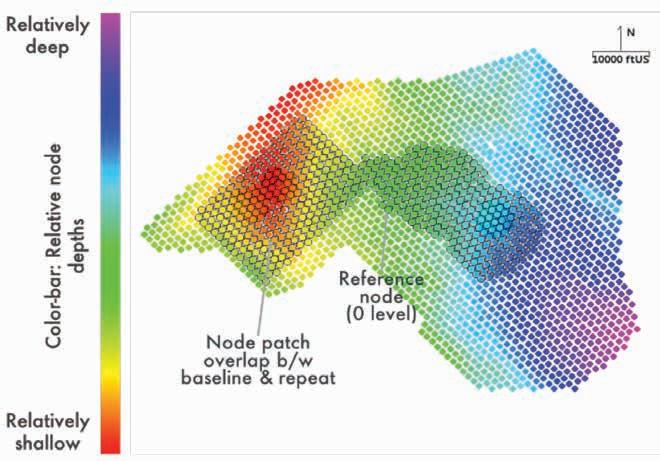
Figure 5 Relative node depths with respect to a reference node, from Dutta et al., 2023, with permission from SEG. Circles with a black envelope represent locations where nodes were deployed at both repeat and baseline surveys. The rest of the locations were occupied by nodes only on the repeat survey.
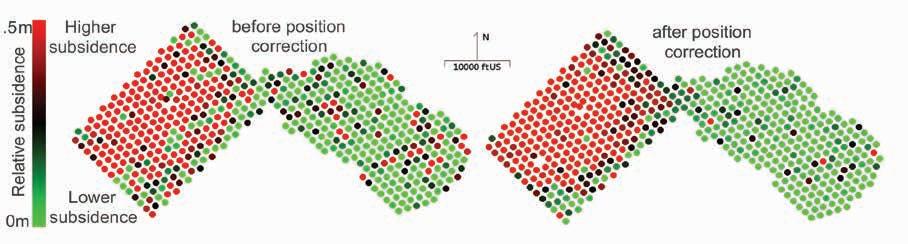
Figure 6 Measured relative subsidence before (left) and after (right) correction for node position differences between baseline and repeat surveys, from Dutta et al., 2023, with permission from SEG.
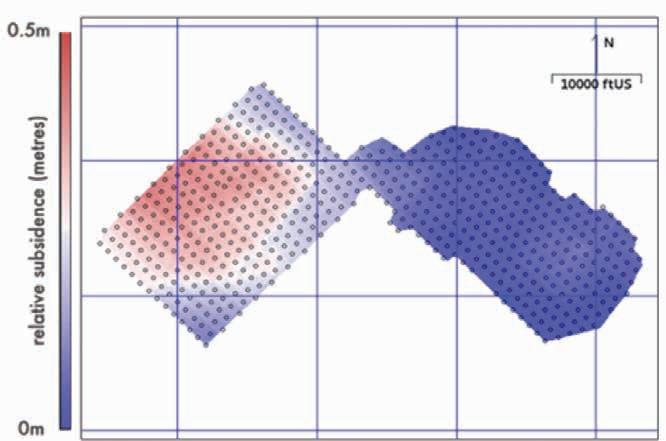
included pressure-to-depth conversion parameters such as water density, gravity, and sensor calibration; operational ability to relate the measured pressure to the node depth; and uncertainty in lateral node positioning and associated bathymetric correction.
At the individual node level, the uncertainty in relative subsidence was estimated to be in the order of 6-7 cm. Importantly, only a fraction of this uncertainty is spatially correlated, with the remainder being largely uncorrelated between nodes.
Notably, aside from a few outliers, the deviations from smooth subsidence bowls for individual measurements in Figure 6 (right) are consistent with the quoted 6-7 cm uncertainty. This is a direct confirmation of the uncertainty evaluation for intra-survey relative depth uncertainties of ca. 4 cm.
When subsidence is evaluated over extended areas, the effective uncertainty is reduced by approximately the square root of the number of nodes included in the area, to the level of 3 cm for 5 nodes. Figure 7 presents the subsidence results, once smoothed to benefit from the reduced statistical uncertainty. Note the 0.5 m difference in subsidence between the adjacent producing fields over a few years.
Accurate node depths have a direct and practical impact on seismic processing, particularly on OBN statics. Node depth enters the statics solution through node-dependent bulk timing corrections (Kiyashchenko et al, 2020). When node depths are inaccurate, bathymetric errors and water-velocity effects are absorbed into these corrections, reducing repeatability and introducing artefacts into time-lapse results. Figure 8 illustrates this effect.
The difference between legacy AUV seafloor depth and the DepthWatch-driven updated bathymetry shows the subsidence bowl and a few localised errors. The bulk shifts derived before
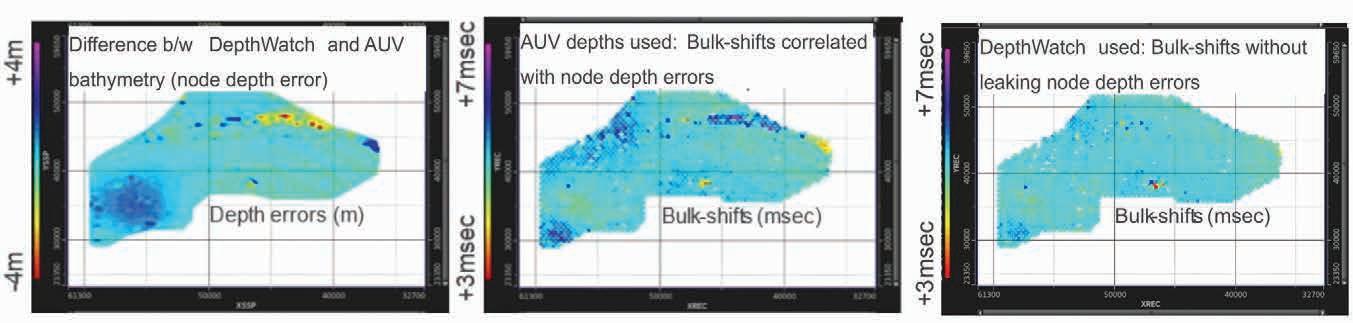
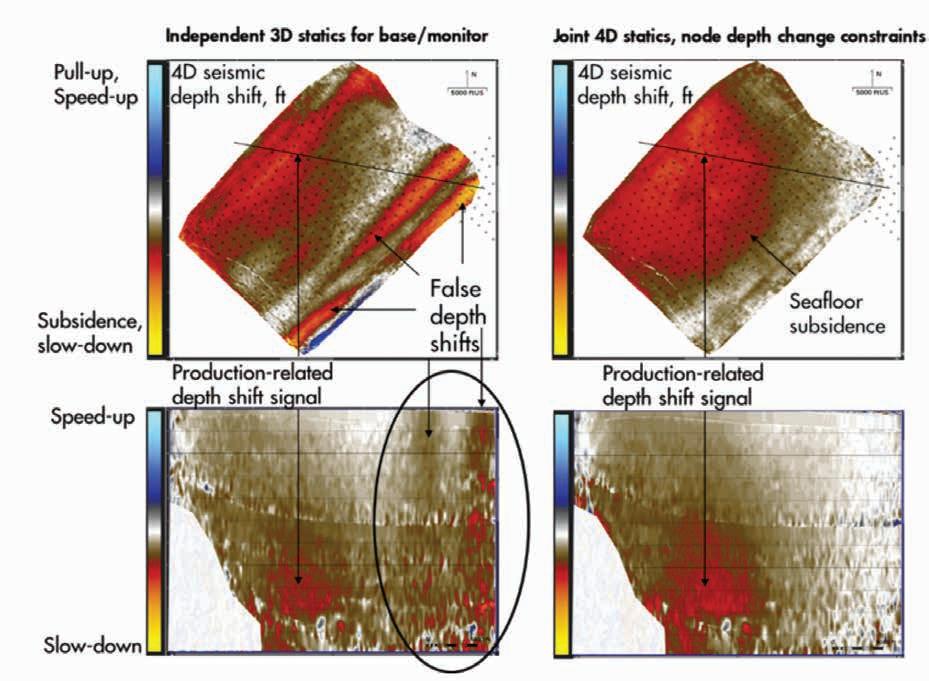
Figure 9 Depth shifts as a map view at the seafloor (top) and in a vertical subsurface section (bottom), when using fast-track OBN statics workflows for baseline and monitor (left), and an advanced 4D statics workflow using DepthWatch node depths and subsidence constraints (right), from Dutta et al., 2023, with permission from SEG.
using inaccurate AUV-driven relative node depths show strong imprints of bathymetry error, which are strongly reduced when using accurate DepthWatch relative node depths.
In time-lapse seismic, spatially and temporally varying water velocity is a major source of non-repeatability, particularly in deep water. Accurate node-depth constraints simplify the separation of depth-related effects from water-velocity corrections, making joint 4D statics workflows more robust.
Figure 9 compares seafloor and subsurface depth shifts derived from fast-track and advanced OBN statics. The fast-track statics are based on node depths derived from AUV bathymetry and a direct arrival travel time analysis. The advanced OBN statics (Kiyashchenko et al., 2020) use both direct arrivals and water bottom multiples along with DepthWatch node depths and subsidence constraints. In the former case, true compaction-related depth shifts are present but obscured by striping and artefacts associated with water-velocity variability. In the advanced statics case, these artefacts are largely removed, and both seabed subsidence and subsurface depth shifts are recovered more clearly.
From a reservoir monitoring perspective, the work that we bring together here demonstrates how improved knowledge of receiver depth can extend the value of time-lapse OBN seismic surveys beyond imaging alone. By embedding survey-grade depth measurements into routine OBN operations, we obtain an independent and spatially dense measure of seabed subsidence that complements established monitoring techniques. This information is directly relevant for calibrating reservoir and geomechanical models and for assessing the integrity of wells and seabed infrastructure. Repeated application in deep-water fields has shown that the resulting subsidence estimates are consistent over time and are broadly consistent with other subsidence-related observations available in the fields.
At the same time, accurate node-depth constraints strengthen the primary monitoring tool for these fields: 4D seismic. Improved depth control leads to more robust OBN statics, increased data repeatability, and clearer separation between true reservoir-related signals and acquisition or water-column effects. This reinforces reliability and interpretability, particularly in compacting reservoirs where depth changes are expected.
We have reported that relative node depths can be measured with an accuracy of approximately 4-5 cm within a single deep-water OBN survey. When these measurements are repeated across successive surveys, they enable direct estimation of seabed subsidence with an uncertainty of around 3 cm over multi-year timescales. The resulting subsidence maps provide an independent constraint on field-scale compressibility and overburden response, while the same depth information materially improves time-lapse seismic statics and depth-shift analysis.
The workflows developed offer a practical enhancement to existing seismic operations. It requires only modest modifications
to standard OBN deployment procedures and can be implemented with high operational and cost efficiency through close coordination between seismic, survey, and reservoir teams. Overall, the approach delivers tangible benefits for both seismic processing and reservoir monitoring.
The authors would like to thank Paul Hatchell for his pioneering work on incorporating DepthWatch into OBN campaigns and for his technical insight in the development of these workflows. We also thank Dunia Blanco Acuna, Aiden Shen, and Todd Noble (Shell USA Inc.) for their contributions to data acquisition, processing, and interpretation. The authors acknowledge the close collaboration between Shell and Reach Subsea teams, whose operational coordination made this work possible.
Agersborg, R., Hille, L.T., Lien, M., Lindgård, J.E., Ruiz, H. and Vatshelle, M. [2017]. Density changes and reservoir compaction from in-situ calibrated 4D gravity and subsidence measured at the seafloor. SPE Annual Technical Conference and Exhibition, Extended Abstracts.
Dutta, P., Kiyashchenko, D., Wang, K., Libak, A., Bergfjord, E., Grøvik, I.M., Agersborg, R., Ruiz, H., Shen, A., Blanco, D. and Noble, T. [2023]. Subsidence measurement and improved statics solutions through accurate node depth determination during timelapse deep-water OBN surveys. International Meeting for Applied Geoscience & Energy 2023, Expanded Abstracts.
Eiken, O., Stenvold, T. and Alnes, H. [2022]. Accurate measurements of seabed subsidence above Norwegian gas fields. First Break, 40(3), 75–78.
Hatchell, P., de Vries, R., Gee, V., Cousson, H., Lopez, J., Dunn, S., Street, N., Parsons, A., Cheramie, J. and Fischer, E. [2017]. Seafloor deformation monitoring: past, present and future. SEG International Exposition and Annual Meeting, Expanded Abstracts
Hatchell, P., Ruiz, H., Libak, A., Nolan, B. and Agersborg, R. [2019]. Precise depth and subsidence measurements during deep-water OBN surveys. SEG International Exposition and Annual Meeting, Expanded Abstracts
Kiyashchenko, D., Wong, W., Cherief, D., Clarke, D., Duan, Y. and Hatchell, P. [2020]. Unlocking seismic monitoring of stiff reservoirs with 4D OBN: a case study from Brazil pre-salt. International Meeting for Applied Geoscience & Energy 2020, Expanded Abstracts
Ruiz, H., Lien, M., Vatshelle, M., Alnes, H., Haverl, M. and Sørensen, H. [2022]. Monitoring the Snøhvit gas field using seabed gravimetry and subsidence. First Break, 40(3), 93-96.
Vassvåg, S., Halpaap, F., Andersen, C.F. and Jørgensen, L. [2025]. Twenty-five years of monitoring the Troll gas and oil field with time-lapse gravity and seafloor deformation surveys. First Break, 43(3), 41-46.
Vatshelle, M., Glegola, M., Lien, M., Noble, T. and Ruiz, H. [2017]. Monitoring the Ormen Lange field with 4D gravity and seafloor subsidence. 79th EAGE Annual Conference and Exhibition, Extended Abstracts.
EAGE recognizes the current challenging status of the industry and, priding itself on the inclusive character of the Association, has a special economic hardship assistance programme in place to reach out to its members.

FARAH YUSOP PhD candidate at Imperial College London
I am grateful for the opportunity to attend the Masterclass in 2025 through EAGE’s Hardship Programme, which allowed me to immediately apply the knowledge gained to my work. Receiving this support demonstrates that EAGE values my research as a PhD student.
150+ PEOPLE SUPPORTED IN 2025
32
PEOPLE FROM COUNTRIES RECEIVED FINANCIAL SUPPORT
UNLOCK OPPORTUNITIES FOR GROWTH STUDENTS CAN APPLY FOR THEIR FIRST YEAR OF MEMBERSHIP FOR FREE (RE)ACTIVATE YOUR MEMBERSHIP TODAY!


Stefan Carpentier1*, Sjef Meekes1, Eldert Fokker1 and Jelle Buma1 present a working method for the inversion of Vertical Electrical Sounding (VES) curves to estimate the depths of the fresh-brackish and brackish-saline groundwater interfaces (FBSI), enabling the detection of changes in FBSI at depths up to 300 m from repeated VES measurements in a monitoring setting.
Abstract
A new standardised and objective working method, FBSI4REGIS2VES was developed for the inversion of Vertical Electrical Sounding (VES) curves to estimate the depths of the fresh-brackish and brackish-saline groundwater interfaces (FBSI). The method enables the detection of changes in FBSI at depths up to 300 m from repeated VES measurements in a monitoring setting. Incorporating prior information from the REGIS II hydrogeological model improves the absolute estimation of the FBSI. At 9 repeated VES locations in the North Limburg Venlo Graben study area, the FBSI shows little consistent change over time, and no structural FBSI rise was observed in the area of investigation.
Introduction
In the Netherlands, areas exist with deep fresh-brackish and brackish-saline groundwater interfaces (FBSI) down to ca.
600 m depth. In these areas, thick freshwater bodies may serve e.g. as strategic water reserves. To manage these water reserves, knowledge of their thickness is crucial. In 1981 and 2006, maps of deep FBSI depths were mainly based on Vertical Electrical Sounding (VES) measurements acquired during the 1960s-1980s, supplemented by a limited number of deep boreholes. Figure 1 shows the current best-estimated nationwide FBSI depths in the Netherlands according to those maps. However, the inferred VES models are highly non-unique, especially at greater depths. There is a set of diverse models that can explain the data. It is therefore common use in inversion of VES data (and generally in geophysics) to use as much a-priori knowledge in the inversion as possible. In the Sixties to Eighties of the last century, this was often done by looking at boreholes in the vicinity of the VES. During the past 20 years a Dutch nationwide hydrogeological subsurface model was constructed by the Geological Survey
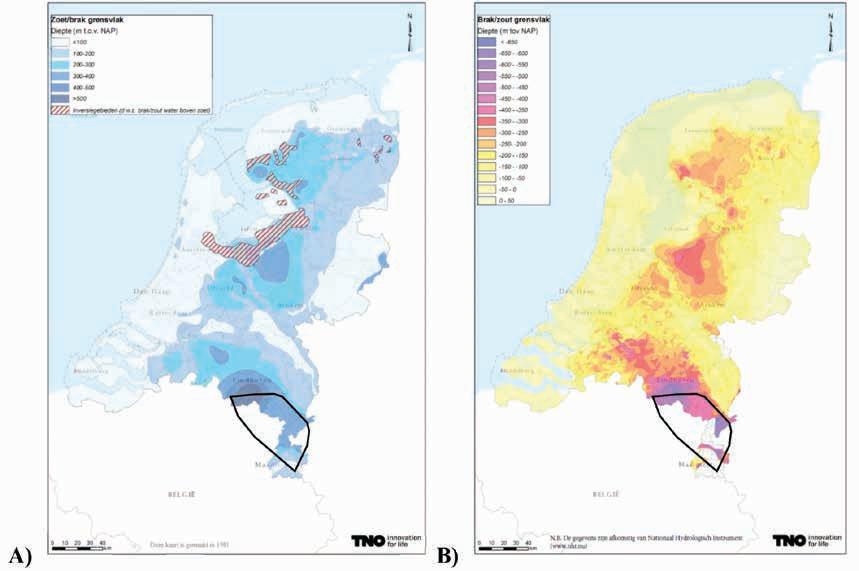
1 TNO Geological Survey of the Netherlands
* Corresponding author, E-mail: stefan.carpentier@tno.nl
DOI: 10.3997/1365-2397.fb2026018
Figure 1 a) Map of fresh-brackish interface depth in the Netherlands. b) Map of brackish-saline interface depth in the Netherlands. Black polygon: Dutch North Limburg/ Roerdalslenk region. Source: Grondwatertools.nl.
of the Netherlands (GDN), now at TNO. This model is called REGIS II, and incorporates many types of subsurface information combined in a sophisticated statistical interpolation method. It serves as the background model in many major Dutch groundwater flow calculations. VES measurements are, however, not included in the REGIS II model.
In this paper we present a working method to integrate the REGIS II model in inverting the vintage VES measurements to obtain an indication of the consistency between VES and the REGIS II model and a new estimate of the FBSI for that location. We call this new method FBSI4REGIS2VES. This standardised and objective working method is implemented in Python code using the versatile pyGIMLi Python package (Rückner et al., 2017) and resulted in the development of a set of Python functions. It has great potential, because the Netherlands hosts 14500 VES measurements from the period 1960s-1990s. Using this new method, a high-resolution refined mapping of the FBSI was for example done in the Dutch North Limburg/Roerdalslenk region. Figure 2 shows the improved local estimates of the FBSI, which includes geological faultsteps in the Roerdalslenk graben.
Due to the standardised and objective nature of the new working method FBSI4REGIS2VES, it is suitable for monitoring hydrogeological processes in the Netherlands by doing timelapse repeat VES inversions. An imminent challenge involving the strategic drinking water reserves of the Netherlands provides a suitable testcase for FBSI4REGIS2VES. The sands of the Kie-
selooliet Formation in North Limburg form an important aquifer in the Venlo Graben. In much of the area, the upper boundary of this aquifer is sealed by the first clay layer of the Kieselooliet Formation.
In the 1970s, the depth of the fresh-brackish-saltwater interface in the Venlo Graben was mapped by the former TNO Groundwater Exploration Service (TNO DGV) using VES measurements. Since then, groundwater has been extracted from the aquifer below this clay layer for more than four decades — for drinking water supply, irrigation, and industrial use. The Province of Limburg has designated this aquifer as a strategic groundwater reserve and plans to designate it as an Additional Strategic Reserve (ASV) as well. Implicit in this designation is the assumption that the water below the clay layer does not become saline.
The central question now is whether the fresh-brackish and brackish-salt interface has risen in recent decades as a result of these groundwater extractions.
The method for incorporating existing subsurface models such as REGIS II in the initial model / starting model for the inversion of VES measurements is schematically represented in Figure 3. In the Dutch sedimentary environment, the following correspondence can be assumed between the resistivity model and the lithological (e.g. REGIS)-model:
• Sand: high resistivity: 50 – a few hundred Ωm
• Clay: low resistivity: 12 – 50 Ωm
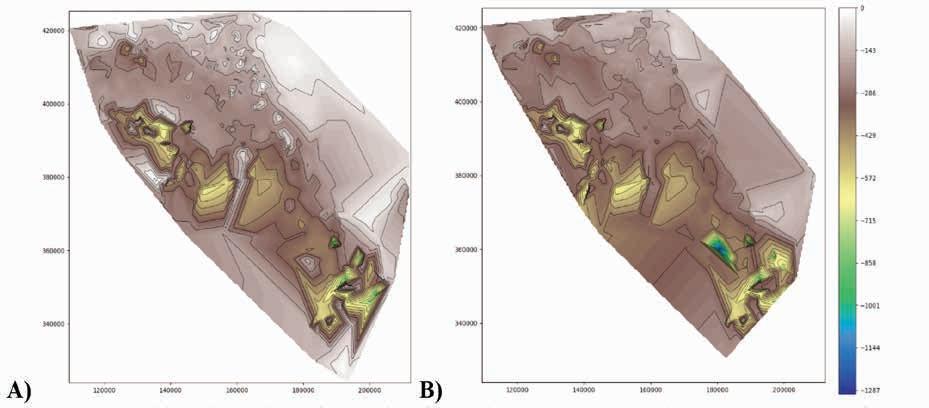
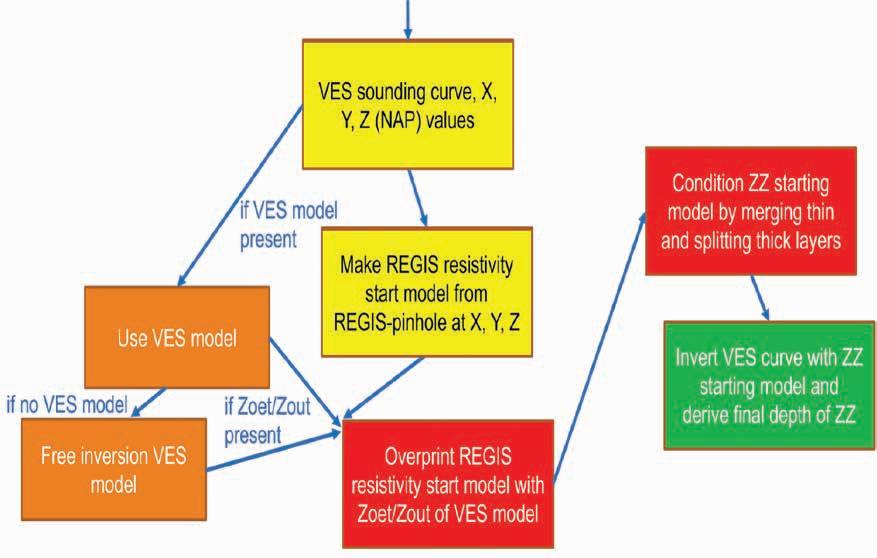
Figure 2 a) Map of fresh-brackish interface depth in the Dutch North Limburg/Roerdalslenk region. b) Map of brackish-saline interface depth in the Dutch North Limburg/Roerdalslenk region (Meekes & Carpentier, 2023).
Figure 3 Schematic illustration of the FBSI4REGIS2VES workflow. Zoet = sweet, zout = saline, ZZ = sweet/ saline.
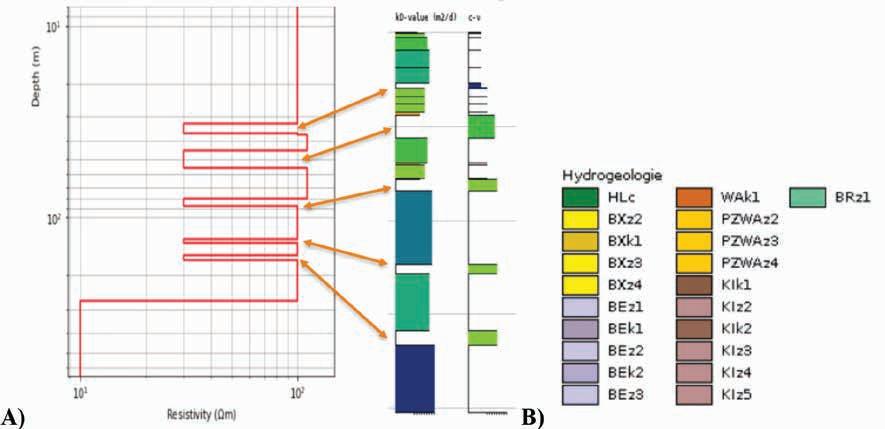
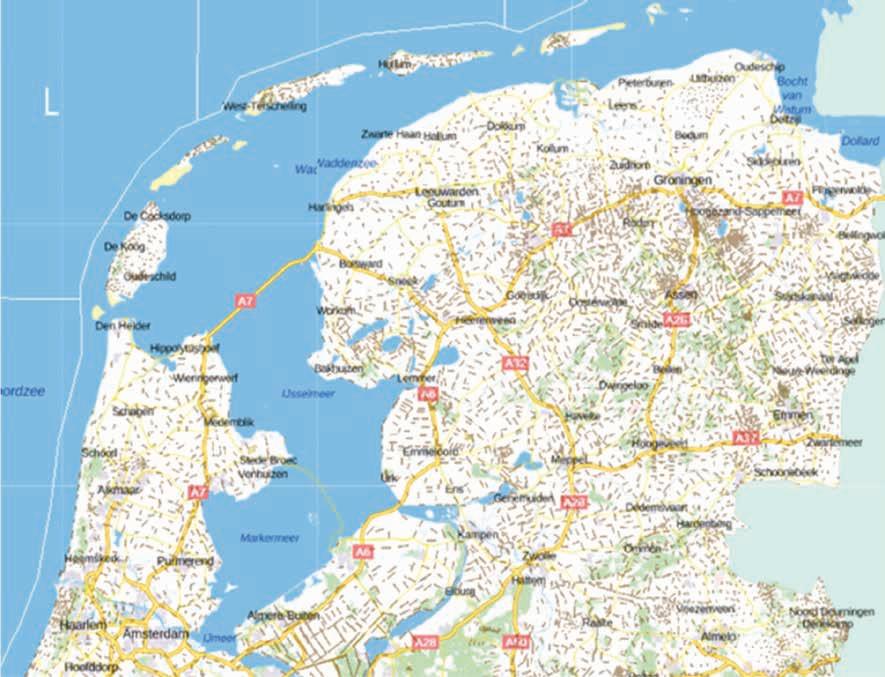
This correspondence is illustrated in Figure 4. The REGIS II layers with a low transmissivity (kD-value) are inserted in the model as low resistivity layers (clay) in the starting model. The relatively permeable layers have a more sandy character and a corresponding higher resistivity. Subsequently an inversion is performed in which resistivities and depths are allowed to vary within constrained ranges of uncertainty. If the data mismatch with the inverted model, limited to the above-mentioned boundary values, is smaller than a certain threshold, in this case 0.75, the REGIS II model is believed to be consistent for the location of the VES. Then the depth of the FBSI is determined employing the inversion with the REGIS-based initial resistivity model. However, if the mismatch exceeds the threshold, this indicates that the REGIS II model for that location may not be valid and it cannot be used for improved FBSI estimation.
Prior VES QC is reported in more detail in Meekes & Carpentier (2024a,b). In summary, the VES curves and REGIS II initial models are scanned and corrected or discarded for outliers, duplicate/transition points and other errors. Central in the method is the translation of the pinhole of the REGIS II (or any other subsurface model) in a 1D resistivity model. Figure 4 a) and b) illustrate this process.
4 a) REGIS II pin-hole and resistivity start model (logarithmic axis). b) legend for the REGIS profiles.
5 Map of VES data availability in North Netherlands (grey stripes).
In VES modelling the subsurface is generally modelled by a few layers that represent the main layers of the subsurface. To each layer, a thickness and a resistivity are assigned. Often, some of the layers actually consist of several thinner layers of varying resistivity, as exemplified in Figure 4. Below a certain thickness threshold, these layers are in our VES modelling and inversion represented by one weighted bulk layer, as seen in the model on the right. A weighted bulk layer representing several thin layers will have a lower resistivity in VES modelling for the usual case of small clay layers. This phenomenon is called pseudo-anisotropy (see e.g. Koefoed 1979), or macro-anisotropy.
As mentioned before, the new method FBSI4REGIS2VES has great potential because the Netherlands hosts 14500 VES measurements from the period 1960s-1990s, as illustrated in Figure 5. Moreover, due to the standardised and objective nature of the new working method, it is suitable for monitoring hydrogeological processes in the Netherlands by doing timelapse repeat VES inversions. TNO–Geological Survey of the Netherlands (TNO GDN) conducted such an investigation in the North Limburg Venlo Graben by repeating historical base VES measurements
at suitable locations. The underlying concept is that the geology has remained unchanged; therefore, any differences between base and repeat VES curves reflect changes in the depth of the freshbrackish-salt interface. As a result, these measurements yield an estimate of the change in depth of the interface.
Assumptions made:
• The transition of fresh-brackish-saline groundwater occurs in a relatively narrow depth range (order of magnitude 10 m).
• The electrical conductivity of the directly overlying fresh groundwater has not changed.
A total of approximately 110 VES measurements were carried out historically within the North Limburg Venlo Graben study area. A small portion of these older base measurements is of limited quality, but the majority was classified at the time as ‘good’.
Due to the current built environment and infrastructure, some of the measurements can no longer be performed at the exact same historic sites. Therefore, it was decided to select nine representative repeat measurement locations as close as possible to the original base VES locations, see Figure 6. It was assumed that a shift of up to approximately 100 m would not materially affect the observed depth of the fresh-brackish and brackish-salt interfaces.
On-site adjustments were also made to avoid infrastructure, newly constructed buildings, and obstacles such as fences or forested areas. These adjustments were made to ensure that the measurement could be carried out properly within a workable area of each parcel.
An actual VES (Vertical Electrical Sounding) measurement introduces an electrical current into the ground through two current electrodes (A and B), which are connected to a current source. The injected current is measured, and the resulting voltage is registered between two potential electrodes (M and N). In a VES setup, the current and potential electrodes are aligned
in a straight line and positioned symmetrically around the centre point, in the sequence: A — M — N — B
• The outer electrodes (A and B) inject current.
• The inner electrodes (M and N) measure the voltage.
During a VES survey, electrodes A and B are progressively moved farther apart, thereby increasing the depth of investigation, as a greater portion of the subsurface becomes influenced by the injected current. For both the historical base and the new repeat measurements, the Schlumberger configuration was used. In this configuration, the distance between the potential electrodes (M and N) is kept as small as possible. Figure 7 shows a typical VES field measurement in this configuration.
The field data from the VES measurements are inverted into a one-dimensional subsurface model (Rückner et al., 2017). This model consists of the thickness of each individual layer and the electrical resistivity of each layer (here referred to as the VES model), plus the resistivity of the material below the deepest layer. For example, a six-layer model contains 11 parameters: 5 layer thicknesses + 6 layer resistivities.
Some considerations and boundary conditions for this VES inversion are:
• Sensitivity and resolution of the inversion decrease with depth.
• The inversion is non-unique: different models can fit the same data (known as equivalence).
• A relative normalised error misfit << 1 indicates a good agreement between model and data.
• Higher misfit = poorer fit.
Because this monitoring timelapse study compares historical and repeated VES measurements, the focus is on differences between the two surveys. By keeping parameters that are not expected to change (e.g., layer thicknesses, lithology) fixed during inversion,
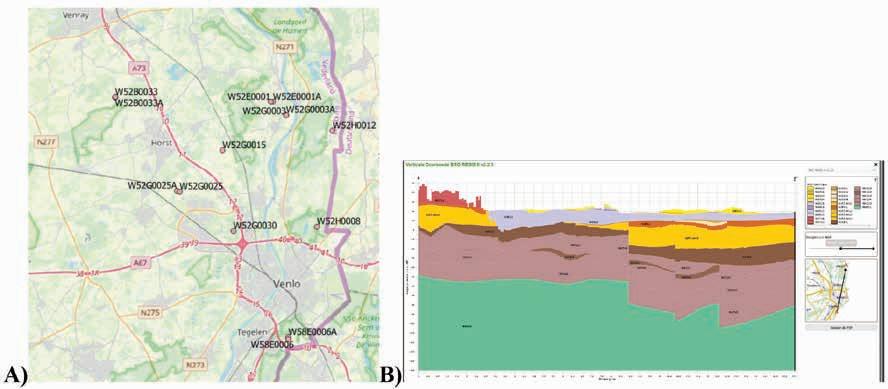
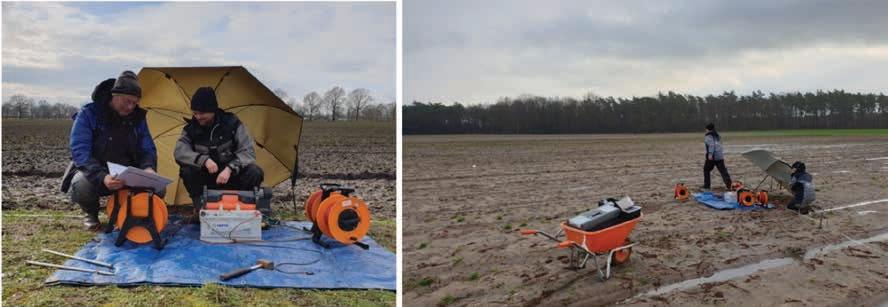
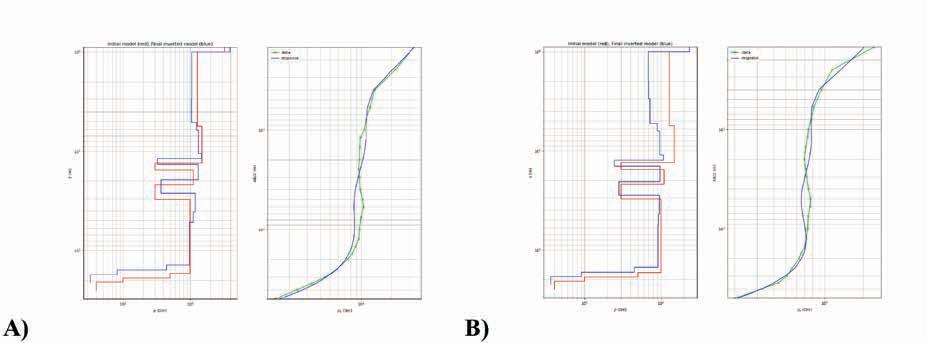
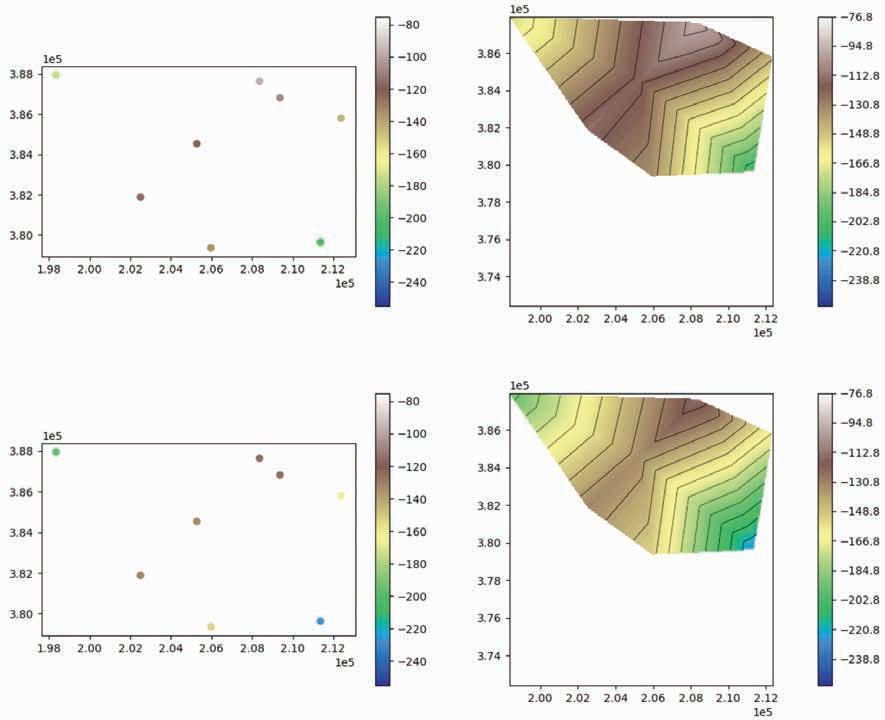
and allowing only potentially changed parameters to vary, the number of free parameters is reduced. This reduces equivalence and increases sensitivity to the depth of the fresh-brackish and brackish-salt interfaces.
Initially, it was assumed that the only change in the subsurface would be a shift in the fresh-brackish and/or brackish-salt interface. However, the measurements clearly show that resistivities in the upper layers have also changed. In most locations, resistivity values are lower today than several decades ago, caused possibly by newly introduced surficial conductive infrastructure or increased ion concentrations in the shallow groundwater. Lithology and layer thicknesses are assumed unchanged.
The fresh-brackish and brackish-salt transitions occur over finite thicknesses rather than at sharp boundaries. Over the decades between VES surveys, these transition zones may have changed shape. For interpretation purposes, these changes are represented as a change in the effective depth of the fresh-brackish and brackish-salt interfaces. The trend in this interpreted depth is informative for assessing long-term salinisation processes.
A typical set of base and repeat VES measurement and inversion result is shown in Figure 8.
Figure 8 Set of base and repeat VES measurements and inversion results for site W52G0015 (Figure 6a). a) from left to right: base VES initial REGIS II resistivity model (red blocky profile), base final inverted resistivity model (blue blocky curve), base VES measurement (green curve with ‘x’ symbols), base final modelled VES curve(smooth blue curve). b) from left to right: repeat VES initial REGIS II resistivity model (red blocky profile), repeat final inverted resistivity model (blue blocky curve), repeat VES measurement (green curve with ‘x’ symbols), repeat final modelled VES curve(smooth blue curve).
Figure 9 Final base VES inverted fresh-brackish interface of 8 locations in points (top left), in surface (top right). Final base VES inverted brackish-saline interface of 8 locations in points (bottom left), in surface (bottom right).
In the North Limburg Venlo Graben, nine repeat VES measurements, like the example shown in Figure 8, were carried out at locations where similar base measurements had been performed several decades earlier (Figure 6). The number of sites where a repeat measurement could be conducted was limited, but the overall quality of the measurements was found to be good. An exception is the southern location W58E0006 in the city of Venlo, where both the base and repeat VES measurements were inconsistent with the REGIS initial model. These measurements were therefore discarded from the monitoring study. The other eight locations show low and uniform VES curve and REGIS model misfits throughout the study area, as seen in Figure 12, so the final inverted differences and trends appear robust.
Overall, the results indicate that, on a local scale, there is no indication of a general rise of the fresh-brackish or brackish-salt interface (Figures 9-12). Some locations show downward movement (deepening), others show little change, and a few show slight upward movement (shallowing).
When interpreting the measurements to determine the change in depth of the fresh-brackish-salt interface, two key assumptions were made:
• The transition of fresh-brackish-saline groundwater occurs in a relatively narrow depth range (order of magnitude 10 m).
• The electrical conductivity of the directly overlying fresh groundwater has not changed.
However, the results showed that the subsurface above the freshbrackish-salt interface has changed significantly. At almost all locations, electrical conductivity of the upper layers overburden has increased substantially. This caused the interpretation of the changes in the interface depth to be less straightforward. Based on the analyses:
• At four locations, the fresh-brackish-salt interfaces have moved slightly downward.
• At four locations, the fresh-brackish-salt interfaces have moved slightly upward.
A further notable finding is that at many locations, the electrical resistivity of the sandy layers above the interface has decreased, indicating either surficial conductive infrastructure or increasing ionization.
Discussion
The VES method is a technique with limitations. Two current electrodes (A and B) and two measurement electrodes (M and N) are used around the measurement location. The distance between current electrodes increases for each subsequent measurement point. Thus, the survey collects resistivity data from different lateral depth zones beneath a single surface location. This implies that the conclusions about the changes in depths of the FBSI

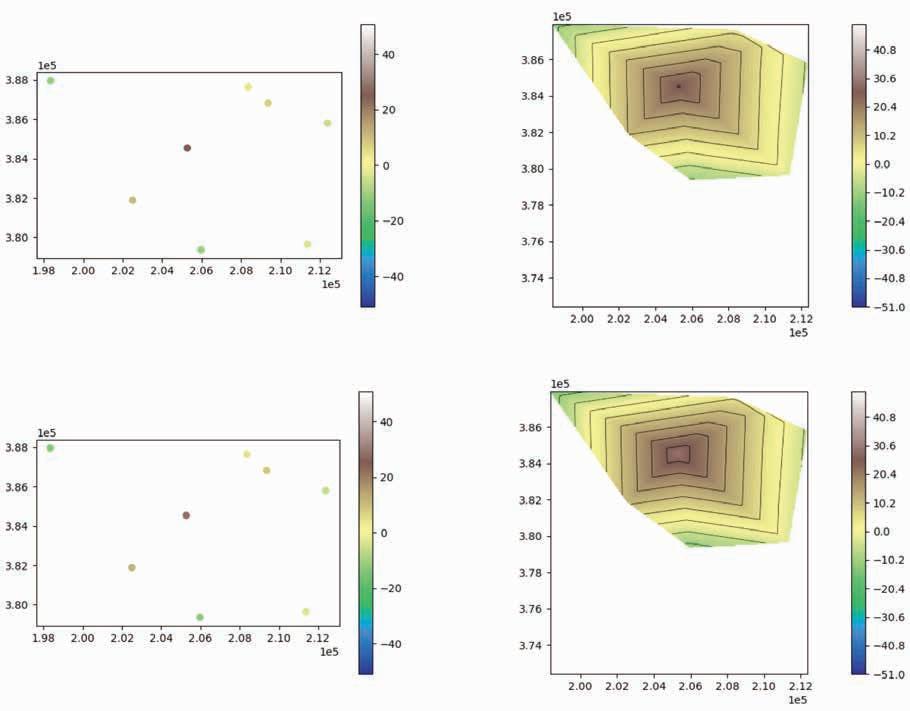
Figure 10 Final repeat VES inverted fresh-brackish interface of 8 locations in points (top left), in surface (top right). Final repeat VES inverted brackish-saline interface of 8 locations in points (bottom left), in surface (bottom right).
Figure 11 Final difference VES inverted freshbrackish interface of 8 locations in points (top left), in surface (top right). Final difference VES inverted brackish-saline interface of 8 locations in points (bottom left), in surface (bottom right).
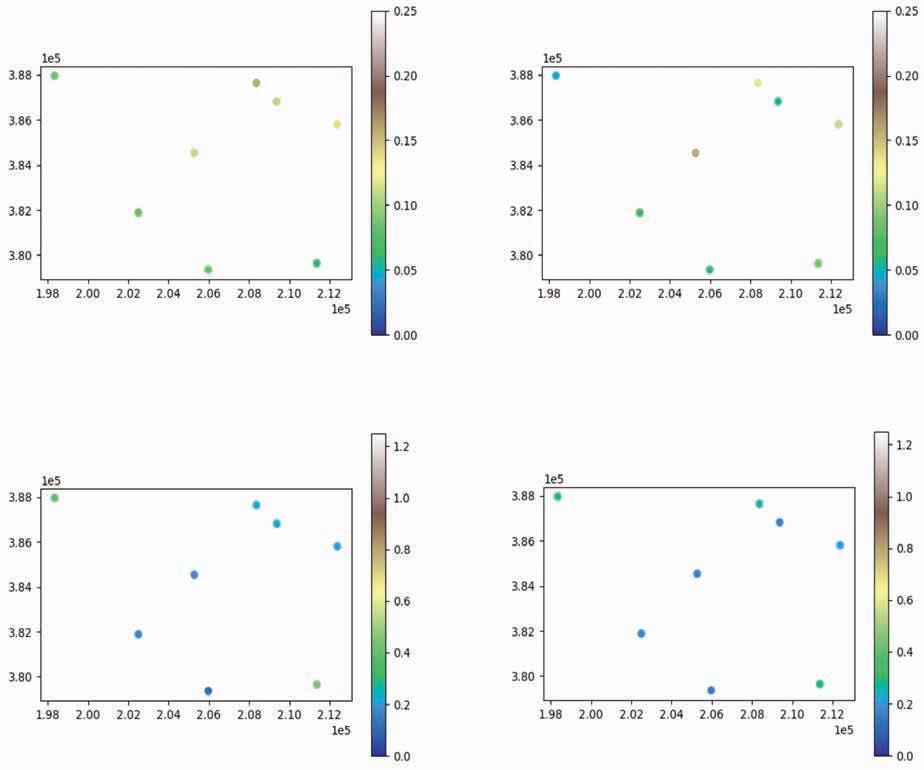
pertain only locally to the area enclosed by the 9 selected locations. Outside this local area, the changes can be different.
However, the data are inverted to a 1D model, while the measurements record 2D and even 3D effects, so we make assumptions in this 1D approach.
Also, limited resolution and ambiguity (non-uniqueness, or equivalence) in the inverted/interpreted models influence the results and interpretations, especially of the timelapse monitoring of differences.
However, the differences contain information about the depth of the saline water interface at that time. In an absolute sense the timelapse measurement differences are not very accurate (ca. 10 % of depth), but the trends are robust and consistent, even at greater depths.
In general the VES inversion method like many others suffers from decreasing resolution with depth, even more so than wavefield imaging methods. Still, the VES method can pick up contrasting layers of about half the AB/2 spread length in this study the depth of resolved contrasts is about 300 m.
The method of repeated VES measurements is capable of estimating changes in depth of the fresh-brackish-saline interface (FBSI) at depths up to 300 m. Including information from the hydrogeological REGIS II model improves the absolute estimation of the FBSI. At most locations in the timelapse monitoring study at the North Limburg Venlo Graben, the FBSI showed little consistent change
Figure 12 Final base VES inverted curve relative normalised misfit of 8 locations (top left), final repeat VES inverted curve relative normalised misfit of 8 locations (top right). Final base VES inverted model relative normalised misfit of 8 locations in points (bottom left), final repeat VES inverted model relative normalised misfit of 8 locations in points (bottom right).
in depth, and likely did not structurally move upward locally in the area enclosed by the 9 selected locations. Regionally outside this local area, we cannot draw such conclusions. At most locations a lowering of the resistivity of shallow aquifers is observed: this could indicate the introduction of surficial conductive infrastructure or more ionised groundwater in the shallow aquifers.
This work has been produced with support and consent from the Province of Limburg.
Geologische Dienst Nederland. Grondwatertools. Available at https:// www.grondwatertools.nl/thema-grondwater-projecten/zoet-en-zoutgrondwater.
Koefoed, O. [1979]. Geosounding principles 1. Resistivity sounding measurements, methods in geochemistry and geophysics. Elsevier, Amsterdam, 1979.
Meekes, J.A.C. and Carpentier, S.F.A. [2023]. Zoet Zout grensvlak Roerdalslenk. TNO-rapport 2023 R00000
Meekes, J.A.C. and Carpentier, S.F.A. [2024a]. Zoet-Zout grensvlak Utrecht. TNO-rapport 2024 R00000
Meekes, J.A.C. and Carpentier, S.F.A. [2024b]. Incorporating subsurface models in inversion of VES data. TNO-rapport 2024 R00001. Rücker, C., Günther, T. and Wagner, F.M. [2017]. pyGIMLi: An opensource library for modelling and inversion in geophysics. Computers and Geosciences, 109, 106-123, doi: 10.1016/j.cageo.2017.07.011.


APGCE 2026 Curtain Raiser: Be at the Forefront of Discovery! As we pave the way to APGCE 2026, the EAGE Workshop on Exploration and Opportunities in the Paleogene Play is spotlighting the breakthroughs breathing new life into these critical reservoirs. Whether it’s deepwater insights or clastic sedimentology innovations, we want to hear from you. Share your knowledge, spark new ideas, and secure your chance to present at the main conference.


Shape the future of exploration!


Camille Cosson1* and Elodie Morgan1 present a pragmatic workflow that integrates automated ensemble - based reservoir modelling with frequent, targeted focused seismic acquisitions for risk mitigation.
Abstract
Carbon capture and storage (CCS) projects must commit to long-term containment and regulatory compliance while operating under significant subsurface uncertainty. The monitoring, measurement and verification (MMV) plan should specifically address those challenges. This paper presents a pragmatic workflow that integrates ensemble-based reservoir modelling with frequent, targeted focused seismic acquisitions to transform MMV into the model validation process. The ensemble captures a large range of plausible plume behaviours, guiding the selection of high value monitoring locations where sparse observations can eliminate entire families of model scenarios at minimal operational cost. Focused seismic provides repeatable, low impact measurements that confirm or reject model predictions and trigger escalation when deviations arise. Two synthetic case studies demonstrate how this workflow rapidly narrows uncertainty, improves predictive confidence, and offers early warning when key assumptions do not hold. By coupling ensemble modelling with the unique strengths of focused seismic, the approach delivers a practical, scalable framework that enhances storage assurance, strengthens regulatory defensibility, and increases investor confidence.
Carbon capture and storage (CCS) projects operate under a distinctive combination of technical uncertainty, regulatory scrutiny, and financial fragility. To progress from concept to operation, CCS developers must establish a robust plan that integrates risks associated with decades of CO2 containment, aligned with stringent regulatory requirements, while relying on models that are inherently imperfect representations of the subsurface. This creates several challenges that operators must address from the earliest stages of project development.
Before a CCS project can secure investment or attract emitters, operators must present a compelling business case, often years before the first molecule of CO2 is injected. At this early stage, revenue forecasts depend on predicted storage performance derived from reservoir models constructed with sparse data, geological interpretations, and assumptions and simplifications.
1 SpotLight
* Corresponding author, E-mail: camille@spotlight-earth.com DOI: 10.3997/1365-2397.fb2026019
Developing a strong business case is particularly challenging in CCS because the economic context differs fundamentally from oil and gas. Carbon prices remain low and uncertain, resulting in thin margins and tightly constrained investment decisions. To build confidence among investors and partners, operators must demonstrate that the storage project is reliable, safe, and economically viable despite significant residual uncertainty.
This paper presents a pragmatic workflow that integrates automated ensemble-based reservoir modelling with frequent, targeted focused seismic acquisitions for risk mitigation.
Subsurface models are built from sparse and heterogeneous datasets, producing representations that have a certain likelihood of accuracy. This likelihood varies with data availability. Well characterised sites such as depleted gas fields, which have been operated and monitored for years, typically exhibit lower subsurface uncertainty than greenfield CCS targets like saline aquifers. Understanding what is known about the subsurface, and equally what remains unknown, is essential for designing both surface and subsurface infrastructure, as well as for defining a robust monitoring programme that supports a Final Investment Decision (FID).
Reservoir models play a central role in this process. They integrate existing knowledge and quantify the unknowns, generating a range of plausible subsurface behaviours. It is generally accepted that this range can be represented through an ensemble: a set of model realisations produced by combining simulations with systematic sampling of uncertain parameters. The ensemble captures and quantifies the most likely outcomes alongside the full extent of credible variability, providing the foundation for both development planning and monitoring strategy.
The Monitoring, Measurement and Verification (MMV) plan represents a substantial portion of both capital investment and operational expenditure in a CCS project, and it is a mandatory requirement for permitting. Its primary objectives are to demonstrate containment, that no CO2 migrates out of the storage
complex, and conformance, meaning that the plume evolves within the range of behaviours predicted by the reservoir models. When an ensemble approach is used, it captures variability arising from uncertain parameters. However, every realisation in the ensemble remains influenced by the underlying interpretation scenarios on which the models are built. This constraint is necessary: the uncertainty range must remain tractable, as an excessively broad range would hinder decision-making and undermine confidence. The MMV programme should identify and trigger alerts, at an early stage, when key modelling assumptions do not hold, so that corrective or investigative actions can be initiated promptly.
To achieve this, the monitoring programme must deliver reliable information on the behaviour of CO2 both at the wells and throughout the reservoir, and it should be designed as a dynamic hypothesis testing system capable of validating or challenging model predictions on a frequent basis.
We define here the fundamental characteristics of a monitoring system capable of functioning as a hypothesis-testing engine. An ensemble of models forms the basis for designing the monitoring strategy, guiding where observations will be most informative. The monitoring system must deliver measurements that confirm the presence or absence of CO2 in the subsurface and support ongoing model calibration. To achieve this, the monitoring technologies employed should meet the following criteria.
• Frequent: Uncertainty shrinks only when new information arrives at a pace that matches the evolution of the plume. Infrequent measurements leave the operator blind to potential deviations.
• Targeted: Not all locations are equally valuable. Measurements must be focused where the uncertainty is the largest (often away from the wells) and where the value of information is the most critical to operate the CCS field.
• Scalable: From an operational standpoint, the monitoring system must be deployable and sustainable within the local environment. It must integrate seamlessly with co-located industrial activities, infrastructure, and environmental protection constraints, ensuring that measurements remain feasible and reliable throughout the project lifecycle.
• Cost sensitive: Monitoring must be financially sustainable for the operator all along the field life cycle.
Focused seismic is particularly well suited to the constraints of CCS projects as it provides cost efficient, low impact, and highly targeted detections (Al Khatib and Morgan 2025). Measurements can be focused on critical points of interest, locations where plume propagation hypothesis can be tested, where models identify potential leakage pathways, and where the ensemble highlights decision critical uncertainty away from the wells (Figure 1).
Focused seismic is an active and sparse seismic monitoring tool, using only one optimal source location and one or a set of receivers per spot. By drastically reducing the acquisition footprint, both offshore (Cosson et al., 2025) and onshore (Peruch et al. 2025), focused seismic becomes an inherently scalable monitoring meth-

of focused seismic used to track the CO2 plume in Denmark’s Greensand CCS project (Al
et
The figure illustrates the principle of predictive monitoring, in which spot locations are strategically positioned to verify the movement of the plume front and assess conformance. While this approach was originally demonstrated using a single model realisation, the present study extends the concept to ensemble modelling.
od. Its lightweight operational requirements allow for frequent, repeatable acquisitions at low cost, supplying operators with high value information that can support iterative model refinement, early identification of deviations from expected behaviour, and the development of adaptive, risk-based monitoring strategies.
We propose a pragmatic workflow that leverages ensemble modelling and focused seismic monitoring without requiring history matching in the initial stages. The workflow begins with a conventional ensemble of reservoir models, which forms the basis for planning focused seismic acquisitions. The resulting CO2 detection outcomes are then used to screen through the ensemble and identify the realisations that are most consistent with the observed behaviour. This creates a self-correcting system that progressively improves predictive confidence, and strengthens the evidential basis for both business and regulatory decision making.
Generation of the ensemble: The process starts with the construction of an ensemble of reservoir models. Well and seismic data are integrated into a geological framework, and the appropriate stochastic algorithms are selected. Geoscientists and reservoir engineers analyse data variability to define uncertainty distributions and sampling strategies for the key parameters used in simulation. A preliminary ensemble is generated by running sufficient simulations to ensure variance stability, meaning the full variability is adequately captured. From the ensemble, percentile-based models, such as P10, P50, and P90 storage-capacity cases, can be extracted. However, every realisation remains plausible, and monitoring design must consider the entire ensemble, which represents the full range of possible plume behaviours. This is essential not only for monitoring design but also for investment planning.
Using the ensemble to define optimal spot locations: Once the ensemble simulations are completed, the next step is to analyse patterns of similarity and divergence across the realisations. Divergence zones highlight areas where the ensemble produces
significant variability in plume arrival time and shape. These zones guide an algorithm that automatically identifies the most strategic focused seismic locations, spots where observations can eliminate large subsets of scenarios based on a conservative seismic detectability threshold of 10% average saturation in this saline aquifer case.
To align with a fast operational cycle, typically one to two days of acquisition, 20 to 30 spot locations can be selected where subsurface uncertainty is highest. For each realisation in the ensemble, we extract the predicted presence or absence of CO2 at these locations at the time of the scheduled acquisition. These predicted detection outcomes, form a unique ‘spot card prediction’ for each realisation.
Using spot card observations to confirm or reject scenarios: When focused seismic measurements (‘spot card observations’) are acquired, the detection or non-detection outcomes are used to validate or discard realisations, thereby increasing confidence in the underlying model assumptions. Because focused seismic is lightweight and minimally intrusive, these acquisitions can be repeated frequently without disrupting operations or generating substantial cost or environmental footprint. The outcome is simple yet powerful. It gives focused seismic a uniquely high discriminative power relative to its cost.
In summary, each spot card observation is compared directly against the predicted responses:
• If the observation matches the prediction, the corresponding realisations are validated.
• If the observation does not match, the related realisations are discarded.
Streamlined multi-realisation screening with clustering approach:
To manage the large number of realisations efficiently, this process is automated using a clustering approach. Realisations are grouped according to similarities in their predicted spot cards, and the observed spot card selects the corresponding cluster (Gestin et al. 2026). With each monitoring campaign, the ensemble narrows, increasing confidence in the remaining realisations and improving the reliability of the model.
However, a situation may arise where none of the cluster predictions agree with the spot card observation. In such cases, the system triggers an alert, indicating that the underlying model assumptions must be re-examined.
Escalation pathways for addressing model–observation mismatches
When spot card observations do not align with the predictions, it indicates that the key assumptions underpinning the models are not
validated. In such cases, it becomes necessary to revisit the geological interpretation, reassess the data incorporated into the study, and identify potential gaps or mis-characterisations. The focused seismic results provide clear evidence of non-conformance and offer valuable guidance on where to investigate further, whether the model requires updating or whether additional data acquisition is needed.
Operators must anticipate this possibility and address it through a multi-layered MMV plan that includes contingency measures triggered by deviations detected with focused seismic or other frequently acquired, easily interpretable monitoring data. These secondary measures are not scheduled routinely but activated only when the primary monitoring indicators demonstrate a confirmed need.
To demonstrate the robustness of such a monitoring framework, operators can develop a bowtie risk management structure summarising the main risks, the preventive measures in place, and the escalation pathways for responding to anomalies (Figure 2). This bowtie approach is widely recognised and accepted (Osmond et al., 2024).
To illustrate the workflow, a synthetic yet realistic and geologically consistent, case study was developed collaboratively by SpotLight and CMG. In this scenario, CO2 is injected through five wells into a large, homogeneous siliciclastic reservoir with no significant leakage pathways, no faults nor legacy wells. Injection is simulated over a ten-year period.
To represent subsurface uncertainty, key parameters are sampled from defined distributions, including porosity, permeability, rock compressibility, thermal conductivity, heat capacity, residual CO2 saturation, and injection rates. The simulation results produce 120 realisations, of which 91 are selected for the two cases presented in this section.
The first exercise evaluates how focused seismic observations can increase prediction reliability. In this synthetic setup, one of the 91 realisations is randomly selected by the reservoir engineers to serve as the ground truth. Acting as ‘game master’, the reservoir engineer withholds this information from the monitoring team. The full set of 91 models is then provided to the monitoring team, who analyse all realisations across the 10-year injection period to identify strategic spot locations, generate spotcard predictions, and build clusters. These clusters range from groups of up to
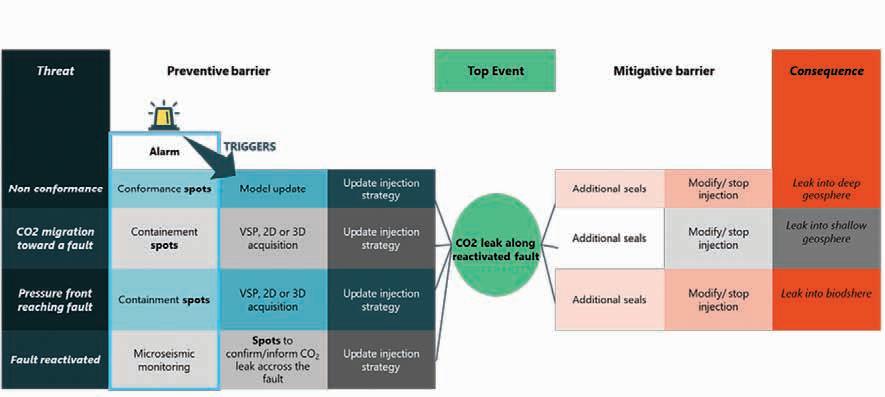
Figure 2 A bowtie framework can be used to structure risk- based monitoring, progressing logically from left to right. It begins with identified threats, followed by primary monitoring barriers that signal early anomalies. When such anomalies are detected, secondary mitigation measures can be activated to support decisions that prevent an unwanted event, such as CO2 migration along a fault. In this framework, focused seismic functions as a key preventive barrier, providing frequent, targeted detection capability that strengthens early warning and overall risk control.
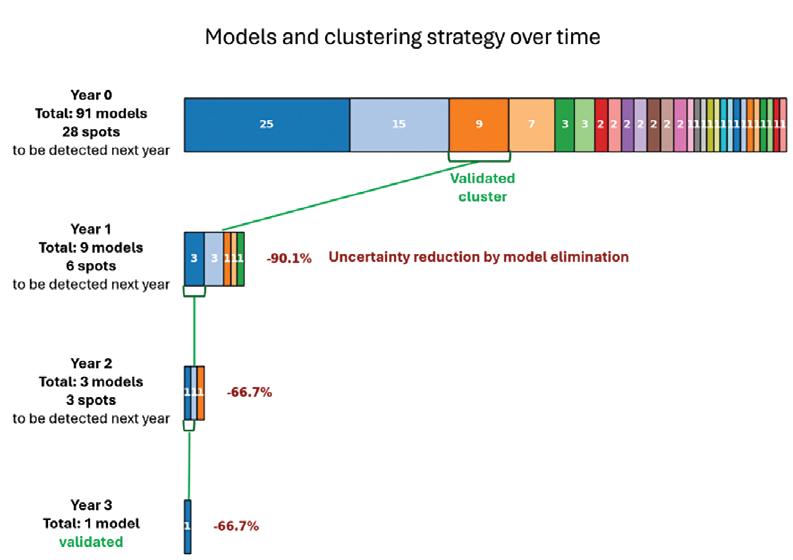
25 realisations with similar detection signatures to single model clusters with unique predicted behaviours.
A focused seismic survey is assumed to occur one year after injection begins. In this synthetic case, no detection is observed. The game master provides the spotcard observation to the monitoring team, who can immediately identify the matching cluster: only 9 of the initial 91 realisations are consistent with the nondetection result. The process is repeated the following year, reducing the set from 9 to 3 realisations. After the third monitoring campaign, only one cluster of one realisation remains (Figure 3). For simplicity, uncertainty distributions are not updated after each acquisition, although in practice a recalibrated ensemble should be generated to ensure the full uncertainty range remains properly captured.
This workflow impacts on predicted storage volume. Before injection begins, the ensemble predicts a 10-year injected volume between 51.82 and 52.02Mt of CO2, corresponding to a difference of 210kt. After three years of monitoring, the estimate narrows to 51.93Mt. At a carbon price of $85 per tonne, this corresponds to a value of approximately $17.48 million (Figure 4). Although the change in revenue may appear modest, the ability to demonstrate early that predictions are accurate, and that the storage complex is behaving as expected, is critical. It strengthens confidence among regulators, the public, investors, and insurers that major risks are
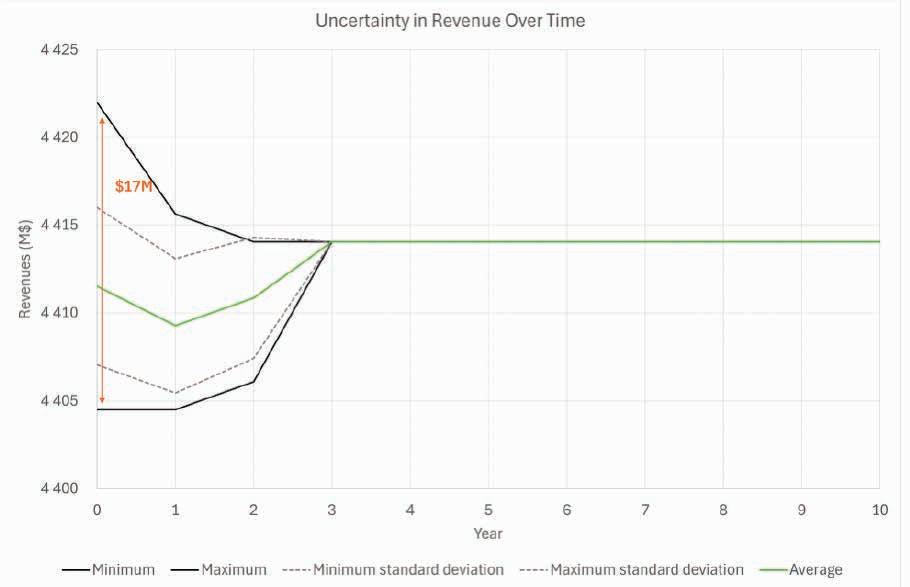
3 This figure shows how clustering model realisations before comparing predicted and observed spot cards accelerates convergence. With this approach, only three years of monitoring are needed to narrow the ensemble to a single cluster containing one matching realisation.
not materialising and that the likelihood of Opex escalation or costly contingency measures is decreasing. In short, it directly reduces financial and operational risk. Being able to quickly demonstrate that risks are under control is crucial for securing the confidence of all CCS stakeholders, and ultimately for reaching the project’s final investment decision.
To go further, a next step is to integrate the insights provided by the spotcard observations. These observations offer high value constraints that can be used to update the reservoir models and refine key parameters, either through expert guided adjustments or automated historymatching workflows. In a full implementation, each monitoring campaign should trigger the generation of a new ensemble with an updated uncertainty distribution. This approach preserves the number of realisations and model consistency while progressively narrowing the variability range, thereby strengthening predictive capability. The result is a more reliable probabilistic description of future outcomes.
In this second scenario, the exercise is repeated with a different set up. Instead of selecting one realisation from the 91-model ensemble used previously, the game master now chooses a ‘ground-truth’ model from the remaining 29 realisations that had not yet been used. The same monitoring and clustering workflows are then applied.
After the first monitoring, the spotcard result points to a cluster containing a single unique realisation. The process is repeated annually. For the first two years, subsequent acquisitions continue to confirm model conformance. However, in Year 3, only six of the nine expected distinction spots detect CO2. This deviation triggers an alarm, signalling that the previously validated model is no longer reliable (Figure 5).
In this scenario, conformance is no longer maintained. An analysis of the mismatches between model predictions and monitoring observations provides critical insights for prioritising remedial actions based on operational importance. These discrepancies offer evidence that key geological interpretations, modelling assumptions, and parameter uncertainty distributions may need to be revisited. If
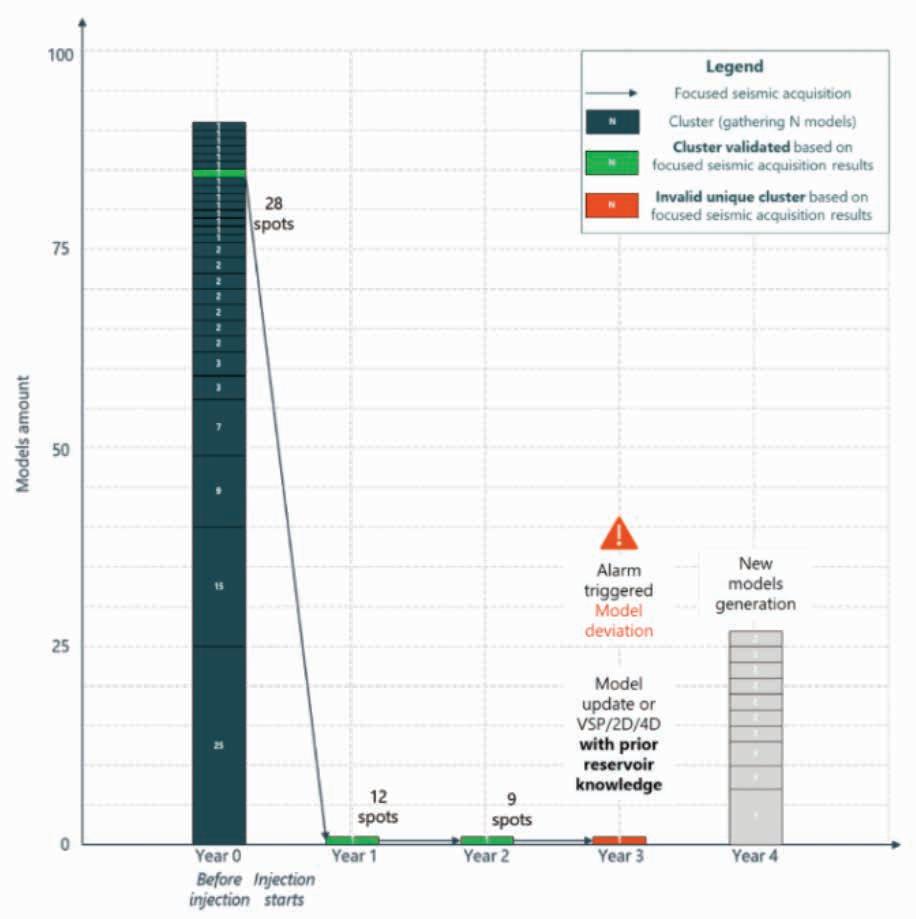
these updates allow the generation of a new, geologically consistent ensemble that aligns with the spot-card detections, the workflow returns to the Case 1 pathway. However, if no model update can reconcile predictions with observations, this indicates that the current subsurface knowledge is insufficient. At that point, more comprehensive data acquisition, such as VSP, 2D, or 3D seismic, could be initiated to obtain a holistic understanding of the field. In both outcomes, frequent monitoring data that enable systematic comparison of model predictions against observations, within a probabilistic framework, provide robust evidence for assessing model reliability. This continual validation process strengthens confidence in the subsurface understanding and supports better-informed, high-stakes operational decisions.
CCS projects face persistent challenges: proving storage performance long before injection begins and demonstrating regulatory compliance using models that inevitably contain uncertainty. The adaptive workflow presented here, combining ensemble-based modelling, targeted focused seismic acquisition, and triggerdriven decision pathways, offers a practical way to reduce these uncertainties early. By generating an ensemble of realisations that captures the full span of plausible subsurface behaviours, operators can design bespoke monitoring programs that focus on high value locations. Focused seismic, with its low cost, scalability, and repeatability, provides frequent observations capable of confirming or disproving entire families of models. The synthetic case studies demonstrate that this approach can quickly narrow uncertainty, strengthen confidence in plume evolution, or provide early detection of deviations that warrant escalation. This not only improves technical assurance but also reduces financial and regulatory risk by ensuring that anomalies are identified before they become operational or compliance issues. Furthermore, it transforms mandatory monitoring into a decisive tool to enhance performances: each
acquisition sharpens confidence and validates the core assumptions that underpin development and operational decisions.
To advance this study further, two developments could be considered. First, automated history matching workflows could be used to refine the ensemble after a detection. Second, the impact of uncertainties inherent to focused or other seismic measurement could be incorporated. As demonstrated by (Duret et al. 2024) uncertainties arising from velocity model imperfections and source–receiver positioning can be quantified and used to enhance interpretation. As well, the uncertainty on the seismic detectability threshold, which can be assessed with a field test called ‘calibration spot’, could be integrated. It would capture the uncertainty in the relationship between saturation or pressure with elastic changes. Those two elements would deliver a posterior ensemble of models that provides better prediction and more reliable subsurface risk assessment.
By coupling an ensemble modelling with the unique strengths of focused seismic, CCS operators gain a powerful, repeatable framework that makes storage projects safer, more transparent, and ultimately more investable.
We extend our heartfelt thanks to the CMG and SpotLight teams for their support. We also express our gratitude to Kevin Gestin and Varun Pathak, without whom this study would not have been possible.
Al Khatib, H., Gestin, K., Roth, T., Burachok, O. and Morgan E. [2024]. Predictive maintenance for CCS subsurface surveillance using focused seismic monitoring. 85th EAGE Annual Conference & Exhibition, Extended Abstracts. https://doi.org/10.3997/2214-4609.2024101657
Al Khatib, H. and Morgan, E. [2025]. Trigger Seismic CCS surveillance: Not to image, but to know when to image. First Break, 43(10), 27-91. https://doi.org/10.3997/1365-2397.fb2025080
Cosson, C., Al Khatib, H. and Brun, V. [2025]. From Paper to Action: How Operation Agility and Synergies Will Unlock CCS at Scale in Offshore Context. SPE Asia Pacific CCUS Conference, Abstract. https://doi.org/10.2118/225867-MS
Duret, F., Mari, J.L., Al Khatib, H., Richard, K. and Messamah, M. [2024]. Contribution of Uncertainty to Automated CO2 Detection by Focused Seismic Monitoring. Fifth EAGE Global Energy Transition Conference & Exhibition (GET 2024), Extended Abstracts. https://doi. org/10.3997/2214-4609.202421074
Gestin, K., Morgan E., Al Khatib H. and Pathak V. [2026]. Divide and Conquer using Predictive Monitoring to Reduce CCS Flow Model Uncertainties and Ensure Containment. Accepted for presentation at the CCUS Conference, Houston, TX, USA.
Morgan E., Gestin, K., Pathak V. and Al Khatib, H. [2026]. Adaptive Seismic Monitoring to Reduce Uncertainty in Stochastic Reservoir Models for CCS. Submitted for presentation at GHGT-18, Houston, TX, USA.
Osmond, J., Burrows, J. and Beks, J. [2024]. Task 1 & 2 - Technical Review of Monitoring Solutions & Recommendations for Monitoring Plans, Ministerie van Economische Zaken en Klimaat. DNV.
Peruch, P., Chen, S. and Morgan, E. [2025]. The value of frequent spot seismic: 4 years of monitoring on the Weyburn field. First EAGE Workshop on Geophysical Techniques for Monitoring CO2 Storage, Extended Abstracts


by submitting your abstract in one of the following topics:
• Geodynamics and Structural Geology
• Stratigraphy and Depositional Systems
• Petroleum Systems


• Carbon Sequestration and Alternate Energy Opportunities
• New Analytical Methods


Leo Eisner1*, James P. Verdon2, Sherilyn C. Williams-Stroud3, Zuzana Jechumtálová1 and Thomas Finkbeiner4 demonstrate how microseismic monitoring goals can be met by adaptive network designs derived from and informed by geological parameters of the reservoir.
Summary
The first step in microseismic monitoring is defining campaign specific objectives, such as estimating stimulated reservoir volume, determining hydraulic fracture geometries, ensuring containment of injected fluids, managing impacts on the public such as induced seismicity etc. These objectives entail detection and event location criteria to be met by the monitoring network design. Initially in unconventional plays, microseismic monitoring was used to understand the orientation and geometry of hydraulic fractures. However, with increased wastewater disposal associated with expanded exploitation of unconventional oil and gas reservoirs and pragmatic estimates of subsurface volumes needed for geologic carbon storage the focus has shifted to mitigating felt seismicity or seal integrity monitoring. Yet, all these different goals can be met by adaptive network designs derived from and informed by geological parameters of the monitored reservoir.
Introduction
Microseismic monitoring at oilfield sites has mainly been utilised to monitor and map induced hydraulic fractures, with the objective of characterising vertical fracture growth and stimulated reservoir volume (e.g., Fischer et al., 2007) in order to optimise operational parameters such as pumping schedules, stage spacing and more (e.g., Maxwell, 2014). Meeting these goals requires the detection of weak microseismic events. Thus, preferred monitoring networks consisted of downhole geophone arrays with high signal-to-noise seismic recordings (e.g. Maxwell et al, 2010). Dense surface (or shallow borehole) arrays have subsequently also proven effective at detecting microseismic events (Duncan and Eisner, 2010). With the recent advent of Distributed Acoustic Sensors (DAS) downhole monitoring has become even more common (e.g., Rashid et al., 2025).
In large, mature hydrocarbon reservoirs, microseismic observations can be used to characterise the geomechanical response, particularly with respect to reservoir compaction and subsidence (e.g., Dando et al., 2019). Within the context of subsurface geological fluid storage or disposal (e.g., carbon capture and storage, CCS), microseismic monitoring can be used to detect the upward growth of induced fractures that could pose a potential risk of seal bypass and leakage (Stork et al., 2015).
Furthermore, induced seismicity generally results from fault (re-)activation that can be situated within the reservoir and potentially lead to vertical growth associated with seal bypass, leakage, and even aquifer contamination risk. Such different goals make the monitoring processes more complex since different seismicity levels and location accuracy requirements need different strategies.
As it has become increasingly recognised that subsurface operations can cause induced seismicity felt at surface (e.g., Clarke et al., 2014), a significant objective for microseismic monitoring has shifted to manage and mitigate this risk. This concern has been highlighted as an issue for long-term injections such as wastewater disposal and geologic carbon storage operations (Raleigh et al. 1976; Zoback and Gorelick, 2012; Stork et al., 2015). Where induced seismicity is felt by the public, it is a source of social concern and nuisance, and in some cases induced seismicity has reached damaging levels (e.g., Lee et al., 2019). Microseismic observations are a vital input for induced seismicity hazard assessment and mitigation. For example, microseismic observations can show where geomechanical perturbations are beginning to reactivate larger faults (Wessels et al., 2011; Kettlety et al., 2019), and can be used to populate statistical models that forecast upcoming event magnitudes (e.g., Verdon and Eisner, 2024).
Subject to different monitoring objectives – such as detecting vertical fracture growth and potential fluid leakage risks or managing induced seismicity hazards – an operator may need to detect different seismicity levels, and locate events with differing degrees of accuracy. To date seismicity detection thresholds are set arbitrarily often guided by subjective choices related to political sensitivity to energy operations, the nature of the rocks at the earthquake hypocentre, and the response of infrastructure at the surface. For example, traffic light systems imposed for hydraulic fracturing monitoring differ by 2-3 orders of magnitude between the United Kingdom and Canada (Verdon and Bommer, 2021). Because of the relationship between fault slip area size and earthquake magnitude, the majority of larger earthquakes involve faults that extend into the crystalline basement. Induced seismicity in sedimentary formations where faulting does not extend into the basement, for example, the Delaware Basin in Texas (Zoback and Henning, 2025, Verdon and Schultz, 2026), has vastly different implications for seismic hazard and reservoir containment.
1 Seismik s.r.o. | 2 University of Bristol | 3 Texas A&M University | 4 King Abdullah University of Science and Technology
* Corresponding author, E-mail: leo.eisner@seismik.cz
DOI: 10.3997/1365-2397.fb2026020
Here we extend the concept of monitoring these different classes of events and propose objective-based monitoring criteria.
The above discussion outlines the need for advanced and adaptive monitoring systems that have the capability to monitor different types of induced microseismicity – as required by operations planned and governed by subsurface settings. Thus, monitoring strategies, network design, and related event detection criteria will be constrained by the depth intervals of interest as well as layer thicknesses. This raises the question as to what these different monitoring criteria and performances should be? Apart from the event size, a microseismic monitoring network must be designed such that its vertical resolution can reliably differentiate between (micro-)seismic events occurring along crystalline basement faults and faults in overlying strata that do not extend into the basement. We propose that network design and monitoring criteria are driven by the thicknesses of the target formation, the overlying seal as well as underburden. Eisner et al. (2025) provide an example for monitoring CO2 containment and how network design is influenced by fault dimensions of the monitored induced events. Here, we extend this concept and generalise it for microseismic monitoring in general. The criteria based on this proposed methodology for monitoring network design needs to provide information that can be used to meet the targets like mitigation if the risk is associated with the different rock formations and thicknesses.
• The seal – it is critical to record seismicity that has a potential to compromise seal integrity. If the size of an activated fault (patch) is comparable to the vertical thickness of the seal it should signal a need for additional analysis of the cause of such seismicity. Sufficient vertical resolution is critical to determine whether the event occurs within the seal
• The reservoir – Analogously to the seal, reactivation of faults may increase their transmissivity and potentially provide pathways out, both into the top seal and the underburden. The monitoring design should be able to identify induced seismicity that indicates that the length of reactivated faults exceeds reservoir thickness, to minimise the potential to breach the overlying seal, or for felt seismicity to occur in underlying formations increases.
• The basement/underburden – In areas where basement-rooted faults can have hydraulic connection to the injection reservoir, prevention of induced felt and damaging seismicity is a critical component of the monitoring design. The capability to mitigate large events is primarily driven by our ability to predict the size of the triggered/induced earthquakes occurring on basement faults (e.g., Verdon and Eisner 2024).
Current TLS systems generally address only the third point. Induced seismicity also provides crucial information to assess containment risk which might be indicated below the ’felt’ threshold. Thus, in cases where loss of seal integrity is identified as a potential risk, there is a need to augment such monitoring criteria with the ability to detect induced seismicity with smaller magnitudes presumed to occur in the reservoir and the seal above.
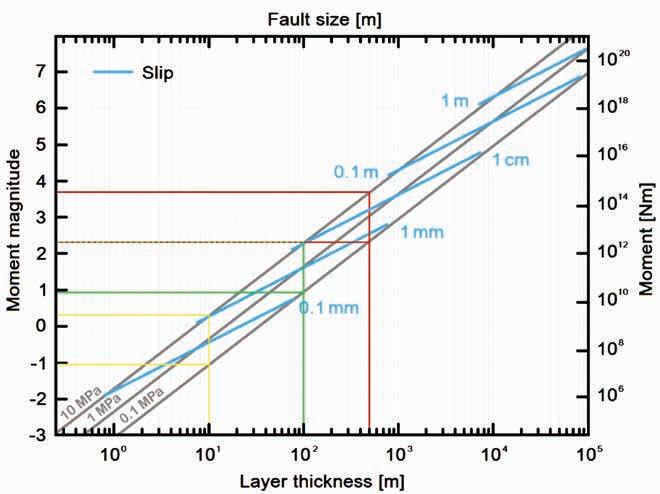
Figure 1 Moment magnitude criteria for seismic monitoring as a function of layer thickness. Modified from (Zoback and Gorelick 2012). The diagonal lines represent the bounds on possible stress drop values of induced seismicity representing the uncertainty in the stress drop (or magnitude-fault dimension) values. The yellow, green and red lines illutrate the method of determination of magnitude levels for layer thicknesses of 10 m, 100 m and 500 m, respectively.
To convert the above limits of the fault sizes to magnitude criteria, we can use empirical relationships between earthquake magnitude and fault size (with uncertainty of stress drop as illustrated in Figure 1) as published by Tomic et al. (2009) and Zoback and Gorelick (2012). For example, if a formation had a thickness of 100 m, an event with magnitude between 1.0 and 2.3 would (if located in the centre of this layer) represent a rupture running though the entirety of this formation. These values were determined from Figure 1 using the relationship between magnitude and event slip patch radius. Note that this determination accounts for uncertainty associated with the stress drop values of induced seismicity. Similarly, if a formation had a thickness of 500 m, an event with magnitude between 2.3 and 3.8 would (if located in the centre of this layer) represent a rupture across the entire formation thickness. Finally, if our formation has only 10 m thickness, we need to detect events with moment magnitudes between -1 and 0 to characterise events that have the potential to rupture such a thin formation.
Based on the above, the approach to monitoring should follow these three general steps: (i) identify the risk (and is the risk of sufficient concern to be worth addressing), (ii) understand what observations are required to manage the risk, and (iii) develop a monitoring system that is capable of giving you the required observations. Thus, in this context we propose three ways that microseismic monitoring arrays may be adapted and designed: (i) sparse array of surface stations with limited detection for events, (ii) shallow borehole arrays with improved detectability but higher cost, and (iii) deep borehole monitoring arrays with excellent detectability in close proximity but rapid lateral decay away from the monitoring borehole and high cost. Offshore monitoring options are limited to dense ocean floor arrays usually also used for Life of the Field 4D monitoring or deep DAS/geophone instrumented borehole. The choice between these three methods and their design need to be modelled and then compared with
required performance (e.g. Jechumtalova et al., 2025). General advantages and drawbacks of each type of the monitoring array are known but need to be adapted to local geologic conditions (layer thicknesses etc.). Note that the network must be capable of distinguishing event depths at least to determine whether detected seismicity is strata-bound within the reservoir and top seal or deeper in crystalline basement. This requires an accurate velocity model, which is a non-trivial challenge to build. However, this challenge is reduced if the microseismic monitoring network is adequately designed. For example, the downhole array may be installed both above and below the monitored formation.
We propose a novel advanced seismic monitoring strategy where a fit for purpose monitoring network is designed to detect seismic events of different magnitudes in different layers across the monitoring area. The implication of this concept is that this network needs to be able to locate seismic event with sufficient accuracy (mainly depth) to differentiate between strata-bound and crystalline basement events. In addition, it is adapted to local geologic settings such that it can detect event sizes corresponding to site-specific layer thicknesses for the monitored strata.
Acknowledgements
The authors are grateful to King Abdullah University of Science and Technology for sponsoring this study under research grant ORA-CRG2021-4671.
References
Clarke, H., Eisner, L., Styles, P. and Turner, P. [2014]. Felt seismicity associated with shale gas hydraulic fracturing: The first documented example in Europe. Geophys. Res. Lett., 41, 8308–8314, doi:10.1002/2014GL062047.
Dando, B.D.E., Oye, V., Näsholm, S.P., Zühlsdorff, L., Kühn, D. and Wuestefeld, A. [2019]. Complexity in microseismic phase identification: full waveform modelling, traveltime computations and implications for event locations within the Groningen gas field. Geophysical Journal International, 217, 620-649.
Duncan, P. and Eisner L. [2010]. Reservoir characterization using surface microseismic monitoring. Geophysics, 75(5), 75A139-75A146, doi: 10.1190/1.3467760.
Eisner, L., Verdon, J., Williams-Stroud, S.C., Jechumtálová, Z., Waheed, U.b. and Finkbeiner, T. [2025]. Seismic monitoring for CO2 sequestration – a new advanced strategy. Geophysical Prospecting, 73(6), Research Note, e70042. https://doi.org/10.1111/1365-2478.70042.
Fischer, T., Hainzl, S., Eisner, L., Shapiro, S.A. and Le Calvez, J., [2008]. Microseismic signatures of hydraulic fracture growth in sediment formations: Observations and modeling. Journal of Geophysical Research, 113, B02307 DOI:10.1029/2007JB005070.
Jechumtálová, Z., Eisner, L., Buchem, F. and Finkbeiner, T. [2025]. Optimization of passive seismic monitoring network for CO2 sequestration in Saudi Arabia. International Journal of Greenhouse Gas Control, 146, 104416, https://doi.org/10.1016/j.ijggc.2025.104416.
Kettlety, T., Verdon, J.P., Werner, M.J., Kendall, J-M. and Budge, J. [2019]. Investigating the role of elastostatic stress transfer during hydraulic fracturing-induced fault activation. Geophysical Journal International, 217, 1200-1216.
Lee, K.K., Ellsworth, W.L., Giardini, D., Townend, J., Ge, S., Shimamoto, T., Yeo, I.-W., Kang, T.-S., Rhie, J., Sheen, D-H., Chang, C., Woo, J.-U. and Langenbruch, C. [2019]. Managing injection-induced seismic risks. Science, 364(6442), 730–732.
Maxwell, S.C. [2014]. Microseismic Imaging of Hydraulic Fracturing: Improved Engineering of Unconventional Shale Reservoirs. SEG Distinquished Instructor Series, 17. https://doi.org/10.1190/1.9781560803164.
Maxwell, S.C., Rutledge, J., Jones, and Fehler, M. [2010]. Petroleum reservoir characterization using downhole microseismic monitoring. Geophysics, 75(5): 75A129–75A137. https://doi.org/10.1190/1.3477966. Raleigh, C., Healy, J. and Bredehoeft, J. [1976]. An Experiment in Earthquake Control at Rangely, Colorado. Science, 191, 1230-7. https://doi.org/10.1126/science.191.4233.1230
Rashid, A., Tackie-Otoo, B.N., Abdul Latiff, A.H., Otchere, D.A., Jamaludin, S.N.F. and Asfha, D.T. [2025]. Research Advances on Distributed Acoustic Sensing Technology for Seismology. Photonics, 12, 196. https://doi.org/10.3390/photonics12030196.
Stork, A.L., Verdon, J.P. and Kendall, J-M. [2015]. The microseismic response at the In Salah Carbon Capture and Storage (CCS) site, International Journal of Greenhouse Gas Control, 32, 159-171. Tomic, J., Abercrombie, R. and do Nascimento, A. [2009]. Source parameters and rupture velocity of small M ≤ 2.1 reservoir induced earthquakes. Geophysical Journal International, 179(2), 1013-1023. https://doi.org/10.1111/j.1365-246X.2009.04233.x.
Verdon, J.P. and Bommer, J.J. [2021]. Green, yellow, red, or out of the blue? An assessment of Traffic Light Schemes to mitigate the impact of hydraulic fracturing-induced seismicity. Journal of Seismology, 25, 301-326. https://doi.org/10.1007/s10950-020-09966-9.
Verdon, J.P. and Eisner, L. [2024]. An Empirically Constrained Forecasting Strategy for Induced Earthquake Magnitudes Using Extreme Value Theory. Seismological Research Letters, 95(6), 3278-3294, https://doi.org/10.1785/0220240061.
Verdon, J.P. and Schultz, R. [2026]. Induced earthquakes in the southern Delaware Basin, Texas, are bound by a geomechanically controlled maximum magnitude. Geophysical Research Letters, 53, e2025GL117419.
Wessels, S.A., De La Peña, A., Kratz, M., Williams-Stroud, S. and Jbeili, T. [2011]. Identifying faults and fractures in unconventional reservoirs through microseismic monitoring. First Break, 29, 99-104.
Zoback, M.D. and Gorelick, S.M. [2012]. Earthquake triggering and large-scale geologic storage of carbon dioxide. Proceeding of National Academy of Science, 109(26), 10164-10168, https://doi.org/10.1073/pnas.1508533112.
Zoback, M.D. and Hennings, P. [2025]. Implications of earthquakes triggered by massive injection of produced water in saline aquifers for large-scale geologic storage of CO2. International Journal of Greenhouse Gas Control, 146, 104447. https://doi.org/10.1016/j. ijggc.2025.104447.


11-13 MAY 2026


First EAGE/ALNAFT Workshop – Unlocking Hydrocarbon Potential of West Mediterranean Offshore Frontier Basin of Algeria
Second EAGE/ALNAFT Workshop on Techniques of Recovery of Mature Fields and Tight Reservoirs


Ruud Weijermars1* and Gregg Williams2** report on a fast, analytical Gaussian simulator that enables direct well rate forecasting and inverse estimation of fracture half-length and reservoir properties without relying on finite-difference methods.
Abstract
Industry practice for forecasting production rates of oil and gas wells is traditionally split between complex, physics-based simulators and empirical decline-curve analysis (DCA). Recently developed digital permeability twins coupled with closed-form Gaussian production models bridge the gap by offering a fast, physics-based alternative that avoids the over-parameterisation of numerical simulators while staying clear of the oversimplifications typical for purely empirical DCA approaches. Onshore and offshore case studies show that robust, production forecasts, well-design optimisation, and SPE compliant reserves classification can be achieved prior to drilling or history-matching limited production data (as little as one month). Applicable across diverse well and reservoir systems, fast decision-making is enabled through probabilistic well-performance forecasting, real-time and pre-drilling, while accurately representing the uncertainty in available data. Gaussian well-performance and resource evaluation thus provides a powerful new option for production analysis and reserves estimation under uncertainty, supporting optimisation efforts and enabling faster field-development decision-making without comprising accuracy.
Introduction
Accurate prediction of well production rates over the full economic field-life remains one of the central challenges in both onshore and offshore field development. Decisions made at the pre-drill and early production stages — often under substantial uncertainty in reservoir and fracture properties — have long-lasting consequences for reserves estimation, capital allocation, and completion design. Despite major advances in numerical simulation, first-pass forecasts frequently fail to predict realised well performance (Hu et al., 2018). This forces operators to rely on iterative calibration of empirical decline-curve fitting, which is only possible post-drilling – and after actual well-rate data become available for a longer production period (6-18 months). This persistent forecasting gap is not merely a data problem; it is a methodological one. Many existing approaches for plausible forecasts either demand a level of detailed subsurface
parameter resolution that is unavailable at early project stages, or resort to oversimplification of the reservoir and well system physics to such a degree that predictive insight is lost. As a result, uncertainty is often managed retrospectively rather than proactively (Bratvold and Begg, 2010). Smaller operators, in particular, frequently bypass pre-drilling reservoir and fracture modelling altogether, relying instead on DCA matches of early production data to generate reportable reserves and drainage-area estimates. While pragmatic, this approach effectively treats production performance as an empirical outcome rather than a consequence of well-understood completion design and reservoir management. When attempts to assess the impact of reservoir variables prior to drilling are largely abandoned, completion design optimisation becomes a potentially costly afterthought.
Current industry practice utilises a wide spectrum of possible modelling steps and tools to abstract certain key information for field development decisions (Table 1). At one end are highly detailed, physics-based fracture and reservoir simulators (Yu et al., 2018; Chen et al., 2021). Such models require extensive input data, and involve both disclosed and undisclosed simplifications. Only after production begins, it will emerge how far off was the pre-drill forecast, which limits their usefulness for pre-drill decision-making. At the other end are purely phenomenological DCA methods (Hu et al., 2018; Manda and Nkazi, 2020), which can be applied rapidly, but these provide limited physical insight; DCA is not giving guidance on how well and fracture spacing changes might influence well performance outcomes. Diagnostic fracture injection tests (DFIT; Al-Shaikh and Weijermars, 2025), pressure transient analysis (PTA; Ibrahim and Weijermars, 2023), and rate transient analyses (RTA; Alvayed et al., 2023) provide additional methods to reduce uncertainty in reservoir properties after a well has been drilled.
To close the gap between sophisticated numerical simulators and empirical forecasting methods, a class of lean, yet physics-based, Gaussian modelling tools have emerged in recent years (Afagwu et al., 2023, 2024). Grounded in closed-form solutions of the pressure diffusion equation (Crank, 1975; Weijermars, 2022; Weijermars and Afagwu, 2024), these models focus on the invariant physics governing pressure depletion, fracture
1 King Fahd University of Petroleum & Minerals, KFUPM | 2 GaussianWellWorks Corresponding authors, E-mail: * Ruud.Weijermars@kfupm.edu.sa | ** GW@GaussianWellWorks.com DOI: 10.3997/1365-2397.fb2026021
A. Completion engineering
1. Hydraulic fracture ->design
Well completion plan
Number of stages
Number of perforation clusters
Perforation phasing
Proppant schedule
2. Modeling fracturing -> predict outcomes
- Fracture half-lengths
- Fracture conductivity
- Degrees of stress shadowing
B. Production engineering
1. Well performance ->optimisation
Daily well-rate forecasts
Transient-flow period
Decline rate
Onset boundary-dominated flow
Rate of pressure depletion in reservoir
Selection artificial lift system
C. Reserves Estimation
- Cumulative production
- Probabilistic resource classification
- P90 – P50 – P10 reserves
- Reserves replacement ratio
D. Economic appraisal
- Discounted cash flow analysis (DCFA)
- Reserves-based lending
- Final investment decision
A. Assess completion quality
- Check fracture-half lengths
- Reduce uncertainty reservoir parameters
- DCA, DFIT, RTA, PTA
- Check pressure loss in fractures
- Proppant strength tests & efficacy
- Fracture half-length per stage
- Revisit fracture simulator(s)
- Update fracture half-length
- Update fracture conductivity
- Reduce uncertainty
B. Assess production performance
- Collect daily well rates
- Establish peak-rate production
- History-match early well rates
- Rerun well rate forecasts
- Establish skin factor
- Reduce uncertainty
- Adjust choke settings & Lift system
C. Reserves Estimation
- Update P90 – P50 – P10 reserves
- Reduce uncertainty
- Overhaul the next well plan
- Optimise completion schedule
D. Economic appraisal
- Update DCFA
- Forward drilling plan adjustments
- Final investment decision new wells
interference, and flow regime transitions for specific well and fracture configurations (Tian and Weijermars, 2025).
Accurate forecasting and history matching of daily production rates, using a minimal but physically meaningful set of input parameters, make the Gaussian method particularly well-suited for early-stage decision support, scenario testing, and comparison of well completion strategies. The model has been successfully applied to forecast both unconventional (Weijermars, 2023) and conventional well performance (Al-Raeeni et al., 2026). The simulator can predict production from multi-fractured wells using user-defined fracture geometry, reservoir and fluid properties, hydraulic diffusivity, and bottom-hole pressure. The method is computationally efficient because it can be implemented in a spreadsheet environment. The simulator also enables history matching and inverse estimation of uncertain parameters, including effective fracture half-length and reservoir permeability (Ibrahim and Weijermars, 2023); it allows quantification of production losses or gains relative to changes in engineering designs of the production system.
This study demonstrates the practical value of the new methodology for modelling well production rates throughout the field life. Two case studies — one onshore and one offshore — are presented to illustrate the predictive capability of the approach. The models were evaluated to demonstrate: (1) accurate predictions of the daily well-rates and history matches; accurate forecasts of the long-term well-performance, and (2) ability of pre-drill well rate predictions primarily through permeability-based transforms, supplemented (when available) with PVT and core data.
Table 1 Variety of modeling steps and stages and what operators hope to learn from them to arrive at better operational decisions regarding well performance, pre-drilling and post-drilling.
That specific Bakken study well was selected because of vast data being availed by the operator. Drilled in 2011, cores and fluid taken from the well were extensively characterised in specialised laboratory tests, based on which the well was finally completed in October 2012. The well was landed in the Middle Bakken (Devonian), which comprises calcareous sandstone and siltstone; the shale play naming of the Bakken Formation serves mainly a commercial purpose – banks easily understand that ‘shale’ produces oil and gas. Located in Dunn County, North Dakota, the well is produced with a 4 1/2” liner hanged in a 7” cased vertical section; open hole completion was used in the horizontal lateral (Figure 1a). The well was fracked with a FracPort system using hydraulic swell packers, with 300 ft stage length and limited-entry perforation clusters, each phased with six 1/16” perforations; 30 frac stages were completed.
The net thickness of the production zone in the area is assumed to be 70 ft, with comingled production from the Three Forks and Middle Bakken Formations (Weijermars et al., 2017). Average horizontal spacing of the laterals is 1280 ft (Figure 1b). The subsequent 13-years (Nov 2012-Oct 2025) of cumulative production of oil and gas for this well is also known. Total acid number (TAN) of the produced oil is very low (TAN = 0.09 mg KOH/g), which classifies as sweet crude, because it’s low in sulphur (≈ 0.15 wt%) and light (39°API gravity). The light sweet crude coproduces associated natural gas; the long-term average solution gas-oil ratio (GOR) is 1297 scf/stb, computed from the 13-year cumulative
production ratio (723,405 mcf gas and 558,027 stb oil). The formation volume factor for the gas fraction is 0.006 rbbl/scf, and for the oil fraction it is 1.262 rbbl/stb.
The production forecast analysis starts with a cross-plot of laboratory measurements on cores of porosity-permeability (ϕ,k)-data pairs (Figure 2a). From the limited data pairs of the core measurements, a fuller digital twin of the reservoir space
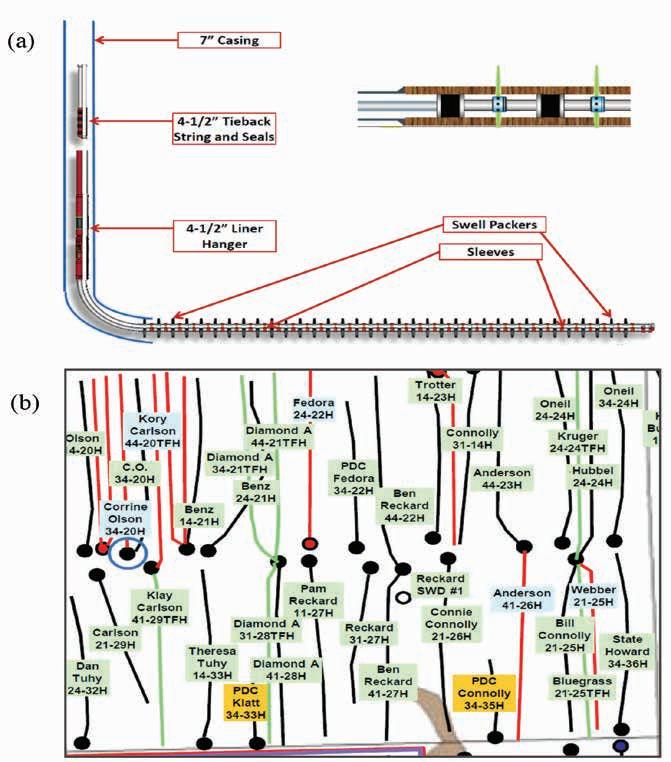
Figure 1 (a) Well design characteristics, with inset image showing hydraulic swell packers used for fracturing treatment. (b) Well spacing map with study well 34-20H location circled in blue; black dots are well-pad locations from where the wells were drilled. Open dot is water-disposal well. Red trajectories are landed in Three Forks Formation and black trajectories are Middle Bakken laterals. North is up.
was rendered (Figure 2b), showing a denser set of synthetic porosity-permeability data pairs, generated using a physics-based procedure (Weijermars, 2025a). The digital twin method utilises the variability in pore throat radii from core samples (Figure 2c), and porosity and permeability distributions of the primary data (Figure 2d). The porosity-permeability transform acts as the reservoir characterisation model and was exported to the Monte-Carlo simulation of the production data. Although the Gaussian well simulation method has been under intensive development for over half a decade, it was not until the invention of the digital twin construction, truthfully representing the reservoir permeability variability, that the real power of the simulator could be unlocked.
The Gaussian pressure transient equations (Weijermars, 2022) are fundamentally different from conventional pressure- and rate-transient analysis formulations (Ramey, 1976), which require well rates as inputs and therefore cannot be directly used for forward rate forecasting. It would require incremental adjustments of the well rate and time-stepped integration, which is sometimes applied in nodal analysis models (Jansen, 2018). Avoiding such concatenated incremental analysis, the Gaussian solution also compares favourably to fast marching (Nandlal et al., 2020) and other grid-based diffusivity solution methods. The Gaussian approach is more accurate, computationally efficient, and readily deployable in spreadsheet applications. The cumulative production from a certain shale acreage position, produced with hydraulically fractured well systems, can be effectively computed from the following Gaussian equation (Weijermars, 2025b):
P0 is the initial reservoir pressure and PBH is the imposed bottomhole pressure in the well system, and the hydraulic fractures are assumed to be parallel to the y-axis and spaced at xf. The effective fracture height hf is assumed to be equal to the net pay thickness.
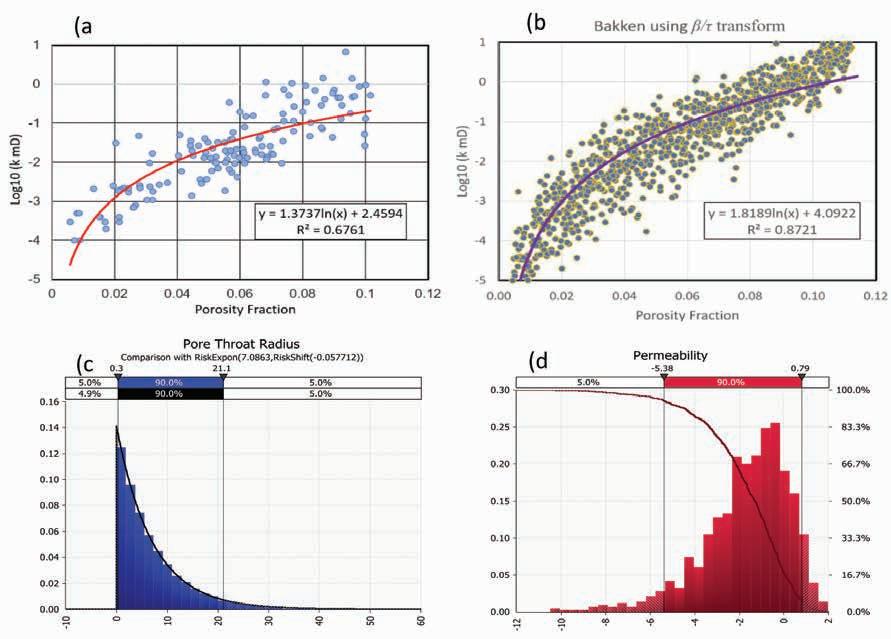
Figure 2 (a) Orignal permeability transform of 138 measured porosity-permeability (ϕ,k)-pairs provided by company. (b) Digital twin of the reservoir space comprised of 1000 synthetic (ϕ,k)-pairs. (c) Porethroat radii distribution used in the construction of the digital twin. Logarithmic regression curves in (a) and (b) differ because the augmented data set in (b) uses a larger number of data, with an improved coefficient of determination, R2 =0.87 versus 0.68 in (a). (d) Probability distribution of reservoir permeability.
The fracture half-length is yf and the number of hydraulic fractures is given by n. The Euler-Macheroni constant g can be approximated by 0.5772156649. The hydraulic diffusivity contains the classic reservoir parameters, as follows (Zimmerman, 2018):
with permeability, k, porosity, ϕ, fluid viscosity, μ, and total compressibility, c t , given by c t=(1-ϕ)crock+ϕcfluid. Conversion factors need to be applied when working in field units rather than metric units.
The daily well rates can be obtained from (Tian and Weijermars, 2025): (3)
The Gaussian equations employed in this simulator are fundamentally different from analytical solutions traditionally used in well testing, petroleum engineering, and groundwater flow literature. Conventional pressure-transient equations require both pressure and well rate as input variables, which prevents their use for well rate forecasting. Their primary purpose is to estimate uncertain reservoir properties — such as permeability and fracture dimensions — using rate transient analysis (RTA) or pressure transient analysis (PTA). The Gaussian pressure transient (GPT) equations do not require prescribed well rates as inputs and are therefore uniquely suited for forward well rate prediction. This distinguishes GPT-solutions from prior RTA and PTA formulations. Separately, fracture half-length estimations from PTA have been calibrated against independent estimations using GPT, with respective estimations differing less than 10% (Ibrahim and Weijermars, 2023).
Another class of analytical approaches involves diffusivity-based fast marching methods (FMM), which solve pressure transients by assuming a radius of investigation governed by the solution of the eikonal equation (Nandlal et al., 2020). Such methods require the definition of multiple grid cells, are computationally more complex, less accurate, and unsuitable for rapid spreadsheet implementation. The Gaussian method avoids these limitations entirely, enabling fast, accurate, and user-friendly well performance forecasts.
Well-performance evaluation results
Using the probabilistic (ϕ,k) pairs generated analytically for the Bakken shale (Figure 2), and computing Dh from primary values
Table 2 Key inputs for probabilistic production forecasting and reserves estimation for Bakken study well. Field units are used as is customary for US operators.
as detailed in Equation (2), the 13-year cumulative production was computed (Figure 3a) for the 300 ft fracture spacing. The key inputs used for reservoir parameters and well design parameters are given in Table 2. The probabilistic classification of P90-P50-P10 reserves using the SPE Petroleum Resource Management System (PRMS, 2022), shows the advantage of drilling in high permeability sweet-spot regions of the basin and its individual benches. The permeability distribution of Figure 2d was used to model P10-P50-P90 cumulative production curves. The P10 curve is for the higher permeability region (2.68 mD), and the P90 curve is for the lower permeability zones (1.82x10⁻⁴ mD). The P50 permeability (5.02x10⁻² mD), representing the most likely case, was used to history match the actual cumulative production of 558 Mbbls (Figure 3a).
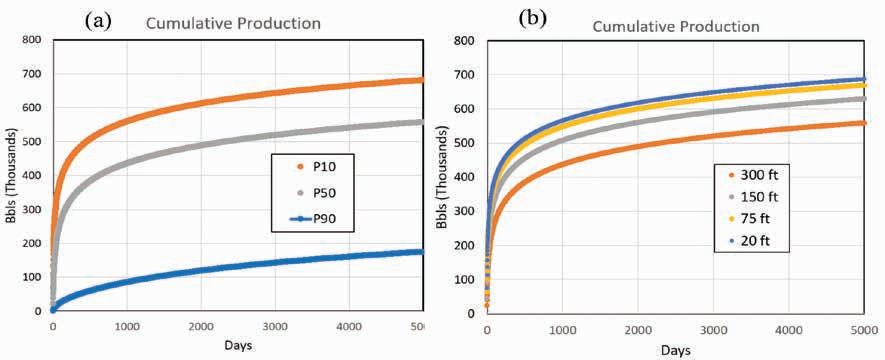
Figure 3 (a) Cumulative production forecast with various permeability values: P10 for 2.68 mD, P50 for 5.02x10 -2 mD, and P90 for 1.82x10 -4 mD. (b) Taking the P50 case, the cumulative production will improve when fracture spacing is reduced (from 300 ft, 150 ft, 75 ft to 20 ft).
Changing the fracture spacing from 300 ft to 150, 75 and 20 ft for the P50 case improves the cumulative production but gains become progressively smaller (Figure 3b). In the relatively high permeability zones, extreme fracture down-spacing to 20 ft would not be necessary, as hardly any production gains will be made compared to the well performance with 75 ft spacing completion. The associated gas production can be quantified for all cases, using the gas-oil ratio (GOR, Table 2), but was not included due to length constraints of this article. Variable pressure-losses in the fracture system due to proppant-type used was neglected in the present study, but may be included if deemed of interest for production optimisation (Weijermars, 2025b).
The second case study is based on a collaboration in a pilot project with a Norwegian upstream independent. The well was landed in the Tarbert Formation, which is a tight sandstone of the Brent Group cored offshore on the Norwegian Continental Shelf (NCS). For comparison of the permeability range typical for clastic facies of the Bakken and the Tarbert Formations, Figure 4 shows a key suite of (ϕ,k) data for seven formations selected from a larger, proprietary database. What emerges is that the Tarbert
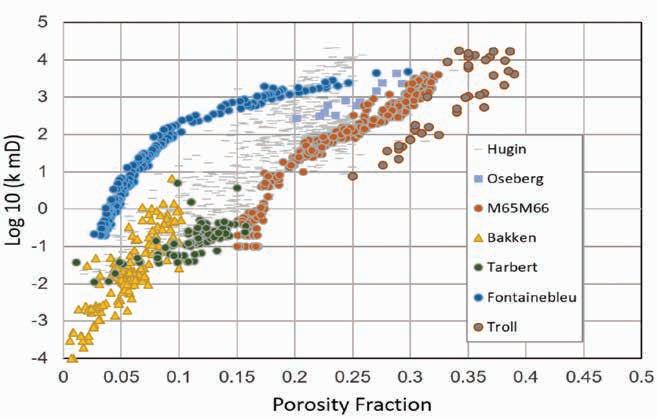
Figure 4 Porosity-permeability transforms for six conventional sandstone formations and one onshore shale formation (Bakken). M65M66 is Miocene sandstone from the Horn Mountain Field in the Gulf of Mexico. The Fontainebleau sandstone from the Paris Basin (France) is included as it accentuates the upper permeability limit for a pure quartz sandstone with impaired permeability correlating with lower porosity due to diagenetic compaction and mineral alterations, which reduces the pore connectivity. The Tarbert, Hugin, Oseberg and Troll Formations occur in the Viking Graben (Norwegian Continental Shelf); their permeability spread is a result of pore connectivity variability due to the combined effects of depositional facies and diagenetic compaction (see Weijermars, 2025a). The Bakken, often referred to as a shale formation, is actually a calcareous tight sandstone with silty intercalations, as appears from detailed petrology descriptions of core samples by the company that provided the Bakken data.
sandstone samples occupy the lower permeability region of the transform field typically for conventional sandstone reservoirs. A comprehensive analysis of porosity-permeability transforms was provided in a prior study (Weijermars, 2025a).
What is further essential here is that the low permeability of the Tarbert sandstone in the satellite field of the NCS study region would be uneconomic if developed without hydraulic fracturing stimulation. A study was completed to examine whether fracturing could sufficiently increase the well performance in the relatively small reservoir domain. There also was a shared surface facility processing capacity constraint imposing a cap-rate of 18,000 Mcf/day. Essentially, the same workflow steps as in Case study 1 were applied: (1) Permeability transform construction for reservoir characterisation, (2) Probabilistic production forecast and resources volume estimations using as input the digital permeability twin of the reservoir.
Reservoir characterization
Digital twin construction followed a similar procedure as for Case study 1. In the case of the Tarbert, only 79 (ϕ,k)-pairs were measured on the core samples (Figure 5a), which were augmented into a digital twin more comprehensively showing the (ϕ,k)-variability in the reservoir space using 500 synthetic data-pairs generated with Monte-Carlo simulation (Figure 5b). The Tarbert reservoir is a retrograde gas-condensate reservoir, which can be analysed with the Gaussian method using appropriate conversions. The key input parameters in Table 3 are given in both SI units typical for European operators, and field units. The production forecasts are given in field units for quick comparison with typical shale gas condensate well performance onshore.
Well-performance evaluation results
The Gaussian gas production forecasts (daily rates and cumulative production) are given in Figure 6a,b. The associate condensate production could be computed using the condensate-gas ratio, but is not shown here due to space limitation. Unlike the Bakken study, where production could be validated against the actual cumulative production data, the Tarbert discovery is still under study and has not been developed as of the present-day. However, an independent Eclipse study (Afagwu and Weijermars, 2024) largely validates the Gaussian forecast (Figure 6c,d).
The probabilistic P90-P50-P10 cumulative production of the field, with cap rate imposed, can be estimated using the digital twin inputs of Figure 5b. The Monte-Carlo simulation output is given in Figure 7. The 5000-days cumulative EUR P90, P50, P10, and Mode values for both the capped well-rate scenarios,
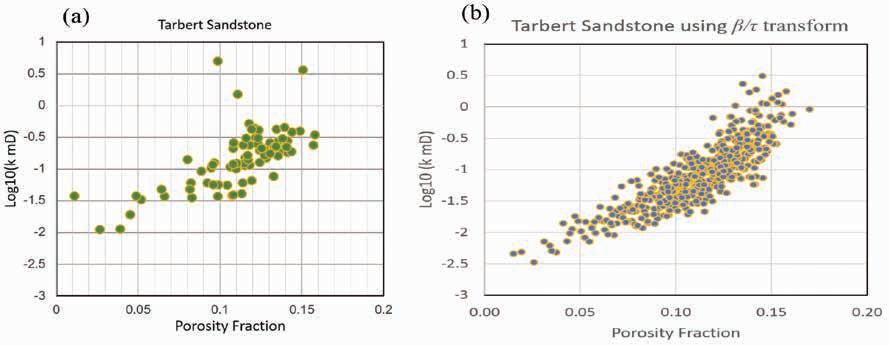
Figure 5 (a) Empirical data from laboratory measurements of 79 (f,k)-pairs on core samples. (b) Regenerated porosity-permeability transform for Tarbert Sandstone using 500 iterations in a specialised Monte-Carlo simulation procedure.
Table 3 Key inputs for probabilistic production forecasting and reserves estimation for Tarbert discovery. In this case, both metric and field units are given, as European operators use SI units rather than field units.
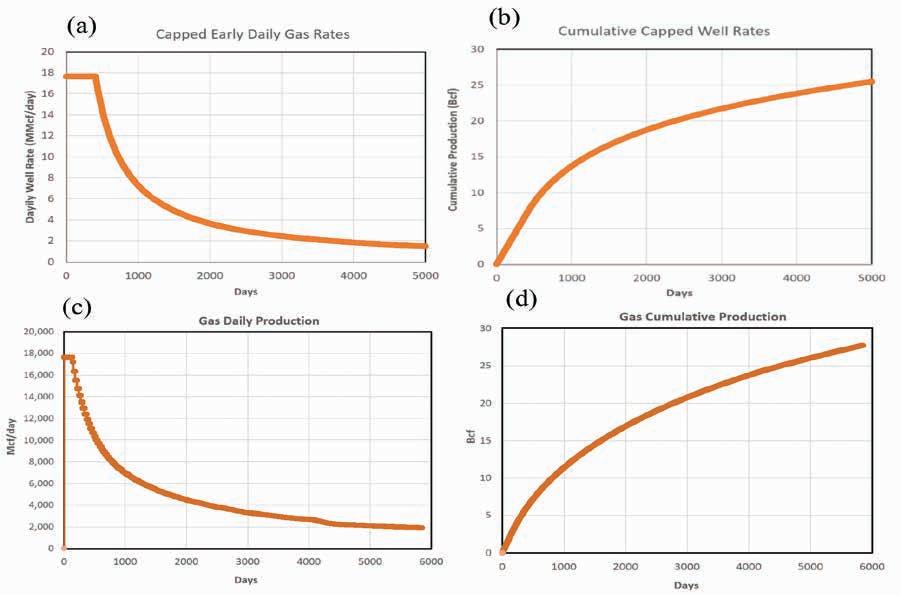
and uniform well completion with four hydraulic fractures of 80 m half-length at 330 m fracture spacing are listed in Table 4. Due to the relatively low permeability, the reservoir section of the Tarbert discovery cannot be produced fast; it will take about 15 years to drain the reservoir (Figure 6). The resource volume in Table 3 are for an assumed 13-year (~5000 days) economic field-life, as evident from the production curves in Figures 6a-d. The anticipated forward gas and condensate product prices over this time period, considering the capital cost of development and operating expenses, will reveal when rates of return on
Figure 6 Top Row: Gaussian well forecasts with production-system rate-constraints and multifractured well completion: (a) Daily gas production rate (in million cubic feet/day) with imposed facility cap rate of 18,000 MMcf/day. (b) Cumulative production (in billion cubic feet). Bottom Row: Eclipse simulation. (c) Daily gas production rate (in 1000 cubic feet/day), also with imposed cap rate. (b) Cumulative production.
investment exceed the hurdle rate of the company holding the asset. The potential development of the Tarbert asset is still under study. Coupling of the production curve with a financial module of discounted cash flow analysis allows for rapid iteration of economic viability (using IRR and NPV as KPIs) for a range of discount rates/cost of capital.
Prior analyses, involving detailed pre- and post-drilling history matches on nearly a hundred wells from different hydrocarbon
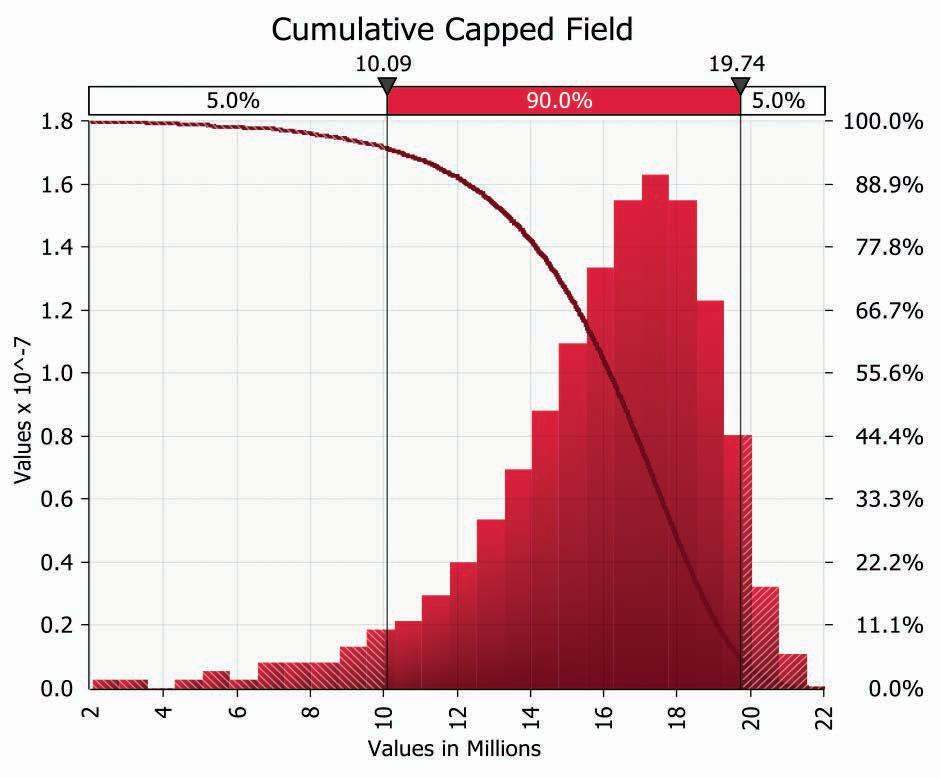
Figure 7 Estimated 5000-days cumulative production for capped well-rate case. EUR values on horizontal scale are in bcf (billions, here given in millions of input values in 1000 cf (Mcf). The descending curve superposed on the plot is the decumulative production distribution.
basins around the world (Weijermars and Afagwu, 2022; Alvayed et al., 2023; Pratama et al., 2023) have revealed that the Gaussian methodology is robust. By bridging the gap between numerical simulation and empirical decline methods, the methodology presented here and summarised in the workflow diagram of Figure 8 offers a pragmatic, physics-based approach for production forecasting, reserves estimations, and field development decision-making. The method provides a fast alternative to both over-parameterised simulators and purely phenomenological DCA production forecasts.
Strengths
Key strengths of the Gaussian simulator include the ability to predict full well performance using permeability transforms.
While additional data such as PVT properties and mechanical core laboratory measurements are not strictly required, they are valuable for constraining model inputs and reducing uncertainty. Case Study 1 demonstrated accurate prediction of early peak production rates and robust history matching of an onshore shale well (Bakken Formation, USA). Case Study 2 illustrated the capability to reliably forecast future well performance of an offshore well gas-condensate discovery in a tight sandstone reservoir (Tarbert Formation, Norwegian Continental Shelf).
The Gaussian well performance simulator can inversely estimate well system parameters that commonly remain uncertain after completion. Examples include:
• The number of fractures actively contributing to flow versus the planned number of hydraulic fractures
• The effective fracture half-length versus the designed fracture half-length
• The effective reservoir permeability versus the assumed permeability
Figure 8 provides a typical workflow diagram to be used in conjunction with practical operational field development phases (pre-drilling, post-drilling) and design steps (completion engineering, production engineering) detailed in Table 1.
Although high-resolution commercial and in-house fracture simulation tools are available, excessive reliance on such models is not recommended unless they provide fundamental insights that directly inform changes in completion design. According to our experience, production optimisation rarely is achieved via pre-drilling fracturing simulation. More effective is post-frac analysis of effective perforation coverage (Oshaish and Weijermars, 2023; Weijermars and Oshaish, 2025). Diag-
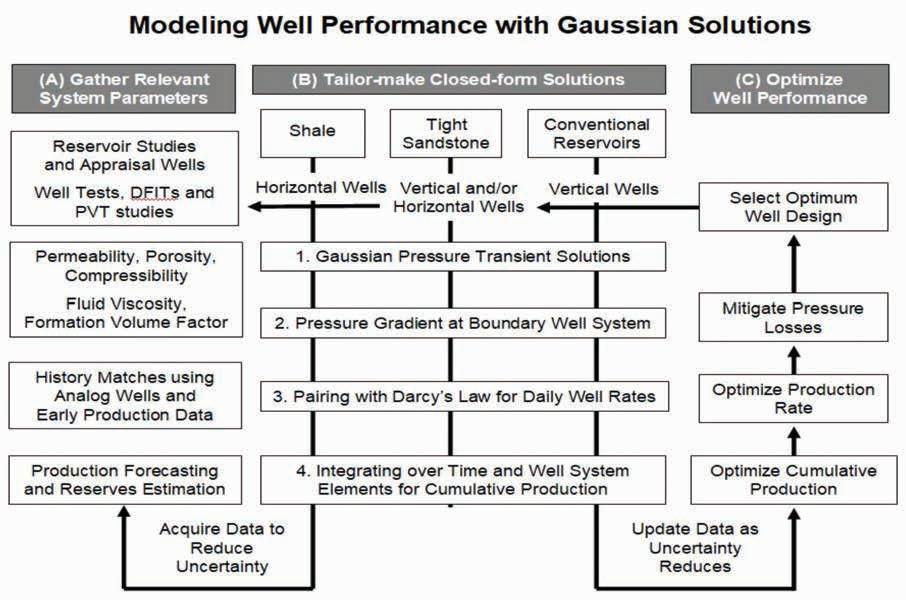
Table 4 Tarbert discovery 5000 days cumulative production P90, P50, P10, and Mode.
Figure 8 Central part of the diagram labelled (B) shows steps 1-4 in the tailor-making of Gaussian Pressure Transients (GPT)-solutions for specific wellsystems, and the iterative process of data gathering (A) required to optimise the well performance (C).
nostics of achieved fracture half-lengths (Ibrahim and Weijermars, 2023) is also very useful for production optimisation of future wells yet to be drilled. Completion with appropriate proppant quality and delivery schedule remain critical to achieving optimal well performance (Weijermars, 2025b). Also, one must avoid fracturing inadvertently into water-saturated benches that may compromise well performance (Nandlal and Weijermars, 2022).
This study demonstrates that Gaussian well-performance simulation combined with digital permeability twins provides a fast, physics-based alternative to both finite-difference reservoir simulators and purely empirical decline-curve analysis. By relying on closed-form solutions to the pressure diffusion equation, the methodology enables direct forward forecasting of daily production rates and cumulative recovery without prescribing well rates or resorting to time-stepped numerical integration.
Application to two contrasting case studies — an onshore Bakken shale oil well and an offshore Tarbert tight gas-condensate discovery — shows that the approach delivers accurate early-time rate predictions, robust history matching with limited production data, and reliable long-term forecasts. In the Bakken case, probabilistic permeability transforms enabled SPE-compliant P90-P50-P10 reserves estimation and successful matching of 13 years of cumulative production using minimal inputs. In the offshore Tarbert case, Gaussian forecasts closely aligned with independent finite-difference Eclipse simulations, while requiring orders-of-magnitude less computation time and model complexity.
A key strength of the methodology is its ability to invert production data to estimate effective fracture half-length, active fracture count, and reservoir permeability — parameters that commonly remain uncertain after completion. This capability allows operators to quantify both production losses associated with suboptimal fracture performance and gains resulting from successful stimulation, directly linking completion design choices to production outcomes.
By bridging the methodological gap between detailed numerical simulation and empirical forecasting, Gaussian well-performance modelling supports rapid decision-making across the full asset life cycle. The approach is particularly well suited for pre-drilling scenario evaluation, early-production history matching, and probabilistic reserves estimation under uncertainty. Its computational efficiency and minimal data requirements make it accessible to both large operators and smaller independents, enabling faster optimisation of completion design, field development planning, and economic appraisal without compromising physical rigour or forecast accuracy.
The authors acknowledge the generous support provided by the College of Petroleum Engineering & Geosciences (CPG) at King Fahd University of Petroleum & Minerals (KFUPM).
Afagwu, C. and Weijermars, R. [2024]. Rapid Well-Test Analysis based on Gaussian Pressure-Transients. Geoenergy Science and Engineering, 241, 213168. https://doi.org/10.1016/j.geoen.2024.213168.
Afagwu, C., Al-Afnan, S., Abdalla, M. and Weijermars, R. [2024]. Gaussian Pressure-Transients: A Toolkit for Production Forecasts and Optimization of Multi-Fractured Well Systems in Shale Formations. Arabian Journal of Science and Engineering, 49, 8895-8918. https://doi.org/10.1007/s13369-024-08921-x.
Afagwu, C., Al-Afnan, S., Weijermars, R. and Mahmoud, M. [2023]. Multiscale and multiphysics production forecasts of shale gas reservoirs: New simulation scheme based on Gaussian pressure transients . Fuel, 336, 127142. https://doi.org/10.1016/j. fuel.2022.127142.
Al-Raeeini, K., Budiman, O. and Weijermars, R. [2025]. Probabilistic CO2 Storage Capacity Appraisal of the Greensand Project in the Depleted Nini Oil Field, Offshore Denmark. Fuel, 413, 138226. https://doi.org/10.1016/j.fuel.2025.138226.
Al-Shaikh, A., and Weijermars, R. [2025]. Fast Analysis Method of Diagnostic Fracture Injection Test Data: Examples from Four Different Shale Formations (Bakken, Three Forks, Wolfcamp, and Eagle Ford). SPE Hydraulic Fracturing Conference 2025, Proceedings, SPE 226622-MS. https://onepetro.org/SPEIHFT/proceedings/25IHFT/25IHFT/D031S008R006/790914.
Alvayed, D., Khalid, M.S.A., Dafaalla, M., Ali, A., Ibrahim, A. and Weijermars, R. [2023]. Probabilistic Estimation of Hydraulic Fracture Half-Lengths: Validating the Gaussian Pressure-Transient Method with the Traditional RTA-Method (Wolfcamp Case Study). Journal of Petroleum Exploration and Production Technology, 13, 2475-2489. https://doi.org/10.1007/s13202-023-01680-9.
Bratvold, R.B. and Begg, S.H. [2010]. Making Good decisions. Society of Petroleum Engineers.
Chen, B., Barbosa, B.R., Sun, Y., Bai, J., Thomas, H.R., Dutko, M., Cottrell, M. and Li, C. [2021]. A review of hydraulic fracturing simulation. Arch. Comput. Methods Eng, 29, 1-58. https://doi. org/10.1007/s11831-021-09653-z.
Crank, J.J. [1975]. The Mathematics of Diffusion (second ed.). Clarendon Press, Oxford.
Hu, Y, Weijermars, R., Zuo, L. and Yu, W. [2018]. Benchmarking EUR Estimates for Hydraulically Fractured Wells With and Without Fracture Hits Using Various DCA Methods. Journal of Petroleum Science and Engineering, 162, 617-632. https://doi.org/10.1016/j. petrol.2017.10.079.
Ibrahim, A. and Weijermars, R. [2023]. Estimation of Fracture HalfLength with Fast Gaussian Pressure Transient and RTA Methods: Wolfcamp Shale Formation Case Study. Journal of Petroleum Exploration and Production Technology, 14, 239-253. https://doi. org/10.1007/s13202-023-01694-3.
Jansen, J.D. [2017]. Nodal Analysis of Oil and Gas Production Systems. Society of Petroleum Engineers Textbook Series.
Manda, P. and Nkazi, D.B. [2020]. The evaluation and sensitivity of decline curve modelling. Energies, 13, 2765. https://doi. org/10.3390/en13112765.
Nandlal, A. and Weijermars, R. [2022]. Shale Well Factory Model Reviewed: Eagle Ford Case Study. Journal of Petroleum Science and Engineering, 212, 110158. https://doi.org/10.1016/j.petrol.2022. 110158.
Nandlal, K., Li, C., Liu, Ch.-H., Chavali, V.B.K., King, M.J. and Weijermars, R. [2020]. Understanding Field Performance of Hydraulically Fractured Wells: Comparison of Pressure Front versus Tracer Front Propagation using Fast Marching Method (FMM) and Complex Analysis Method (CAM). Unconventional Resources Technology Conference, Proceedings, URTeC 2020-2474. https://pubs.geoscienceworld.org/urtec/proceedings-abstract/urtec2020/urtec2020/4744/ 706657.
Oshaish, A. and Weijermars, R. [2023]. Fracture Propagation-Rate and Fracture Half-Length Estimated for an Individual Stage using Dynamic Balancing of Fluid Pressures: Eagle Ford Case Study. International Geomechanics Symposium, Proceedings, ARMAIGS-2023-0176. https://doi.org/10.56952/IGS-2023-0176.
Pratama, M.A., Al Qoroni, O., Rahmatullah, I.K., Jameel, M.F. and Weijermars, R. [2023]. Probabilistic Production Forecasting and Reserves Estimation: Benchmarking Gaussian Decline Curve Analysis Against the Traditional Arps Method (Wolfcamp Shale Case Study). Geoenergy Science and Engineering, 232. https://doi. org/10.1016/j.geoen.2023.212373.
PRMS. [2022]. Petroleum Resources Management System and extended guidelines by the SPE Oil & Gas Reserves Committee. https:// www.spe.org/en/industry/reserves/non-hydrocarbons/.
Ramey Jr., H.J. [1976]. Practical use of modern well test analysis. SPE Western Regional Meeting, Proceedings, SPE 5878. https://doi. org/10.2118/5878-MS.
Tian, Y. and Weijermars, R. [2025]. Computation of pressure depletion and productivity of multi-fractured wells with variable fracture spacing using fast and accurate solution method. Petroleum Research. https://doi.org/10.1016/j.ptlrs.2025.08.008.
Weijermars, R. [2022]. Production Rate of Multi-Fractured Wells Modeled with Gaussian Pressure Transients. Journal of Petroleum Science and Engineering, 210, 110027. https://doi.org/10.1016/j. petrol.2021.110027.
Weijermars, R. [2023]. Potential Production Gains of Multi-Stage Fractured Wells in Shale Plays: Sensitivity of Well Performance to Changes in Design Parameters Assessed with Fast and Accurate Gaussian Solutions. First Break, 41(4), 63-70. https://doi. org/10.3997/1365-2397.fb2023029.


Weijermars, R. [2025a]. Comprehensive permeability-transform solutions for shale and sandstones using data sets from around the globe. Petroleum Research. https://doi.org/10.1016/j.ptlrs.2025.08.006.
Weijermars, R. [2025b]. Production Optimization in Shale Formations: Focus on Proppant Delivery Schedules and Mitigation of Fracture Conductivity Damage. Petroleum. https://doi.org/10.1016/j. petlm.2025.12.001.
Weijermars, R. and Afagwu, C. [2022]. Hydraulic Diffusivity Estimations for US Shale Gas Reservoirs with Gaussian Method: Implications for Pore-Scale Diffusion Processes in Underground Repositories. Journal of Natural Gas Science and Engineering, 106, 104682. https://doi.org/10.1016/j.jngse.2022.104682.
Weijermars, R. and Afagwu, C. [2024]. Pressure-Transient Solutions for Unbounded and Bounded Reservoirs Produced and/or Injected via Vertical Well-Systems with Constant Bottomhole-Pressures. Fluids, 9(9), 199. https://doi.org/10.3390/fluids9090199.
Weijermars, R. and Oshaish, A. [2025]. Rapid Estimation of Fracture Half-Length and Fracture Propagation-Rate in Individual Hydraulic Fracturing Stages Using Post-Frac-Job Reports: Benchmark Results from Eagle Ford Case Study Well. Journal of Petroleum Exploration and Production Technology, 15, 75. https://doi. org/10.1007/s13202-025-01949-1.
Weijermars, R., Paradis, K., Belostrino, E., Feng, F., Lal, T., Xie, A. and Villareal, C. [2017]. Re-appraisal of the Bakken Shale Play: Accounting for Historic and Future Oil Prices and applying Fiscal Rates in North Dakota, Montana and Saskatchewan. Energy Strategy Reviews, 16, 68-95. https://doi.org/10.1016/j.esr.2017.02.005.
Yu, W., Xu, Y., Weijermars, R., Wu, K. and Sepehrnoori, K. [2018]. A numerical model for simulating pressure response of well interference and well performance in tight oil reservoirs with complex fracture geometries using the fast embedded discrete fracture model method. SPE Reservoir Evaluation & Engineering-Reservoir Engineering, SPE-184825-PA. https://onepetro.org/ REE/article/21/02/489/207518/A-Numerical-Model-for-Simulating-Pressure-Response.
Zimmerman, R.W. [2018]. Fluid flow in porous media. The Imperial College Lectures in Petroleum Engineering, 5. https://doi. org/10.1142/q0146.


1-6 Mar 86th Annual Meeting of the German Geophysical Society (DGG) dgg2026.dgg-tagung.de
6 Mar EAGE/DGG Workshop on Radioactive Waste Storage www.eage.org
Mar AGAP Qualité Scientific Days www.agapqualite.org
30 Mar1 Apr EGYPES 2026 www.egypes.com
April 2026
www.eage.org
28-29 Apr APGCE 2026 Curtain Raiser: 2 nd EAGE Workshop on New Discoveries in Mature Basins www.eage.org
May 2026
6-7 May DGMK/ÖGEW Spring Conference 2026 dgmk.de/en/events/dgmk-oegew-spring-conference-2026/
11-13 May Second EAGE/ALNAFT Workshop on Techniques of Recovery of Mature Fields and Tight Reservoirs www.eage.org
11-13 May 8 th Asia Pacific Meeting on Near Surface Geoscience & Engineering www.eage.org
18-20 May Fifth AAPG/EAGE Hydrocarbon Seals Workshop www.eage.org
19-22 May InterPore2026 www.interpore.org
26-28 May Second EAGE/SBGf Conference on Deepwater Brazil Equatorial Margin www.eage.org
June 2026
1-4 Jun ARPEL Conference 2026 www.arpel.org
8-11 Jun 87 th EAGE Annual Conference & Exhibition www.eageannual.org
July 2026 27-31 Jul 9 th EAGE Conference on Conjugate Margins www.eage.org
28-29 Jul APGCE 2026 Curtain Raiser: EAGE Workshop on Exploration and Opportunities in the Paleogene Play www.eage.org
2026
1-2 Sep EAGE Exploration Workshop: Unlocking New Zealand’s Upstream Potential www.eage.org
Taranaki New Zealand
7-9 Sep Fifth EAGE Marine Acquisition Workshop www.eage.org Oslo Norway
8-11 Sep ECMOR 2026 www.ecmor.org
15-16 Sep 5 th EAGE Conference on Carbon Capture, Utilisation and Storage www.eage.org
20-24 Sep Near Surface Geoscience Conference and Exhibition (NSG) 2026
• 32 nd European Meeting of Environmental and Engineering Geophysics
• 7 th Conference on Mineral Exploration and Mining
• 3 rd Conference on Hydrogeophysics
• 2 nd Conference on Geohazards Assessment and Risk Mitigation www.eagensg.org
21-25 Sep World CCUS Conference 2026 www.wccus.org
Porto Portugal
Qingdao China
Thessaloniki Greece

Edinburgh United Kingdom
22-23 Sep EAGE Symposium on Subsurface Intelligence: Harnessing AI/ML to Maximise Asset Value www.eage.org Kuala Lumpur Malaysia
23-24 Sep EAGE/SBGf Workshop on Seismic Processing www.eage.org Rio de Janeiro Brazil