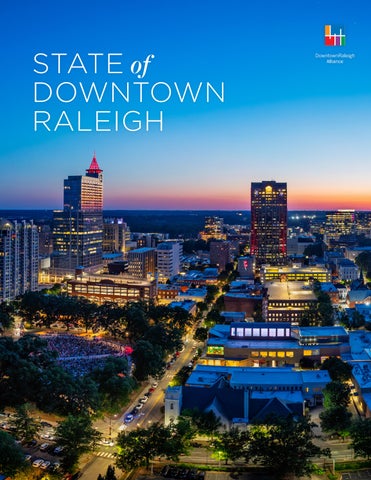
LETTER FROM OUR PRESIDENT & CEO This June, when the Carolina Hurricanes won their first Stanley Cup championship in twenty years, more than 190,000 people packed into Downtown Raleigh to celebrate. Fayetteville and Hillsborough Streets were a wall of red from the Capitol to City Plaza. City Plaza itself became the stage for a city celebrating together. This was one of the largest single-day gatherings in our downtown’s history, and a reminder that when Raleigh wants to come together as one community, downtown is where it happens. Downtown’s momentum reflects three decades of deliberate work. This year marks the 30th anniversary of Downtown Raleigh Alliance, and we are two years into implementing the five-year Downtown Economic Development Strategy. The early investments and wins are becoming more visible: two-hour free parking in city decks makes downtown easier than ever to visit and support; new tree lights along Fayetteville Street illuminate North Carolina’s Main Street, with an additional $1 million investment in new streetscape elements coming to the corridor; and a new elevated trail concept, “The Oakline,” helps advance a bold new connection to Dix Park. The broader development pipeline, now $8.5 billion in projects planned, under construction, or completed since 2015, continues to signal strong investor confidence in our urban core. Downtown added more than 1,000 residents over the past year and now counts 16,800 residents, part of a decade-long trend that has more than doubled the downtown population since 2015. The office market remains strong, with the highest Class A direct occupancy rate of any major submarket in the Triangle. This year’s lease signings from companies like RapidScale,
Smith Anderson, BuildOps, and Progress Software show that downtown is where growing companies want to be. The southern end of downtown is transforming in real time. The Omni Convention Hotel, the Raleigh Convention Center expansion, and the relocated Red Hat Amphitheater represent nearly a billion dollars of investment within a few blocks. Together, they will anchor a vibrant new convention and entertainment district. Meanwhile, Dix Park is emerging as a true destination, drawing hundreds of thousands of visitors to the downtown area from across the region and state. Construction has also begun on Bus Rapid Transit, the first true mass transit system in the Triangle with Downtown Raleigh at its center. Storefront expansion continued this year, with more than 80 storefront openings increasing the total number of downtown storefronts to over 550 shopping, service, dining, and nightlife establishments. Downtown’s culinary reputation also grew, with eight restaurants earning recognition in the MICHELIN Guide, further securing downtown as a dining destination. Over five million annual visitors confirmed that people do not just work or live downtown, they choose to visit it again and again. None of this, the parade, the development pipeline, the people, happens without the residents, businesses, and investors who have chosen to support this place for thirty years and counting. Thank you for being part of downtown’s story in this, our 30th anniversary year. Sincerely,
Bill King, President & CEO, Downtown Raleigh Alliance
TABLE OF CONTENTS | 1
© Carolina Standard
© Carolina Standard
© Carolina Standard
INTRODUCTION TO DOWNTOWN
|
04
LIVING
|
16
OFFICE & EMPLOYMENT
|
28
SHOPPING & DINING
|
40
ARTS, CULTURE & TOURISM
|
52
CONNECTIVITY & GREENSPACE
|
60
Glenwood Av e
2 | STATE OF DOWNTOWN RALEIGH
SEABOARD + PERSON STREET DISTRICT
GLENWOOD SOUTH DISTRICT N McDowell St
N Dawson St
Hillsborough St
CAPITAL DISTRICT
E Edenton St New Bern Ave
W Morgan St
WAREHOUSE DISTRICT
MOORE SQUARE DISTRICT
FAYETTEVILLE STREET DISTRICT
W Cabarrus St
W South St
1-MILE RADIUS
DOWNTOWN
STATE OF DOWNTOWN RALEIGH | 3
DOWNTOWN DISTRICTS CAPITAL The Capital District is the government center of North Carolina and home to some of the state’s biggest tourist attractions. With the State Capitol, Legislative Building, Governor’s Mansion, and 3.5 million square feet of government office space, many of the most important decisions in the state are made in this district.
FAYETTEVILLE STREET Fayetteville Street is the civic spine of the city and North Carolina’s Main Street. Anchored by the North Carolina State Capitol to the north and Raleigh’s performing arts center to the south, the district features awardwinning restaurants, independent retailers, and a concentration of Class A office space.
GLENWOOD SOUTH One of downtown’s signature streets anchors this eclectic neighborhood of restaurants, nightlife, stores, art galleries, and residences. New restaurants blend in with established favorites, while the growing population of young workers find plenty to do in the active bar scene.
MOORE SQUARE Anchored by Moore Square Park and historic City Market, the district has become a dense and walkable urban neighborhood with plenty of entertainment options like Marbles Kids Museum and live music venues like The Lincoln Theatre and Pour House Music Hall.
SEABOARD + PERSON STREET Containing the commercial centers of Seaboard Station and Person Street, the northern end of downtown has a neighborhood feel with locally-owned businesses such as bakeries, clothing boutiques, and some of downtown’s best restaurants.
WAREHOUSE Characterized by its red brick warehouses, the Warehouse District has transformed into a vibrant mix of restaurants, destination retail, technology firms, and a multi-modal hub with Raleigh Union Station.
ESRI Business Analyst 2DRA 3Placer.ai 4TPL, DRA
1
FAST FACTS 21.5K RESIDENTS WITHIN 1 MILE OF DOWNTOWN'S CENTER 1
42.6K EMPLOYEES WITHIN 1 MILE OF DOWNTOWN'S CENTER 1
120+ RETAILERS 2
300+ RESTAURANTS AND BARS 2
22.5M VISITOR VISITS PER YEAR 3
492 ACRES OF PARK SPACE WITHIN 1 MILE OF DOWNTOWN'S CENTER 4
INTRO
4 | STATE OF DOWNTOWN RALEIGH
$8.5B IN DEVELOPMENT PIPELINE OF PROJECTS PLANNED, UNDER CONSTRUCTION, OR COMPLETED SINCE 2015
INTRO TO DOWNTOWN RALEIGH | 5
D
owntown Raleigh is a rapidly evolving hub of growth, innovation, and community—one of the nation's fastest-growing downtowns with a mix of residential, commercial, retail, and cultural experiences. Over the past decade, Raleigh's urban core has become one of the country's most attractive markets for living, working, and visiting, anchored by an $8.5 billion development pipeline since 2015, including $2.5 billion completed since 2020. Since 2015, nearly 7,000 residential units have delivered, more than doubling downtown's population. Residential development reached an all-time high in 2025 with 1,496 units delivered, the most in downtown's history, and Downtown Raleigh leads its national peer set in the pace of apartment absorption, with stabilized occupancy now up to 92.5%. Downtown's office market remains a magnet for companies seeking a highly skilled workforce, holding the highest Class A direct occupancy rate of any major Triangle submarket at 86.8 percent. Storefront businesses continue to expand, with 83 openings this year adding street-level energy downtown. Arts and culture reached new heights, with 22.5 million visitor visits and major investments underway, including the Omni Convention Hotel and Red Hat Amphitheater relocation. A national leader in urban greenspace, downtown offers 492 acres of park space within one mile of its center, far outpacing most peers. Significant investments, including Dix Park, continue to expand amenities across downtown's edges. From storefront growth to transformative investment across the core, Downtown Raleigh remains on a trajectory of continued success—a place where creativity and commerce thrive, and residents, workers, and visitors can live, work, and explore.
WHAT DOES THIS GROWTH MEAN FOR THE FUTURE? COMPLETED SINCE 2015, UNDER CONSTRUCTION, PLANNED OR PROPOSED
13,610
19.4K
1M
287+
New Residential Units
New Residents
Square Feet of New Retail Space
New Stores and Restaurants
2.6M
11.4K
2,374
650K+
Square Feet of New Office Space
New Office Employees
New Hotel Rooms
More Overnight Stays per Year
INVESTMENT BY DISTRICT
Recently Completed (2015+)
Under Construction
WAREHOUSE
CAPITAL
Planned or Proposed
$2B $1.8B $1.6B $1.4B $1.2B $1B $800M © Raleigh Skyline
$600M $400M $200M 0 FAYETTEVILLE STREET Source: DRA
GLENWOOD SOUTH
DOWNTOWN NON-DISTRICT
MOORE SQUARE
SEABOARD + PERSON ST
6 | STATE OF DOWNTOWN RALEIGH
RALEIGH’S FUTURE SKYLINE
$8.5B
IN DEVELOPMENT PIPELINE OF PROJECTS PLANNED, UNDER CONSTRUCTION OR COMPLETED SINCE 2015
View of Downtown Raleigh looking Northwest. Sources: DRA, City of Raleigh, OpenStreet Map
INTRO TO DOWNTOWN RALEIGH | 7
COMPLETED SINCE 2015
UNDER CONSTRUCTION
PLANNED + PROPOSED
• $3,671,083,294 investment
• $1,682,307,170 investment
• $3,119,136,730 investment
• 2,009,538 SF office space
• 592,800 SF office space
• 491,592 SF office space
• 6,923 residential units
• 765 residential units
• 5,922 residential units
• 931 hotel rooms
• 943 hotel rooms
• 704 hotel rooms
• 692,997 SF retail
• 68,685 SF retail
• 242,188 SF retail
8 | STATE OF DOWNTOWN RALEIGH
ON THE MAP: DOWNTOWN DEVELOPMENT
Completed 2015 to 2023 Completed 2024 to Present Under Construction Planned or Proposed
33 50
<30 Units
64
>300 Units
3
4 6
67
27 20 12
31
13 68 51
40 32 28 38
48
37
8 52 71
29
25
42 43 39
69
72 22 23
9 7
58
60
59 5
21 44 45
36 26
65
63 61 11
73
35
57 17 14 Source: DRA
70 15
66
41 2 18
49
34 19
62
53 24 10
30 47
1
54
56
55
INTRO TO DOWNTOWN RALEIGH | 9
PLANNED + PROPOSED
UNDER CONSTRUCTION
COMPLETED SINCE 2024
# PROJECT NAME
1 Mira Raleigh 2 The Acorn on Person Street 3 615 Peace 4 The Miles at Seaboard Station 5 Tempo/Homewood Suites by Hilton Dual Brand Hotel 6 The Point & Hyatt House Seaboard Station 7 Row 12 8 The Bend 9 The Marbles Playway 10 The Row at Rockway Raleigh 11 Maeve 12 Alexan Moto 13 122 Glenwood Ave (Renovation) 14 Gipson Play Plaza at Dix Park 15 The Holston at The Weld 16 Union Station Bus Facility (RUS Bus) 17 Ray at The Weld 18 Idyle 19 Lichtin Plaza 20 Noble Place 21 Oldham & Worth (West End Phase II) TOTALS 22 210 Fayetteville St (Renovation) 23 216 Fayetteville St (Renovation) 24 City Gateway Parking Facility 25 East Civic Tower - City Hall 26 Heritage Park Phase 1 (Site Prep) 27 Highline Glenwood 28 Hotel Indigo (Renovation) 29 Marbles Kids Museum Expansion 30 Marriott Towneplace Suites 31 NC Education Campus 32 NC Museum of History (Renovation) 33 Oakwood Townhomes 34 Omni Hotel - Raleigh Convention Hotel 35 Red Hat Amphitheater Relocation 36 Rosewood (Site Prep) TOTALS 37 201 W Hillsborough 38 300 Hillsborough Hotel 39 307 W Martin St 40 317 E Jones Apartments 41 328 Chavis Condos 42 330 W Hargett St 43 333 W Hargett St 44 400 W Cabarrus 45 401 Cabarrus Apartments 46 404 Glenwood (The Creamery Phase 2) 47 423 S Blount - Boutique Hotel 48 501 Hillsborough 49 516 S Bloodworth 50 707 Semart Drive 51 865 Morgan Apartments 52 Bloomsbury Apartments 53 City Gateway Hotel 54 Fire Station 1 & Fire Administration Building 55 John Chavis Aquatics Center & Heritage Plaza 56 John P. Top Greene African American Cultural Center 57 Lynde Hill Lofts at Rockway 58 Moore Square East 59 Moore Square South 60 One Nash Square 61 Raleigh Convention Center Expansion 62 Salisbury Square Apartments 63 Sheraton to Westin 64 Smoky Hollow Park 65 The Depot 66 The Heath at Rockway 67 The Madison 68 The Row at Glenwood 69 The Tellus Condominiums 70 The Weld Phase 2 71 Union West at Raleigh Union Station 72 VeLa Longview 73 Wilmington Street Mixed Use TOTALS
INVESTMENT Not Announced Not Announced $7,000,000 Not Announced Not Announced Not Announced Not Announced Not Announced Not Announced Not Announced Not Announced Not Announced Not Announced $73,500,000 Not Announced $37,917,000 Not Announced $11,000,000 $1,461,000 Not Announced Not Announced $1,292,677,133 Not Announced Not Announced $52,000,000 $206,000,000 Not Announced $200,000,000 $49,000,000 $5,982,170 Not Announced $400,000,000 $225,000,000 Not Announced $314,100,000 $32,000,000 Not Announced $1,682,307,170 Not Announced Not Announced Not Announced Not Announced $2,000,000 Not Announced Not Announced Not Announced Not Announced Not Announced Not Announced Not Announced Not Announced $200,000,000 Not Announced Not Announced Not Announced $72,000,000 $53,950,000 $9,295,000 Not Announced Not Announced Not Announced Not Announced $355,000,000 Not Announced Not Announced $22,679,930 $75,000,000 Not Announced $150,000,000 Not Announced Not Announced Not Announced Not Announced $170,000,000 Not Announced $3,119,136,730
RETAIL/OFFICE SF 2,800
1,550 44,260 1,810 10,000
UNITS/ROOMS 288 107 24 204 75 12
261 149
5,000 17,600 10,522 8,612 8,000 2,000 5,533
335 297 186
4,060
392 10
283
4,000 125,747 / 0 SF 31,700 8,700 13,400 14,100
16 252 2,481 UNITS / 410 ROOMS
163 306
7,400
204 138
27 10,856
601
5,329 68,685 / 22,800 SF 6,485 2,500 20,984
17,381 5,665 6,188 7,964 10,000
269 765 UNITS / 943 ROOMS 279 180 220 10 11 372
168,700 22,892 298 280,000 90
8,550 2,003 11,826 8,864 2,475
221 6 680 400 237 264
200
5,500
82 545
30,000 5,000 13,000 8,000
20,000
20,885 20,000 10,268 18,650 242,188 / 491,592 SF
170 376 313 30 525 385 358 374 5,922 UNITS / 704 ROOMS
SPACE USE(S)
Apartment/Retail Apartment Condo/Retail Apartment/Retail Hotel Apartment/Hotel/Retail Townhome Retail Civic Apartment/Retail Apartment/Retail Apartment/Retail Retail Public Space Apartment/Retail Transit Infrastructure Apartment/Retail Townhome Government - Infrastructure Townhome Apartment/Retail Retail Retail Parking Government - Office Apartment Apartment/Retail Hotel Nonprofit Hotel Government - Office Civic Townhome Hotel/Retail Government - Entertainment Apartment/Retail Apartment/Retail Hotel/Retail Apartment/Retail Apartment Condo Apartment/Retail Office/Retail Office/Retail Apartment/Retail Office/Retail Hotel Apartment/Retail Apartment/Retail Apartment/Retail Apartment/Retail Apartment/Retail Hotel Government Public Space Public Space Apartment TBD TBD Condo/Retail Government - Convention Apartment/Retail Hotel Public Space Hotel/Office/Retail Apartment/Retail Apartment/Retail Retail Condo Apartment/Retail Apartment/Retail Apartment/Retail Apartment/Retail
10 | STATE OF DOWNTOWN RALEIGH
DOWNTOWN'S IMPACT
The map above, illustrating assessed value per acre in uniform hexagons, demonstrates how much of the city’s property tax revenue is densely concentrated in and around Downtown Raleigh.
The dense concentration of development and economic activity in Downtown Raleigh produces benefits that extend well beyond downtown itself. Although downtown represents approximately 1% of the city’s land area, its substantial property tax base provides significant revenue for both the City of Raleigh and Wake County. Downtown properties are projected to generate over $48 million in combined property tax revenue in FY27, while downtown restaurants and bars contributed $3.2 million in prepared food and beverage tax revenue in 2025 and hotels contributed another $8.4 million in room occupancy taxes. These revenues ultimately help fund public services and investments serving residents throughout Raleigh and Wake County.
GEOGRAPHY
ASSESSED VALUE/ACRE*
DOWNTOWN BOUNDARY
$12,813,737
FAYETTEVILLE STREET
$25,250,479
GLENWOOD SOUTH
$13,558,293
MOORE SQUARE
$11,094,998
WAREHOUSE DISTRICT
$8,160,039
CAPITAL DISTRICT
$8,046,408
SEABOARD + PERSON
$4,072,642
Source: Wake County Tax Administration *Exempt properties not included in acreage. Note: Property tax figures are based on 2024 assessment
INTRO TO DOWNTOWN RALEIGH | 11
PROPERTY TAX REVENUE GENERATED IN DOWNTOWN
City of Raleigh
Wake County
$50M
$59.6M
$45M $40M $35M
COMBINED CITY AND COUNTY TAX REVENUE GENERATED PER YEAR IN DOWNTOWN**
$30M $25M $20M $15M $10M $5M 0 FY1O
FY11
FY12
FY13
FY14
FY15
FY16
FY17
FY18
FY19
FY2O
FY21
FY22
FY23
FY24
FY25*
FY26*
FY27*
Source: Wake County Tax Administration *Downtown tax geography expanded in FY2025
$20M PROPERTY TAX REVENUE TO THE CITY OF RALEIGH FY27
PREPARED FOOD AND BEVERAGE TAX COLLECTED IN DOWNTOWN $3.5M $3M $2.5M
$28M
$2M $1.5M
PROPERTY TAX REVENUE TO WAKE COUNTY FY27
$1M $500K 0 2009 2010 2011 2012 2013 2014 2015 2016 2017 2018 2019 2020 2021 2022 2023 2024 2025 Source: Wake County Tax Administration
$8.4M
HOTEL ROOM OCCUPANCY TAX COLLECTED IN DOWNTOWN
HOTEL ROOM OCCUPANCY TAX COLLECTED 2025
$2.4M $2M $1.6M
$3.2M
$1.2M $800K
PREPARED FOOD AND BEVERAGE TAX COLLECTED 2025
$400K
**Does not include sales tax
Q2
Q1
20
26
Q4
20
26
Q3
20
25
Q2
20
25
Q1
20
25
Q4
20
25
Q3
20
24
Q2
20
24
Q1
20
24
Q4
20
24
Q3
20
23
Q2
20
23
Q1
20
20
23
Q4
Source: Wake County Tax Administration
23
Q3
20
22
Q2
20
22
Q1
20
22
Q4
20
22
Q3
21
20
21
20
20
21
Q2
0
12 | STATE OF DOWNTOWN RALEIGH
A New n w o t n w o D r Strategy fo In 2024, Downtown Raleigh Alliance, in partnership with the City of Raleigh and Interface Studio, developed a five-year Economic Development Strategy for Downtown Raleigh. This effort produced several key recommendations and bold ideas to guide catalytic investment and the continued evolution of our urban core. Over the past two years, DRA and its partners have advanced key elements of this plan, building momentum and laying the groundwork for future investment and growth.
10 BIG IDEAS FOR DOWNTOWN RALEIGH 1
Energize downtown core with daily activation and placemaking to bring more people downtown
2
Elevate public art to create a unique experience that celebrates Raleigh and North Carolina
3
Diversify retail opportunities to address downtown needs
4
Support growth and diversification of innovation sector downtown
5
Position Downtown Raleigh as the Creative + Design Center of the Triangle*
6
Expand capacity of MWBE entrepreneurial ecosystem to support downtown and citywide needs*
7
Integrate the government campus with the downtown core
8
Create exceptional public spaces for everyone
9
Create a bold connection to Dix Park
10
Design streets that encourage walking, biking and public transit
* Starred indicate study area / citywide strategies
ECONOMIC DEVELOPMENT STRATEGY | 13
14 | STATE OF DOWNTOWN RALEIGH
Downtown Raleigh
Economic Development Strategy ENERGIZE THE CORE The core of downtown, centered on Fayetteville Street, remains disconnected from investment in surrounding districts. The strategy calls for a streetscape that allows flexibility for outdoor dining and activity, a redesigned City Plaza programmed for year-round use, more housing near the core, and public art that celebrates Raleigh and North Carolina. Together these moves aim to attract a broader mix of people downtown, not only office workers.
ENTREPRENEURSHIP & RETAIL Downtown retail works best when each street has a clear identity. The strategy differentiates downtown into distinct retail districts, from neighborhood goods and services to a shopping and dining district representing the best of North Carolina. It also recommends a wider range of space options for businesses at different stages, and expanded capacity in the ecosystem supporting minority- and womenowned businesses.
EXCEPTIONAL PUBLIC SPACES Downtown's parks and plazas should serve residents, workers, families, and visitors alike. The strategy recommends redesigning Nash Square and Market Plaza, enhancing Moore Square with family-friendly amenities, and treating Fayetteville Street as a linear park. It also proposes restoring Caswell Square, creating a new northern gateway at Peace Street, and better integrating the state government campus with downtown.
ECONOMIC DEVELOPMENT STRATEGY | 15
Downtown to Dix Park Connection
ENHANCED CONNECTIONS Everything downtown sits within a 10-minute bike ride, yet major thoroughfares divide it. The strategy calls for greener, more pedestrian-friendly boulevards on Dawson, McDowell, Western, and Martin Luther King, Jr., improved transit connections, and a bold link south to Dix Park.
Innovation Triangle within the Triangle
THERE'S MORE...
Read the full 48-page Economic Development Strategy online.
EPICENTER OF DESIGN & INNOVATION Downtown Raleigh holds the largest concentration of architecture, design, and digital marketing firms in the Triangle. The strategy proposes branding downtown as the region's Creative + Design Center, linking downtown with NC State's Centennial Campus as complementary innovation centers, and evaluating speculative lab space to support growth in life sciences. A downtown design hub, developed with local universities, would showcase the sector's work.
16 | STATE OF DOWNTOWN RALEIGH
LIVING R
esidential development continues to reshape Downtown Raleigh, where the housing supply has grown by more than 155% since 2015.1 Over that period, 6,649 apartments and 274 condos and townhomes have been
completed, supporting population growth that has increased downtown’s population to 16,841.1 The next wave of residential development includes 765 units under construction in four projects and another 5,922 planned or proposed in 21 projects.1 If completed, these projects could add an estimated 7,419 residents over the next five years.1 This growth is supported by Downtown Raleigh’s mix of restaurants, shops, parks, cultural institutions and entertainment. As more people call downtown home, continued investment in public space, infrastructure, and neighborhood amenities will be important to support a growing urban neighborhood.
LIVING | 17
+7,419 DOWNTOWN RALEIGH GROWTH THROUGH 2031
Housing Units
Projected population increase by 20311
Population
Population Growth
26,000 24,000 22,000 20,000 18,000 16,000 14,000 12,000 10,000 8,000 6,000
Photo Credit Keith Isaacs
4,000 2,000 0 2010
2015
2020
2026
2031 (PROJECTED)
Source: DRA Note: Assumes 75% of residential pipeline delivers within the next 5 years
16,841
+116%
11,379
6,923
$1,876
92.5%
DOWNTOWN RESIDENTS 1
INCREASE IN POPULATION 2015 TO PRESENT 1
TOTAL HOUSING UNITS 1
HOUSING UNITS DELIVERED 2015 TO PRESENT 1
AVERAGE ASKING RENT PER MONTH 2
STABILIZED OCCUPANCY RATE 2
1DRA 2CoStar
18 | STATE OF DOWNTOWN RALEIGH
ON THE MAP: RESIDENTIAL DEVELOPMENT
6,923
units completed 2015-present in 44 projects
765
units under construction or in site prep across four projects
5,922
units planned or proposed in 21 projects
Completed 2015 to Present Under Construction Planned or Proposed
<30 Units
Source: DRA
>300 Units
LIVING | 19
RESIDENTIAL UNITS DELIVERED BY YEAR
Apartments
1,600 1,400 1,200 1,000 800 600 400 200 0 2015
2016
2017
2018
2019
2020
2021
2022
2023
2024
2025
2026 YTD
Townhomes
Condos
Downtown Raleigh has added 6,923 residential units since 2015, more than doubling its housing inventory over the past decade. Multifamily apartments have driven nearly all of this growth, accounting for 96% of units delivered and 98% of the planned and proposed residential pipeline.
Source: DRA
RESIDENTIAL PIPELINE BY DISTRICT
Recently Completed
WAREHOUSE GLENWOOD SOUTH DOWNTOWN NON-DISTRICT MOORE SQUARE SEABOARD + PERSON ST FAYETTEVILLE ST CAPITAL 0
500
1,000
1,500
2,000
2,500
3,000
3,500
Under Construction
Planned or Proposed
The Warehouse District and Glenwood South account for the largest concentrations of residential development downtown, with more than 6,000 recently completed, under construction, planned or proposed units between them. The Warehouse District alone has 2,173 units in its future pipeline, including projects under construction, in site preparation, and planned or proposed, the most of any district.
Source: DRA
APARTMENT UNITS UNDER CONSTRUCTION
Downtown Raleigh
Rest of Raleigh
Citywide apartment construction peaked in Q4 2022 with 10,495 units underway, 21% of which were located in Downtown Raleigh. Downtown reached its peak shortly after, with 2,473 units under construction in Q1 2023. 11,000 10,000 9,000 8,000 7,000 6,000 5,000 4,000 3,000 2,000 1,000
20 1 20 5 Q1 1 20 5 Q2 1 20 5 Q3 1 20 5 Q4 1 20 6 Q1 1 20 6 Q2 1 20 6 Q3 1 20 6 Q4 1 20 7 Q1 1 20 7 Q2 1 20 7 Q3 1 20 7 Q4 1 20 8 Q1 1 20 8 Q2 1 20 8 Q3 1 20 8 Q4 1 20 9 Q1 1 20 9 Q2 1 20 9 Q3 1 20 9 Q4 2 20 0 Q1 2 20 0 Q2 2 20 0 Q3 2 20 0 Q4 2 20 1 Q1 2 20 1 Q2 2 20 1 Q3 2 20 1 Q4 2 20 2 Q1 2 20 2 Q2 2 20 2 Q3 2 20 2 Q4 2 20 3 Q1 2 20 3 Q2 2 20 3 Q3 2 20 3 Q4 2 20 4 Q1 2 20 4 Q2 2 20 4 Q3 2 20 4 Q4 2 20 5 Q1 2 20 5 Q2 2 20 5 Q3 2 20 5 Q4 2 20 6 Q1 26 Q2
0
Source: CoStar
20 | STATE OF DOWNTOWN RALEIGH
Highline Glenwood
© Raleigh Skyline
APARTMENT MARKET Few peer downtowns have experienced residential development on the scale that Downtown Raleigh has over the past decade. Apartment inventory has increased 257% since 2015, fundamentally changing the scale of Downtown Raleigh as a residential market.1 With another 5,799 apartments planned or proposed across 18 projects, Downtown Raleigh’s residential footprint is poised to expand further.1 The scale of residential growth has been matched by strong demand. Apartment absorption over the past 18 months represented 16.4% of Downtown Raleigh’s total inventory, the highest share among peer downtowns.2 Strong absorption is helping support the next round of residential development, with 306 units at Highline Glenwood under construction and another 269 units at Rosewood in site preparation.1
DRA 2CoStar
1
IN
Source: CoStar. Note: Projects in site prep are excluded to provide a more consistent comparison of projects under construction across peer downtowns.
DU RH AM MI NN EA PO LIS PO RT L SA N F AND RA NC ISC O TA MP AB AY DE TR OI T BO ST ON PI T TS BU RG SA NA H NT ON SA IO ND IE PH IL A GO DE LP HIA RA LE I CIN GH CIN IND NAT I IAN AP OL IS SE AT CH TLE AR LO TT E HO US T RIC ON HM ON D DE NV ER AT LA NT A NA S HV WA IL SH ING LE TO ND . SA CR C. AM EN TO
AS
ST
LL
DA
AU
IN IG H
LE
ST
ST
.C .
AU S CIN TIN CIN NA T HO I US TO N RA LE IG H DU RH AM TA MP AB NA AY SH VIL LE
TS
Delivered 2015+
RA
BO
TO ND
ON BU RG SA H CR AM EN T PO O RT P H L AN D IL A DE LP H RIC IA HM IND ON I AN D AP OL MI NN IS EA PO LIS DE TR OI T AT LA NT A SE A TT SA LE NF RA NC ISC O DE NV ER DA LL AS SA ND IEG O CH AR LO T SA N A TE NT ON IO PI T
HIN G
WA S
CHANGE IN APARTMENT INVENTORY 2015-PRESENT
AU
R WA ICHM O SH ING ND TO ND .C BO . ST O PO N RT LA SA ND CR AM EN T SA NA O NT ON IO CH AR LO TT E HO US TO IND N IAN AP OL IS D PH ALL A IL A S DE LP H MI NN IA EA PO LIS PI T TS BU RG SA H ND IEG O SE AT TL E AT LA N CIN TA CIN NA TI TA MP A SA N F BAY RA NC ISC O DE NV ER DE TR NA OIT SH VIL LE DU RH AM
LIVING | 21
Under Construction as of Q2
500%
400%
300%
200%
100%
0
Source: CoStar
18 MONTH APARTMENT ABSORPTION AS A PERCENT OF INVENTORY
18%
16%
14%
12%
10%
8%
6%
4%
2%
0
-2%
Source: CoStar
APARTMENT UNITS BREAKING GROUND IN THE LAST 18 MONTHS
800
700
600
500
400
300
200
100
0
22 | STATE OF DOWNTOWN RALEIGH
APARTMENT MARKET Downtown Raleigh has added 1,745 apartments across six developments since the start of 2025, creating a substantial influx of new multifamily supply.1 Demand has kept pace with that growth as 1,400 units have been absorbed over the past 18 months.2 Stabilized vacancy, which excludes developments in initial lease up, declined from 10.0% in Q4 2025 to 7.5% in Q2 2026, while overall vacancy declined to 16.9%.2 Taken together, falling vacancy and high absorption demonstrate the strength of residential demand as downtown works through one of its largest periods of apartment deliveries.
The Weld Photo Credit Mack Real Estate Group
8,898
818
$1,876
TOTAL APARTMENT UNITS 1
AVERAGE UNIT SIZE 2
AVERAGE ASKING RENT PER UNIT 2
DRA 2CoStar
1
20 1 20 5 Q1 1 20 5 Q2 1 20 5 Q3 1 20 5 Q4 1 20 6 Q1 1 20 6 Q2 1 20 6 Q3 1 20 6 Q4 1 20 7 Q1 1 20 7 Q2 1 20 7 Q3 1 20 7 Q4 1 20 8 Q1 1 20 8 Q2 1 20 8 Q3 1 20 8 Q4 1 20 9 Q1 1 20 9 Q2 1 20 9 Q3 1 20 9 Q4 2 20 0 Q1 2 20 0 Q2 2 20 0 Q3 2 20 0 Q4 2 20 1 Q1 2 20 1 Q2 2 20 1 Q3 2 20 1 Q4 2 20 2 Q1 2 20 2 Q2 2 20 2 Q3 2 20 2 Q4 2 20 3 Q1 2 20 3 Q2 2 20 3 Q3 2 20 3 Q4 2 20 4 Q1 2 20 4 Q2 2 20 4 Q3 2 20 4 Q4 2 20 5 Q1 2 20 5 Q2 2 20 5 Q3 2 20 5 Q4 2 20 6 Q1 26 Q2
20 1 20 5 Q1 1 20 5 Q2 1 20 5 Q3 1 20 5 Q4 1 20 6 Q1 1 20 6 Q2 1 20 6 Q3 1 20 6 Q4 1 20 7 Q1 1 20 7 Q2 1 20 7 Q3 1 20 7 Q4 1 20 8 Q1 1 20 8 Q2 1 20 8 Q3 1 20 8 Q4 1 20 9 Q1 1 20 9 Q2 1 20 9 Q3 1 20 9 Q4 2 20 0 Q1 2 20 0 Q2 2 20 0 Q3 2 20 0 Q4 2 20 1 Q1 2 20 1 Q2 2 20 1 Q3 2 20 1 Q4 2 20 2 Q1 2 20 2 Q2 2 20 2 Q3 2 20 2 Q4 2 20 3 Q1 2 20 3 Q2 2 20 3 Q3 2 20 3 Q4 2 20 4 Q1 2 20 4 Q2 2 20 4 Q3 2 20 4 Q4 2 20 5 Q1 2 20 5 Q2 2 20 5 Q3 2 20 5 Q4 2 20 6 Q1 26 Q2
LIVING | 23
TOTAL UNITS DELIVERED WITH VACANCY RATE Units Delivered Stabilized Vacancy Overall Vacancy
700 28%
600 24%
500 20%
400 16%
300 12%
200 8%
100 4%
0 0
Source: CoStar
CHANGE IN TOTAL OCCUPIED UNITS
350
300
250
200
150
100
50
0
-50
Source: CoStar
$2.27
7.5%
1,400
AVERAGE ASKING RENT PER SF 2
STABILIZED VACANCY RATE 2
UNITS ABSORBED LAST 18 MONTHS 2
24 | STATE OF DOWNTOWN RALEIGH
© Carolina Standard
DOWNTOWN RESIDENTS Approximately 21,524 people live within one mile of Downtown Raleigh’s center, forming a growing residential base at the heart of the city.1 Downtown residents tend to be young, highly educated, and relatively affluent, with a median age of 33.5 and more than 66.3% holding a bachelor’s degree or higher.1 Average household income is $151,026, providing significant spending power within the downtown market.1 This combination of population growth, educational attainment, and household income creates an important customer base for restaurants, retailers, services, entertainment, and other businesses serving downtown residents.
RACE AND ETHNICITY
WHITE (60%)
OTHER (3%)
BLACK (24%)
ASIAN (3%)
TWO OR MORE (10%)
AMERICAN INDIAN (0%)
Source: ESRI Business Analyst ESRI Business Analyst Note: All downtown resident demographics pulled from a 1 mile radius from the capitol building 1
LIVING | 25
POPULATION DISTRIBUTION BY AGE
Downtown
Raleigh MSA
USA
30%
AVERAGE HOUSEHOLD SIZE 1
1.56 1.67
25% 20%
AVERAGE HOUSEHOLD SIZE 1 AVERAGE HOUSEHOLD INCOME 1
15% 10% 5% 0 19 AND UNDER
20 - 24
25 - 34
35 - 44
45 - 54
55 - 64
65+
Source: US Census, ESRI Business Analyst
AVERAGE HOUSEHOLD INCOME 1
AVERAGE HOUSEHOLD INCOME
BACHELOR’S DEGREE OR HIGHER 1
$160K $140K $120K
$145,195 $151,026
66.3% 68.2%
$151K
$100K
BACHELOR’S DEGREE OR HIGHER 1
$80K $60K $40K $20K 0 DOWNTOWN RALEIGH
CITY OF RALEIGH
Source: ESRI Business Analyst
NORTH CAROLINA
UNITED STATES
MEDIAN AGE 1
33.5 MEDIAN 33.6 AGE 1
DOWNTOWN RESIDENTIAL
21,524
RESIDENTS WITHIN 1 MILE OF DOWNTOWN 1 RESIDENTS WITHIN 1 MILE OF DOWNTOWN'S CENTER 1
19,980
Apartments Condos Single Family
<30 Units >300 Units
Sources: Wake County, DRA
POPULATION 39.9% AGE 20-34 1
POPULATION AGE 20-34 1
40.5%
26 | STATE OF DOWNTOWN RALEIGH
FOR SALE HOUSING Downtown Raleigh offers a diverse for-sale housing market that includes single family homes, condominiums, and townhomes. Buyers are drawn to downtown for its proximity to employment, restaurants, parks, cultural destinations, and other urban amenities. A recent wave of townhome and condominium development has expanded downtown’s for sale housing supply, including 205 townhomes across 14 projects since 2015 and 69 condominiums at The Fairweather and 615 Peace since 2021. New condominium and townhome projects play an important role in broadening downtown’s housing choices and supporting a more diverse residential population.
TOTAL CLOSED SALES AND AVERAGE 30-YEAR MORTGAGE RATE Average 30-Year Fixed Rate Mortgage
9%
$48M
8%
$42M
7%
$36M
6%
$30M
5%
$24M
4%
$18M
3%
$12M
2%
$6M
1%
0
0
20
20 20 Q1 20 20 Q2 20 20 Q3 20 20 Q4 21 20 Q1 21 20 Q2 21 20 Q3 21 20 Q4 22 20 Q1 22 20 Q2 22 20 Q3 22 20 Q4 23 20 Q1 23 20 Q2 23 20 Q3 23 20 Q4 24 20 Q1 24 20 Q2 24 20 Q3 24 20 Q4 25 20 Q1 25 20 Q2 25 20 Q3 25 20 Q4 26 20 Q1 26 Q2
$54M
Average 30-Year Fixed Rate Mortgage
Closed Sales
Closed Sales
Source: Monarch Realty & Triangle MLS, Freddie Mac
ACTIVE LISTINGS INDEX
Downtown Raleigh
Raleigh MSA
United States
Index, 2019 Average Monthly Listings = 100
250 200 150 100 50
One Nash Square
0 2020
2021
Source: Monarch Realty & Triangle MLS, Zillow
2022
2023
2024
2025
2026
LIVING | 27
$685,000 MEDIAN LISTING PRICE 2026 Q2
$403 MEDIAN LISTING PRICE PER SF 2026 Q2
301 ACTIVE LISTINGS 2026 Q2
26 IDYLE
MEDIAN DAYS ON MARKET 2026 Q2
Photo Credit Chappell Residential
One N a sh S q uare, a 20- s tor y condominium tower, will inc lude 82 re sidence s over look in g N a sh
123 FOR-SALE UNITS PLANNED OR PROPOSED
S q uare, wit h unit s c ur rently available for pre s ale. Cons t r uc t ion is expec ted to begin t his winter, int roducin g a new lu xur y owner ship opt ion to a downtown re sident i al mar ket dominated by rent al apar t ment s and si gnalin g g rowin g conf idence in t he mar ket for hi g her densit y for- s ale housin g .
$97M TOTAL CLOSED SALES LAST 12 MONTHS
Source: Monarch Realty & Triangle MLS
28 | STATE OF DOWNTOWN RALEIGH
OFFICE & EMPLOYMENT D
owntown Raleigh has the highest concentration of office space, employees, and amenities of any submarket in the Triangle. Downtown’s central location, access to regional talent, walkable environment,
and growing residential population provide companies with a distinctly urban setting for attracting and retaining talent. Downtown Raleigh recorded +45,119 square feet of Class A net absorption over the past 12 months, marking a full year of positive absorption.1 Downtown’s Class A office inventory has expanded 31% since 2020 to 4.1 million square feet.1 Average asking rent increased to $41.10 per square foot, up +6.3% year over year.2 While no multi-tenant Class A office space is currently under construction, 491,592 square feet is proposed or in planning.3
OFFICE & EMPLOYMENT | 29
+45,119
SF Class A Net Absorption Q3 25 - Q2 261
CLASS A NET ABSORPTION, DELIVERIES, AND DIRECT VACANCY 1,2 Net Absorption
SF Delivered
Direct Vacancy
© Raleigh Skyline
800,000 SF
27%
700,000 SF
24%
600,000 SF
21%
500,000 SF
18%
400,000 SF
15%
300,000 SF
12%
200,000 SF
9%
100,000 SF
6%
0
3%
-100,000 SF
0 2015
2016
2017
2018
2019
2020
2021
2022
2023
2024
2025
2026 YTD
+408,822
4.1M
+31%
$41.10
86.8%
79.8%
SF CLASS A NET ABSORPTION 2020 TO PRESENT 1
SF TOTAL CLASS A OFFICE INVENTORY 1
INCREASE IN CLASS A INVENTORY 2020 TO PRESENT 1
AVERAGE ASKING RENT PER SQUARE FOOT CLASS A 2
DIRECT CLASS A OCCUPANCY RATE 1
OVERALL CLASS A OCCUPANCY RATE
1JLL 2CBRE 3DRA
30 | STATE OF DOWNTOWN RALEIGH
LOCAL OFFICE MARKET Downtown Raleigh has recorded +408,822 square feet of Class A net absorption since 2020, contributing to a significant decline in direct vacancy from its peak of 24.1% in Q4 2021.1 At 13.2%, downtown has the lowest Class A direct vacancy rate of the major office submarkets in the Triangle and remains below the overall vacancy rate for the market of 14.8%.1 Together, positive absorption and low vacancy reflect sustained demand for downtown’s Class A office inventory. Most available sublease space in the Triangle is concentrated in Research Triangle Park, while downtown accounts for a relatively small share of the regional total.2 Within downtown, sublease availability remains concentrated primarily in two properties, 411 Fayetteville Street and 120 South West Street.
SHARE OF SUBLEASE AVAILABLE BY LOCAL SUBMARKET
RTP/RDU (40%)
CARY (5%)
DOWNTOWN RALEIGH (18%)
WEST RALEIGH (3%)
DOWNTOWN DURHAM (12%)
GLENWOOD/CREEDMOOR (3%)
SIX FORKS/FALLS OF NEUSE (10%)
ROUTE 1 (1%)
SOUTH DURHAM (7%)
ORANGE COUNTY (1%)
Source: CBRE Q2 2026
JLL 2CBRE
1
OFFICE & EMPLOYMENT | 31
© Raleigh Skyline
CLASS A NET ABSORPTION BY LOCAL SUBMARKET 2020 TO PRESENT SIX FORKS/ FALLS OF NEUSE DOWNTOWN RALEIGH
+408,822 SF
WEST RALEIGH GLENWOOD/CREEDMOOR ORANGE COUNTY ROUTE 1 DOWNTOWN DURHAM CARY SOUTH DURHAM RTP/RDU -1.2M
-1M
-800K
-600K
-400K
-200K
0
200K
400K
600K
Source: JLL Q2 2026
CLASS A VACANCY BY LOCAL SUBMARKET
Direct Vacancy
Total Vacancy
30% 25% 20% 15% 10% 5% 0 DOWNTOWN DOWNTOWN RALEIGH DURHAM Source: JLL Q2 2026
GLENWOOD/ CREEDMOOR
ORANGE COUNTY
SIX FORKS/ FALLS OF NEUSE
WEST RALEIGH
CARY
ROUTE 1
RTP/RDU
SOUTH DURHAM
32 | STATE OF DOWNTOWN RALEIGH
© Raleigh Skyline
NATIONAL OFFICE MARKET CLASS A AVERAGE ASKING RENT IN SELECT DOWNTOWNS $90/SF $80/SF $70/SF $60/SF $50/SF
$41.10
$40/SF $30/SF $20/SF $10/SF
Source: CBRE Q2 2026
AN TA AT L
AM RH DU
IG H LE RA
E TT LO AR CH
PH IA PH IL A DE L
PA TA M
LE VIL SH NA
LE
R VE
AT T SE
TO HIN G WA S
DE N
ND .C.
IN ST AU
ON ST BO
SA
NF RA NC ISC
O
0
OFFICE & EMPLOYMENT | 33
The Downtown Raleigh office market has performed well over the past year, particularly compared with other downtown markets nationwide. While Class A direct vacancy has increased significantly across downtown markets since Q2 2019, Downtown Raleigh has remained relatively stable. Class A rents also remain competitively positioned among peer markets and have held steady despite the addition of new supply.
CLASS A VACANCY IN SELECT DOWNTOWNS
Q2 2019
Q2 2026
40%
30%
20%
10%
O ND LA OR
TA MP A
LE IG H RA
AM RH DU
TE WA SH ING TO ND .C.
OT AR L CH
LE
PH IA DE L PH IL A
VIL SH NA
ON ST
NC IS RA NF SA
Source: JLL, Q2 2026
BO
CO
IN ST AU
R VE DE N
AN TA AT L
SE
AT T
LE
0
34 | STATE OF DOWNTOWN RALEIGH
DOWNTOWN'S ADVANTAGE © Raleigh Skyline
Downtown Raleigh offers a combination of talent access, connectivity, amenities, and competitive costs that distinguishes it from other office locations in the region. Downtown's central location connects employers to talent across the Triangle, while the street grid and multiple commute routes provide employees with numerous ways to reach downtown offices. Once there, workers have access to restaurants, services, cultural destinations, and other amenities within walking distance. Downtown also offers competitive occupancy costs, with Class A asking rents averaging $41.10 per square foot and monthly parking rates well below those of many major downtown office markets. Established concentrations of technology, legal, design and engineering, finance, and professional services further strengthen downtown’s position. Together, these advantages create a compelling environment for companies seeking to attract talent and employees seeking a high quality workplace experience.
PRIMARY COMMUTE ROUTES TO DOWNTOWN
Class A Office Buildings >50K SF Primary Road Secondary Road
More than a dozen primary and secondary routes connect Downtown Raleigh from every direction, while its interconnected street grid distributes traffic across multiple corridors. Downtown is also where the region’s transit investments converge, positioning downtown to remain accessible as population and traffic increase across the Triangle.
OFFICE & EMPLOYMENT | 35
TOTAL OCCUPIED SQUARE FEET BY INDUSTRY CLUSTER Downtown Raleigh
Downtown Durham
Technology, legal, design, engineering & construction, finance, professional services, and real estate firms form established industry clusters in Downtown Raleigh. Together, these clusters create a diverse private sector employment base spanning some of the region’s most talent intensive industries. This concentration places companies near clients, collaborators, and specialized talent, reflecting Downtown Raleigh’s role as a major center for professional and knowledge based industries.
North Hills
1M SF
800K SF
600K SF
400K SF
200K SF
0 TECH
LEGAL
DESIGN, ENGINEERING & CONSTRUCTION
Source: CoStar Q1 2026, cluster analysis by DRA
FINANCE & INSURANCE
PROFESSIONAL SERVICES
MONTHLY PARKING RATES IN SELECT DOWNTOWNS
REAL ESTATE
HEALTH SCIENCES
Low End
High End
$500 $450 $400 $350 $300 $250 $200 $150 $100 $50
LE AT T SE
AU ST WA IN SH ING TO ND .C. BO ST ON PH IL A DE LP HIA
ER DE NV
TA MP A
LE SH VIL NA
E
AN TA AT L
LO
TT
AM CH
AR
RH DU
RA
LE IG H
0
Downtown Raleigh combines an urban office environment with monthly parking costs that remain highly competitive nationally. Employees have access to public and privately operated parking facilities throughout downtown rather than relying exclusively on parking controlled by individual office buildings. Monthly rates are well below those found in many major downtown office markets, reducing one of the traditional cost disadvantages associated with locating in a central business district.
Source: Secure Parking USA, The Car Park, Spot Hero, 717 Parking, LAZ Parking
NUMBER OF LUNCH SPOTS
Downtown Raleigh offers a concentration of restaurants and lunch options unmatched by nearby office submarkets. Employees can walk from major office buildings to a wide variety of places for lunch, coffee, informal meetings, and after work gatherings without needing to drive elsewhere. That abundance provides employees with greater choice during the workday while giving employers an amenity rich environment that makes downtown an attractive place to work.
150
153 100
50
0 DOWNTOWN RALEIGH
DOWNTOWN DURHAM
NORTH HILLS
Source: Downtown Raleigh Alliance, Downtown Durham Inc, Google Maps
RTP
36 | STATE OF DOWNTOWN RALEIGH
TALENT & INNOVATION Campbell School of Law
Only The Triangle, Atlanta, Boston, New York City, Los Angeles, Washington D.C., and Chicago have three tier1 research universities in one metropolitan region.
Downtown Raleigh sits at the center of one of the nation’s fastest growing pools of highly educated talent. The Raleigh metropolitan area’s population with a bachelor’s degree or higher grew more than 25% from 2019 to 2024, among the highest rates of peer markets.1 The region’s tech workforce has expanded rapidly as well, adding over 10,000 tech workers from 2021 to 2024.2 Downtown itself offers an especially concentrated talent base, with 66.3% of residents age 25 and older holding at least a bachelor’s degree.1 This combination of educational attainment, tech talent growth, and proximity to major universities gives downtown employers access to a deep and expanding workforce and strengthens Raleigh’s position as a center for technology, innovation, and knowledge-based industries.
UNIVERSITIES WITHIN 30 MILES OF DOWNTOWN RALEIGH SCHOOL NAME
ENROLLMENT
CAMPBELL LAW SCHOOL
552
SHAW UNIVERSITY**
1,141
WILLIAM PEACE UNIVERSITY
730
NORTH CAROLINA STATE UNIVERSITY*
38,442
MEREDITH COLLEGE
1,711
NC CENTRAL UNIVERSITY**
7,953
DUKE UNIVERSITY*
17,620
UNIVERSITY OF NORTH CAROLINA AT CHAPEL HILL*
31,733
ST. AUGUSTINE'S UNIVERSITY**
-
*Tier 1 research university - "R1 Doctoral University" per Carnegie Classification with very high research activity. ** HBCU - Historically Black College or University established with the intention of serving African-American students. Source: U.S. News & World Report
OFFICE & EMPLOYMENT | 37
CHANGE IN TOTAL TECH TALENT 2021-2024 IN SELECT MARKETS 2 12,000 10,000
10,220
8,000 6,000 4,000 2,000
DU
IN ST
RA
LE
IG H-
AU
RH
TT CH
AR
LO
VIL SH NA
AM
E
LE
LE AT T SE
PA TA M
AN TA AT L
R DE NV E
ON ST BO
PH IL A
DE L
WA SH ING TO ND .C.
PH IA
0
EDUCATIONAL ATTAINMENT OF RESIDENTS AGE 25+ 100%
BACHELOR'S AND ABOVE
90%
66.3%
80%
53.8%
35.6%
38.6%
ASSOCIATE'S DEGREE
70%
SOME COLLEGE/NO DEGREE
60%
HIGH SCHOOL DIPLOMA/GED
50% 40%
9-12TH GRADE/NO DIPLOMA
30%
LESS THAN 9TH GRADE
20% Source: American Community Survey 2024 Five-Year Estimates
10% 0 DOWNTOWN RALEIGH
RALEIGH
NORTH CAROLINA
UNITED STATES
CHANGE IN TOTAL POPULATION AGE 25+ WITH BA+ 2019-2024 IN SELECT METRO AREAS AUSTIN CHARLOTTE NASHVILLE
+25.4%
RALEIGH TAMPA ATLANTA DENVER SEATTLE PHILADELPHIA DURHAM BOSTON WASHINGTON D.C. SAN FRANCISCO 0
5%
10%
Source: American Community Survey 2024 Five-Year Estimates ESRI Business Analyst 2CBRE Tech Talent Report
1
15%
20%
25%
30%
35%
38 | STATE OF DOWNTOWN RALEIGH
EMPLOYERS & EMPLOYEES Downtown Raleigh plays a distinct role in The Triangle’s employment landscape, serving as both the center of government and a major hub for private sector employment. State and local government anchor downtown’s workforce and account for 44% of all occupied office space, while technology, legal services, design, engineering, construction, finance, and professional services form a diverse private sector employment base.1 Downtown Raleigh has more occupied office space dedicated to technology, legal services, and design and engineering than Downtown Durham or North Hills, demonstrating its role as a center for knowledge based employment within the region. These industry clusters bring companies and workers into a dense employment center supported by restaurants, housing, cultural destinations, and other amenities. As employers compete for skilled workers across the Triangle, Downtown Raleigh’s central location, access to regional talent, and distinctly urban environment provide an important advantage for companies seeking to attract and retain employees.
42.6K EMPLOYEES WITHIN 1 MILE OF DOWNTOWN'S CENTER 2
Photo Credit Gensler and Magda Biernat Photography CoStar 2ESRI Business Analyst
1
OFFICE & EMPLOYMENT | 39
LARGEST PRIVATE EMPLOYERS BY SQUARE FEET OCCUPIED COMPANY
SF
ADDRESS
INDUSTRY
RED HAT
347,930
100 E Davie St
Technology
DUKE ENERGY
258,600
411 Fayetteville St
Energy/Utility
PENDO
132,484
301 Hillsborough St
Technology
SMITH ANDERSON
118,161
150 Fayetteville St
Legal
STATE EMPLOYEES' CREDIT UNION
112,250
119 N Salisbury St
Banking & Finance
KIMLEY-HORN
84,824
421 Fayetteville St
Engineering & Architecture
PNC BANK
77,988
301 Fayetteville St
Banking & Finance
MCADAMS
54,560
621 Hillsborough St
Engineering & Architecture
ENVESTNET
54,490
621 Hillsborough St
Technology
RAPIDSCALE
53,775
301 Hillsborough St*
Technology
FIRST HORIZON BANK
51,982
1 Glenwood Ave
Banking & Finance
HDR
50,044
555 Fayetteville St
Engineering & Architecture
PARKER POE
50,000
301 Fayetteville St
Legal
POYNER SPRUILL LLP
50,000
301 Fayetteville St
Legal
WILLIAMS MULLEN
50,000
301 Fayetteville St
Legal
*RapidScale footprint includes space at both 301 Hillsborough Street and 621 Hillsborough Street
SHARE OF OCCUPIED OFFICE SPACE BY INDUSTRY
Source: CoStar
EMPLOYEES PER ACRE 160 140 120
146
100 80 60 40
GOVERNMENT (44%) TECH (13%) LEGAL (9%) A/E/C/P (7%) Source: CoStar
FINANCE + INSURANCE (6%) EDUCATION (6%) REAL ESTATE (3%)
PROFESSIONAL SERVICES (3%) OTHER (3%) HEALTH (1%)
20 0 DOWNTOWN CORE
NORTH HILLS
Source: ESRI Business Analyst
DOWNTOWN DURHAM
RTP AREA
© Bryan Regan
40 | STATE OF DOWNTOWN RALEIGH
SHOPPING & DINING D
owntown Raleigh’s storefront economy serves a growing residential population while remaining a major destination for dining, shopping, entertainment, and services. Downtown’s storefront economy
spans 1.85 million square feet, supporting a broad mix of businesses. From July 2025 through July 2026, 83 storefront businesses opened, adding to a mix that includes 310 restaurants and bars, 153 lunch spots, and 123 places to shop. Downtown’s dining scene received national recognition through the MICHELIN Guide’s first American South edition, which recognized eight restaurants, including two with Bib Gourmand distinctions. As the residential population and visitor activity grow, this storefront base will play an increasingly important role in serving neighborhood needs while maintaining Downtown Raleigh’s position as a regional destination.
SHOPPING & DINING | 41
+20
Net gain in storefront businesses since July 2025*
STOREFRONT BUSINESS OPENINGS BY YEAR 100 90 80 70 60 50 40 30 20 10 0 2020
2021
2022
2023
2024
2025
2026 YTD*
COMING SOON
Source: DRA *Through August 1, 2026
+83
310
153
123
1.85M
83.7%
STOREFRONT OPENINGS*
RESTAURANTS AND BARS
LUNCH SPOTS
PLACES TO SHOP
SQUARE FEET OF STOREFRONT SPACE
STOREFRONT OCCUPANCY RATE
Source: DRA
*July 1, 2025 through August 1, 2026
42 | STATE OF DOWNTOWN RALEIGH
ON THE MAP: STOREFRONT BUSINESS ACTIVITY
71 18
80
20 8 58 57 6 53
27
22 61
49 75
45 65 86 73
89 93
48
56
4 39
24
5 95104 70 29 25 32 19 63 12 2 46 60 52 3 38 15 59 7 105 81 94 78 43 74 9 109 114 28 111100 62 41 36 50 103 112
107
72 87 113 37
47
21 11 33 98 51
34
64 69 26 1
90
66 42
55 77 79 17 10 13 85 16 83 14 31 23 30 92 76
91110 102 82 108 101
96
88 99
54 35 106 68 84 Source: DRA
Openings, Expansions, and Relocations Coming Soon
97 44
SHOPPING & DINING | 43
STOREFRONT OPENINGS SINCE JULY 2025
COMING SOON
1
The Bike Library
43 Saigon Kitchen Viet Eatery
85
42nd Street Oyster Bar (Reopening)
2
The Thirsty Buffalo: Wings & Brews
44 Urban Olive in Transfer Co. Food Hall
86
83 South
3
Inka Grill
45 Fox Hole Coffee
87
Basic Brewing Company
4
Bubble Box Bar in Morgan Street Food Hall
46 The Merchant (Relocation)
88
Bob's Steak & Chop House at Omni Hotel
5
Casa Imperial Finery
47 K38 Baja Grill
88
Cora Kitchen & Cocktail Bar
6
The Row
48 Tous les Jours
90
Dormant Plant Parlor
7
Da Bubs
49 Smash Social Club
91
Empire Training Academy
8
Arcadia
50 Raleigh Unrushed
92
Evan Reid Furniture
9
NY Finest Grill & Deli
51
Garlic Bay at Hone-Sharpen
93
Gallicchio's Market & Eatery
10
Haven Herb Garden Bar
52
Carroll's Kitchen (Relocation)
94
Hibachi 88
11
Barrio Tacos
53
Sugar House
95
J’Adore Naemea
12
House of Rebellion
54 Campo Taco Co
96
Legends Nightclub (Relocation)
13
Besa Clothier
55
97
Little By Little
14
The Museum Shop - NC Museum of History
56 Bar Marigold
98
Madeleine
15
All-Embracing Barber & Beauty
57
99
Peter Millar Coffee Shop at Omni Hotel
16
Hangar Dreys
58 Centro at la Placita
100
Pikasso Swig
17
Cleopatra Ink
59 Rosebud Cocktail Lounge
101
Pins Mechanical Co.
18
Miami Rush
60 The Newsagent's
102
Pizzeria Toro
19
Wake County ABC Store
61
103
Plum
The Dirty V
La Casita at la Placita
Kenda Kist Jewelry (Relocation)
20 NC Hemp Shoppe
62 Pita Bowl
104
Rebellion Media
21
La Cucina Italiana
63 Casa Oro
105
Redbud Writing Project (Relocation)
22
Canna Craft
64 Sauna House
106
Rooted Yoga & Wellness
23
Manor & Vintage Estate Sales
65 The Jobe House
107
The Artist Lounge
24
Bitter Social
66 Victoria's Bridal Alterations
108
The Common Market
25
Downtown Barber Studio
67
109
The Fade Crew
26
Mood
68 Sunflower’s Café
110
The Swing Bays
27
Vino Wine Bar
69 Bright Side Books & Wine
111
The Third House
28
Amor
70 Old Ghosts Tattoo (Relocation)
112
Voodoo Brewing
29
Puppy Sphere
71
Happy You're Here Tattoo
113
Walk Your Plans
30 Triple Moon Tattoo
72
Oak City Smokes
114
Wolfside Urban Market
31
Super Rad Retro Lounge
73
Switchyards
32
Grog Alley
74
Raleigh Rydables
33
Hone-Sharpen
75
Cuya Cafe
34 The Prologue Pop-Up
76
Chipotle Mexican Grill
35
Benchwarmers Bagels at Rockway
77
Flea Mkt
36
LGBT Center of Raleigh
78
919 Faye Art Lab
37
Olé Sports Bar & Lounge
79 IKA Peruvian Nikkei
38
The Royal T Jewelers
80 Pet Wants
39
Leaf & Loaf
81
Kokoro Ramen & Izakaya
40 Jubala Coffee
82
Tone Yoga Club
41
Veloce Italian Market
83
Clouds Brewing
42
Jade Express
84 Drift Coffee + Kitchen
Source: DRA. Note: Table through August 15, 2026.
Bodega at la Placita
90%+ OF DOWNTOWN SHOPS ARE LOCALLY-OWNED AND INDEPENDENT
Source: DRA
44 | STATE OF DOWNTOWN RALEIGH
STOREFRONT INVENTORY Each year, Downtown Raleigh Alliance conducts a comprehensive inventory of downtown storefront space, providing a detailed account of occupancy at the individual storefront level and enabling long term analysis of how the market is changing. Downtown Raleigh contains 1.85 million square feet of storefront space, 83.72% of which is currently occupied or leased. Downtown Raleigh has added 60,327 square feet of new storefront space since the start of 2025 and 537,632 square feet in total since 2015. Over the past year, downtown added +10,104 square feet of occupied storefront space, with gains across three of its five districts. The Warehouse District recorded the largest increase, adding +10,470 square feet of occupied space, followed by Glenwood South and Moore Square. Glenwood South has the highest storefront occupancy rate at 93.30%.
CHANGE IN OCCUPIED STOREFRONT SF YEAR OVER YEAR 12K 10K 8K 6K 4K 2K 0 -2K
T NS
T +P OA RD AB SE
FA YE
TT
EV
ILL
ER
ES
SO
TR
EE
SQ UA RE RE MO O
H UT SO OD WO EN
GL
DO
WN
TO
WN
RA
WA RE HO
LE IG
US
E
H
-4K
Source: DRA © Bryan Regan
SHOPPING & DINING | 45
STOREFRONT INVENTORY RESULTS DOWNTOWN DISTRICT
OCCUPIED SF
VACANT SF
TOTAL INVENTORY
OCCUPANCY RATE
DOWNTOWN RALEIGH
1,549,728
301,373
1,851,101
83.72%
GLENWOOD SOUTH
560,329
40,249
600,578
93.30%
FAYETTEVILLE STREET
268,206
84,193
352,399
76.11%
WAREHOUSE DISTRICT
269,757
76,560
346,317
77.89%
MOORE SQUARE
208,366
33,559
241,925
86.13%
SEABOARD + PERSON
177,065
49,241
226,306
78.24%
Source: DRA
Total Storefront SF by Block 0 SF Less than 12,500 SF 12,500 SF - 24,999 SF 25,000 SF - 49,999 SF More than 50,000 SF
The Bike Library
46 | STATE OF DOWNTOWN RALEIGH
DINING AND NIGHTLIFE Downtown Raleigh’s dining and nightlife scene is gaining national recognition while offering one of the region’s largest concentrations of restaurants, bars, and entertainment venues. The MICHELIN Guide’s first American South edition recognized eight downtown establishments, including two with Bib Gourmand distinctions. This builds on 26 James Beard Award nominations for downtown restaurants and chefs since 2010. Downtown is home to more than 300 restaurants and bars offering a wide range of cuisines and experiences.1 The dining and nightlife economy continues to expand. Of the downtown districts, Glenwood South has seen the largest expansion of dining and nightlife establishments since 2020, followed by Fayetteville Street and the Warehouse District. Continued growth and culinary recognition have elevated Downtown Raleigh’s profile as a dining destination.
DINING AND NIGHTLIFE MAP 1 Opened 2020 to Present
Opened 2020 to Present
Opened Pre 2020
Opened Pre 2020
MICHELIN RECOGNIZED THE PIT AUTHENTIC BARBECUE 328 W Davie St SAM JONES BBQ 502 W Lenoir St POOLE’S 428 S McDowell St ST. ROCH FINE OYSTER + BAR 223 S Wilmington St BREWERY BHAVANA 218 S Blount St CRAWFORD AND SON 618 N Person St
STANBURY 938 N Blount St
DINING AND NIGHTLIFE BY YEAR OPENED 1
Opened Pre 2020
Opened 2020 to Present
48
GLENWOOD SOUTH
23
FAYETTEVILLE STREET
20
WAREHOUSE
15
MOORE SQUARE
14
SEABOARD + PERSON ST
12
DOWNTOWN NON-DISTRICT
4
CAPITAL 0 DRA
1
10
20
30
40
50
60
70
80
90
100
© Photo by Anna Carlson Media courtesy of Brewery Bhavana
JOLIE 620 N Person St
SHOPPING & DINING | 47
26 JAMES BEARD AWARD NOMINATIONS SINCE 2010
8 MICHELIN RECOGNIZED RESTAURANTS DINING AND NIGHTLIFE ESTABLISHMENTS
244 RESTAURANTS 1
112 BARS, CLUBS, AND LIVE MUSIC VENUES 1 Brewery Bhavana
48 | STATE OF DOWNTOWN RALEIGH
DINING AND NIGHTLIFE Downtown Raleigh draws millions of individual visitors each year for dining, nightlife, entertainment, and events, generating significant activity well beyond the traditional workday. In 2025, downtown recorded 10.9 million evening visitor visits between 6pm and midnight, a +5.8% increase year over year.1 This marked the highest annual total since at least 2019 and surpassed pre-pandemic levels. This evening activity supports a large hospitality economy, with downtown restaurants and bars generating more than $351 million in estimated food and beverage sales from July 2025 through June 2026.2 Glenwood South remains the largest share of this activity, accounting for 37% of downtown food and beverage sales, while Fayetteville Street, the Warehouse District, and Moore Square each contribute significant percentages.2 The scale and geographic distribution of evening activity demonstrate Downtown Raleigh’s role as a regional destination where restaurants and nightlife draw people from across the Triangle.
© Brian Strickland
ESTIMATED FOOD AND BEVERAGE SALES $90M $80M $70M $60M $50M $40M $30M $20M $10M
20
20 20 Q1 20 20 Q2 20 20 Q3 20 20 Q4 21 20 Q1 21 20 Q2 21 20 Q3 21 20 Q4 22 20 Q1 22 20 Q2 22 20 Q3 22 20 Q4 23 20 Q1 23 20 Q2 23 20 Q3 23 20 Q4 24 20 Q1 24 20 Q2 24 20 Q3 24 20 Q4 25 20 Q1 25 20 Q2 25 20 Q3 25 20 Q4 26 20 Q1 26 Q2
0
Source: Wake County Tax Administration © Hoffman Media
TOTAL EVENING VISITOR VISITS © Angie Mosier
3,000,000 2,500,000 2,000,000 1,500,000 1,000,000 500,000
20 20 Q2 20 20 Q3 20 20 Q4 21 20 Q1 21 20 Q2 21 20 Q3 21 20 Q4 22 20 Q1 22 20 Q2 22 20 Q3 22 20 Q4 23 20 Q1 23 20 Q2 23 20 Q3 23 20 Q4 24 20 Q1 24 20 Q2 24 20 Q3 24 20 Q4 25 20 Q1 25 20 Q2 25 20 Q3 25 20 Q4 26 20 Q1 26 Q2
20
20
20
Q1
0
Source: Placer.ai Placer.ai 2Wake County Tax Administration
1
SHOPPING & DINING | 49
DISTRIBUTION OF FOOD AND BEVERAGE SALES BY DISTRICT
© Hoffman Media
© Joe Bruno
GLENWOOD SOUTH (37%)
MOORE SQUARE (14%)
FAYETTEVILLE STREET (22%)
SEABOARD/PERSON STREET (10%)
WAREHOUSE (15%)
CAPITAL (2%)
Note: July 2025 to June 2026. Source: Wake County Tax Administration
10.9M TOTAL EVENING VISITS TO DOWNTOWN 2025 +5.8% INCREASE TOTAL EVENING VISITS TO DOWNTOWN YEAR OVER YEAR 1 © Hoffman Media
© David Kuhn
$351M ESTIMATED FOOD AND BEVERAGE SALES IN DOWNTOWN JULY 2025 - JUNE 2026 2
$129M ESTIMATED FOOD AND BEVERAGE SALES IN GLENWOOD SOUTH JULY 2025 - JUNE 2026 2
1
50 | STATE OF DOWNTOWN RALEIGH
GOODS AND SERVICES © Bryan Regan
Glenwood South Tailors
123
133
2
11
90%
RETAIL BUSINESSES
SERVICE BUSINESSES
GROCERY STORES
RETAIL AND SERVICE BUSINESSES COMING SOON
OF DOWNTOWN SHOPS LOCALLY-OWNED AND INDEPENDENT
Downtown Raleigh is home to a diverse mix of small businesses offering retail goods and services to residents, employees, and visitors. Specialty retailers, apparel and home goods shops, art galleries, salons, personal care businesses, and other service providers create opportunities to shop and take care of everyday needs within a walkable urban environment. Many of these establishments are independent and locally owned, bringing distinctive products, services, and experiences to the downtown market. As downtown grows as a residential neighborhood, this mix of businesses plays an important role in serving the daily needs of residents while contributing to the variety and character that make downtown a destination for the broader community. Source: DRA
EXISTING RETAIL GOODS AND SERVICES BY SUBCATEGORY
Services
Goods
HAIR + BEAUTY GIFTS + SPECIALTY FITNESS MASSAGE, SPA + WELLNESS TATTOO + PIERCING ART GALLERIES + STUDIOS APPAREL GENERAL MEDICAL, DENTAL +EYE BANKS + ATMS APPAREL VINTAGE JEWELRY APPAREL WEDDING HOME, GARDEN + PLANTS CONVENIENCE STORES BOOK STORES GROCERY STORES
0
5
10
15
20
25
30
35
40
45
SHOPPING & DINING | 51
FOOT TRAFFIC Downtown Raleigh’s population shifts throughout the day and week as residents, workers, and visitors contribute to its unique rhythm. During weekdays, inbound commuting employees make up a large portion of the population from 9am to 5pm, reflecting downtown’s role as a major employment hub. In the late afternoon and evening, visitors become more prominent, contributing to downtown’s nightlife and cultural scene. Activity peaks on weekends, with an average daily population of more than 121,000 on Saturdays, including over 104,000 visitor visits. Saturday activity builds throughout the evening and reaches its highest level around 11pm. Meanwhile, downtown residents provide a steady presence throughout the week, anchoring daily life as commuters and visitors come and go. This ebb and flow reflects Downtown Raleigh’s multifaceted role as a business center, residential neighborhood, and regional destination.
AVERAGE DAILY POPULATION BY DAY
Residents
Inbound Commuters
Visitors
120K 100K 80K 60K 40K 20K 0 MONDAY
TUESDAY
WEDNESDAY
THURSDAY
FRIDAY
SATURDAY
SUNDAY
AVERAGE POPULATION BY HOUR BY DAY 40K 35K 30K 25K 20K 15K 10K 5K
Source: Placer.ai
PM :00 11
M
M
PM :00 10
0P 9:0
0P 8:0
M 0P 7:0
M
M 0P 6:0
0P 5:0
M 0P 4:0
M 0P 3:0
M 0P 2:0
M 0P 1:0
PM :00 12
AM
M
AM :00 11
:00 10
0A 9:0
M 0A 8:0
M 0A 7:0
6:0
0A
M
0
52 | STATE OF DOWNTOWN RALEIGH
© Alyson Boyer Rode/visitRaleigh.com
ARTS, CULTURE & TOURISM D
owntown Raleigh is the cultural center of the city, bringing together museums, performing arts, history, public art, festivals, and all kinds of entertainment. Major state museums and historic
attractions are complemented by local art galleries, theaters, music venues, and cultural organizations, creating a range of experiences unmatched elsewhere in the Triangle. Festivals, performances, exhibitions, and community events further establish downtown as a regional destination and make arts and culture central to its identity and visitor economy. Major investments will build on this foundation, including the Raleigh Convention Center expansion, Red Hat Amphitheater’s new permanent location, and a new Omni Convention Hotel, expanding downtown’s capacity to host visitors, events, and entertainment.
ARTS, CULTURE & TOURISM | 53
22.5M
Total Visitor Visits to Downtown July 2025-June 20261
TOTAL MONTHLY VISITOR VISITS 2.4M 2.2M 2M 1.8M 1.6M 1.4M 1.2M 1M 800K 600K 400K 200K 0 2020
2021
2022
2023
2024
2025
2026
Note: Only visits from people that do not live or work in downtown counted Source: Placer.ai
180+
5.1M
18
1,454
943
704
PUBLIC ART INSTALLATIONS 2
UNIQUE DOWNTOWN VISITORS PER YEAR 1
PERFORMING ARTS AND CONCERT VENUES 2
EXISTING HOTEL ROOMS 2
HOTEL ROOMS UNDER CONSTRUCTION OR RENOVATION 2
HOTEL ROOMS PLANNED OR PROPOSED 2
Placer.ai 2DRA
1
54 | STATE OF DOWNTOWN RALEIGH
INVESTMENTS IN TOURISM Downtown Raleigh is a primary driver in the region’s tourism economy, offering the highest concentration of hotels, restaurants, and cultural institutions alongside vibrant arts and entertainment venues. A series of major investments will reshape Downtown Raleigh’s convention, entertainment, and hospitality landscape over the coming years. The Raleigh Convention Center expansion will increase capacity for conventions and events, Red Hat Amphitheater’s permanent location will anchor major outdoor performances, and the 601-room Omni convention hotel will add lodging directly alongside these destinations. Downtown Raleigh has fewer hotel rooms within walking distance of the convention center than most peer markets, limiting its ability to compete for convention business. Combined with additional hotel development underway and planned, these projects will reinforce one another by bringing more visitors downtown and giving them more reasons to stay. The result will be a more connected tourism and entertainment district supporting year-round activity and visitor spending across downtown.
Convention Center Expansion Construction on the expanded Raleigh Convention Center is expected to begin this winter, with completion planned for 2029. The $355 million project will add approximately 300,000 square feet, including 80,000 square feet of event space and 30 meeting rooms. Paired with new hotel development, the expansion will increase Downtown Raleigh’s capacity to host major conventions and attract more visitors.
Red Hat Amphitheater The new Red Hat Amphitheater has topped out and is on track to open in time for the 2027 outdoor concert season, with capacity for more than 6,000 guests. Construction includes closing a block of South Street while improving surrounding streetscapes to maintain pedestrian access.
ARTS, CULTURE & TOURISM | 55
HOTEL DEVELOPMENT PIPELINE PROJECT NAME
COMPLETED
ROOMS
RESIDENCE INN
2017
175
GUEST HOUSE
2018
8
HEIGHTS HOUSE HOTEL
2020
9
LONGLEAF HOTEL
2020
56
THE CASSO, RALEIGH
2020
126
AC HOTEL BY MARRIOTT
2021
147
HYATT HOUSE SEABOARD
2024
149
TEMPO & HOMEWOOD
2024
261
MARRIOTT TOWNPLACE
N/A
138
HOTEL INDIGO (RENOVATION)
N/A
204
OMNI CONVENTION HOTEL
N/A
601
BOUTIQUE HOTEL
N/A
90
THE DEPOT HOTEL
N/A
170
300 HILLSBOROUGH
N/A
180
CITY GATEWAY HOTEL
N/A
264
RECENTLY COMPLETED
UNDER CONSTRUCTION
Omni Raleigh Convention Hotel
PLANNED/PROPOSED
Construction is now well underway on the 601-room Omni convention hotel, located on Fayetteville Street between the Raleigh Convention Center and Martin Marietta Center for the Performing Arts. The new hotel will significantly expand room capacity near the convention center and support Raleigh’s ability to attract larger conventions and events.
Source: DRA
HOTEL ROOMS IN RANGE OF CONVENTION CENTER Existed Before 2015
Added 2015 to Present
Under Construction
Planned or Proposed
9,000 8,000 7,000 6,000 5,000 4,000 3,000 2,000 1,000 0 PROVIDENCE
TAMPA
PITTSBURGH
RALEIGH
COLUMBUS
Note: Hotel rooms within .3 mile radius of center of each convention center Source: CoStar
CHARLOTTE
SEATTLE
DENVER
LOUISVILLE
AUSTIN
NASHVILLE
56 | STATE OF DOWNTOWN RALEIGH
HOTEL MARKET AND TOURISM Visitors from across the region and country support a growing tourism economy centered in Downtown Raleigh. Major attractions, cultural institutions, conventions, dining, and entertainment venues draw visitors from far and wide throughout the year, with Charlotte representing the largest source of visits from outside the RaleighDurham area. This demand supports a high performing hotel market, with an average daily room rate of $204 and revenue per available room of $141 between June 2025 and July 2026, both exceeding Wake County, state, and national averages. Hotel room sales exceeded $140 million in 2025, up +4.6% year over year, reflecting continued demand for Downtown Raleigh’s hotels.
TOTAL VISITOR VISITS TO DOWNTOWN RALEIGH BY HOME METRO CHARLOTTE WASHINGTON D.C. NEW YORK CITY ATLANTA VIRGINIA BEACH PHILADELPHIA BOSTON BALTIMORE MIAMI CHARLESTON CHICAGO 0
10,000
20,000
30,000
40,000
50,000
60,000
70,000
80,000
90,000 100,000 110,000
Credit CN Hotels
Source: Placer.ai. Note: geography used is CBSA and only visits occurring between June 2025 and May 2026 included
HOTEL MARKET PERFORMANCE COMPARED
Average Daily Room Rate
Revenue per Available Room
$220 $200 $180
$204
$160 $140 $120
$141
$100 $80 $60 $40 $20 0 DOWNTOWN Source: CoStar Group for GRCVB
WAKE COUNTY
NORTH CAROLINA
UNITED STATES
ARTS, CULTURE & TOURISM | 57
HOTEL INVENTORY MAP + MAJOR ATTRACTIONS
NC MUSEUM OF NATURAL SCIENCES
THE LONGLEAF HOTEL
MARBLES KIDS MUSEUM
HEIGHTS HOUSE HOTEL
RALEIGH CONVENTION CENTER
Hotel Existing
Tempo + Homewood Suites by Hilton
MICHELIN Selected Hotel Hotel Under Construction Hotel Planned or Proposed Major Attractions
GUEST HOUSE RALEIGH
HOTEL ROOM SALES REVENUE $40M $35M $30M $25M $20M $15M $10M $5M
Q2 26
Q1
20
26
Q4
Source: Wake County Tax Administration Photo Credits: Heights House Hotel - David Kuhn / visitraleigh; Guest House Raleigh courtesy of Guest House Raleigh; The Longleaf Hotel - Antionne King
20
25
Q3
20
20
25
Q2 25
Q1
20
25
Q4
20
24
Q3
20
24
Q2
20
24
Q1
20
24
Q4
20
23
Q3
20
23
Q2
20
23
Q1
20
23
Q4
20
22
Q3
20
22
Q2
20
22
Q1
20
22
Q4
20
21
Q3
20
21 20
20
21
Q2
0
Credit LS3P and SmithGroup
58 | STATE OF DOWNTOWN RALEIGH
NC Museum of History Renovation
ARTS AND CULTURE Major Downtown Attractions Downtown Raleigh is home to some of the region’s most visited attractions, drawing residents and visitors throughout the year. Major destinations include the NC Museum of Natural Sciences, Marbles Kids Museum, performing arts venues, and historic sites. Major investments are underway in two leading cultural attractions, including a $225 million renovation of the NC Museum of History and an expansion of Marbles Kids Museum. These investments will create new experiences for visitors of all ages while reinforcing Downtown Raleigh’s role as a center for arts, culture, and recreation in the Triangle.
TOP DOWNTOWN ATTRACTIONS PLACE
VISITS
RALEIGH CONVENTION CENTER
794,640
NC MUSEUM OF NATURAL SCIENCE + RESEARCH CENTER
617,225
CITY MARKET
516,403
MARBLES KIDS MUSEUM*
421,346
MORGAN STREET FOOD HALL
350,770
MARTIN MARIETTA CENTER FOR THE PERFORMING ARTS
284,266
GIPSON PLAY PLAZA
266,769
RED HAT AMPHITHEATER
207,464
TRANSFER CO FOOD HALL
184,834
NC MUSEUM OF HISTORY (UNDER RENOVATION)**
133,919
MOORE SQUARE
123,887
Source: Placer.ai, Note: Based on cell phone visitation data; does not count children *Attendance Numbers provided by Marbles Kids Museum; includes children **2024 attendance numbers
ARTS, CULTURE & TOURISM | 59
Downtown Festivals and Events Downtown Raleigh is known for its robust calendar of events and outdoor festivals that draw visitors and support local businesses. Between July 2025 and June 2026, downtown events welcomed 1.2 million attendees, including 192,000 for the Carolina Hurricanes’ Stanley Cup Parade in June 2026.
TOTAL OUTDOOR EVENT ATTENDEES JULY 2025 - JUNE 2026 350K
300K
250K
200K
150K
100K
50K
0 JULY
AUG
SEPT
OCT
NOV
DEC
JAN
FEB
MAR
APR
MAY
JUNE
Source: City of Raleigh
PUBLIC ART INSTALLATIONS BY DISTRICT 48
FAYETTEVILLE STREET
43
WAREHOUSE
40
MOORE SQUARE
33
GLENWOOD SOUTH
11
CAPITAL
6
SEABOARD + PERSON STREET 0 Source: DRA
5
10
15
20
25
30
35
40
45
50
© Josh Lavallee
60 | STATE OF DOWNTOWN RALEIGH
CONNECTIVITY & GREENSPACE D
owntown Raleigh is setting a new standard for urban greenspace. With 771 acres of greenspace within two miles of downtown’s center, including Dorothea Dix Park and the recently opened
Gipson Play Plaza, the city is redefining what it means to live in a vibrant, walkable urban center. Downtown Raleigh leads most US downtowns in total acres of greenspace within two miles of downtown center. Investments in green infrastructure and outdoor gathering spaces reflect our communities commitment to make nature an essential part of daily life. Downtown is also at the center of a wave of mass transit investments that will ensure Downtown Raleigh is the most connected part of the Triangle.
CONNECTIVITY & GREENSPACE | 61
#2
Most Climate Resilient City - Raleigh Architectural Digest 2023
ACRES OF GREENSPACE WITHIN TWO MILES OF DOWNTOWN CENTER 1,200
Acres of Greenspace
1,000 800 600 400 200
IN CH IC CIN AGO CIN NA MI TI NN EA PO LI RIC S HM ON D BO ST ON CH AR LO PO T TE RT PH L AND IL A DE LP HIA AT LA NT A NA SH VIL LE DU RH AM TA MP A DE NV SA ER NF RA NC ISC O SE AT TL E
ST
IGH
AU
LE
RA
WA S
HIN G
TO
ND
C
0
Source: DRA, TPL ParkServe
1
771
5
121
90
20
158
ACRES OF GREENSPACE WITHIN 2 MILES OF DOWNTOWN 1
ROUND TRIPS DAILY TO CHARLOTTE BY TRAIN 2
MILES OF GREENWAY IN THE CITY OF RALEIGH 3
NONSTOP DESTINATIONS OUT OF RDU 4
MILES OF BUS RAPID TRANSIT PLANNED WITH DOWNTOWN AT THE CENTER5
MILES OF ONSTREET BICYCLE LANES IN CITY OF RALEIGH 3
DRA, TPL ParkServe 2Amtrak 3City of Raleigh 4RDU International Airport 5GoRaleigh
62 | STATE OF DOWNTOWN RALEIGH
ON THE MAP: PARKS AND GREENSPACES Greenways Streams Trees Downtown HALIFAX PARK
FRED FLETCHER PARK
State Gov. Complex Parks & Greenspaces Plazas & Amphitheaters
MORDECAI HISTORIC PARK
SMOKY HOLLOW PARK
WILLIAM PEACE UNIVERSITY
Campuses
OAKWOOD CEMETERY
HALIFAX MALL
NC FREEDOM PARK
SAINT MARY'S SCHOOL
BICENTENNIAL PLAZA
PULLEN PARK
STATE CAPITOL
CITY CEMETERY UNION STATION PLAZA
NASH SQUARE
MOORE SQUARE
RED HAT AMPHITHEATER
CITY PLAZA
LICHTIN PLAZA
SHAW UNIVERSITY CHAVIS PARK
DIX PARK
MT. HOPE CEMETERY
CONNECTIVITY & GREENSPACE | 63
INVESTMENTS IN GREENSPACE Investing in park space big and small, Downtown Raleigh has a strong system of existing parks and greenspace including historic squares, an expansive government mall, recreation fields, greenways, as well as a new destination park on the way. Recent and upcoming investment in Downtown Raleigh’s parks will greatly enhance downtown’s amenities for residents, employees, and visitors alike. DOROTHEA DIX PARK
JOHN CHAVIS MEMORIAL PARK
Major investment continues to expand the range of experiences available at Dorothea Dix Park. The recently completed $70 million Gipson Play Plaza transformed 18.5 acres with the Southeast’s largest adventure playground, water play, gardens, and gathering spaces. The park has also welcomed hundreds of thousands of visitors to see five giant trolls created by internationally renowned artist Thomas Dambo. Constructed from reclaimed wood and tucked throughout the landscape, the trolls offer a unique public art experience while encouraging visitors to explore the park and consider environmental stewardship.
Located just east of downtown, this historic 28-acre park recently underwent an $18 million renovation, completed in June 2021. The park includes a half mile section of the Capital Area Greenway Trail as well as a historic carousel, water feature, large playground, community center with a full-size indoor gym, elevated walking track, and numerous new amenities. Since opening in 2022, Raleigh voters approved further updates, including development of a new aquatic center.
NORTH CAROLINA FREEDOM PARK Downtown’s newest park is dedicated to the African American experience and struggle for freedom in North Carolina. The park is located in the Capital District between the State Legislature and the Governor’s Mansion. The one-acre park was designed by internationally recognized architect Phil Freelon.
CHAVIS-DIX STROLLWAY The Chavis-Dix Strollway is a plan to connect Chavis Park, Downtown Raleigh, and Dorothea Dix Park. This project will connect southeast and southwest Raleigh, allowing people to bike or walk the 1.5 miles between the two parks and downtown while learning about historically significant sites throughout Raleigh.
Nearby, improvements to the John P. “Top” Green African American Cultural Center and implementation of the South Park Heritage Trail will highlight the area’s African American community and secure the park’s listing on the National Park Service’s National Register of Historic Places.
SMOKY HOLLOW PARK The City of Raleigh is advancing plans for a new urban park in Downtown Raleigh. The approved plan includes environmental remediation, pathways, plazas, natural spaces, native landscaping, improvements to the Pigeon House Branch stream channel and floodplain, and constructed wetlands. The project will transform the site into a new natural and recreational amenity in northern downtown. Construction is expected to begin in 2027 and the park is anticipated to open in 2028.
64 | STATE OF DOWNTOWN RALEIGH
INVESTMENTS IN CONNECTIVITY S-LINE Plans are underway for a new high-speed rail line connecting Raleigh to Richmond. The project was awarded a $1.1 billion grant in 2024 to begin design work, acquisition, and construction of the line. The S-Line will enhance mobility options and strengthen connections within our region, making it easier for people to live, work, and visit in a growing, connected urban center.
RALEIGH UNION STATION BUS FACILITY Raleigh Union Station Bus Facility, or more commonly known as RUS Bus, opened last year adjacent to Union Station. The new multimodal hub will serve both GoTriangle and GoRaleigh bus routes with six off-street bays, two layover spaces, comfortable waiting areas, public restrooms, bike parking, lockers, and digital wayfinding. The new facility strengthens downtown’s connectivity by linking regional transit systems with existing intercity rail services.
CONNECTIVITY & GREENSPACE | 65
© Flyboy Media
BUS RAPID TRANSIT Construction of Raleigh’s first bus rapid transit (BRT) line is now underway. The first BRT line will run along New Bern Avenue between downtown and WakeMed. Construction is anticipated over the next several years. The Eastern BRT route along New Bern Avenue is the first of four routes coming to Raleigh over the next decade with downtown at the center.
RALEIGH ACTIVE MOBILITY PLAN: THE BIG JUMP Over the next five years, Raleigh will make major investments in downtown bicycle infrastructure through the Raleigh Active Mobility Plan: The Big Jump. The plan will upgrade existing facilities while adding new separated bicycle facilities along key corridors, including Peace Street, Morgan Street, and Lenoir Street. These improvements will create safer, more comfortable connections into and across downtown while expanding the network available to people traveling by bike.
RDU INTERNATIONAL AIRPORT
New Separated Bikeway New Neighborhood Bikeway Priority Upgrade Current Bike Facility
RDU is undergoing major capital improvements to support long-term growth, including a new runway and terminal upgrades. These investments will enhance passenger experience and regional connectivity, ensuring the airport keeps pace with demand as the region continues to grow.
66 | STATE OF DOWNTOWN RALEIGH
2026 BOARD, STAFF & ACKNOWLEDGMENTS OFFICERS + EXECUTIVE COMMITTEE
BOARD OF DIRECTORS
Mike Munn Board Chair McAdams Company
Nicholle Allen-Steele K&L Gates
Rebecca Quinn-Wolf Vice Chair/Chair-elect PNC Skip Hill Immediate Past Chair Highwoods Properties Emily Williams Treasurer Truist Britt Thomas Secretary Marbles Kids Museum
Tiffany Barrier CBRE Natalie Batten Accenture Chris Budnick Healing Transitions Pete Byers AC Hotel Raleigh Downtown Adrienne Cole Raleigh Chamber* Matt Coleman The Davie
ACKNOWLEDGMENTS
Yvette Holmes Southeast Raleigh Promise Kathleen Makena Makena Skin Care LT McCrimmon APCO Worldwide Evan Raleigh City of Raleigh* Chris Roberts LS3P Lauren Romer Romer and Company Gregg Sandreuter HM Partners
Joseph ‘Bo’ Dempster, Jr. Legal Counsel Poyner Spruill
Janet Cowell City of Raleigh*
Stacey Buescher At-Large Kane Realty Corp.
Denny Edwards Greater Raleigh Convention & Visitors Bureau*
Felicia Trujillo Food Seen
Carly Jones At-Large Artspace
Mark Edwards NC Department of Administration*
Taylor Vanden Hoek Atomic Object
David Ellis Wake County*
Owen Williams Williams Realty & Building
Tia McLaurin At-Large Downtown Resident (511 Faye) Derrick Remer At-Large Duke Energy Bill King President & CEO* DRA
Jamie Schwedler Parker Poe
CBRE City of Raleigh: Planning & Development; Urban Projects Group; Parks and Recreation; Public Works; Office of Sustainability; Office of Transportation Planning; Special Events Office; Community & Small Business Development; Parking; Transportation; Urban Forestry CoStar GoRaleigh and GoTriangle Greater Raleigh Convention and Visitors Bureau JLL Monarch Realty National Science Foundation North Carolina Sustainable Energy Association Placer.ai Raleigh Chamber Raleigh Convention Center Raleigh-Durham Airport Authority Ray Aull, City of Raleigh STR Global Triangle MLS, Inc. U.S. Bureau of Labor Statistics U.S. Census Bureau Wake County: GIS, Tax Administration Department Wake County Economic Development
For errata visit: DowntownRaleigh.org Anna Grace FitzGerald Copperline Plant Company
*Ex-Officio
Kassia Gibbs Empire Properties Pranav Harish Bricks & Minifigs LEGO Store
PROFESSIONAL STAFF Roxanne Coffey Office Manager
Bill King President & CEO
Ileana Rodriguez VP of Communications & Community Relations
Nicole Drake Events Project Manager
Elizabeth Martini VP of Finance & Operations
Will Gaskins VP of Economic Development & Planning
Lucy McInnis Director of Creative Programming & Activations
Xenna Smith Digital Communications Manager
Kimberley Jones Executive Assistant & Special Projects Manager
John Nelson Safety Manager
Kate Turley Small Business Program Manager
Gabriel Schumacher Director of Research
This report was authored by Will Gaskins and Gabriel Schumacher. The layout and design were created by Stacey Simeone. www.staceysimeone.com
THANK YOU TO DRA’S ANNUAL INVESTORS LEADERS
VISIONARIES
CHAMPIONS
ADVOCATES
SUPPORTERS AT&T
Clancy & Theys
Cleanest Restaurant Group
Williams Building & Realty
THANK YOU TO THE CITY OF RALEIGH FOR PARTNERSHIP AND SUPPORT.
DRA MISSION: Advancing the vitality of Downtown Raleigh for everyone.
PRODUCED BY:
333 Fayetteville St., Ste 1150 • Raleigh, NC 27601 • DowntownRaleigh.org • info@downtownraleigh.org • 919.832.1231 PHOTO BY MATT ROBINSON - RALEIGHSKYLINE.COM