DOWNTOWN RALEIGH
SUMMARY AND HIGHLIGHTS:
There are 14 developments under construction that will deliver 601 residential units, 392,000 square feet of office space, 67,356 square feet of retail space, and 943 hotel rooms.1 An additional 38 projects are planned or proposed, which would add 6,182 residential units, 322,892 square feet of office space, 224,668 square feet of retail space, and 704 hotel rooms.1 Two projects delivered in Q1: the IDYLE townhomes, which added 10 units, and Lichtin Plaza at the Martin Marietta Center for the Performing Arts. 1
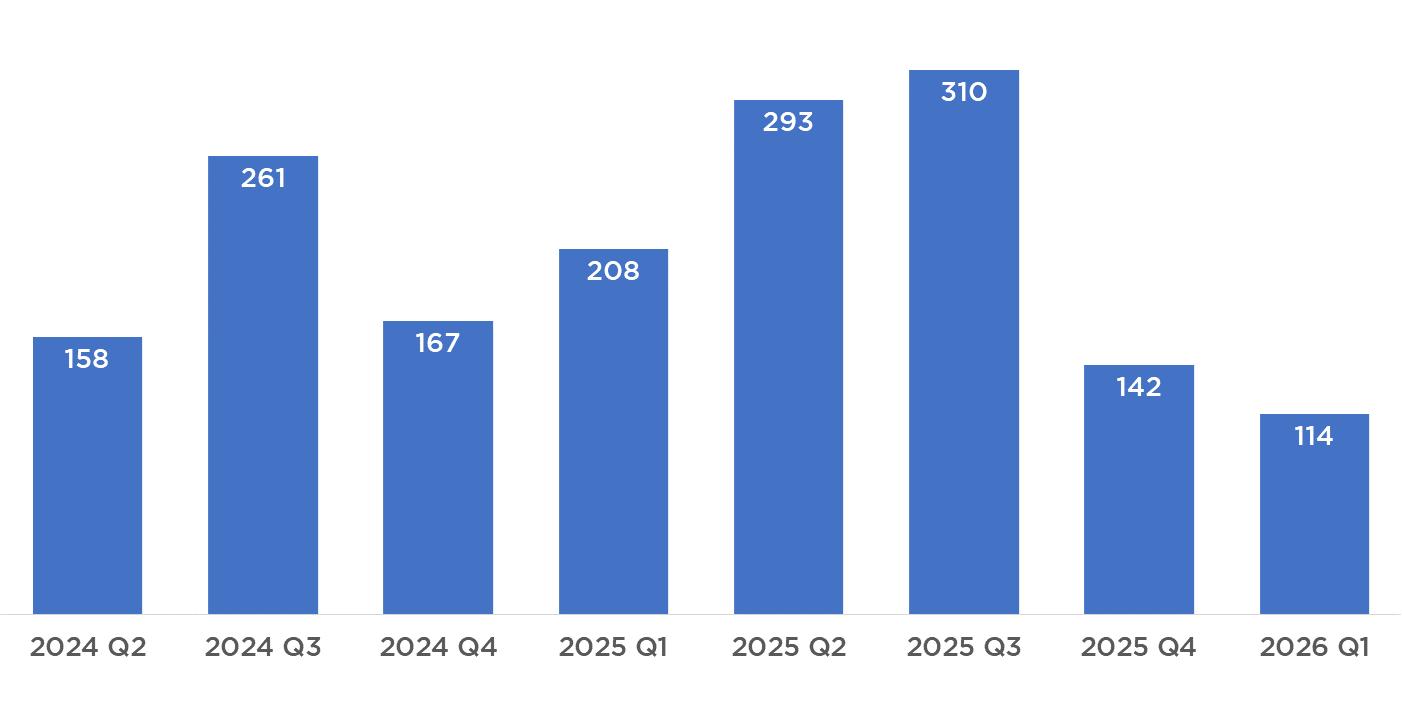
Downtown Raleigh continues to absorb a recent wave of apartment deliveries, with 1,653 units absorbed since Q2 2024, including 114 in Q1 2 There are 601 units under construction across four projects, with another 6,182 planned or proposed.1 Stabilized occupancy is 89.7%, excluding recent deliveries, and average asking rent is $1,852 per unit.2
Downtown Raleigh recorded modest negative Class A net absorption of -14,088 square feet in Q1 2026, though net absorption over the past 12 months remains positive at +91,326 square feet 3 Average asking rent rose to $41.49 per square foot, up from $39.38 one year earlier.3 The overall direct occupancy rate is 86.9%, the highest among Triangle submarkets.3
14
PROJECTS UNDER CONSTRUCTION1
Q1 2026
601 RESIDENTIAL UNITS IN CONSTRUCTION1 Q1 2026
+1,653 APARTMENT UNITS ABSORBED2 Q2 2024-Q1 2026
1DRA 2CoStar
3JLL
*Stabilized occupancy does not include recently completed projects
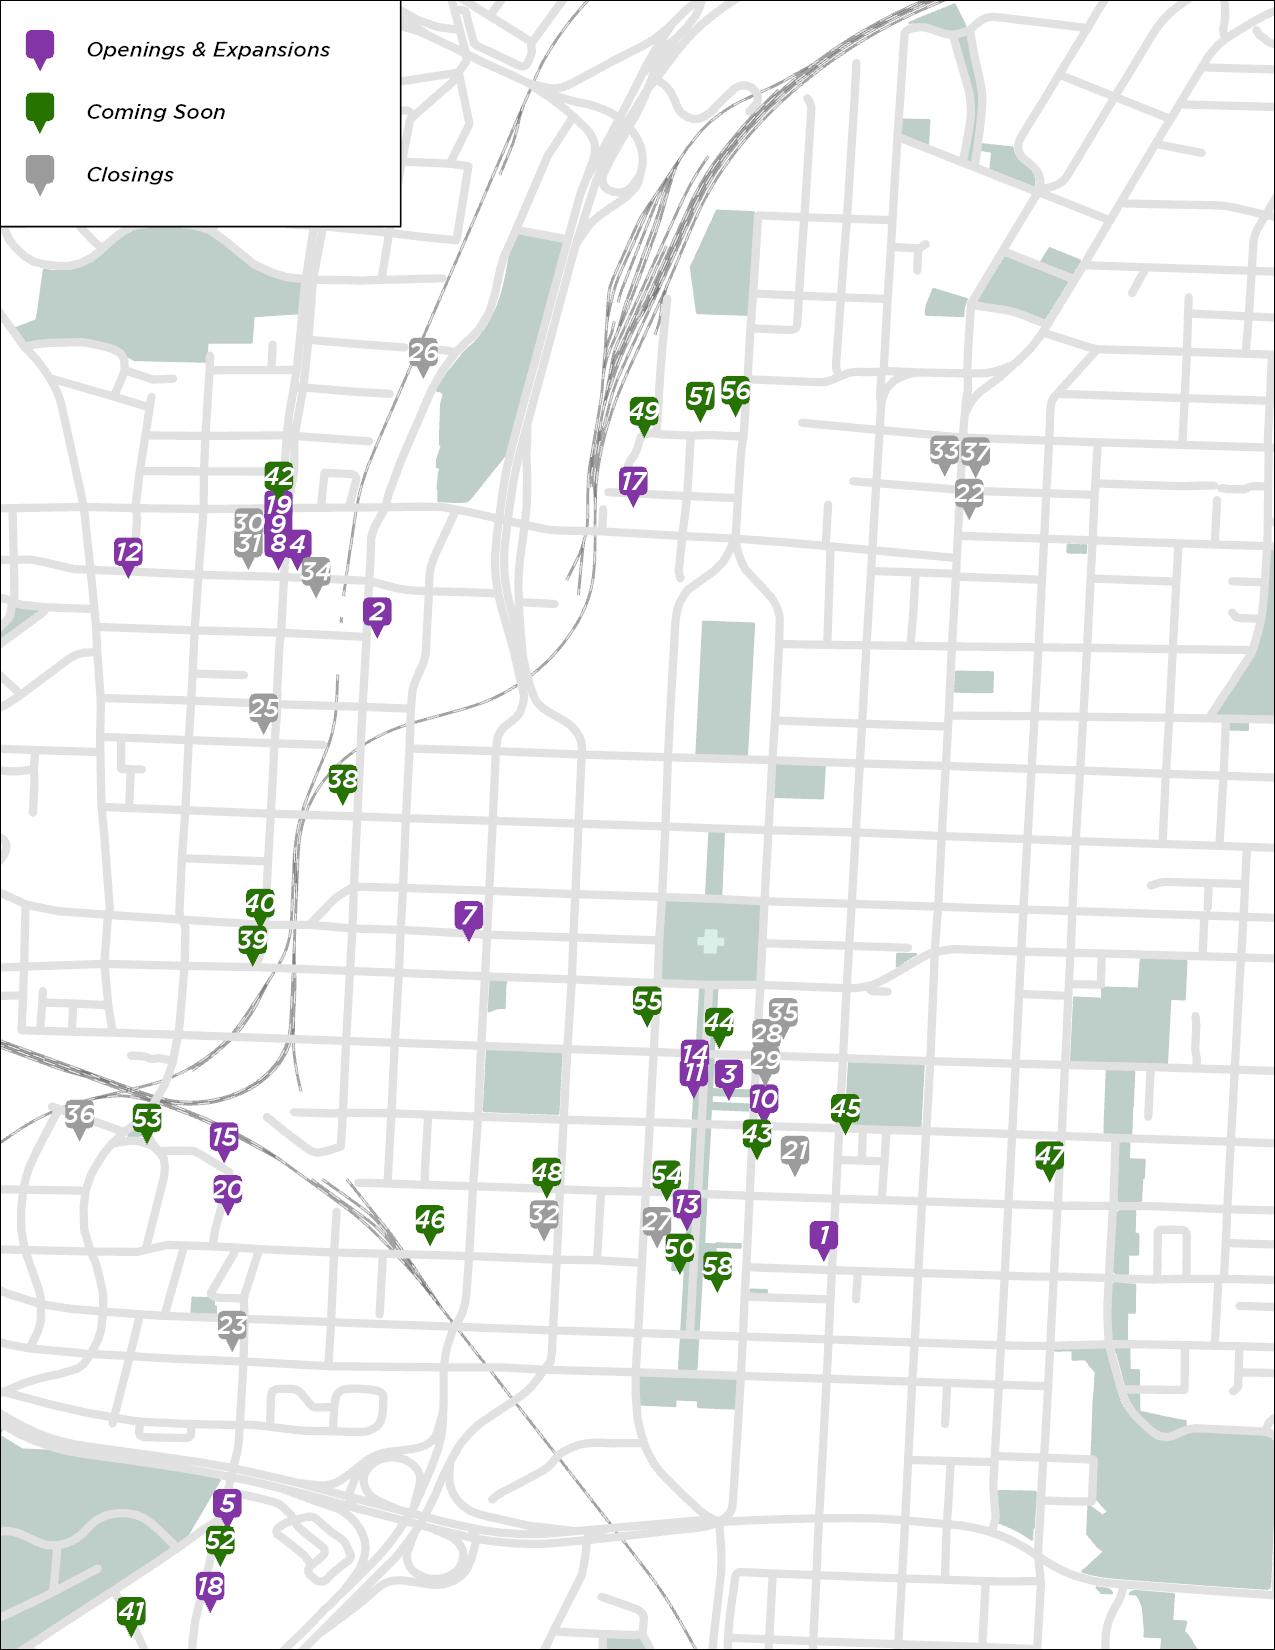
In Q1, 17 storefront businesses opened, including one relocation of an existing business, Carroll’s Kitchen, which moved around the corner.1 During the quarter, 17 businesses closed, while 26 additional storefront businesses have announced plans to open 1
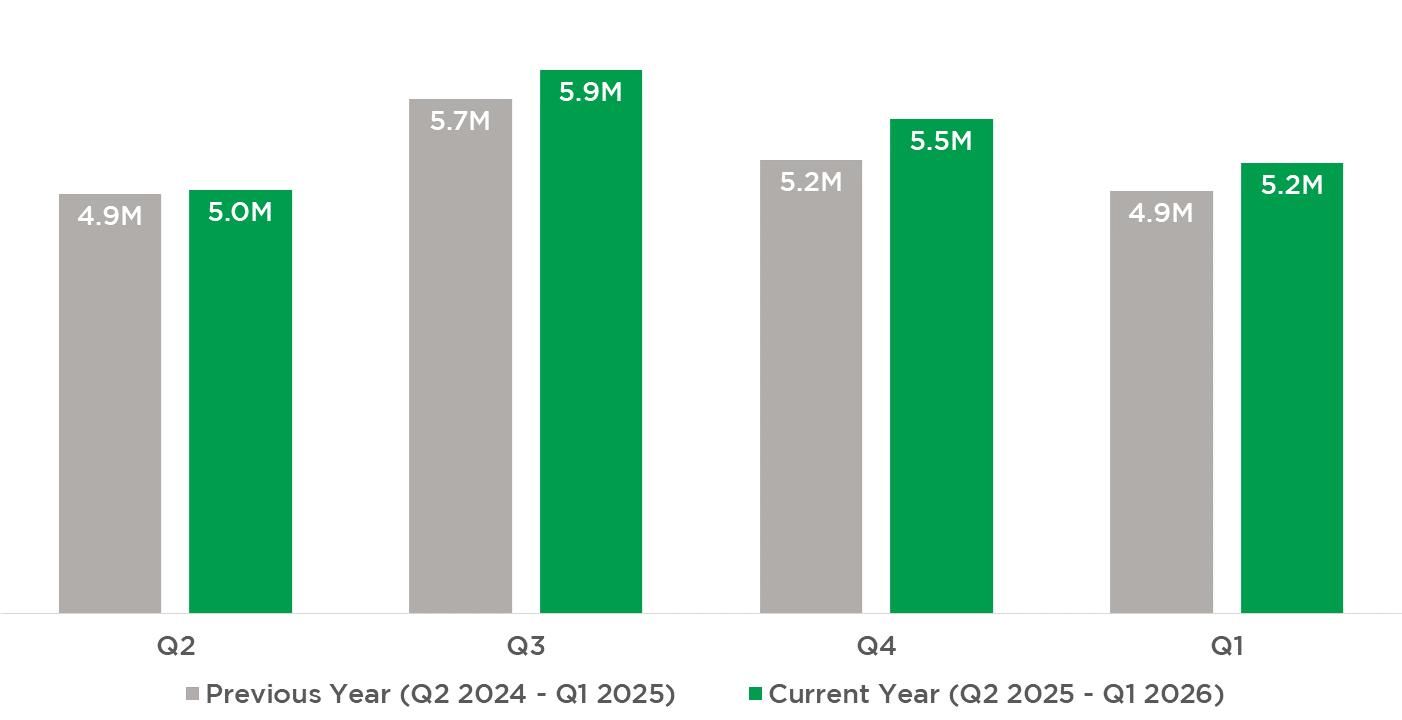
Visitor visits to Downtown Raleigh increased by +4.6% in Q1 compared with the same period last year.3 The Seaboard Person District saw the largest year over year increase at +11.3%.3 Average monthly food and beverage sales in Q1 2026 decreased -1.6%, reflecting the impact of multiple winter weather events in January, while the Fayetteville Street District saw a 3.4% increase, the strongest performance among districts.2
Downtown Raleigh recorded more than 1.9 million unique visitors in Q1, a 1% increase year over year, while hotel room revenue in January and February rose 9.3% compared with the same period last year.3,2
There are 942 hotel rooms under construction across three projects, including 204 rooms being renovated, with an additional 704 rooms planned or proposed 1
Several notable property sales occurred in Q1. One Glenwood Avenue and 621 Hillsborough Street, both part of the Bloc83 development, sold for $95 million and $110 million, respectively.4 The Sheraton Hotel on Fayetteville Street was purchased for $27 million and will be renovated into a Westin with construction expected to begin in 2027.6 Lastly, 421 N Blount Street, a 7,800 square foot office building in the Capital District, sold for $4 million.4
+91,326 SF
Class A Office Total Net Absorption Q2 2025 to Q1 20265
+17
Storefront Business Openings Q1 20261
+4.6%
Increase In Total Visits To Downtown Raleigh Q1 2026 Year Over Year3
$23.6M
Average Monthly Food and Beverage Sales Q1 20262*
+9.3%
Increase In Average Monthly Hotel Room Sales Revenue From Q1
1DRA
2Wake County
3Placer.ai
4CoStar
5JLL
6Triangle Business Journal
*Only January & February Data Available and Included
Overall, there is $8.2 billion of investment in the current Downtown Raleigh development pipeline.1 This includes an estimated $3.6 billion in projects completed since 2015, $1.5 billion in projects under construction, and $3.1 billion in proposed or planned developments.1
$3.6 Completed (since 2015) BILLION $1.5 Under Construction as of Q1 BILLION $3.1 Proposed/Planned Developments BILLION $8.2 Completed since 2015, Under Construction, and Planned Developments BILLION
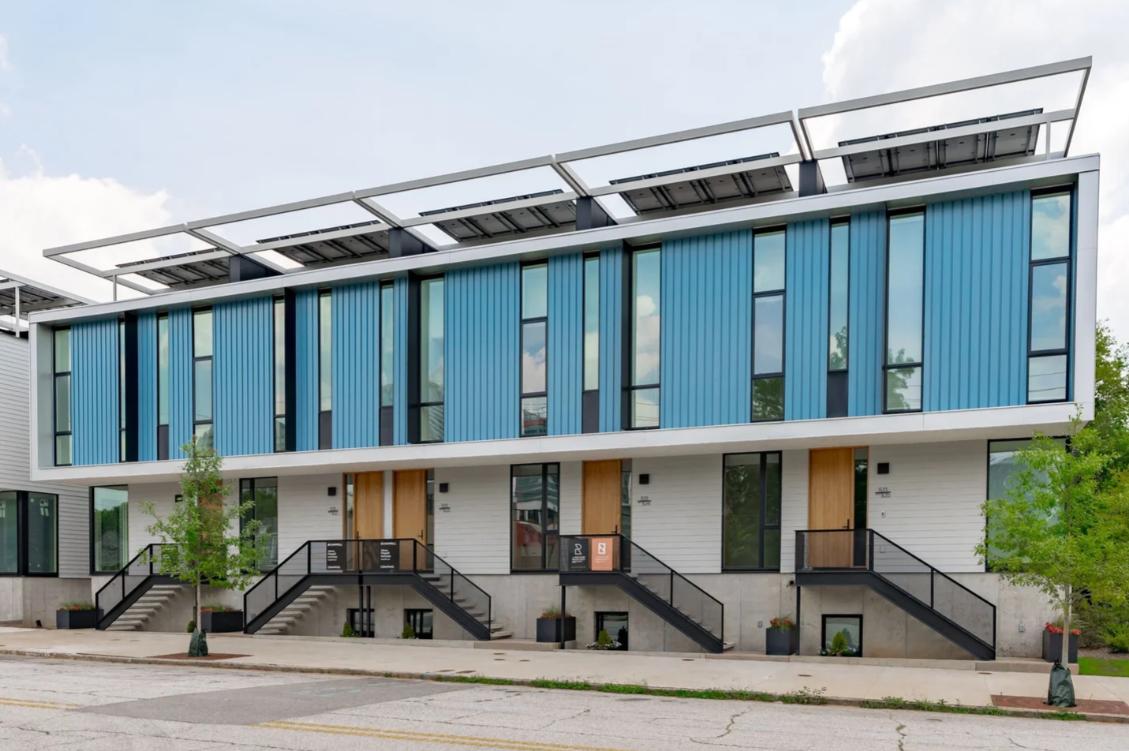
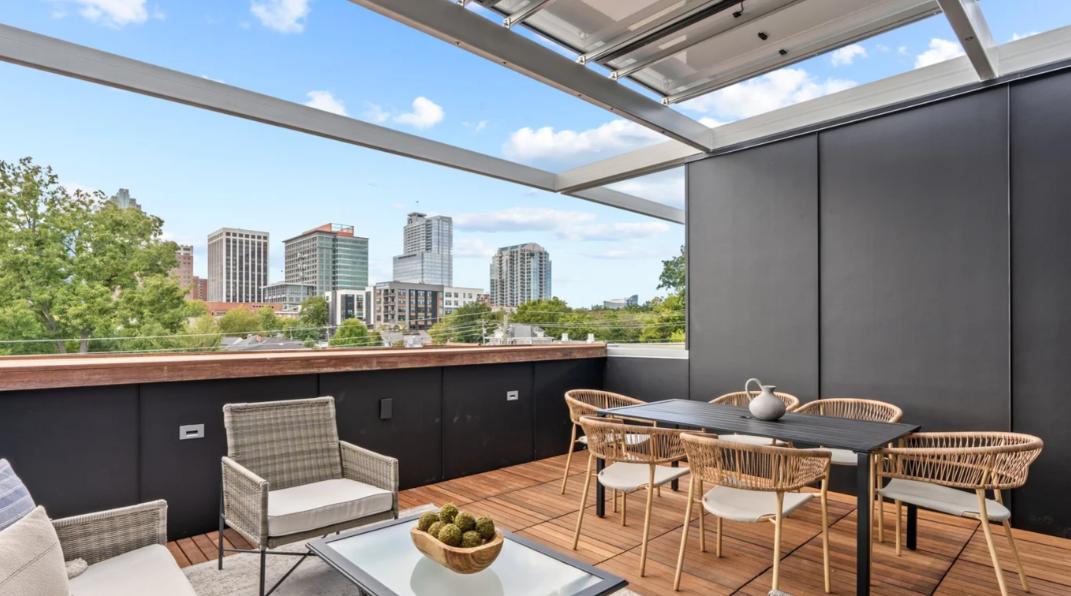
IDYLE has delivered 10 townhome units on the eastern edge of Downtown Raleigh at 501 S. Bloodworth Street. Each three to four bedroom home is approximately 2,700 square feet and offers views of the downtown skyline. The hightech units enable homeowners to monitor their energy usage in realtime through IDYLE’s net-zero energy capabilities.
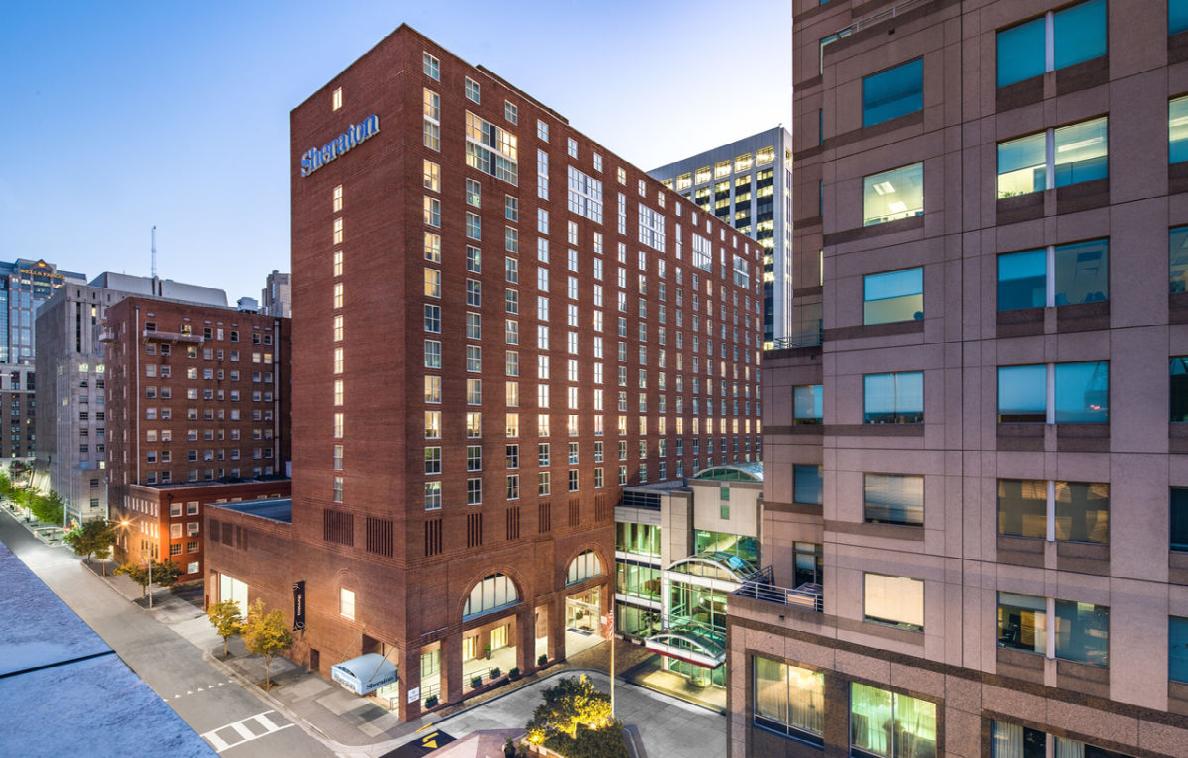
The Sheraton Raleigh Hotel at 421 S. Salisbury Street has been sold, and the new owners plan to renovate the property in early 2027 and convert it to a Westin. The renovation will include upgrades to guest rooms, improvements to public areas, additional meeting space, and new food and beverage concepts.
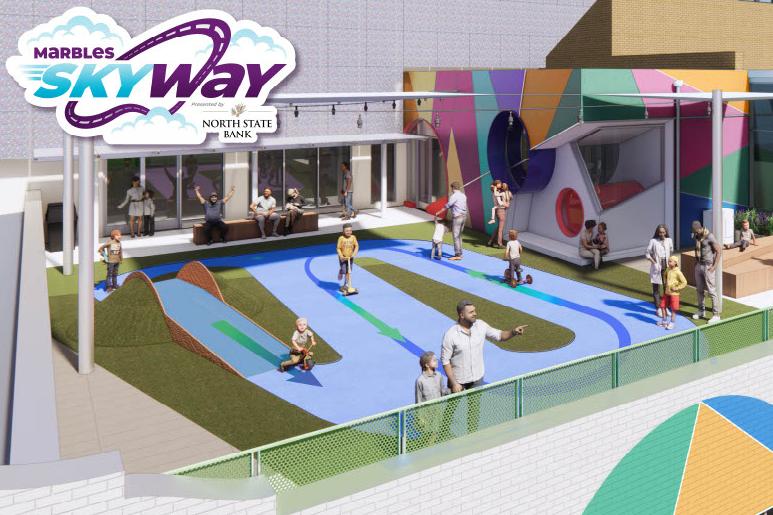
Construction is underway on the largest expansion in Marbles Kids Museum’s history. The project will add more than 3,000 square feet of indoor and outdoor exhibit space, a new classroom, and enhanced amenities. Highlights include Futuropolis, a hands-on career exploration exhibit, and the Marbles Skyway, a rooftop play space.
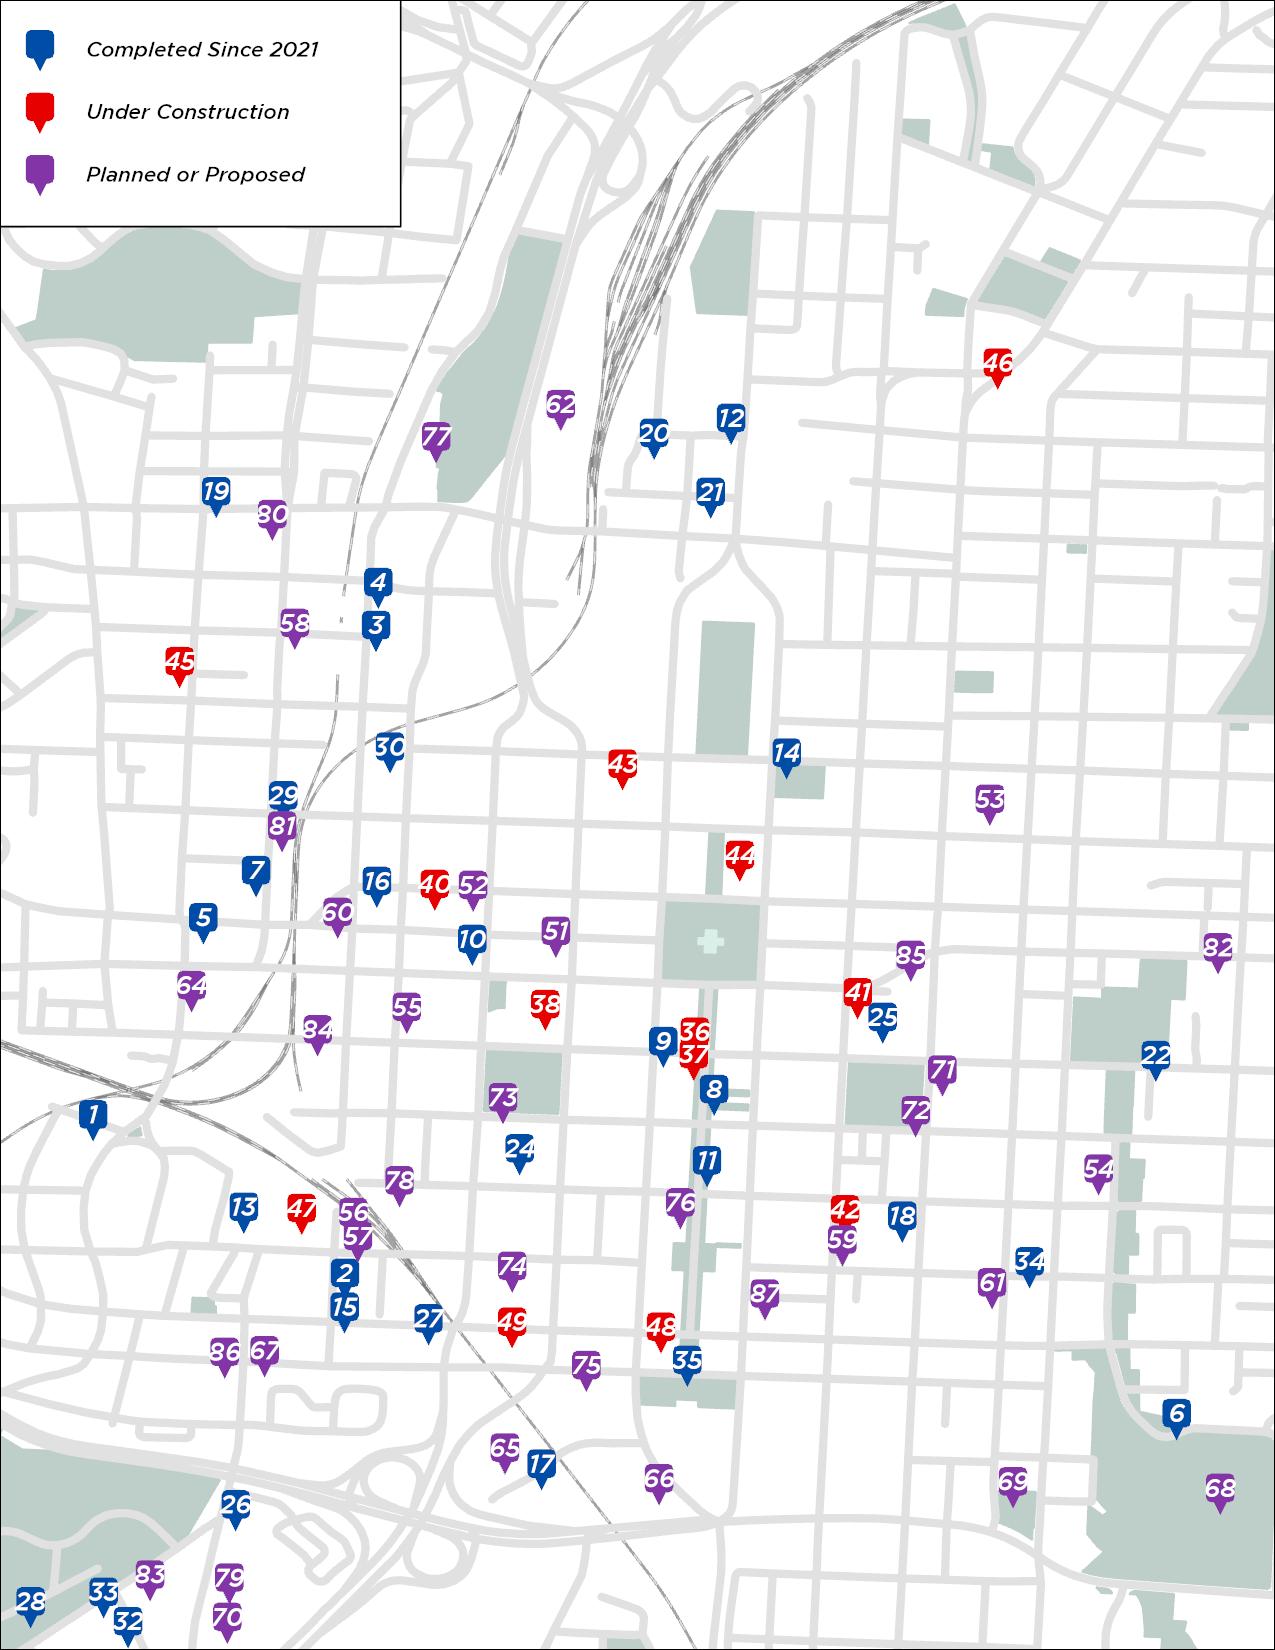
An interactive development map with updated listings of project information and images is viewable at downtownraleigh.org/ do-business/ developments
1
2
3
4
6
7
8
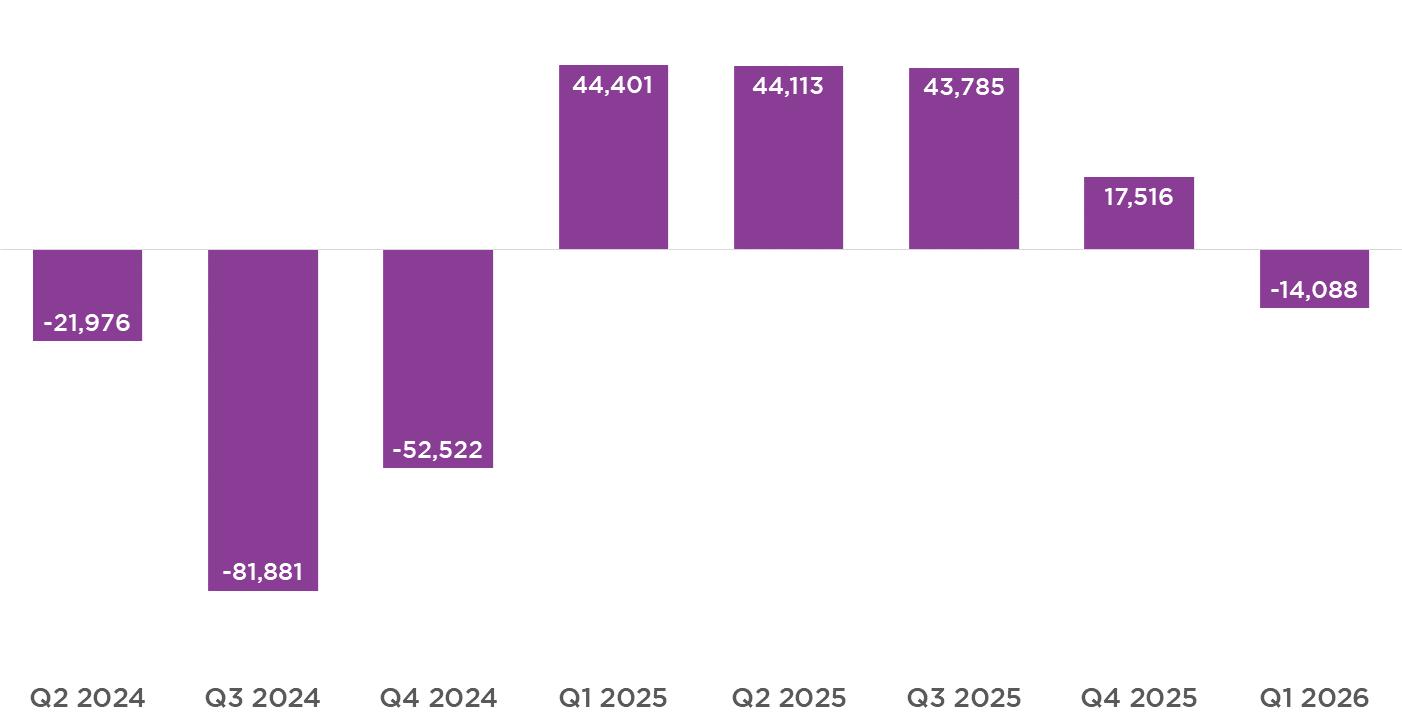
Class A net absorption over the past four quarters remains positive at +91,326 square feet 1 Downtown Raleigh saw a modest decrease in total Class A occupied square footage, with negative net absorption of -14,088 square feet in Q1 2026.1 Average asking rent increased to $41.49 per square foot, up from $39.38 in Q1 2025.1
The overall direct occupancy rate is 86.9%, the highest among Triangle submarkets.1
PERFORMANCE INDICATOR: CLASS A TOTAL NET ABSORPTION (SF)1
Class A Average Rent PSF1
86.9%
Class A Occupancy Rate1
Class A Net Absorption1 Past Four Quarters $41.49
+91,325 SF
Class A Total Inventory1
4,136,027 SF
Class A Delivered Since 20202 Q1 2026
898,412 SF
OFFICE MARKET 1JLL 2DRA
+91,326 SF
CLASS A OFFICE NET ABSORPTION LAST FOUR QUARTERS¹ #1
(LARGE)
Downtown Raleigh continues to work through a recent wave of apartment deliveries, with 1,653 units absorbed since Q2 2024, including 114 units in Q1 1 There are 601 residential units under construction across four projects, with another 6,182 units planned or proposed across an additional 23 developments.1 Downtown Raleigh’s stabilized occupancy rate, which does not include recently completed projects, is 89.7% and the average asking rate for per unit is $1,852.1
One for-sale residential development, IDYLE, delivered 10 townhome units in Q1 on the eastern edge of Downtown Raleigh.2
PERFORMANCE INDICATOR: APARTMENT UNITS NET ABSORPTION2
RESIDENTIAL MARKET Q1 2026
Average Asking Rent per Unit1
$1,852
Residential Units Delivered Q1 20262
10
601 Residential Units Under Construction2
Residential Units Planned & Proposed2
6,182 units
1CoStar 2DRA
*Does not include recently completed projects 89.7% Stabilized Occupancy1*
+1,653 units NET ABSORPTION Q2 2024 TO Q1 20261
In Q1, 16 storefront businesses opened along with one relocation of an existing business, Carroll’s Kitchen, which moved nearby.1 17 businesses closed during the quarter.1 An additional 26 storefront businesses have announced plans to open.1
Visitor visits to Downtown Raleigh in Q1 increased 4.6% compared with the same period last year. The Seaboard Person District recorded the largest year over year gain at 11.3%, recording 498,750 visits.2
PERFORMANCE INDICATOR:
TOTAL VISITOR VISITS TO DOWNTOWN RALEIGH2
RETAIL MARKET
Q1 2026
17 New Storefront Business Openings & Relocations (Q1)1
26 Storefront Businesses Coming Soon1
Retail SF Delivered Q1 2020 to Present1
389,017
Retail SF Planned or Proposed1
224,668
1DRA 2Placer.ai 3News & Observer
+4.6% increase
TOTAL Q1 2026 VISITOR VISITS COMPARED TO Q1 20251
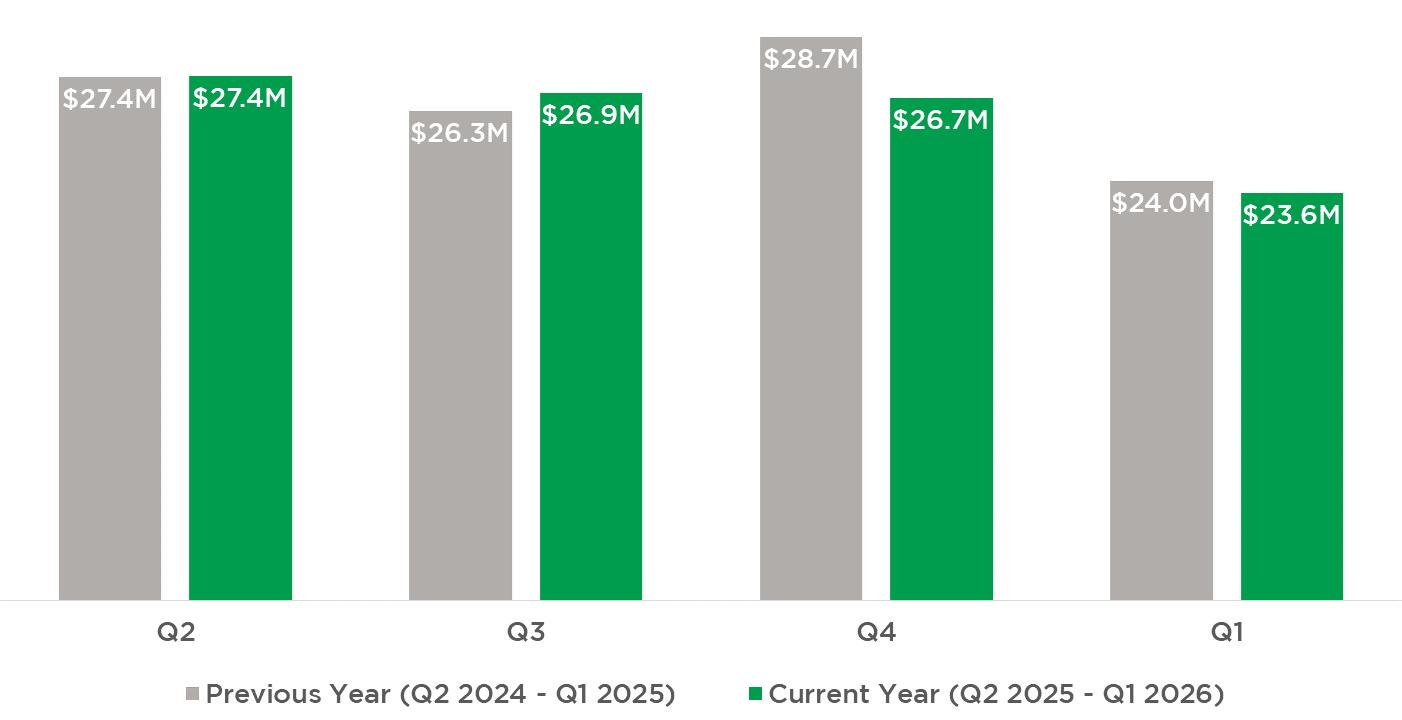
Average monthly food and beverage sales for the first two months of Q1 decreased 1.6% compared with the same period last year, reflecting the impact of multiple winter weather events in January.1 Fayetteville Street saw a 3.4% year over year increase, the strongest performance of any district.1
PERFORMANCE INDICATOR:
AVERAGE MONTHLY FOOD AND BEVERAGE SALES BY QUARTER1*
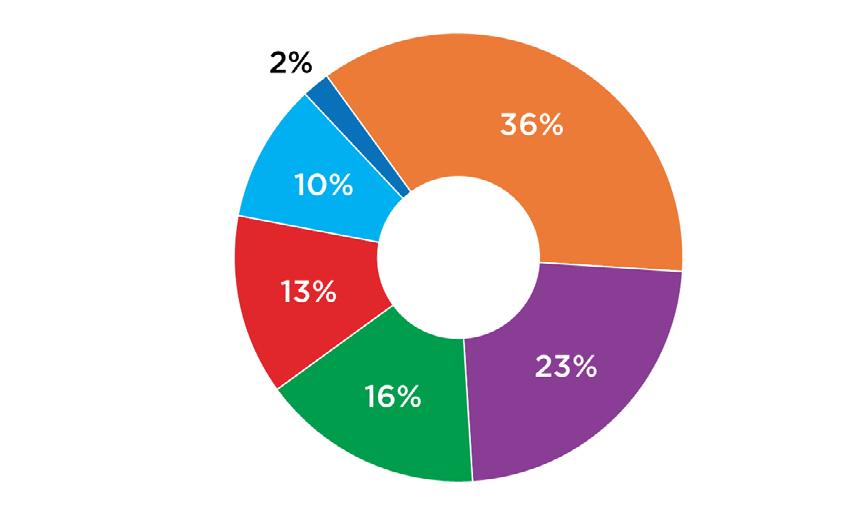
FOOD AND BEVERAGE SALES BY DISTRICT IN Q11
Seaboard Person District
RETAIL MARKET Q1 2026
Average Monthly Food & Beverage Sales in Q11*
$23.6 MILLION
$24.0 Million in Q1 2025
290+ Restaurants & Bars In Downtown2
8 Craft Breweries & Distilleries In Downtown2
1Wake County Tax Administration, DRA 2DRA *Only January & February data available
$318M
ESTIMATED FOOD & BEVERAGE SALES IN LAST 12 MONTHS1
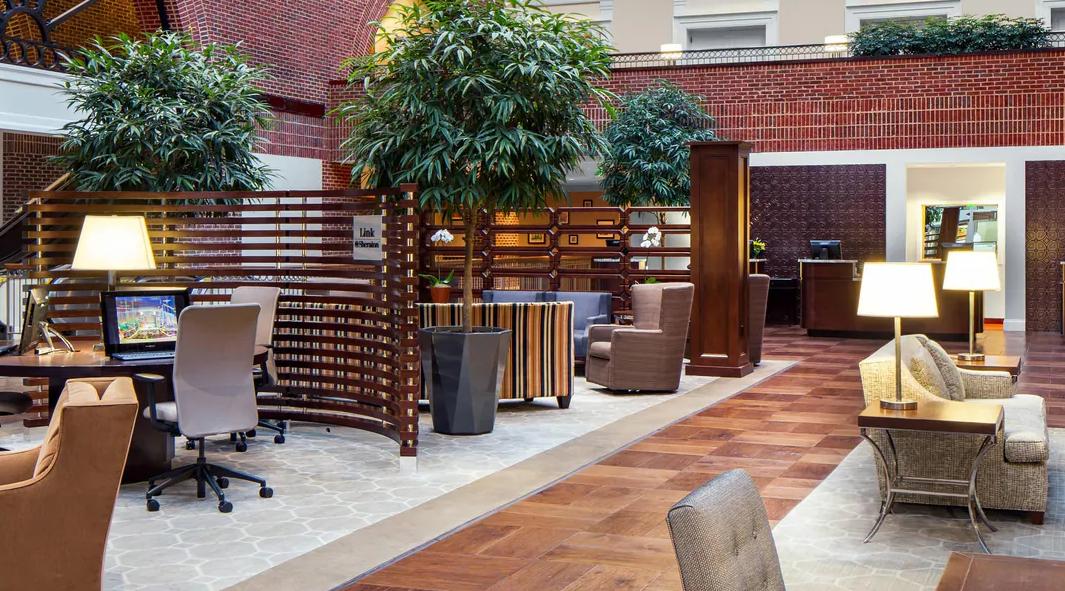
There are 943 hotel rooms under construction across three projects3, including 204 rooms undergoing renovation.3 An additional 704 rooms are planned or proposed across four developments.3 The Sheraton on Fayetteville Street was purchased for $27 million and will be renovated into a Westin.4
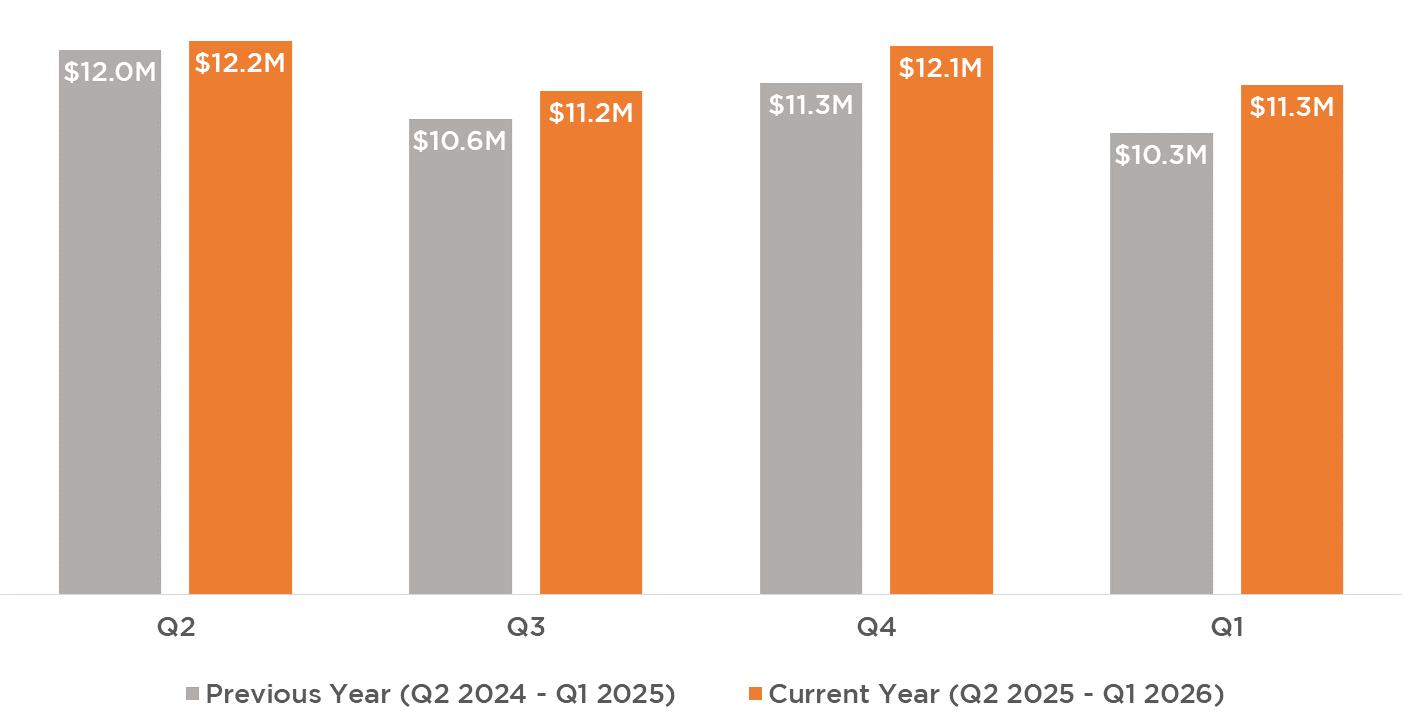
Downtown Raleigh welcomed more than 1.9 million unique visitors in Q1, a 1% increase year over year.2 Total hotel room revenue in January and February increased 9.3% compared with the same period last year.1
PERFORMANCE INDICATOR: DOWNTOWN AVERAGE MONTHLY HOTEL ROOM REVENUE1*
Q1 2026
704
Hotel Rooms Planned or Proposed
943
Hotel Rooms Under Construction or Renovation3
1.9M Unique Downtown Visitors in Q12
$11.3M Average Monthly Hotel Room Revenue Q1*
1Wake County
2Placer.ai
3DRA
4Triangle Business Journal
*Only January & February
Data Available and Included
+9.3% INCREASE
Q1 2026 AVERAGE MONTHLY HOTEL ROOM REVENUE YEAR OVER YEAR1*
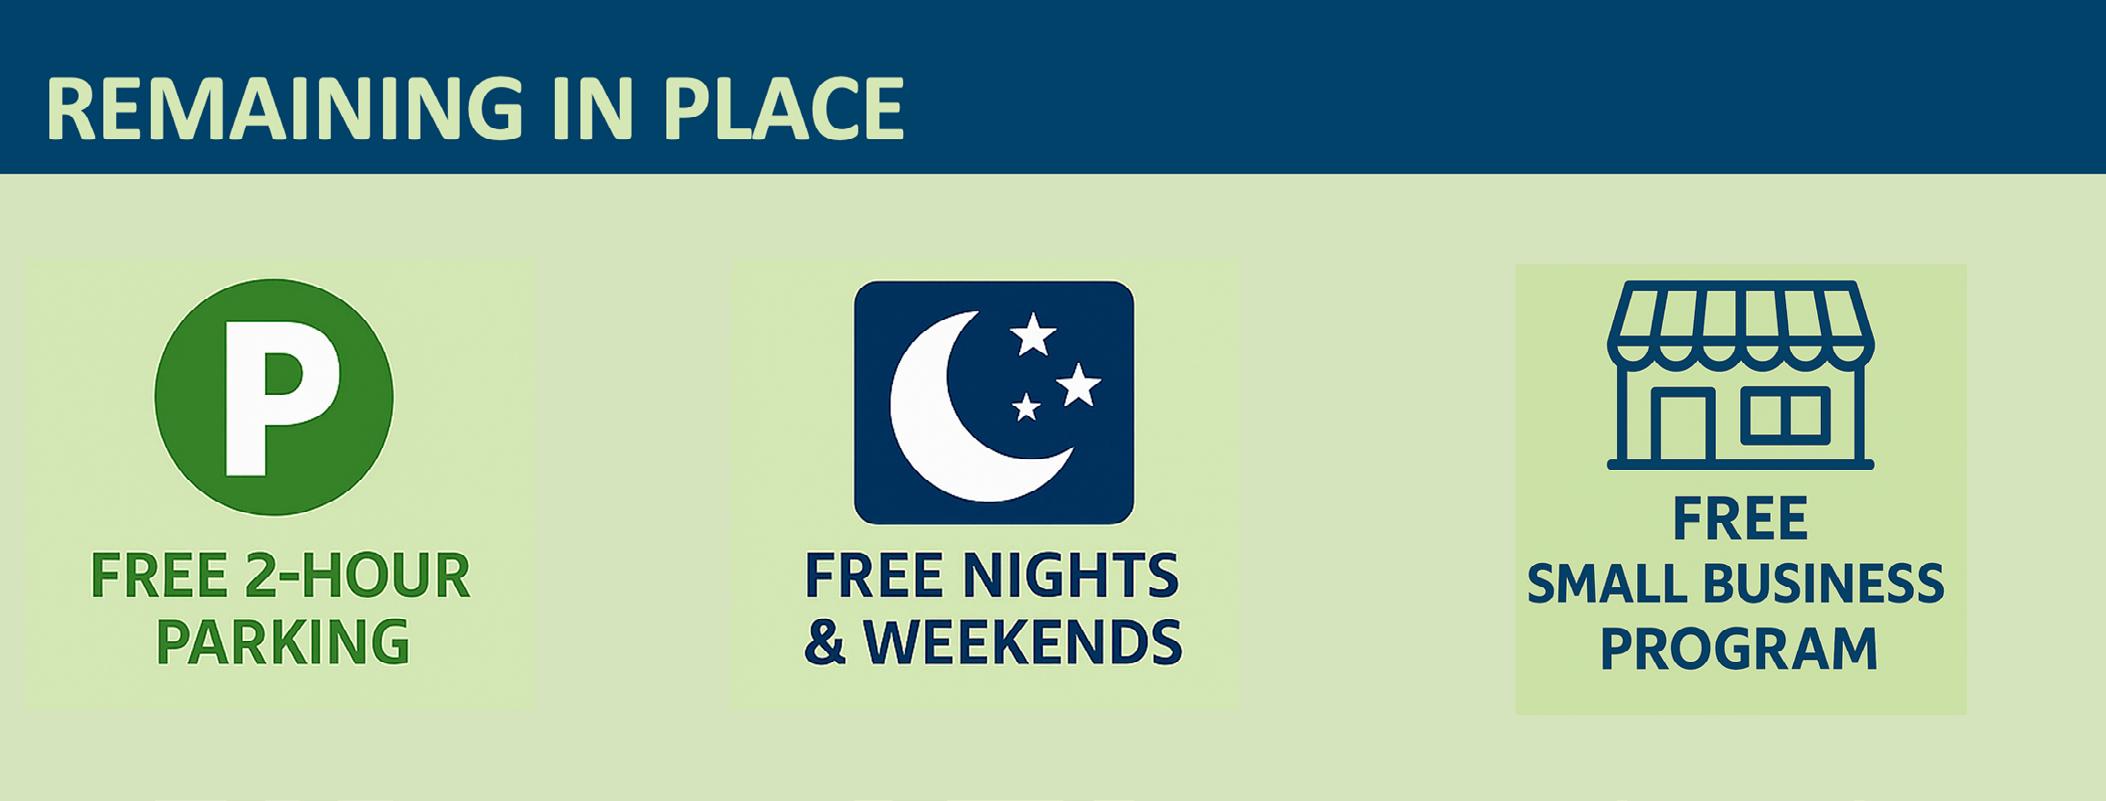
Thanks to community advocacy and your feedback, the City’s updated downtown parking proposal now preserves popular programs while still generating revenue for maintenance. Key highlights include making the two hour free weekday parking program permanent in five decks and continuing free parking for small business employees.
Parking deck and on-street enforcement hours will remain the same, with the exception of the Cabarrus St. deck near the Convention Center. The proposal also includes increases to monthly pass costs, hourly deck rates after the initial two hours, daily maximum rates, and a 25 cent increase to on street parking rates.
City staff have indicated they will soon release an RFP for a parking study to assess the performance of the City’s parking system, along with an RFI to evaluate the potential sale of the Wilmington Station Deck.
More detailed information can be found at https://downtownraleigh.org/parkingupdate
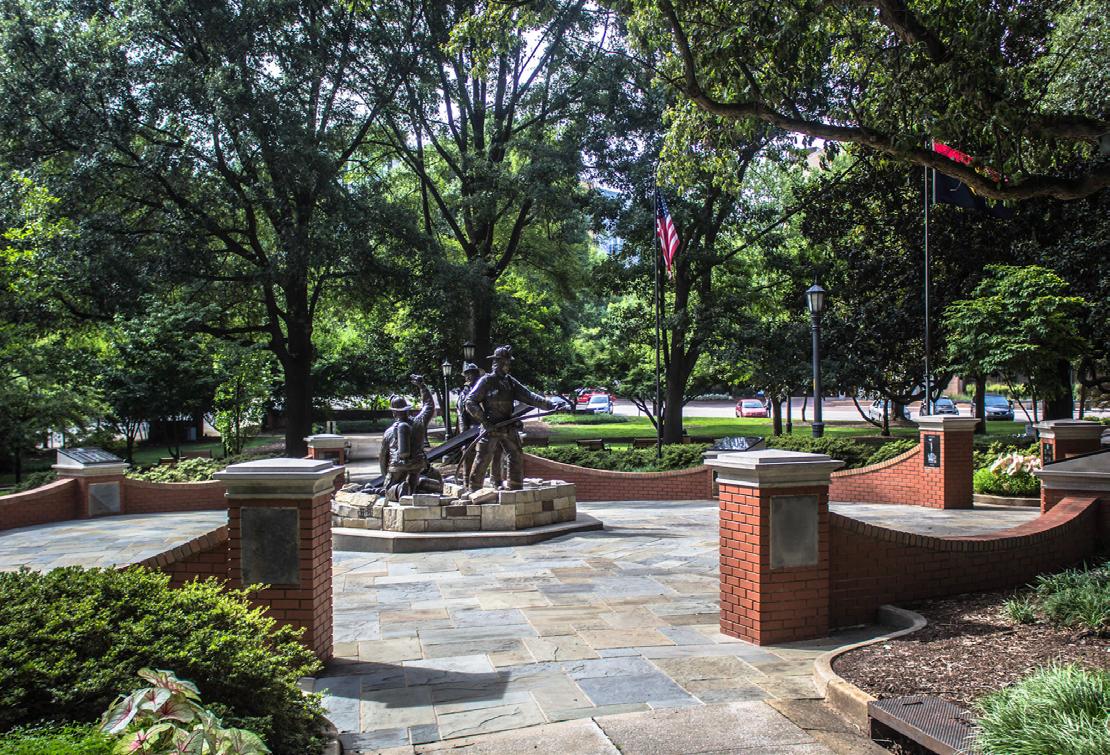
The City of Raleigh is developing the Nash Square Public Realm Plan to guide the long term evolution of one of Downtown Raleigh’s most prominent civic spaces, including its role as an extension of the new City Hall. The plan will enhance the public realm, integrate surrounding development, preserve the square’s historic character, and establish a framework for long term management and resilience. A draft is expected later this year.
15,600+
43,300+
21.7M Visitor Visits Per Year2
33.6
145K
68.2% Resident Population1 Employees Within 1 Mile of the State Capitol1
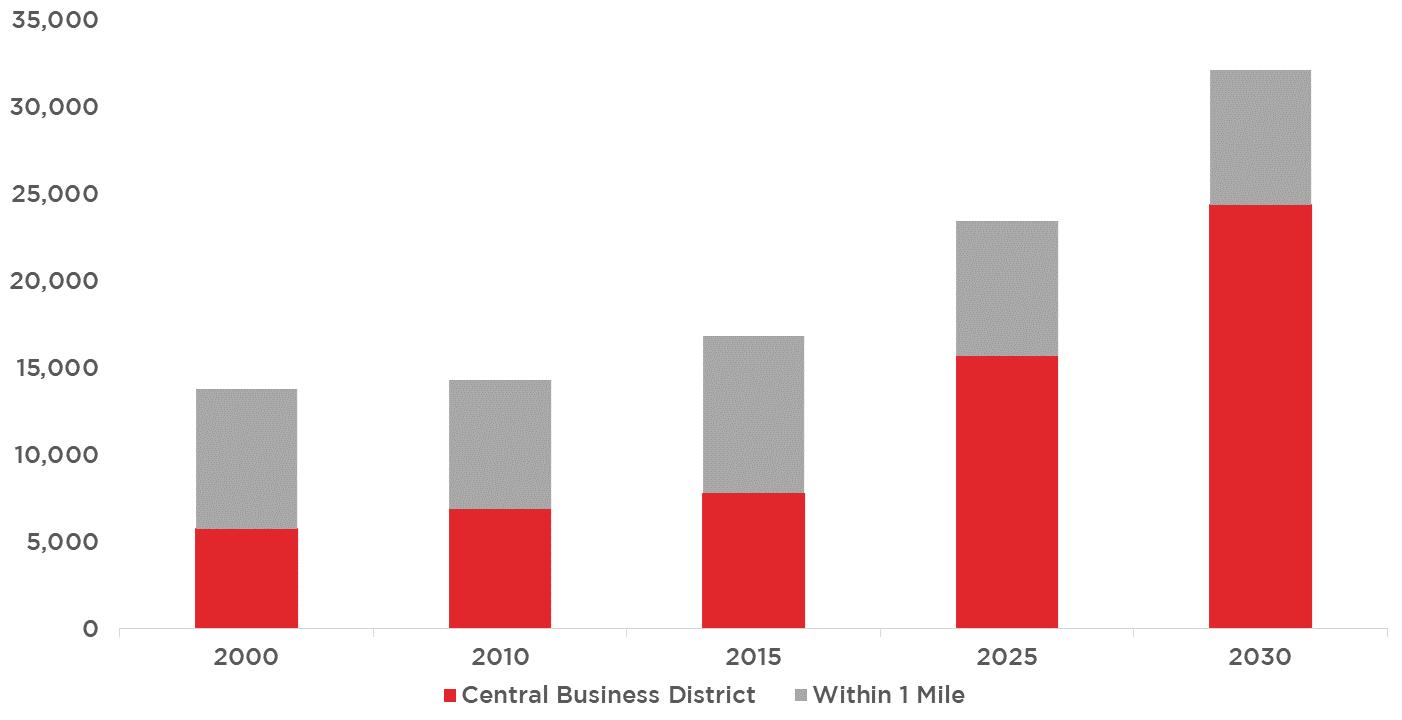
Bachelor’s Degree or Higher1 DOWNTOWN POPULATION GROWTH
Median Age1 Average Household Income1
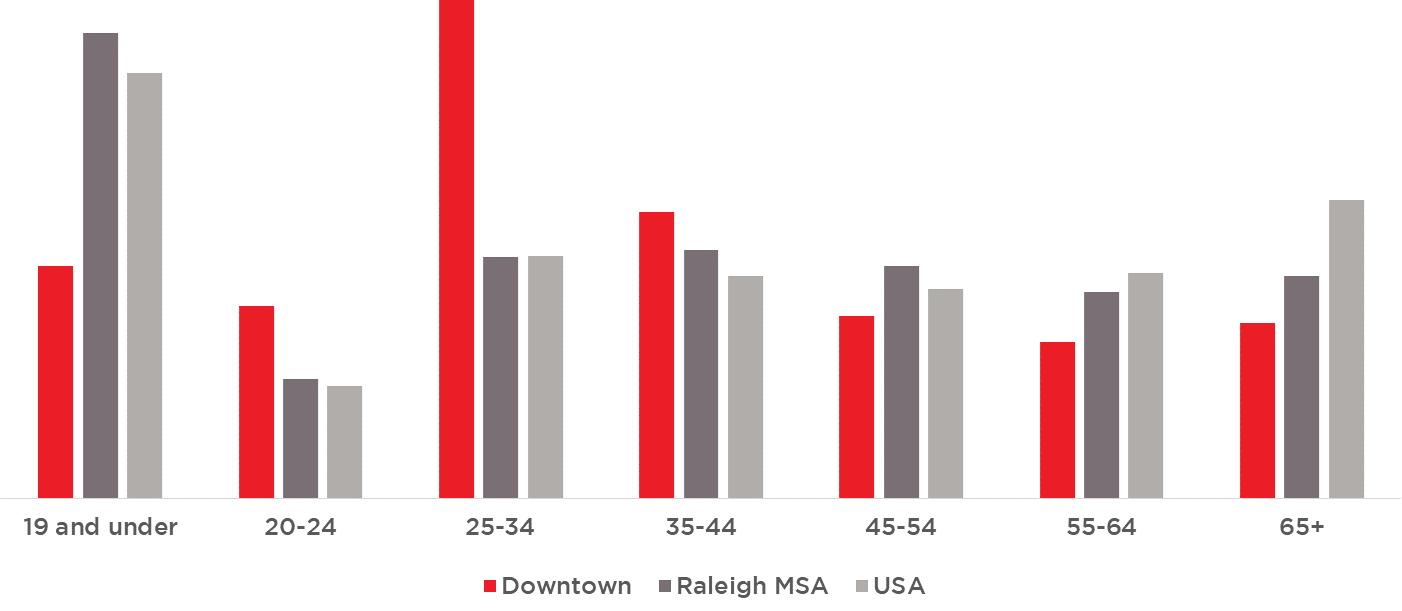
40.5% Of population between ages 20-341
DRA has a mission of advancing the vitality of Downtown Raleigh for everyone. DRA facilitates this mission through five goals:
Improve downtown economy through recruitment, pop-ups, financial support, research, marketing & promotions;
Advocate to make downtown a place for everyone that reflects evolving needs and interests of the community and lessons learned from the recent past;
Make downtown an engaging place to live, work, and visit through safe activations that appeal to a wide variety of stakeholders;
Improve and maintain a sense of safety and security in downtown through our Ambassador program, Social Services and work with RPD; and,
Elevate and improve DRA’s internal organization and processes through improved database, project management, communication, financial stewardship, and planning.
For additional information and resources visit: downtownraleigh.org/do-business
DOWNTOWN BOUNDARY AND DISTRICT MAP 1 2 3 4 5
CONTACT FOR QUESTIONS:
Gabriel Schumacher Research Director
Downtown Raleigh Alliance 919.821.6981 // gabrielschumacher@downtownraleigh.org