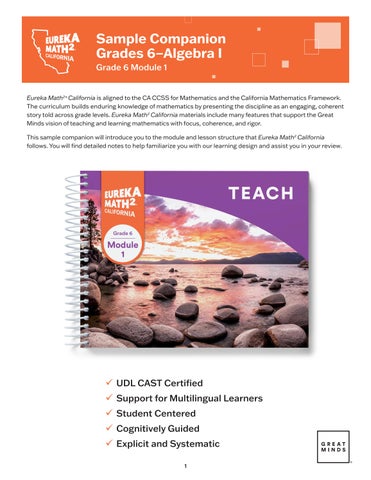
Sample Companion Grades 6–Algebra I Grade 6 Module 1
Eureka Math2 ® California is aligned to the CA CCSS for Mathematics and the California Mathematics Framework. The curriculum builds enduring knowledge of mathematics by presenting the discipline as an engaging, coherent story told across grade levels. Eureka Math2 California materials include many features that support the Great Minds vision of teaching and learning mathematics with focus, coherence, and rigor. This sample companion will introduce you to the module and lesson structure that Eureka Math2 California follows. You will find detailed notes to help familiarize you with our learning design and assist you in your review.
9 UDL CAST Certified 9 Support for Multilingual Learners 9 Student Centered 9 Cognitively Guided 9 Explicit and Systematic 1
Module 1 Overview 1 Ratios, Rates, and Percents Coherence: Before This Module
2
Grade 4 Module 2 In grade 4, students solve problems involving multiplicative comparisons, such as Blake has 4 times as many stickers as Adesh. This prior work provides a foundation for students’ understanding of ratios as multiplicative comparisons of two numbers.
Grade 5 Module 6 In grade 5, students work with the first quadrant of the coordinate plane as they plot points to represent ordered pairs of numbers.
Coherence: After This Module Grade 7 Modules 1 and 5 In grade 7 module 1, students extend their understanding of ratios and rates to proportional relationships. They recognize the constant of proportionality as the unit rate of a relationship. They identify, compare, and solve problems involving proportional relationships represented in graphs, tables, equations, and verbal descriptions.
© Great Minds PBC
In grade 7 module 5, students apply their foundational understanding of percents to a variety of other real-world contexts, including percent increase and decrease, percent error, discounts, tax, and commission.
16
EUREKA MATH2 California
Grade 6 ▸ Module 1
016-021_EM2CA180_25_TEG6M1_module_overview_172729.indd 16
1
19/11/25 5:38 PM
The Module Overview sets the stage for success.
2
• Reveals the coherent, logical progression of mathematical concepts and practices in the module.
The Before This Module and After This Module sections • Articulate connections between the content of the module to the concepts of the Big Ideas across the mathematical learning journey.
• Provides clear explanations and visual examples of mathematical concepts and models.
• Explain the role of the grade-level concepts within the larger context of the curriculum.
• Illustrates at a glance the emphasis on mathematical investigations to address the Big Ideas of the grade.
2
66
TOPIC B
LESSON
1
Ratio Tables and Double Number Lines • Represent equivalent ratios by using ratio tables and double number lines. • Use representations of ratio relationships to solve problems.
can use ratio tables and double number lines to represent “ Iratio relationships and to solve problems. ”
Standards
Language Objectives
• 6.RP.A.3
• Listen to the definition of ratio relationship and represent a ratio relationship by using ratio tables and double number lines.
• 6.RP.A.3.a
California Content Standards
• Orally and in writing, explain how to use ratio tables and double number lines to find unknown quantities.
2
• SMP.2
3
Key Questions
Standards for Mathematical Practice
• What are the advantages of using a ratio table to represent equivalent ratios? • What are the advantages of using a double number line to represent equivalent ratios?
Achievement Descriptors • 6.Mod1.AD3: Solve real-world and mathematical problems by using ratio reasoning. (6.RP.A.3) • 6.Mod1.AD4: Represent ratio relationships by using tables and the coordinate plane. (6.RP.A.3.a)
Big Ideas Patterns Inside Numbers Generalizing with Multiple Representations Relationships Between Variables
124
EUREKA MATH2 California
© Great Minds PBC
Model the World
Grade 6 ▸ Module 1 ▸ Topic B ▸ Lesson 6
124-147_EM2CA180_25_TEG6M1_L06_172729.indd 124
1
19/11/25 5:33 PM
Language Objectives provide a specific language goal alongside the math goal, ensuring students develop the vocabulary and syntax needed to discuss complex concepts. These objectives are designed to ensure that mathematical content and English language development (ELD) grow together.
3
2
Key Questions help teachers quickly identify and focus on key learning in the lesson.
3
Achievement Descriptors show connections between content objectives and grade-level standards that focus on measurable student outcomes, tailored to enhance learning.
1
Lesson at a Glance This lesson establishes two new tools to represent sets of equivalent ratios: a ratio table and a double number line. Students use these tools when they work in pairs to find unknown quantities such as the amount of sugar in different amounts of soda. Students create and improve their representations of sets of equivalent ratios to help them solve a sequence of problems. This lesson introduces the term ratio relationship.
2
3
Agenda
Materials
Fluency
Teacher
Launch 5 min
• None
Learn 30 min
Students
• Organizing Equivalent Ratios
• None
• Using Ratio Tables and Double Number Lines to Solve Problems
Lesson Preparation • None
© Great Minds PBC
Land 10 min
EUREKA MATH2 California
Grade 6 ▸ Module 1 ▸ Topic B ▸ Lesson 6
124-147_EM2CA180_25_TEG6M1_L06_172729.indd 125
125
19/11/25 5:33 PM
1
The Lesson at a Glance provides a snapshot of the lesson.
2
The Agenda • Uses a consistent structure—Fluency, Launch, Learn, Land—to create a predictable lesson flow. • Suggests pacing that balances emphasis on conceptual understanding, procedural fluency, and application.
3
Materials and Lesson Preparation save teachers time and ensure smooth lesson execution.
4
1
Fluency Determine Values on a Number Line Students complete number lines to prepare for using double number lines. Directions: Complete each number line by filling in the unknown values.
2.
3.
4.
5.
6.
126
0
1
2
3
4
5
0
5
10
15
20
25
0
0.3
0.6
0.9
0
1.3
2.6
3.9
5.2
6.5
0
1 3
2 3
1
4 3
5 3
0
2 5
4 5
6 5
8 5
2
EUREKA MATH2 California
1.2
1.5
Grade 6 ▸ Module 1 ▸ Topic B ▸ Lesson 6
124-147_EM2CA180_25_TEG6M1_L06_172729.indd 126
1
Students may use the Number Lines removable.
© Great Minds PBC
1.
Teacher Note
19/11/25 5:33 PM
Explicit instruction and structured guidance leads teachers through the lesson, promoting effective delivery and student comprehension.
Fluency activities prepare students for the daily learning by • offering distributed practice of skills and concepts – preparing students for new conceptual understanding – building fluency with recently introduced material – maintaining skills or concepts from previous topics, modules, or grades • including predictable, repeated routines that build in rigor. • Fluency activities are low-stakes opportunities for all students to build knowledge and discern mathematical patterns.
5
1
Launch
5
Students analyze diagrams showing two different units of measurement. Display the first table showing the ruler diagram and the three statements. Tell students that two of the statements about the diagram are true, but one is false. Give them silent think time to determine which statement is false. Have students give a silent signal to indicate they are finished. Choose students to share their thinking and defend their reasoning. Repeat this process for the next two tables.
Teacher Note
CM
1. The length of the orange rectangle is about 5 centimeters.
0
1
2
3
4
5
6
7
8
9
10 11 12
0 ¼ ½ ¾ 1 ¼ ½ ¾ 2 ¼ ½ ¾ 3 ¼ ½ ¾ 4 ¼ ½ ¾ IN Tons
© Great Minds PBC
Pounds
2. The length of the orange rectangle is about 2 inches. 3. The length of the orange rectangle is about 5 inches.
Tons to Pounds Conversion Scale
0
0.255 250 0
500
0.5 750
1,000
1
0.75 1,250
1,500
1. The pig shown weighs 14 ton.
Consider extending the activity in Launch with the following additional statements about the diagram with the pig. Two of the statements are true, and one of the statements is false. The ratio of the number of pounds the pig weighs to the number of tons the pig weighs is 500 : _1. 4
The ratio of the number of tons two pigs weigh to the number of pounds two pigs weigh is 1,000 : _1. 2
There are 2,000 pounds in every 1 ton.
2. Two pigs would weigh 1,000 tons. 1,750 2,000
3. There is 1 ton for every 2,000 pounds.
EUREKA MATH2 California
Grade 6 ▸ Module 1 ▸ Topic B ▸ Lesson 6
124-147_EM2CA180_25_TEG6M1_L06_172729.indd 127
127
19/11/25 5:33 PM
1
Launch engages students in the lesson with various approaches: • Low-floor, high-ceiling activities that activate prior knowledge and create access points for all learners. • Real-world examples and data as a means to spark inquiry and apply mathematical concepts. • Rich student discourse through routines like think–pair–share. • A goal for the day’s learning.
6
16 oz 14 oz 12 oz 10 oz 8 oz 6 oz 4 oz 2 oz
1. There are 2 cups of water in the measuring cup.
1 CUP
2. There are 16 ounces of water for every 1 cup of water.
¾ ½ ¼ ¾ ½ ¼
3. There are 12 ounces of water in 1 12 cups of water.
Use the following prompts to facilitate a class discussion. Consider the measuring cup diagram. Use this diagram to provide an example of an equivalent ratio of quantities with different units The ratio of the number of ounces of water to the number of cups of water is 8 : 1 or 16 : 2. What tool have we used to represent equivalent ratios? We have drawn tape diagrams to represent equivalent ratios. In a tape diagram, each unit is the same size because each unit represents the same amount. Are 1 ounce of water and 1 cup of water the same amount of water? No. So is a tape diagram with same-size units the best tool to represent the equivalent ratios of the number of ounces to the number of cups? Why? No. A tape diagram with same-size units is not the best tool because ounces and cups are different units and different amounts. Today, we will learn about two tools that help us organize equivalent ratios of quantities with the same units or with different units. We will use the new tools to help us solve ratio problems
© Great Minds PBC
1
2 CUPS
128
EUREKA MATH2 California
Grade 6 ▸ Module 1 ▸ Topic B ▸ Lesson 6
124-147_EM2CA180_25_TEG6M1_L06_172729.indd 128
1
19/11/25 5:33 PM
This Launch engages students by leading them to a naturally emerging question: What tools will help us represent equivalent ratios with different units?
Explicit instruction and structured guidance leads teachers through the lesson, promoting effective delivery and student comprehension.
7
1
Learn Organizing Equivalent Ratios
2
Students represent ratio relationships by using ratio tables and double number lines. Direct students to problem 1. Display the nutrition facts for a packet of sugar. How many grams of sugar are in 1 packet? There are 4 grams of sugar in 1 packet.
Universal Design for Learning: Representation
If necessary, point to where the label shows that 1 packet of sugar contains 4 grams of sugar. Then allow students to complete problem 1 individually or in pairs. From the Learn book Module 1 Topic B Lesson 6
Consider the nutrition facts for 1 packet of sugar. Complete the table.
© Great Minds PBC
1.
(Continues)
EUREKA MATH2 California
124-147_EM2CA180_25_TEG6M1_L06_172729.indd 129
1
Consider presenting the information in another format by providing students with real objects for reference. For problem 1, show students an actual packet of sugar or a picture of a packet of sugar. For problem 2, show students an actual 12-ounce can of soda or a picture of a 12-ounce can of soda
Grade 6 ▸ Module 1 ▸ Topic B ▸ Lesson 6
129
19/11/25 5:33 PM
2
Learn is where concepts are developed. • Lessons use progressions of concrete representations, pictorial representations, and symbolic representations to develop understanding.
Universal Design for Learning (UDL) notes provide guidance for supporting learners. • UDL notes contain culturally responsive suggestions and scaffolds for grade-level work to respond to student needs.
• Each Learn segment builds on the concepts introduced and explained in the last segment to develop a deep understanding of the day’s learning.
8
From the Learn book Module 1 Topic B Lesson 6 (Continued)
Teacher Note Number of Grams of Sugar
1
4
2
8
3
12
4
16
5
20
Because each unit of a tape diagram is equally sized and has the same value, it is typically best to use tape diagrams when two quantities in a ratio relationship have the same units. Conversely, it is best to use double number lines when the two quantities in a ratio relationship have different units. For example, a double number line that represents the relationship between 2 cups of sugar and 3 cups of flour in a recipe will show intervals on each number line that are the same length but that refer to two different quantities, 2 cups and 3 cups.
After a couple of minutes or once most have finished, invite students to share the numbers in their completed tables. Ask them how they determined the numbers in the table. Encourage them to use proper ratio language such as “The ratio of the number of packets of sugar to the number of grams of sugar is 1 : 4” or “For every 1 packet of sugar, there are 4 grams of sugar.” Then continue the class discussion by using the following prompt. Do the numbers in the table represent numbers in equivalent ratios? How do you know? Yes, they represent numbers in equivalent ratios. We know because we can multiply 1 and 4 each by 2 to get 2 and 8, by 3 to get 3 and 12, by 4 to get 4 and 16, and by 5 to get 5 and 20. Explain that a ratio table, like the one they completed in problem 1, is a tool that allows them to organize a set of equivalent ratios. We can see from the ratio table in problem 1 that for every 1 packet of sugar, there are 4 grams of sugar. This describes a ratio relationship. A ratio relationship is the set of all ratios that are equivalent ratios.
130
EUREKA MATH2 California
Consider having students refer to the definition of equivalent ratios from lesson 5 to show that these ratios are equivalent ratios.
Multilingual Learner Support To support students’ understanding of the new term ratio relationship, direct students to write the following statement in their books next to the table in problem 1: “There is a ratio relationship between the number of packets of sugar and the number of grams of sugar.”
2
Grade 6 ▸ Module 1 ▸ Topic B ▸ Lesson 6
124-147_EM2CA180_25_TEG6M1_L06_172729.indd 130
1
Teacher Note
© Great Minds PBC
Number of Packets of Sugar
1
19/11/25 5:33 PM
2
Teacher Notes are educative point-of-use guidance to help teachers elevate their instruction.
Multilingual Learner Support notes provide guidance for supporting learners. • Address possible language issues that may interfere with engagement of math content.
• May support lesson implementation. • Explain pedagogical choices.
• Include strategies for supporting English learners.
• Give background information. • Help identify common misconceptions. • Offer point-of-use professional development.
9
Display the ratio table in figure 6.1, which shows the same ratio relationship but has two rows rather than two columns. Number of Packets of Sugar
Number of Grams of Sugar
1
2
3
4
5
4
8
12
16
20
1
Figure 6.1 Does this ratio table show the same ratio relationship as the table in problem 1? What is the ratio relationship? Yes, they are the same set of equivalent ratios as in problem 1. For every 1 packet of sugar, there are 4 grams of sugar. Display the ratio table without borders in figure 6.2. Ask students what they notice about the figure. They should notice that it shows the same information as the table in figure 6.1 but that there are no borders. 1
2
3
4
5
4
8
12
16
20
Number of Packets of Sugar Number of Grams of Sugar Figure 6.2
© Great Minds PBC
Display the number lines in figure 6.3. Explain that the number lines represent the number of packets of sugar and the number of grams of sugar. 1
2
3
4
5
4
8
12
16
20
Number of Packets of Sugar Number of Grams of Sugar Figure 6.3
EUREKA MATH2 California
EUREKA MATH2 California
6 ▸ M1 ▸ TB ▸ L
Grade 6 ▸ Module 1 ▸ Topic B ▸ Lesson 6
131
Display the ratio table in figure 6.1, which shows the same ratio relationship but has two rows rather than two columns. Number of Packets of Sugar
124-147_EM2CA180_25_TEG6M1_L06_172729.indd 131
1
2
3
4
8
12
4
5
19/11/25 5:33 PM
Number of Grams of Sugar
16
20
Figure 6.1 Does this ratio table show the same ratio relationship as the table in problem 1? What is the ratio relationship?
1
Yes, they are the same set of equivalent ratios as in problem 1. For every 1 packet of sugar, there are 4 grams of sugar.
Throughout the curriculum, models such as tape diagrams, double number lines, tables, and graphs help students deepen their conceptual understanding.
Display the ratio table without borders in figure 6.2. Ask Math students what they notice about Leveraging the Story of
the figure. They should notice that it shows the same information as the table in figure 6.1 but that there are no borders.
This lesson builds upon 1 2 what 3 students 4 5 Number of Packets of Sugar know about units from K–5 and uses Number of Grams of Sugar a familiar model to translate that 4 8 12 16 20 knowledge into the context of ratios. Figure 6.2
Display the number lines in figure 6.3. Explain that the number lines represent the number of packets of sugar and the number of grams of sugar. 1
2
3
4
5
4
8
12
16
20
Number of Packets of Sugar Number of Grams of Sugar Figure 6.3 © Great Minds PBC
10
Display the completed double number line in figure 6.4. Ask students what they notice. Students should notice that each tick mark corresponds to the two numbers in each ratio of the ratio relationship. 1
2
3
4
5
0
4
8
12
16
20
Each number line in the double number lines shown in this topic start at a value of zero. However, according to the definition of a ratio, the pair of numbers in a ratio cannot both be zero. If students point out the zeros on the number lines, explain how the zeros make sense in the situation. For example, if there are 0 packets of sugar, then there are 0 grams of sugar. However, avoid stating that there is a ratio relating 0 packets of sugar and 0 grams of sugar.
Number of Packets of Sugar Number of Grams of Sugar Figure 6.4 Explain that this figure shows another tool that represents a ratio relationship. Why are there two number lines? We need a number line for the number of packets of sugar and another number line for the number of grams of sugar. Why do you think the tick marks are drawn from one number line to the other? Every tick mark on the top number line shows 1 more packet of sugar. Every tick mark on the bottom number line shows 4 more grams of sugar. The two numbers in each ratio of the number of packets of sugar to the number of grams of sugar should line up at a tick mark. What do you think we can call this tool that has two number lines?
Differentiation: Support
Invite students to share their ideas about a name for this new representation. Then reveal that it is called a double number line. Allow students a couple of minutes to copy the double number line shown in figure 6.4 in their books after the ratio table in problem 1. Next, show students how they can extend both number lines. Write the number 6 on the number line representing the number of packets of sugar. Then draw a tick mark from the number 6 to the number line representing the number of grams of sugar. Have students Think–Pair–Share about the following questions. If there are 6 packets of sugar, how many grams of sugar are there? If there are 6 packets of sugar, there are 24 grams of sugar.
132
EUREKA MATH2 California
To support students in understanding that the number line representing the number of grams of sugar counts by 4 for every 1 packet of sugar, consider physically marking the number line with all the tick marks between 0 and 4, between 4 and 8, and so on.
Differentiation: Challenge Consider challenging students with questions that involve reasoning about values that are between tick marks. For example, draw a tick mark from halfway between 0 and 1 packet of sugar to halfway between 0 and 4 grams of sugar. Then ask, “What ratio does this tick mark represent and why?”
1
Grade 6 ▸ Module 1 ▸ Topic B ▸ Lesson 6
124-147_EM2CA180_25_TEG6M1_L06_172729.indd 132
1
1
© Great Minds PBC
0
Teacher Note
19/11/25 5:33 PM
Differentiation: Challenge and Support notes provide adaptable strategies for various learning levels to ensure all students are challenged and supported appropriately.
Engaging Tasks • Students engage with the same content in various ways, ensuring access and allowing for strategic differentiation. • Teachers monitor student conversations to determine which students will share each strategy, building a coherent mathematical story.
11
Suppose we extend both number lines much farther to the right. What is another equivalent ratio of the number of packets of sugar to the number of grams of sugar we could find? Sample: Another equivalent ratio of the number of packets of sugar to the number of grams of sugar is 10 : 40.
Using Ratio Tables and Double Number Lines to Solve Problems Students solve problems about quantities in equivalent ratios by using ratio tables and double number lines. Allow students to turn and talk about the following question. How many packets of sugar would be in a 12-ounce can of soda? Then display the nutrition facts for a can of soda.
© Great Minds PBC
1
EUREKA MATH2 California
Grade 6 ▸ Module 1 ▸ Topic B ▸ Lesson 6
124-147_EM2CA180_25_TEG6M1_L06_172729.indd 133
133
19/11/25 5:33 PM
1
Real-World Contexts • Math is often situated in real-world, familiar contexts that make abstract concepts more accessible. • Seeing real-world math applications, such as nutrition facts labels, helps students make decisions about their lives based on the math they learn.
12
According to the nutrition facts, how many grams of sugar are in one 12-ounce can of this soda? The label shows that there are 40 grams of sugar in one 12-ounce can of this soda.
1
Continue the discussion to focus students’ attention on the ratio of the number of ounces of this soda to the number of grams of sugar. What is a ratio that relates the number of ounces of this soda to the number of grams of sugar? A ratio that relates the number of ounces of this soda to the number of grams of sugar is 12 : 40. So for every 12 ounces of this soda, there are 40 grams of sugar. Can we create a ratio equivalent to the ratio 12 : 40? How? Yes, we can multiply 12 and 40 each by the same number to create an equivalent ratio.
Differentiation: Challenge If students need support with determining the type of relationship when reading the situation, suggest creating a table or graph. This will allow students to see the familiar structure of relationships that are proportional or not proportional.
© Great Minds PBC
2
Have students Think–Pair–Share about the next question. Choose several students to share the strategies they used to determine the number of packets of sugar that would be in one 12-ounce can of this soda. Because 1 packet of sugar has 4 grams of sugar, how many packets of sugar would be in one 12-ounce can of this soda? How do you know? Because 40 grams of sugar is 10 times the number of grams of sugar in 1 packet, there would be 10 packets of sugar in one 12-ounce can of this soda.
134
EUREKA MATH2 California
Grade 6 ▸ Module 1 ▸ Topic B ▸ Lesson 6
124-147_EM2CA180_25_TEG6M1_L06_172729.indd 134
1
19/11/25 5:33 PM
2
Sample dialogue is part of the rich discourse baked into the curriculum.
Think–Pair–Share
• Questions build on one another to develop conceptual learning.
• Invite students to build on each other’s ideas through mathematical discussion.
• Extension questions and narrowing in on the concept allow for point-of-use instructional decisions.
• Provide opportunities for multilingual learners to use and integrate language.
• Student responses provide clues to student understanding.
• Allow all students to see themselves and others as mathematically competent.
13
Allow students several minutes to complete problem 2 in pairs.
1
Promoting the Standards for Mathematical Practice
From the Learn book Module 1 Topic B Lesson 6
Students reason quantitatively and abstractly (SMP.2) when they identify and create situations that are proportional or not proportional.
2. For every 12 ounces of soda, there are 40 grams of sugar.
a. Complete the ratio table. Number of Ounces of Soda
Number of Grams of Sugar
12
40
24
80
36
120
48
160
Ask the following questions to promote SMP.2: • What does the constant of proportionality mean in this situation? • What real-world situations are modeled by a proportional relationship?
b. Use the completed ratio table from part (a) to create a double number line. 0
12
24
36
48
0
40
80
120
160
Number of Ounces of Soda Number of Grams of Sugar
© Great Minds PBC
c. How many grams of sugar are in three 12-ounce cans of this soda? How do you know? There are 120 grams of sugar in three 12-ounce cans of this soda. One 12-ounce can of this soda contains 40 grams of sugar. If we multiply 12 and 40 each by 3, we get the equivalent ratio 36 :120. There is a tick mark from 36 ounces of soda to 120 grams of sugar. (Continues)
EUREKA MATH2 California
Grade 6 ▸ Module 1 ▸ Topic B ▸ Lesson 6
124-147_EM2CA180_25_TEG6M1_L06_172729.indd 135
135
19/11/25 5:33 PM
1
Standards for Mathematical Practice are embedded throughout the curriculum and highlighted during deliberate practice. • Students use and develop academic language while engaging in the mathematical practices. • Teacher-to-student and student-tostudent interactions model the intent of the mathematical practices.
14
From the Learn book Module 1 Topic B Lesson 6 (Continued)
d. How many grams of sugar are in three 12-ounce cans of this soda? How do you know? There are 120 grams of sugar in three 12-ounce cans of this soda. One 12-ounce can of this soda contains 40 grams of sugar. If we multiply 12 and 40 each by 3, we get the equivalent ratio 36 :120. There is a tick mark from 36 ounces of soda to 120 grams of sugar. Choose several students to share their strategies for finding the answers to parts (c) and (d). If they have not already done so, have students draw the tick mark and write the numbers for the ratio 6 : 20 from part (d) on the double number line.
1
Invite students to Think–Pair–Share about the following question. How many grams of sugar are in 3 ounces of this soda? Explain how you know. There are 10 grams of sugar in 3 ounces of this soda. We can multiply 6 and 20 each by 12 or multiply 12 and 40 each by 14 to get 3 and 10. We can draw a tick mark halfway between 0 and 6 ounces of soda and halfway between 0 and 20 grams of sugar on the double number line to show there are 10 grams of sugar in 3 ounces of this soda.
Have students draw a tick mark and write the numbers for the ratio 9 : 30 on the double number line. Then direct students to complete problems 3–5 in pairs.
136
EUREKA MATH2 California
Teacher Note When students determine an equivalent ratio, some may add a number to both 6 and 20 and state an incorrect ratio such as 7 : 21. If students make this mistake, ask them whether the ratio they find is in the same ratio relationship as 6 : 20 and 12 : 40. Have them try to multiply 7 and 21 by the same number to get either 6 : 20 or 12 : 40 so they realize that the ratio 7 : 21 is not an equivalent ratio.
Grade 6 ▸ Module 1 ▸ Topic B ▸ Lesson 6
124-147_EM2CA180_25_TEG6M1_L06_172729.indd 136
1
© Great Minds PBC
2
Have students draw a tick mark and write the numbers for the ratio 3 : 10 on the double number line. Then have them Think–Pair–Share about the following question. What is an equivalent ratio that we can find on the double number line between the tick marks that represent the ratios 6 : 20 and 12 : 40? How do you know? The ratio 9 : 30 is an equivalent ratio because 43 of 12 is 9 and 43 of 40 is 30. We can draw a tick mark halfway between 6 and 12 ounces of soda and halfway between 20 and 40 grams of sugar on the double number line to show that 9 : 30 is an equivalent ratio.
19/11/25 5:33 PM
2
Students compare their strategies to deepen their understanding of the concepts by examining different methods or strategies used to solve the same problem.
Conjectures Students ask questions and share conjectures throughout lessons, developing sound reasoning and challenging assumptions.
• Students discuss their thinking and reasoning with peers, which helps to clarify their understanding and exposes them to diverse perspectives. • Students make connections between different mathematical ideas, representations, and strategies. • Teachers guide discussions to highlight important mathematical concepts and to ensure that students understand the underlying principles behind different strategies.
15
1 From the Learn book Module 1 Topic B Lesson 6
3. The graphic shows some of the different sizes of cups used to serve soda at fast food
restaurants from 1955 to today. Some cups are labeled with the number of ounces of soda the cups can hold. Other cups are labeled with the number of grams of sugar in the soda the cups can hold. Use the double number line from problem 2 to complete the ratio table. 30 oz of soda
6 oz of soda 40 g of sugar
72 oz of soda
140 g of sugar
400 g of sugar
2 From the Learn book Module 1 Topic B Lesson 6 (Continued)
Size served in 1955
Number of Ounces of Soda
Number of Grams of Sugar
6
20
Size served today
© Great Minds PBC
(Continues)
12
40
30
100
42
140
72
240
120
400
4. The ratio table shows the relationship between the number of cups of pretzels and the number of ounces of cereal in a snack mix recipe. Number of Cups of Pretzels
124-147_EM2CA180_25_TEG6M1_L06_172729.indd 137
Number of Ounces of Cereal
Grade 6 ▸ Module 14 ▸ Topic B ▸ Lesson 6
EUREKA MATH2 California
137
6
6
9
8
12 19/11/25 5:33 PM
Lacy says that for every 2 cups of pretzels, there are 3 ounces of cereal. Who is correct? Explain. Lacy is correct. The ratios of the numbers of cups of pretzels to the numbers of ounces of cereal are equivalent to the ratio 2 : 3. (Continues)
138
EUREKA MATH2 California
Grade 6 ▸ Module 1 ▸ Topic B ▸ Lesson 6
124-147_EM2CA180_25_TEG6M1_L06_172729.indd 138
19/11/25 5:33 PM
2
Student Classwork prepares students for success while working on Practice problems.
Sample Student Responses • Prepare teachers to respond to student thinking. • Ensure smooth lesson execution.
Lesson pages are completed by students during the lesson. The pages are organized in the order they are used in the lesson, starting with Launch, and are labeled with the segment titles in the lesson. 3.
The graphic shows some of the different sizes of cups used to serve soda at fast food restaurants from 1955 to today. Some cups are labeled with the number of ounces of soda the cups can hold. Other cups are labeled with the number of grams of sugar in the soda the cups can hold. Use the double number line from problem 2 to complete the ratio table. 30 oz of soda
6 oz of soda
40 g of sugar
140 g of sugar
72 oz of soda
Size served in 1955
400 g of sugar
Size served today
Number of Ounces of Soda
Number of Grams of Sugar
6 40 30 140 72 400
© Great Minds PBC
1
EUREKA MATH2 California
063-068_EM2_CA-A_E_G06_M01_B_L06_classwork_SE_173566.indd 65
G6 ▸ M1 ▸ TB ▸ L6 ▸ LESSON
65
17/11/25 2:23 PM
© Great Minds PBC
a. Jada says that for every 3 cups of pretzels, there are 2 ounces of cereal.
16
1 TOPIC B Name
LESSON
Date
PRACTICE Practice
1.
I can use ratio tables and double number lines to represent ratio relationships and to solve problems.
6
California CCSS-M
6.RP.A.3, 6.RP.A.3.a
Kelly makes bracelets by using green beads and blue beads. The tape diagram represents the ratio of the number of green beads to the number of blue beads. Number of Green Beads Number of Blue Beads
Use the tape diagram to complete the ratio table. Number of Green Beads
Number of Blue Beads
3 6 9 12 15 2.
A recipe calls for 8 cups of water for every 16 ounces of macaroni. Complete the double number line. 0
8
0
16
© Great Minds PBC
Number of Cups of Water Number of Ounces of Macaroni
EUREKA MATH2 California
Grade 6 ▸ Module 1 ▸ Topic B ▸ Lesson 6
073-080_EM2_CA-A_E_G06_M01_B_L06_daily_practice_SE_173566.indd 73
1
73
17/11/25 2:20 PM
The Practice includes a suite of problems organized from simple to complex for easy differentiation. • Extends and reinforces classroom instruction. • Supports conceptual understanding. Develops procedural fluency over time.
17
Land Debrief 5 min Objective: Represent equivalent ratios by using ratio tables and double number lines. Use representations of ratio relationships to solve problems.
© Great Minds PBC
1
Use the following prompts to guide discussion about ratio tables and double number lines. What are the advantages of using a ratio table to represent equivalent ratios? A ratio table allows us to organize sets of equivalent ratios in tables. The columns of a ratio table show the two quantities we are comparing in a ratio. The pairs of numbers in the rows of a ratio table form equivalent ratios. Once the numbers from ratios are organized into a ratio table, we can notice and identify multiplication patterns and addition patterns between columns and rows. What are the advantages of using a double number line to represent equivalent ratios? A double number line also organizes sets of equivalent ratios. The number lines in a double number line show the two quantities we are comparing in a ratio. The pairs of numbers on the tick marks form equivalent ratios. We can add tick marks to the double number line to write more equivalent ratios. We used both ratio tables and double number lines to represent ratio relationships. Did you find that one representation was better than the other for solving problems? Explain why. Sample: Yes, it is easier to solve problems by using a double number line than by using a ratio table. We can draw another tick mark on a double number line to find another equivalent ratio.
140
EUREKA MATH2 California
Grade 6 ▸ Module 1 ▸ Topic B ▸ Lesson 6
124-147_EM2CA180_25_TEG6M1_L06_172729.indd 140
19/11/25 5:33 PM
1
Students cement their learning in Land, where they: • Consolidate their thinking through elaborative “why” and “how” questions that prioritize reasoning and justification. • Engage in rigorous thinking by drawing conclusions from their work, making deep connections among mathematical ideas, and encoding learning into longterm memory.
18
1
Recap
TOPIC B
LESSON
6
2.
California CCSS-M
6.RP.A.3, 6.RP.A.3.a
The ratio that relates the number of jumping jacks Kelly does to the number
number line shows the number of minutes she does them.
of minutes she does them is 50 :1. This ratio is represented by the second tick mark.
Number of Jumping Jacks
Terminology
•
represented ratio relationships by using ratio tables and double number lines.
•
used ratio tables and double number lines to solve problems.
Number of Minutes
A ratio relationship is the set of all ratios that are equivalent ratios.
© Great Minds PBC
© Great Minds PBC
Each row represents a ratio that relates the number of minutes Lacy practices to the number of minutes Noah practices.
10
5
20
10
30
15
40
20
Each ratio is equivalent to the ratio 10 : 5. For example, the ratio 20 : 10 is equivalent to the ratio 10 : 5 because 20 = 2 × 10 and 10 = 2 × 5.
Name
Number of Minutes
0
50
100
150
200
TOPIC B
250
LESSON
Date
PRACTICE
c. If Noah practices for 45 minutes, for how many minutes does Lacy practice?
The ratio 90 : 45 is equivalent to the ratio 10 : 5. If Noah practices for 9 × 5, or 45, minutes, then Lacy practices for 9 × 10, or 90, minutes.
0
Number of Jumping Jacks
0
1
2
3
6
5
4
50
100
150
200
250
3.
6.RP.A.3, 6.RP.A.3.a
Number of Minutes Blake Practices Piano
300
Number of Blue Beads 71
72
Use the tapeG6 diagram the ratio table. EUREKA MATH2 California ▸ M1 ▸ to TB complete ▸ L6 ▸ RECAP Number of Green Beads
EUREKA MATH2 California
2.
3
5
6
10
12
20
15
25
4
0
8
© Great Minds PBC
10
45
15
60
20
143
c. If Tara practices piano for 30 minutes, for how many minutes does Blake practice?
Blake practices for 90 minutes.
8
12
16 19/11/25 5:33 PM
16
24
32
Number of Cups of Water Number of Ounces of Macaroni
EUREKA MATH2 California
144
5
30
Tara practices for 6 minutes.
A recipe calls for 8 cups of water for every 16 ounces of macaroni. Complete the double number line. 0
Number of Minutes Tara Practices Piano
15
b. If Blake practices piano for 18 minutes, for how many minutes does Tara practice?
Number of Blue Beads
Grade 6 9▸ Module 1 ▸ Topic B 15 ▸ Lesson 6
124-147_EM2CA180_25_TEG6M1_L06_172729.indd 143
Blake practices piano 3 times as long as Tara does. a. Complete the ratio table to show possible numbers of minutes that Blake and Tara each practice piano.
California CCSS-M
Create another tick mark to show 300 jumping 1. of Kelly makes bracelets by using green beads and blue beads. tape diagram represents the Number 6 minutes. The jacks inThe Minutes ratio of the number of green beads to the number of blue beads. 50 :1 and 300 : 6 ratios 0 1 2 4 3 6 5 are equivalent because Number of Green Beads 300 = 6 × 50 and It takes Kelly 6 minutes to do 300 jumping jacks. 6 = 6 × 1.
Noah practices for 30 minutes.
Grade 6 ▸ Module 1 ▸ Topic B ▸ Lesson 6
Number of Jumping Jacks
Create tick marks that represent equivalent ratios to show 250 jumping jacks in 5 minutes.
Kelly does 250 jumping jacks in 5 minutes.
Lacy practices twice as long as Noah does, so Noah practices half as long as Lacy does.
EUREKA MATH2 California
1
Practice I can use ratio and double number lines to does it take her b. If Kelly continues to do jumping jacks tables at the same pace, how many minutes represent ratio relationships and to solve problems. to do 300 jumping jacks?
b. If Lacy practices for 60 minutes, for how many minutes does Noah practice?
Lacy practices for 90 minutes.
0
The tick marks on the double number line show Kelly does 50 more jumping jacks for every 1 more minute.
a. Complete the ratio table to show the number of minutes that Lacy and Noah each practice saxophone.
Number of Minutes Noah Practices
50
a. If Kelly continues to do jumping jacks at the same pace, how many jumping jacks does she
For every 10 minutes that Lacy practices her saxophone, Noah practices his saxophone for 5 minutes.
Number of Minutes Lacy Practices
0
do in 5 minutes? Use the double number line to support your answer. Expect to see varied solution paths. Accept accurate responses, reasonable explanations, and equivalent answers for all student work.
Examples 1.
The top number line shows the number of jumping jacks Kelly does, and the bottom
Sample Solutions Practice
Ratio Tables and Double Number Lines In this lesson, we
2
Kelly does 50 jumping jacks in 1 minute.
EUREKA MATH2 California
Grade 6 ▸ Module 1 ▸ Topic B ▸ Lesson 6
73
74
EUREKA MATH2 California
G6 ▸ M1 ▸ TB ▸ L6 ▸ PRACTICE
Grade 6 ▸ Module 1 ▸ Topic B ▸ Lesson 6
124-147_EM2CA180_25_TEG6M1_L06_172729.indd 144
1
19/11/25 5:33 PM
2 Sample Solutions
The Recap outlines key learning from the lesson and provides examples with supporting notes.
• Goes beyond an answer key to include examples and representations of possible student strategies to help teachers orient to analyzing student work.
• Summarizes the main learning in the lesson. • Defines terms introduced in the lesson.
• Provides a starting point for teachers to elicit, make sense of, and respond to student thinking.
• Shows problems like those completed in class and examples of the thinking that helps students solve the problems. Teachers may use the Recaps as a guide to support practice outside of class. Recaps are also useful for anyone supporting the student’s learning, including family members, tutors, and special educators. 19
© Great Minds PBC
RECAP I can use ratio tables and double number lines to represent ratio relationships and to solve problems.
© Great Minds PBC
Date
© Great Minds PBC
Name
1
Observational Assessment Recording Sheet Grade 6 Module 1 Topic B
Student Name
Ratios, Rates, and Percents
Collections of Equivalent Ratios Standards
Achievement Descriptors
6.RP.A.1
Write and explain ratios that describe relationships between two quantities.
6.Mod1.AD1
6.Mod1.AD3
6.RP.A.3
Solve real-world and mathematical problems by using ratio reasoning.
2
Dates and Details of Observations
No content.
Module 1 Achievement Descriptors
Achievement Descriptors (ADs) are standards-aligned descriptions that detail what students should know and be able to do based on the instruction. ADs are written by using portions of various standards to form a clear, concise description of the work covered No content. in each module.
© Great Minds PBC
Each module has its own set of ADs, and the number of ADs varies by module. Taken together, the sets of module-level ADs describe what students should accomplish by the end of the year.
6.RP.A.3.a
6.Mod1.AD4
Represent ratio relationships by using tables and the coordinate plane.
ADs and their proficiency indicators support teachers with interpreting student work on No content. • informal classroom observations, • data from other lesson-embedded formative assessments, • Exit Tickets,
6.Mod1.AD1 Write and explain ratios that describe relationships between two quantities.
6.RP.A.1
6.Mod1.AD2 Write and explain the unit rate that describes a relationship between two quantities.
6.RP.A.2
6.Mod1.AD3 Solve real-world and mathematical problems by using ratio reasoning.
6.RP.A.3
6.Mod1.AD4 Represent ratio relationships by using 6.RP.A.3.a tables and the coordinate plane. 6.Mod1.AD5 Compare ratio relationships by using various representations.
6.RP.A.3.a
6.Mod1.AD6 Solve real-world problems by using
• Topic Quizzes, and PP Partially Proficient P Proficient HP Highly Proficient • Module Assessments. This page may be reproduced for classroom use only.
Module 1 Achievement Descriptors
This module contains the nine ADs EUREKA MATH2 California Grade 6 ▸listed. Module 1 ▸ Topic B
261
unit rates.
6.RP.A.3.b
6.Mod1.AD7 Model and explain percents and problems involving percents.
6.RP.A.3.c
6.Mod1.AD8 Solve problems that involve finding the
19/11/25 5:32 PM
6.RP.A.3.c
6.Mod1.AD9 Convert among units by using ratio reasoning to solve problems.
6.RP.A.3.d
© Great Minds PBC
261_EM2CA180_25_TEG6M1_Topic B OARS_172729.indd 261
part, whole, or percent.
588
EUREKA MATH2 California
Grade 6 ▸ Module 1
588-589_EM2CA180_25_TEG6M1_AD_172729.indd 588
19/11/25 5:32 PM
Multiple methods of assessment* are woven throughout the curriculum. 1
• Observational Assessment Recording Sheets provide a short, qualitative checklists that captures student progress.
2
• Proficiency Indicators help teachers see what proficiency looks like for a particular Achievement Descriptor and standard.
Rubrics and teacher guidance within the curriculum inform decisions about instructional practices in response to student success in meeting or exceeding the standards.
*Assessments available for download in the Eureka Math2 California digital experience. 20
1
2
TOPIC QUIZ Exit Ticket Name
1.
B-1
MODULE ASSESSMENT Exit Ticket Name
Date
There are a total of 24 blue pencils and red pencils in a box. The ratio of the number of blue pencils to the number of red pencils is 7 : 5. How many blue pencils are in the box?
1.
1-1
Date
A soup recipe calls for 3 cups of potatoes for every 2 cups of milk. How many cups of potatoes should be used for every 1 cup of milk? 2_ 3 3 B. _ 2
A. 7
A.
B. 10 C. 12
C. 2
D. 14
D. 3 2.
The tape diagram represents the ratio of the number of pennies in jar A to the number of pennies in jar B.
2.
Number of Pennies in Jar A
Number of Friendship Bracelets
Number of Pennies in Jar B
Part A
Eddie moves _4 of the pennies in jar A to jar B. Draw a tape diagram that represents the new ratio of the number of pennies in jar A to the number of pennies in jar B.
This page may be reproduced for classroom use only.
Number of Green Beads
1 7
49
25 224
© 2026 Great Minds PBC
© 2026 Great Minds PBC
This page may be reproduced for classroom use only.
1
EUREKA MATH2 California
1
The table shows the ratio relationship between the number of friendship bracelets made and the number of green beads used. Complete the table.
Grade 6 ▸ Module 1 ▸ Topic B
11
EUREKA MATH2 California
2
Exit Tickets, Topic Quizzes, and Observational Assessment Recording Sheets* provide teachers with daily and weekly formative snapshots to measure what students have learned and are able to do.
Grade 6 ▸ Module 1
51
Module Assessments* are summative and include a variety of item types that include selected response, constructed response, and open-ended questions. • Digital assessments provide visibility into student learning through formative and summative feedback and data and include auto-scoring of topic quizzes and benchmarks. • Scoring Guides are provided for Module Assessments and Topic Quizzes. Guides may be found in the Great Minds digital platform within the Module or Topic resources. • Assessments include many techenhanced items found with SBAC assessment. • Digital assessment data are available in various auto-generated proficiency reports at the individual, classroom, and school levels.
*Assessments available for download in the Eureka Math2 California digital experience. 21
Performance Assessment
LEVEL 6
1
The Fastest Way Back Agenda • Build Context | 5 min Name
• Assessment | 20 min
The Fastest Way Back
• Close Assessment | 5 min
Mr. Perez is driving home. He leaves from his office, represented by the point (−5, −2) on the map. Mr. Perez’s apartment is represented by the point (0, 3).
Materials and Preparation
• The distances from (0, 0) to (1, 0) and from (0, 0) to (0, 1) are each 200 meters. • On First Avenue, Main Street, Seventh Avenue, and Front Street, Mr. Perez typically travels 60 kilometers per hour.
• Calculator
• There are three one-way roads on the map. The road from (−2, 5) to (−2, −2) is southbound only. The road from (2, 2) to (−5, 2) is westbound only. The road from (0, 1) to (0, 4) is northbound only.
• Grid paper
• On all the other roads, Mr. Perez typically travels 30 kilometers per hour.
• Highlighters
• Each left turn typically takes 45 seconds, and each right turn typically takes 15 seconds.
• Removable map
Part A
• Ruler
Mr. Perez decides to drive the shortest distance back to his apartment, traveling along the following route. • From (−5, −2) to (−5, 0)
Mathematical Practices in Action
• From (−5, 0) to (1, 0) • From (1, 0) to (1, 2) • From (1, 2) to (0, 2)
Students are likely to demonstrate evidence of the following MPs as they complete the assessment.
• From (0, 2) to (0, 3) How much time does this route take?
Part B
•
Use the map to find a faster route back to the apartment for Mr. Perez. Show your work and explain your reasoning.
• • PERFORMANCE ASSESSMENT | © 2025 Great Minds PBC
6 | The Fastest Way Back
1
as they find a faster route. of units and unit conversions to complete multi-step calculations. they combine calculations for time or speed.
PERFORMANCE ASSESSMENT | © 2025 Great Minds PBC
1
6 | The Fastest Way Back
Performance Assessments* are openended or open-middle real-world problems that invite students to demonstrate their math skills in a knowledge-rich context. • They integrate mathematics content and the language needed to participate in the Standards for Mathematical Practice. • A rubric offers suggestions for using assessment data to inform instructional decisions to support students’ consistent progress toward meeting or exceeding state standards. • The Plan–Check–Reflect tool in Performance Assessments gives students an opportunity for self-reflection and self-evaluation.
*Assessments available for download in the Eureka Math2 California digital experience. 22
1
1 DATA TALK The Human Cost of Unsafe Water 10 minutes
Percent of Deaths Linked to Unsafe Drinking Water, 2019
2
This data was collected by the Institute for Health Metrics and Evaluation for their Global Burden of Disease study published
Data Investigation | Classroom Sound Levels
in 2019.
No Data
When is our classroom the loudest? 0%
2%
4%
6%
8%
10%
12%
Investigate by using the four steps of the statistical investigative process.
The data raises awareness that, around the world, unsafe water sources are an attributed risk factor in the Ask a Statistical Collect share of total deaths from other causes. This means that drinking unsafe water puts individuals at risk for contracting potentially fatal diseases. Anticipate questions about why certain regions of the world have Question Data a greater percent of deaths from causes linked to unsafe water sources. Help students understand that access, rather than accident or choice, is the main contributing factor in the trends shown. Distinguish between examining geographical circumstance and drawing conclusions about the people who live there.
Content Connections
Pacing Suggestion First Day
Facilitate Step 1 and begin Step 2 by having students plan and discuss.
Data Collection Days
Math
• Measurement • Represent multivariable
30 minutes DATA TALK | © 2025 Great Minds PBC
Analyze Data
6 | The Human Cost of Unsafe Water
Continue Step 2 by measuring sound levels at
1 data
Reading and Writing
designated times throughout the day for � days. 5 minutes per day
• Discussion questions Science
Interpret Results
Materials
Sound level meter
• Data Talk: How Loud Is Too Loud? • Technology to access a sound level meter that reads in decibels 1 per class
• Data Investigation student handout 1 per student
• Sound and energy
Last Day
Facilitate Steps 3 and 4 to close the investigation. 40 minutes
DATA INVESTIGATION | © 2025 Great Minds PBC
1
3 | Classroom Sound Levels | TE
2
Data Talks* • Engage students in conversations around real-world contexts and data and spark inquiry. • Support with suggested learning scaffolds at just the right moment.
1
Data Investigations* are multiday activities that empower students to explore the full statistical investigative process—from asking questions to collecting, interpreting, and reporting on the findings.
• Cover uncommon topics in science and humanities, building knowledge and connecting learning across subject areas. • Often connect mathematics to familiar topics to make the knowledge sticky.
*Data Talks available for download in the Eureka Math2 California digital experience. 23
Digital Tools that Enhance and Streamline instruction
Digital Manipulatives Teachers can use these tools to display and demonstrate mathematical concepts during class. Students can use these resources in class and at home to practice math concepts, reinforce their growing math understanding.
Context Videos Context videos help students see math in the real world and are accessible to all students, including multilingual learners. When available, videos can be accessed in the Eureka Math2 California digital experience.
How to Videos Short videos that support Great Minds® educators as they learn about implementation basics, math content, and instructional routines.
© 2026 Great Minds PBC 031726