SUMMER 2026 BERKADIA SENIORS HOUSING COMMENTARY
Introduction
The investment debate surrounding seniors housing is over. The question is no longer whether institutional investors should allocate capital to the sector, but how quickly they can deploy it before fundamentals become even more competitive.
50x
Higher NOI Growth than the Broader CRE Average for Seniors Housing
Source: NCREIF
disciplined—acquisition volume still outpaced new start investment by roughly 3-to-1 over the trailing year. That restraint is doing existing owners a favor: fewer new units competing for the same rising demand.
3-To-1
Acquisition Volume vs. New Start Investment in Seniors Housing
Source: Real Capital Analytics
The numbers explain why. Seniors housing posted the second-best return of any property type in the first half of the year, with NOI growth running nearly 50x more than the broader CRE average, a gap wide enough to reshape how allocators rank the sector. That performance is showing up in transaction volume too: more than $14.7 billion changed hands in the first half of the year, with cross-border capital returning to the space in a way that it hasn’t in a decade.
Supply tells the other half of the story. Construction starts are ticking back up, but developers are staying
$14.7B+
In First-Half Transaction Volume for Seniors Housing
Source: Real Capital Analytics
The strength isn’t confined to one part of the market, either. Active adult communities are holding steady above 93% occupancy with healthy rent growth, while the majority of assisted living and independent living properties are extending multiyear streaks of rising occupancy against a shrinking development pipeline.
Taken together, it’s a sector where demographics, capital flows, and operating fundamentals are all pulling in the same direction, and that is what this Mid-Year Commentary will cover.
Mid-Year Review
Capital has been selective across commercial real estate this cycle, and seniors housing stands out as one of the few property types where the case holds up on the numbers, not just the narrative. According to the most recent data from NCREIF, seniors housing ranked seniors housing as the second-best performing property type, at a 12.8% annual return. NOI growth reached 20.2%, against 0.4% for all CRE sectors, a gap wide enough to change how allocators are weighting the sector. Appreciation ran 7.8%, and vacancy tightened by nearly 200 basis points.
The demand story isn’t a forecast anymore — it’s here. More seniors are reaching the age where housing and
90.1%
National Average Occupancy Rate for Seniors Housing, Q2 2026
Source: NICMap
care decisions become immediate, and new supply isn’t keeping pace. That gap favors existing, welllocated communities with strong operators, giving the sector embedded pricing power and a longer growth runway than most traditional CRE categories can offer right now.
Few CRE sectors offer what seniors housing does today: continued demographic demand, accelerating and growing NOI, and an improving absorption rate. As institutional investors pivot toward underwriting future cash flows over current income, seniors housing remains uniquely positioned where demographics, operating fundamentals, and capital flows all converge.
20.2%
NOI Growth for Seniors Housing vs 0.4% for All CRE Sectors
Source: NCREIF
7.8%
Increase in Average Price Per Unit Since the End of 2025
Source: RCA
Investment Trends - Sales
The seniors housing sector widened its performance gap relative to the rest of commercial real estate in 2026. Investor demand carried through from a strong close to 2025, with more than $14.7 billion reported in seniors housing assets trading through June 30, 2026.
This wasn’t a one-quarter surge. The first quarter was exceptionally active, and the second quarter still added nearly $3.0 billion in closed volume, a sign that buyer interest is broad-based rather than in a single opportunistic push. In total, 539 properties and more than 55,200 units changed hands during the first half of the year, underscoring that this is not just a headline volume story, it is a market with real depth and a growing pool of active capital.
One of the more notable developments to begin 2026 has been the re-emergence of cross-border capital in the seniors housing investment market. After playing only a limited role across much of the last decade, international buyers have returned in a meaningful
way, accounting for 20.6% of year-to-date investment activity. That resurgence has been led by major global players, most notably Toronto-based Brookfield Asset Management and South Korea’s Meritz Financial Group, underscoring the sector’s growing appeal beyond domestic capital sources.
REITs remain the largest buyer group at 36.5% of activity, but the return of cross-border capital broadens the buyer base beyond the REITs, institutional investors, and private equity firms that have historically dominated the space.
Top Buyers
Brookfield AM
Sonida Senior Living
TPG Real Estate
Ventas
Janus Living
Chiron Real Estate Inc.
KKR
Clarion Partners
Sabra Health Care REIT
Source: RCA - Data reflects total investment volume for the first half of 2026
Debt Capital Markets
The seniors housing debt capital markets have carried 2025’s momentum into 2026, with access to significant financing options across the sector. Borrowers have access to better financing terms, pricing, and flexibility as underlying fundamentals continue to improve. A broad range of capital sources remains active, with lenders pursuing transactions across deal types and the risk spectrum.
2026 Loan Origination Trends*
Banks have been especially aggressive in pursuing new deals. After spending years on the sidelines, many have re-entered the seniors housing market and are offering strong pricing, terms, and structures, often on a nonrecourse basis. They have shown a consistent willingness to maximize proceeds for newer assets in strong primary and secondary markets, even at thinner in-place DSCRs. This bank-led competition is pressuring other lender types on both pricing and structure.
HUD remains an active financing solution for seniors housing. More borrowers are exploring and executing HUD transactions, as the program has become a workhorse for complex or noncore situations, including older-vintage assets, secondary and tertiary locations, Medicaid exposure, 100% memory care, and skilled nursing. Where acuity, reimbursement, or market profile falls outside bank or GSE comfort, HUD remains the primary solution.
Both Freddie Mac and Fannie Mae continue to quote transactions actively. They remain key sources of permanent financing for newer, private-pay assets in primary and secondary markets. They continue to execute on single-asset and larger portfolio transactions and have expanded their product offerings over the past 12 months. Freddie Mac continues to lead the agencies in deals and volume.
Life companies have also increased their activity in the seniors housing sector, offering both fixed- and floatingrate options. Historically focused on non-licensed active adult and independent living, they have shown a meaningful increase this year in quotes and loan volume for licensed, higher-acuity properties.
HUD, Fannie Mae, and Freddie Mac are largely maintaining traditional program discipline, creating two parallel tracks: tightly defined agency executions and more flexible, market-driven balance sheet and fund capital.
Debt and credit funds have expanded meaningfully in the sector, particularly for large-scale and portfolio transactions, with transaction activity rising substantially in 2026. They offer strong options at higher loan-to-cost levels and, along with other lenders, have tightened pricing while remaining flexible on structure.
In summary, the seniors housing debt capital markets have remained robust throughout 2026, and demand is expected to continue into 2027. Rates, particularly Treasurys, have remained volatile amid macroeconomic and geopolitical uncertainty. Borrowers continue to have access to a wide range of bridge and permanent financing solutions—including banks, agencies, HUD, debt funds, life companies, CMBS, and selective REITs— allowing them to tailor capital solutions to asset quality, market, and business plan.
Construction Update
Development Returns but Remains Selective
The seniors housing construction and development market appears to be moving into a more active phase, but the pipeline remains selective and uneven. Development activity has improved meaningfully from the depressed levels seen across much of 2024, yet the market is still defined more by caution than by broadbased expansion. The clearest evidence is the rebound in construction investment volume. RCA data reports an estimated $7.7 billion has been invested over the trailing 12-month period, up sharply year over year, while total investment development underway stands at roughly $9.7 billion across 240 properties and nearly 25,000 units.
That said, the pattern does not suggest a full development cycle resurgence. Instead, it points to a market in which starts are returning only where
3:1
Ratio of Acquisition Volume to New Development Investment
Source: RCA
Completions haven’t caught up to the rebound in starts. Trailing four-quarter completions totaled approximately $4.4 billion, down year over year — likely due to some longer construction timelines, capital constraints, and a smaller pipeline working through delivery after the earlier slowdown. For existing owners, that lag is a good thing: it limits near-term oversupply risk even as capital re-engages with the asset class.
The bigger story is the widening gap between new construction and acquisitions. Over the trailing four quarters through Q2 2026, acquisitions totaled roughly $23.0 billion versus $7.8 billion in construction starts — a nearly 3:1 ratio. That gap has grown steadily: starts and acquisitions were roughly in line in late 2023, and acquisitions had already pulled ahead to 2.5x starts by 2024.
$9.7B Currently Under Development
Source: RCA
demographics, entitlement conditions, capital access, and operating outlook are strong enough to support new execution risk. Hanover County, just outside of Richmond, Virginia, and the greater Sarasota market represent slightly more than half of the listed starts volume over the last four quarters. Additional activity is visible in markets such as Dallas, San Diego, Phoenix, Chicago Proper, and Washington, D.C., but the overall pattern remains one of select-market conviction rather than broad national expansion.
$4.4B New Development Completed Over the Last 12 Months
Source: RCA
Investors like the sector more than they like development risk. That’s a function of several things at once, including elevated construction and labor costs, financing friction, longer execution timelines, lease-up uncertainty, and a basis on existing assets that can still compare favorably with replacement cost. Acquisitions offer a clearer line to yield and cash flow; development still asks for a stronger underwriting case and more tolerance for execution risk.
Active Adult
Demand is Real - For Select Unit Types
The active adult sector continues to stand out as an attractive niche within the broader multifamily landscape, supported by favorable demographic tailwinds and demand from older renters seeking a maintenance-free, lifestyle-oriented housing option. As of Q2 2026, the market totaled 123,918 units and remained fundamentally healthy at 93.1% occupancy
Active Adult Operating Fundamentals
The strength of these formats highlights a clear preference for practical, right-sized floor plans that offer residents comfort, flexibility, and attainable monthly housing costs.
Smaller and more specialized product types remain a limited share of the overall inventory base and have proven less popular with the target renter. Studio and three-bedroom units continue to lag the broader market, suggesting demand is most concentrated in conventional layouts that best align with active adult household needs.
93.1%
Source: NICMap
with an average monthly rent of $2,046, reflecting durable demand for well-positioned product. In contrast, the comparable Class-A multifamily market posted an average occupancy rate of 90.0% and average monthly rent of $2,201 through the first half of 2026.
Performance across the sector continues to be driven by the core one- and two-bedroom inventory, which together account for more than 95% of total supply and represent the clearest expression of renter demand. One-bedroom units, comprising 48.4% of inventory, were 91.9% occupied at an average rent of $1,795, while two-bedroom units, representing 46.8% of stock, led the market at 94.1% occupancy with average rent of $2,574.
National Average Occupancy Rate for Active Adult - up 120 Bps Since the End of 2025
Source: NICMap
$2,046
National Average Monthly Rent for Active Adult
Source: NICMap
For investors: assets weighted toward one- and twobedroom product remain the safer bet for stable occupancy and dependable cash flow in this segment, mirroring the current preferred investment strategy in the traditional seniors housing sector.
Community Type Trends
At mid-year 2026, the seniors housing market continues to be defined by a widening supply-demand imbalance. As noted previously, average occupancy across all NIC markets crossed 90% in June for the first time since at least 2015, extending the sector’s streak to 18 consecutive quarters of occupancy growth.
New supply remains constrained: units under construction fell below 25,000 at the end of the first half of the year, the 26th consecutive quarterly decline in the development pipeline. With deliveries this limited, existing assets are the ones capturing the benefit.
That backdrop is also supporting pricing momentum: average national rent reached $5,659 in June, up 3.3% since the start of the year.
Majority Assisted Living (AL)
The asset type continues to show a strengthening operating backdrop, with fundamentals moving steadily in the right direction. Average occupancy reached 88.6% in the second quarter, up 180 basis points year over year and marking the highest level in the data series, while extending the sector’s run to 21 consecutive quarters of occupancy growth.
> 90%
Average Occupancy Across all NIC Markets; for the First Time in Over a Decade
Source: NICMap
That tightening backdrop is also supporting pricing power. Average rent climbed to $6,977 in the second quarter, up 4.9% year over year and roughly 3.2% since year-end 2025. Occupancy, supply, and rent growth are all pointing the same direction..
Majority Independent Living (IL)
Entered the second half of 2026 with clear operating momentum. Occupancy climbed to 91.6% in Q2 2026, the highest point in the data series and a sign that demand continues to deepen across the segment. That progress has not been sudden or one-off, it reflects 17 straight quarters of improvement, mirroring the consistent growth story of seniors housing.
Just as important, new competition remains muted. The construction pipeline stands at only 13,313 units, a historic low that continues to limit future supply pressure. With fewer projects moving through development, existing communities are capturing the benefit of tightening market conditions.
Revenue is following the same pattern: average rent reached $4,484 in the second quarter, up 4.5% year over year and roughly 3.2% since year-end 2025. Independent
< 25,000
Units Under Construction; the 26th Consecutive Quarterly Decline in Development
Source: NICMap
That demand momentum continues to build against a steadily shrinking development pipeline. Units under construction fell to just 11,582 in Q2 2026, the lowest level on record and the 18th consecutive quarter of decline. Scarce new inventory is driving highly favorable market conditions for established properties.
$5,659
Average National Rent in June, up 3.3% Since the Start of the Year
Source: NICMap
Living is heading into the second half with stronger occupancy, limited new supply, and rents still moving up.
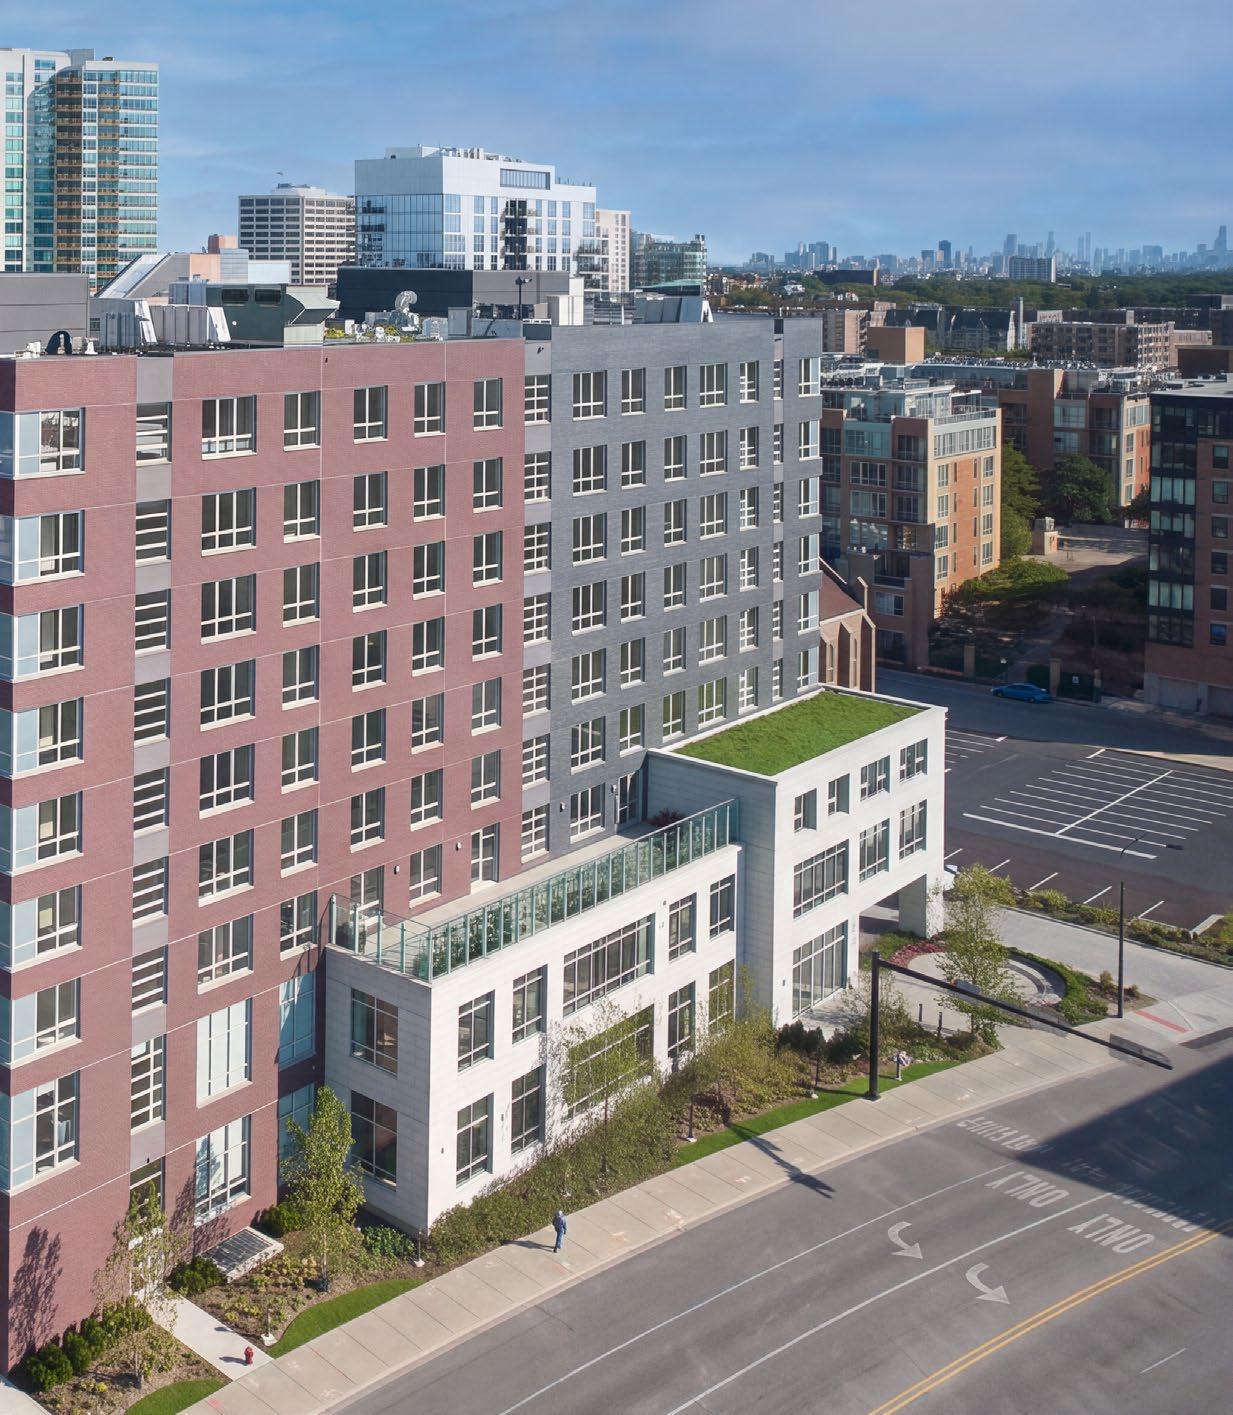
Majority Independent Living Property
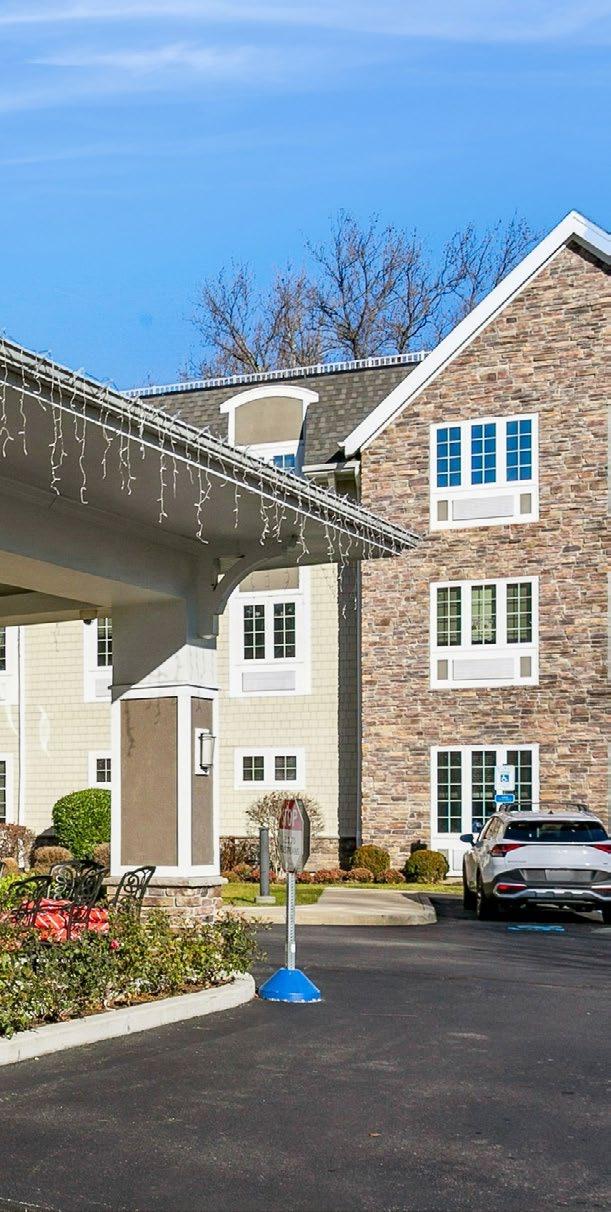
Majority Assisted Living Property
Investor Implications
Seniors housing presents a compelling opportunity for investors today, with national occupancy surpassing 90%, new supply remaining near historic lows, institutional capital deployment continuing to accelerate, debt markets fully open, and existing assets offering embedded earnings growth. Few commercial real estate sectors currently match the combination of durable demographic demand, accelerating NOI, and meaningful upside potential that seniors housing provides. As institutional investors increasingly focus on underwriting future cash flows rather than current income alone, seniors housing stands out as a sector where demographics, operating fundamentals, and capital flows are all converging—creating one of the strongest acquisition environments the sector has ever experienced.
Institutional capital deployment continues to accelerate
Debt markets are fully open
Existing assets offer embedded earnings growth
The next several years represent one of the strongest acquisition periods seniors housing has experienced

SUMMER 2026
Recent Top Transactions
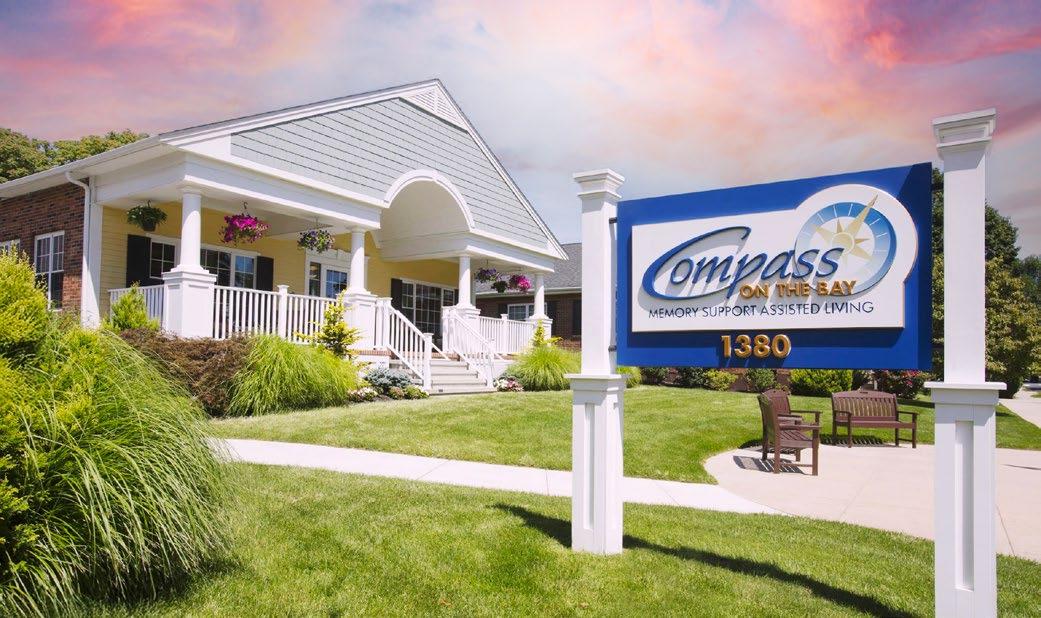
COAST & CANOPY 4 PORTFOLIO
Various Cities, MA & NH | 280 Units | AL/MC
SALE & FINANCING | CLOSED July 2026
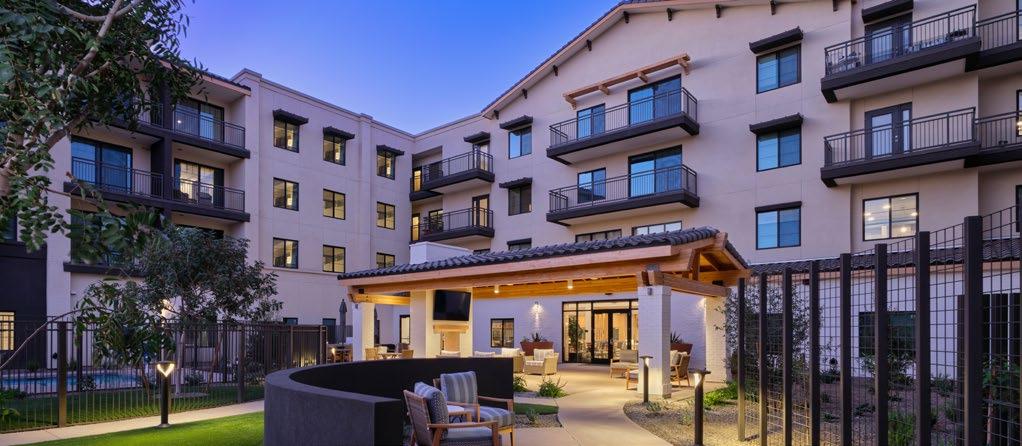
ACOYA SHEA
Scottsdale, AZ | 147 Units | IL/AL/MC
SALE & FINANCING | CLOSED June 2026
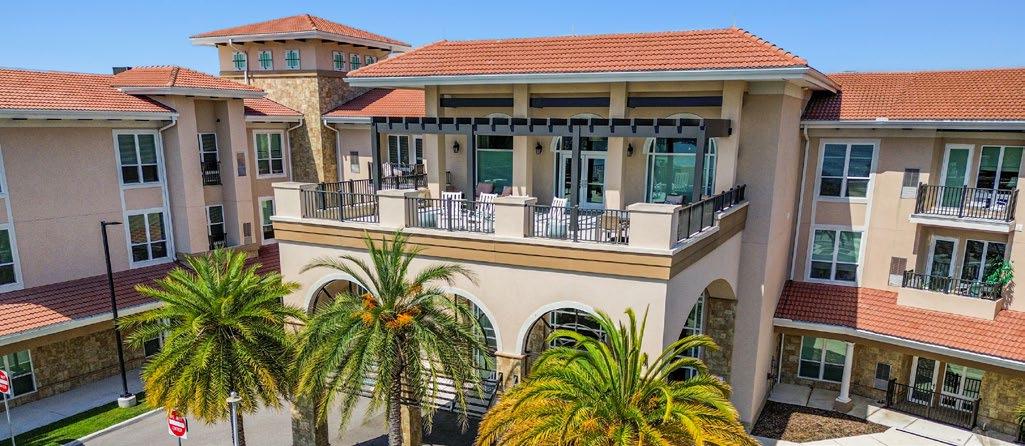
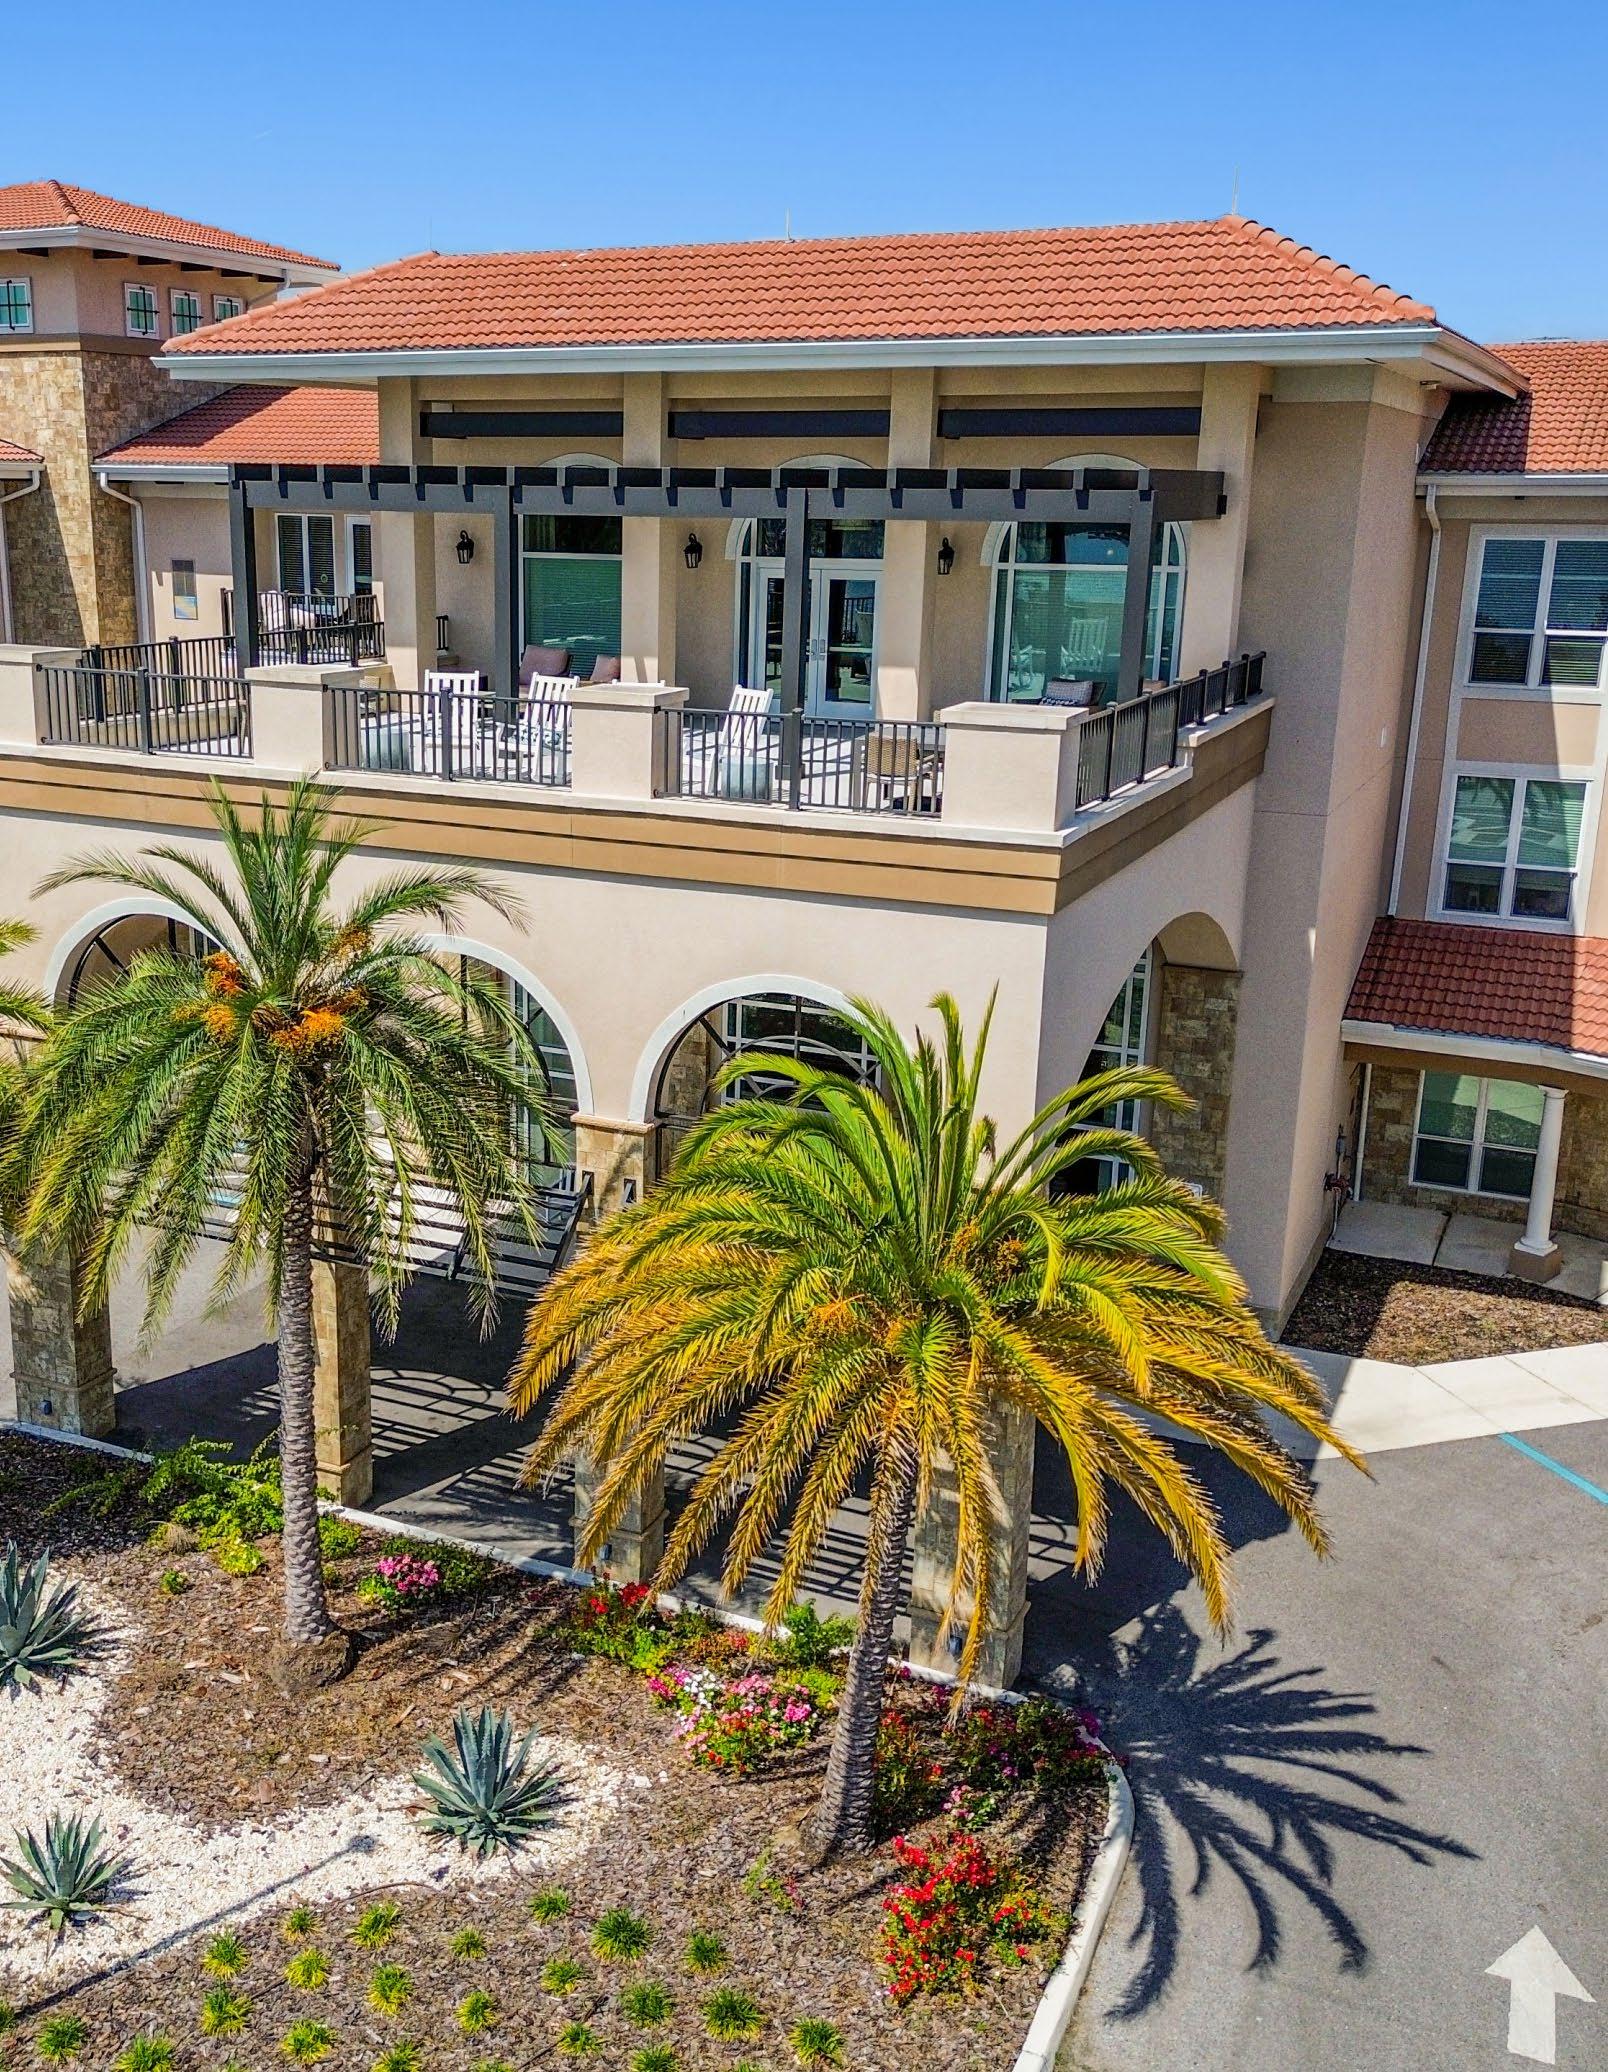
HEARTIS VENICE
Venice, FL | 182 Units | IL/AL/MC
SALE & FINANCING | CLOSED April 2026
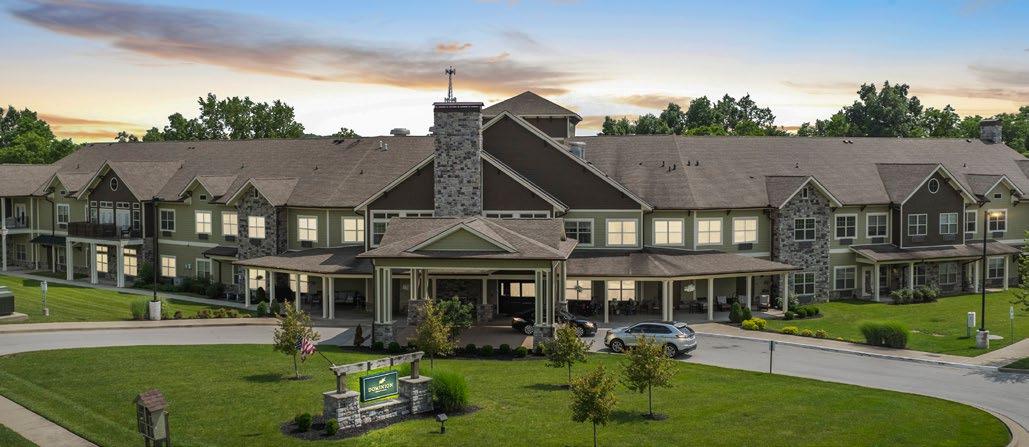
DOMINION 9 PORTFOLIO
Various Cities, KY, SC, TN | 460 Units | AL/MC
SALE | CLOSED February 2026
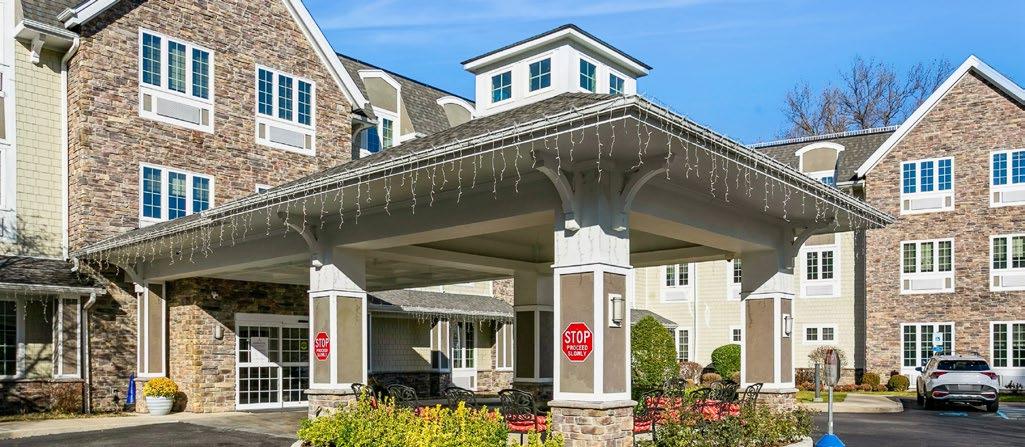
AMBASSADOR OF SCARSDALE
Scarsdale, NY | 125 Units | AL/MC
SALE & FINANCING | CLOSED July 2026
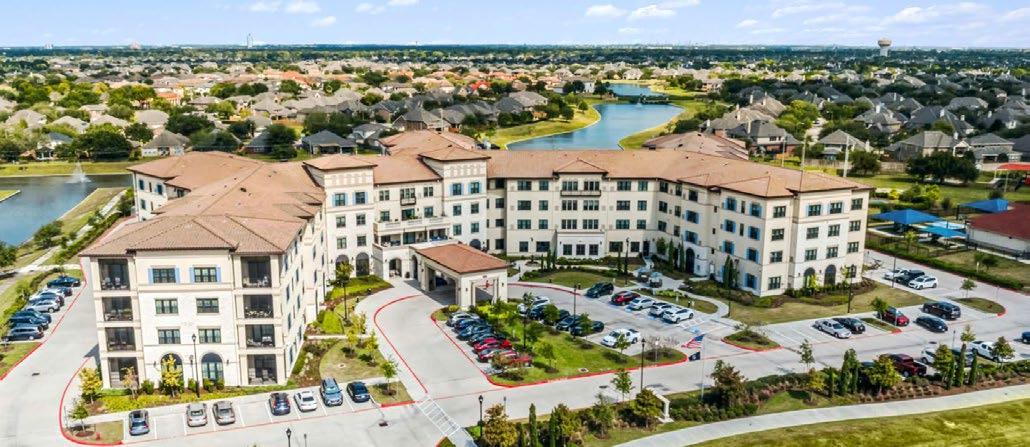
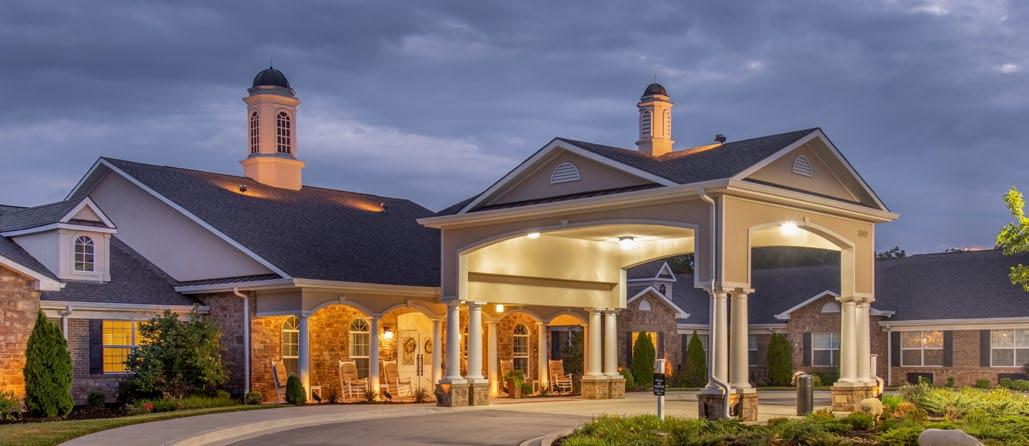
GRAND LIVING AT TUSCAN LAKES
League City, TX | 186 Units | IL/AL/MC
SALE & FINANCING | CLOSED May 2026
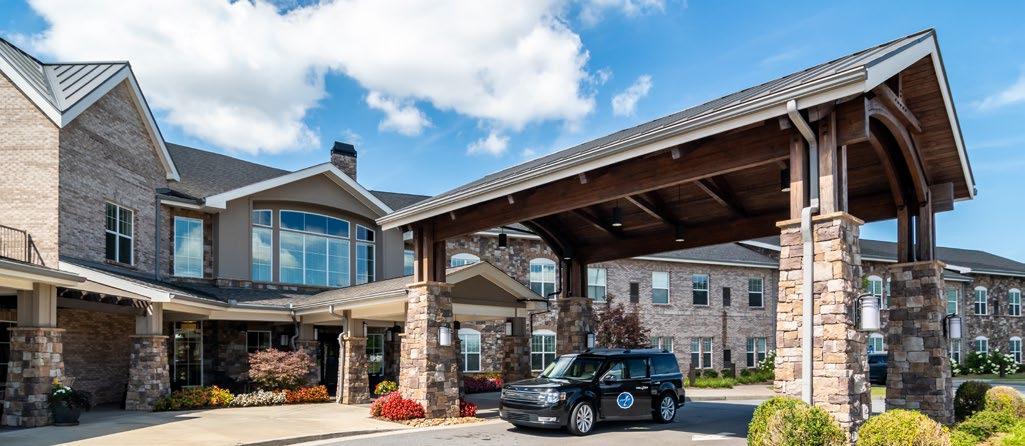
BENTON HOUSE KC 6 PORTFOLIO
Kansas City MSA, KS, MO | 413 Units | AL/MC
SALE | CLOSED February/March 2026
ARBOR TERRACE GA TRIO
Atlanta MSA, GA | 394 Units | IL/AL/MC
SALE | CLOSED January 2026
Contact Information
Investment Sales

DAVID FASANO
Senior Managing Director, Practice Leader of Seniors Housing & Healthcare 312.576.9370
david.fasano@berkadia.com TX License #737206

ROSS SANDERS
Senior Managing Director, Practice Leader of Seniors Housing & Healthcare 314.221.8543
ross.sanders@berkadia.com MO License #2007038807

MIKE GARBERS
Senior Managing Director, Practice Leader of Seniors Housing & Healthcare 407.810.5135
mike.garbers@berkadia.com FL License #BK3300367

CODY TREMPER
Senior Managing Director, Practice Leader of Seniors Housing & Healthcare 214.215.1364
cody.tremper@berkadia.com TX License #622302

BROOKS MINFORD
Senior Director 208.309.1404
brooks.minford@berkadia.com FL License #SL3277361 VA License #225241778

STEVE ERVIN
Senior Vice President, Head of FHA/HUD and Seniors Housing Finance 301.202.3575
steve.ervin@berkadia.com

JAY HEALY
Managing Director
843.806.4393 jay.healy@berkadia.com

AUSTIN SACCO
Managing Director 346.444.8997
austin.sacco@berkadia.com TX License #597755

EDWARD WILLIAMS
Managing Director 404.654.2346
ed.williams@berkadia.com

bianca.andujo@berkadia.com

STEVEN MUTH
Managing Director
518.573.3190
steven.muth@berkadia.com

GARRETT SACCO
Managing Director
713.598.0909
garrett.sacco@berkadia.com TX License #746407

ANDREW LANZARO Director
646.600.7817 andrew.lanzaro@berkadia.com

Berkadia® is a trademark of Berkadia Proprietary Holding LLC
Commercial mortgage loan origination and servicing businesses are conducted exclusively by Berkadia Commercial Mortgage LLC and Berkadia Commercial Mortgage Inc. This report is not intended to solicit commercial mortgage loan brokerage business in Nevada. Investment sales and real estate brokerage businesses are conducted exclusively by Berkadia Real Estate Advisors LLC and Berkadia Real Estate Advisors Inc. For state licensing details for the above entities, visit: www. berkadia.com/licensing.
This document and any statements, information, data and content contained therein, and any materials, information, images, links, sounds, graphics or video provided in conjunction with this document (collectively “Materials”) has been prepared for informational purposes or general guidance on matters of interest only, and does not constitute professional advice, advertising or a solicitation. The Materials are of a general nature and not intended to address the circumstances of any particular individual or entity. You should not act upon the information contained in the Materials without obtaining specific professional advice. As such, nothing herein constitutes legal, financial, business, investment or tax advice and you should consult your own legal, financial, tax, investment or other professional advisor(s) before engaging in any activity in connection herewith. The information in the Materials is not a substitute for a thorough due diligence investigation. No representation or warranty (express or implied) is given as to the accuracy or completeness of the information contained in the Materials, and, to the extent permitted by law, Berkadia Commercial Mortgage LLC ( together with its affiliates, the “Company”) neither accept nor assume any liability, responsibility or duty of care for any consequences of you or anyone else acting, or refraining to act, in reliance on the Materials or for any decision based on them. No part of the Materials is to be copied, reproduced, distributed or disseminated in any way without the prior written consent of the Company.