
Rational Reflections March 2026

Page 1


Should You Sell Your Stocks?

Three good years in a row feels like a warning. The data suggests otherwise.

Three Good Years in a Row

After three consecutive years of above-average equity returns, a question we often field from clients is some version of: “Should I be selling?” We certainly understand the instinct. The S&P 500 returned roughly 26%, 25%, and 18% in 2023, 2024, and 2025, respectively. This represents the longest streak of above-median annual returns since the mid-1990s. Including dividends, the S&P 500 delivered more than 85% cumulatively over that span, a period when a significant portion of market commentary was urging caution or outright skepticism.

The result is an investor base that has been well-rewarded (for those who have not sold) but is growing increasingly anxious. This piece attempts to address that anxiety with data rather than intuition.

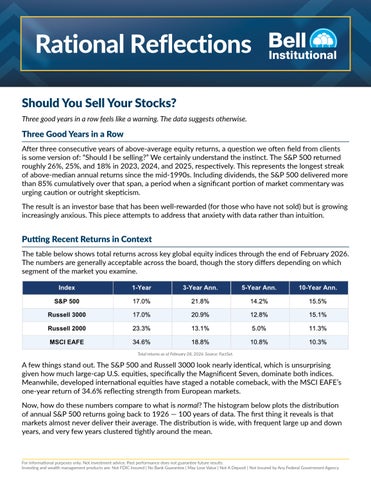
Putting Recent Returns in Context

The table below shows total returns across key global equity indices through the end of February 2026. The numbers are generally acceptable across the board, though the story differs depending on which segment of the market you examine.

A few things stand out. The S&P 500 and Russell 3000 look nearly identical, which is unsurprising given how much large-cap U.S. equities, specifically the Magnificent Seven, dominate both indices. Meanwhile, developed international equities have staged a notable comeback, with the MSCI EAFE’s one-year return of 34.6% reflecting strength from European markets.

Now, how do these numbers compare to what is normal? The histogram below plots the distribution of annual S&P 500 returns going back to 1926 — 100 years of data. The first thing it reveals is that markets almost never deliver their average. The distribution is wide, with frequent large up and down years, and very few years clustered tightly around the mean.

Total returns as of February 28, 2026. Source: FactSet.

What the histogram makes clear is that a return in the 10%-20% range is the single most common outcome for the S&P 500, occurring 22 times out of 100 years. It is not a peak or a warning sign. A return in the range of 10%-20% is simply normal!

Looking at 2025 more closely, we see that the S&P 500’s 17.9% return ranked in the 54th percentile of historical years. In other words, 54 of the prior 100 years produced a lower return and 45 produced a higher one. That is not a market screaming excess, but rather a market performing slightly above its median.

Source:

The statistics table reinforces this. The S&P 500’s mean annual return over 100 years is 12.3%, with a standard deviation of 19.6%. The standard deviation is the key number: it tells you that a statistically normal return (+/- one standard deviation outcome in either direction) can land anywhere from roughly -7% to +32%. Three consecutive years in the positive part of that range is well within the distribution of plausible outcomes.

Source: SBBI data, FactSet. Annual total returns, 1926–2025.
Source: SBBI data, FactSet. S&P 500 2025 return ranked against 100 years of annual return history.
SBBI data, FactSet. Statistical summary of S&P 500 annual returns, 1926–2025.

The Case for Concern and the Case Against

We are not dismissing the legitimate reasons for caution. Valuations by most standard measures, such as price-to-earnings, the Shiller CAPE, and even the Buffett Indicator (market capitalization to GDP), are near historic highs. As of February 28, the S&P 500 was trading at ~22x forward earnings, well above long-run averages. We have written about the shortcomings of ratio-based valuation at length in prior issues, but even we acknowledge that forward-looking returns are a function of current prices. The degree of concentration in a handful of mega-cap technology names also means the index is carrying more idiosyncratic risk than it has historically.

Bears will further note that geopolitical and trade uncertainty remains elevated, that the Federal Reserve has limited room to cut rates from current levels, and that the easy money from the postpandemic recovery has largely been earned.

But here is what often gets lost in the “stocks are expensive” narrative: U.S. companies have actually been delivering the earnings and cash flows to justify much of that appreciation. Aggregate S&P 500 free cash flow per share grew at 8.2% annually over the past 10 years. Earnings grew at an identical 8.2%. In 2025 alone, the companies in the S&P 500 returned ~$700 billion in dividends and ~$1 trillion in buybacks for a total of $1.7 trillion.

But when you look beyond simple price ratios to the implied return embedded in current prices, solving for the discount rate that equates expected future cash flows with today’s price, the picture is more nuanced. The implied equity risk premium (the amount investors expect to earn above and beyond the risk-free rate) today sits closer to its long-run historical average than it did in the late 1990s, when price appreciation had materially outpaced any reasonable earnings outlook. That does not make stocks cheap. However, it does suggest the premium investors are being paid to own equities over riskfree alternatives is not as thin as it was at the peak of the dot-com bubble.

S&P 500 Equity Risk Premium

So, Should You Sell?

Here is our honest answer: it depends almost entirely on why you would be selling.

If the answer is “because markets have been up a lot,” that is not a sufficient reason, and the data above illustrates why. A 17.9% return that ranked in the 54th percentile is not a blinking red light. It is merely a slightly above-median year in a distribution that swings from -43% to +54%. Three consecutive above-median years is notable, but historically it has carried little predictive weight for what comes next on any useful investment horizon. The investors who moved to the sidelines out of caution in 2023, 2024, or 2025 missed serious and often life-changing returns. Every year they waited, re-entry became harder, emotionally and numerically.

If, on the other hand, your answer is “because my equity allocation has drifted meaningfully above my target,” then that is an acceptable reason to trim. Rebalancing is a process, not a prediction. It is a reason for reducing equities that we fully endorse, because it is grounded in plan design rather than market forecasting.

Or, perhaps your answer is “because my goals or timeline have genuinely changed.” This is the most defensible reason of all. Someone approaching retirement, or funding a near-term liability, should not be asking what the market will do in 2026. They should be asking whether their current allocation matches their current circumstances. That is a question whose answer is entirely independent of what the S&P 500 did last year.

The version of this question we find least useful is the one we hear most often: “Things feel expensive and I am nervous. Should I get out?” Nervous is not an asset allocation. Markets have repeatedly punished the instinct to step aside when things feel too good.

Think of it in terms of playing poker. Knowing you are an 80% favorite to win a hand does not mean you will win the hand. It means if you play that hand a thousand times, you will win 800 of them. Any individual outcome is still uncertain. Folding a strong hand because you are nervous about the 20% chance of losing is how you lose money over time. The goal is not to optimize for comfort, but rather to optimize for outcomes.

If you would have been comfortable owning your current portfolio at the start of 2025, the fact that it is worth more today is not, on its own, a reason to change course.

Don’t sell because markets are up. Sell because something in your plan has changed.

Keeping the Feedback Loop Open

It is entirely possible that you disagree with a variety of the assumptions in this article. Rather than dismiss alternative analyses as wrong, we are better served by keeping our feedback loop open. If you would like to share your opinion and/or critique ours, please feel free to share your thoughts. One of the great aspects of investing is that if you get something wrong, you always have the opportunity to change it. Refusing to change a narrative, just because it is yours, is nothing more than hubris.

Disclosures

This communication reflects the personal opinions, viewpoints and analyses of the Bell Institutional Investment Management (BIIM) employees providing such comments, and should not be regarded as a description of advisory services provided by BIIM or performance returns of any BIIM client.

The views reflected are subject to change at any time without notice. Nothing in this communication constitutes investment advice, performance data or any recommendation that any particular security, portfolio of securities, transaction or investment strategy is suitable for any specific person.

Any mention of a particular security and related performance data is not a recommendation to buy or sell that security. BIIM manages its clients’ accounts using a variety of investment techniques and strategies, which are not necessarily discussed in the commentary. Investments in securities involve the risk of loss. Past performance is no guarantee of future results.

Appendix: U.S. Small Cap Return History

The following charts and data extend the historical return analysis to U.S. small cap stocks (SBBI series), provided for reference.

Distribution of Annual Returns: S&P 500 vs. U.S. Small Stocks

The side-by-side histogram below plots annual returns for both the S&P 500 and U.S. small stocks (SBBI) across 100 years of history. Small stocks exhibit a noticeably wider dispersion with more frequent extreme outcomes on both ends. This is consistent with their higher standard deviation of 30.7% versus 19.6% for the S&P 500.

Distribution of Annual Returns: S&P 500 vs. U.S. Small Stocks (1926-2025)

2025 Return: Percentile Rank vs. 100-Year History

The S&P 500’s 2025 return of 17.9% ranked in the 54th percentile, modestly above the historical median. U.S. small stocks posted a 2025 return of 9.7%, which ranked in the 42nd percentile, a belowmedian year relative to their own history despite a positive result.

Source: SBBI data, FactSet. Annual total returns, 1926–2025. Yellow bar highlights the 2025 S&P 500 return bucket.
Source: SBBI data, FactSet. 2025 returns ranked against 100 years of annual return history.

Return Statistics: S&P 500 vs. U.S. Small Stocks (1926–2025)

Small stocks have historically offered a higher mean and median return than the S&P 500, but at the cost of substantially higher volatility. The standard deviation of 30.7% for small stocks compares to 19.6% for the S&P 500, and the range of outcomes is far wider — from a maximum annual loss of 58.0% to a maximum annual gain of 142.9%.

Return Statistics: S&P 500 vs. U.S. Small Stocks (1926-2025)

S&P 500

U.S. Small Stocks

Source: SBBI data, FactSet. Statistical summary of annual returns, 1926–2025.