INGAA Foundation 2025 North American Midstream Infrastructure Report
NORTH AMERICAN MIDSTREAM INFRASTRUCTURE REPORT
Natural Gas Remains the Backbone of our Energy System
PUBLISHED MARCH 13 , 2026
PREPARED BY A CONSORTIUM
This Page Intentionally Left Blank
Executive Summary
Global energy demand is rising rapidly, and North American natural gas is an essential component of meeting that demand For natural gas to fulfill this role, pipelines and related midstream infrastructure must be developed across North America to transport molecules from production basins to end users around the world.
This report finds that, to meet energy demand through 2052, North America will require:
• More than $1 trillion in capital investment across natural gas, oil, natural gas liquids, hydrogen, and CO2 infrastructure, averaging $40-$48 billion annually.
• An estimated 12-24 million cumulative jobs over 25 years (including 2-4 million direct, 4-8 million indirect, and 6-12 million induced jobs), or roughly 414,000-828,000 jobs annually throughout the study period, varying with investment.
• A projected increase in natural gas transmission capacity of 70 billion cubic feet per day (Bcf/d), a 39 percent increase from 2022
• At least 37,000 miles of additional natural gas transmission pipelines (33,800 of which will be in the U.S.) and 103,000 miles of gathering pipelines
• An additional 8.6 to 12.4 million horsepower of compression associated with natural gas transmission, reflecting higher pipeline throughput and network expansion.
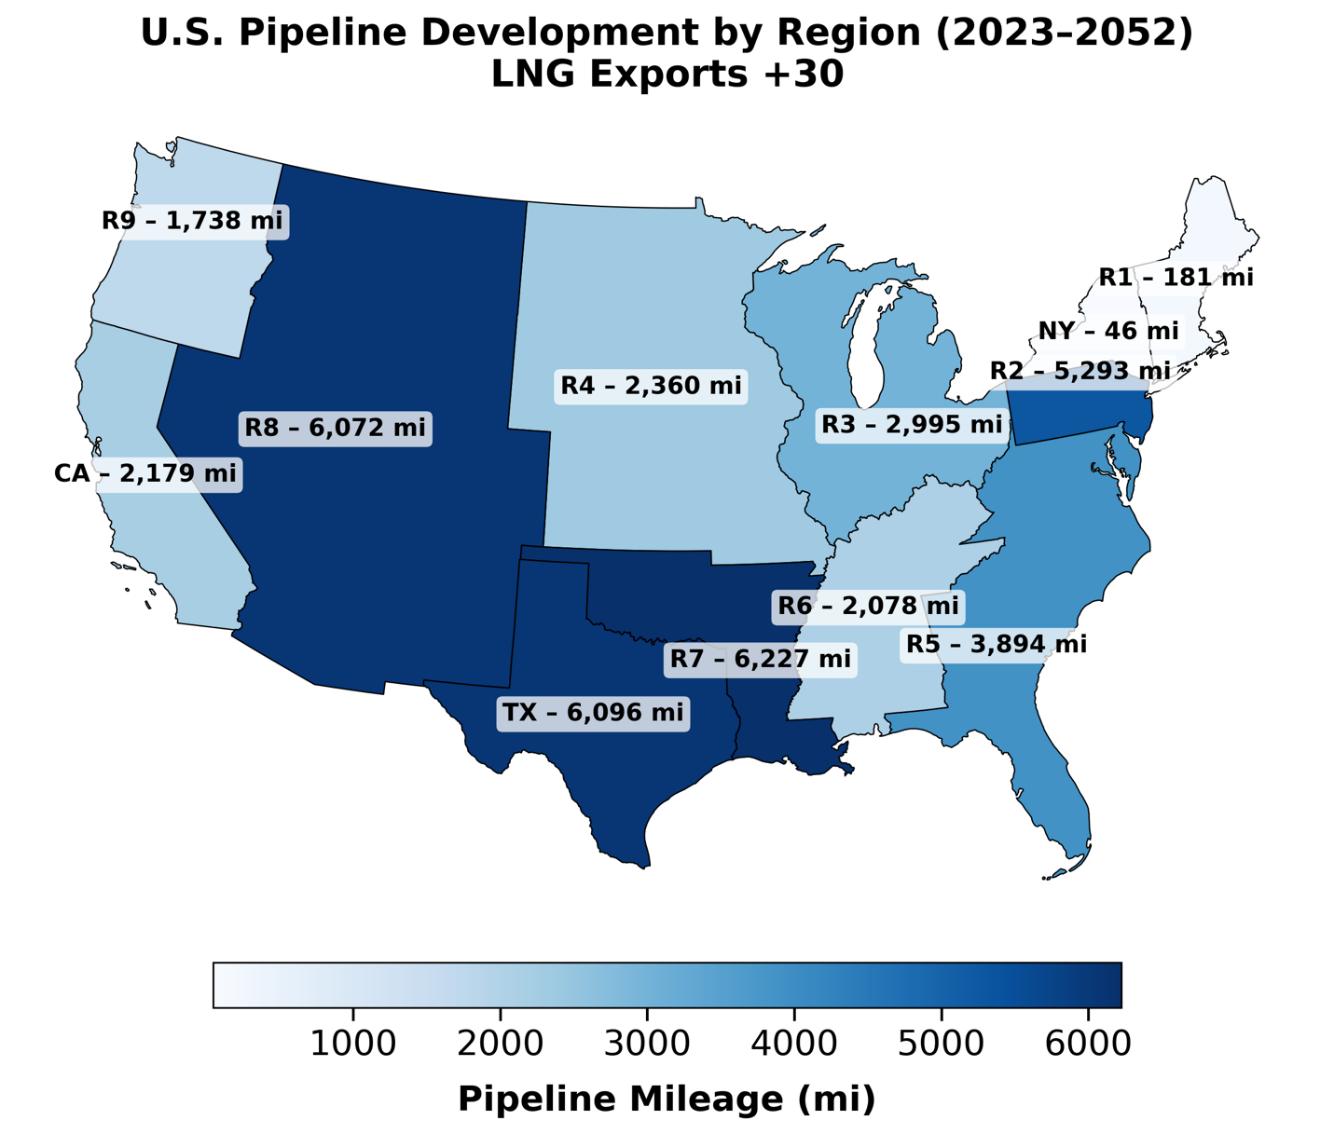
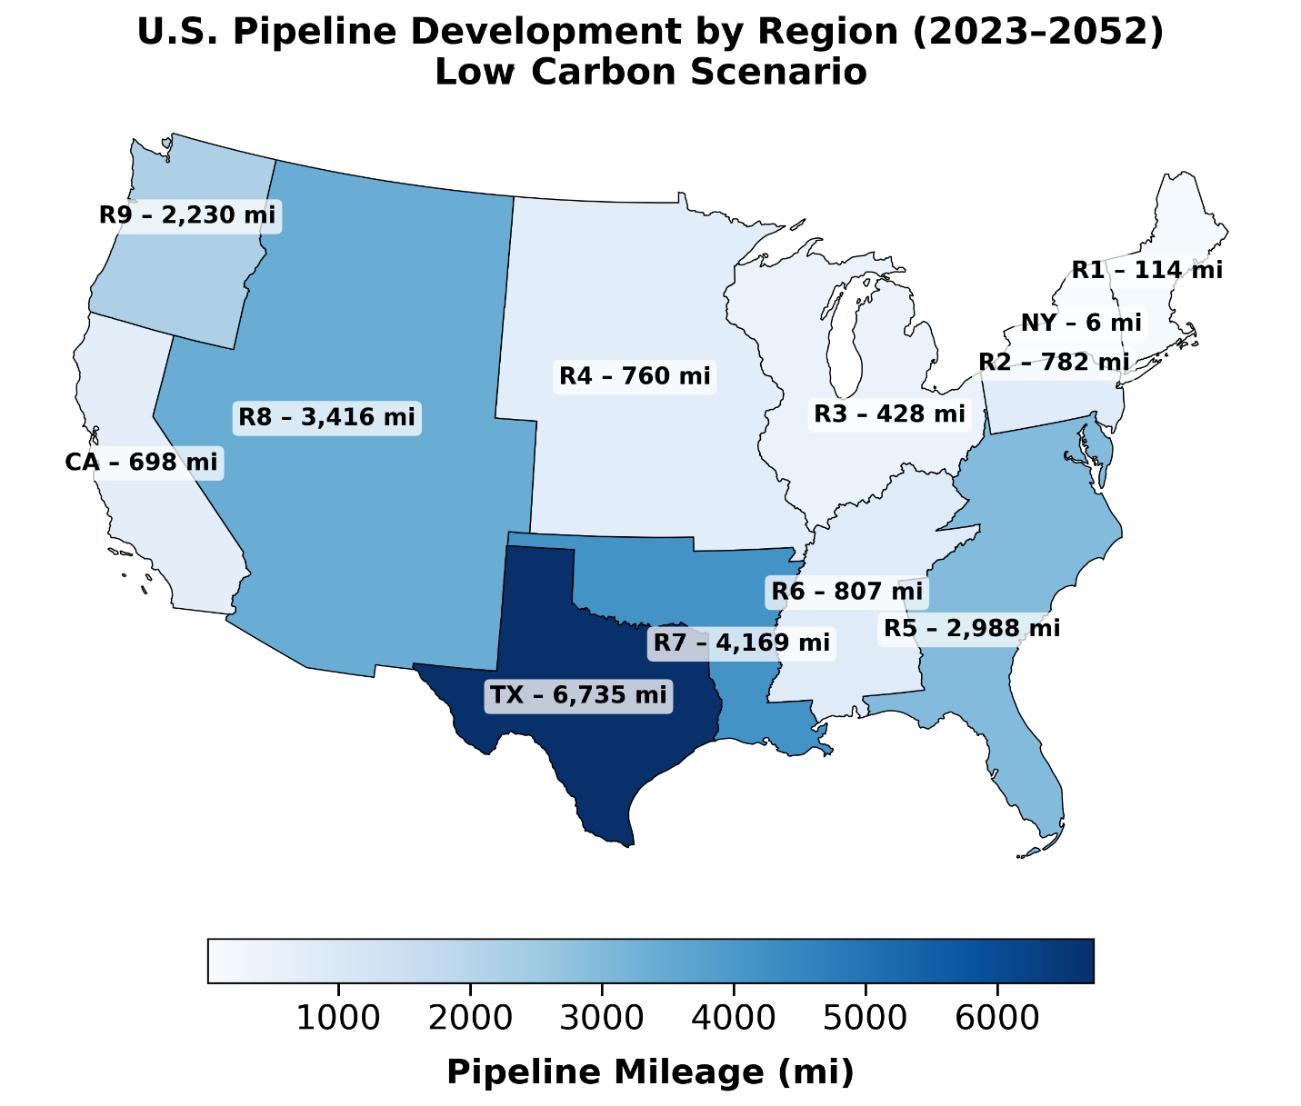
Natural gas will see strong, sustained long-term demand through the study period. Figure ES-1 summarizes the required United States’ and Canadian additional natural gas transmission pipeline capacity needed to meet demand under both a Reference Case and Low Carbon Scenario by different study periods. Figure ES-2 illustrates the cumulative natural gas transmission capacity growth over the study period, showing how those additions accumulate over time. Together, the figures distinguish between the timing of capacity additions (ES-1) and the resulting cumulative expansion of the transmission system (ES-2). These projected capacity additions represent baseline requirements and could increase if data center buildout or liquefied natural gas (LNG) exports grow faster than expected in either the report’s Reference Case or Low Carbon Scenario
Figure
The opportunities are substantial, but planning must begin now. To support that planning, The INGAA Foundation 1 commissioned a consortium of experts from the University of Houston, Wood, and ESMIA Consulting to conduct a comprehensive review of future energy needs and the required infrastructure expansion and investment needed to meet that demand. This report reflects current and anticipated market conditions for North American midstream infrastructure, and assesses the scale, location, and timing of the infrastructure expansion required through 2052. For the purposes of this report, midstream infrastructure includes:
• Pipeline systems for natural gas, natural gas liquids (NGLs), crude oil, refined products, hydrogen, and CO₂, including both transmission and, where applicable, gathering lines;
• Compression and pumping stations necessary to maintain flow, pressure, and product integrity; and
• Processing and treatment facilities, including natural gas processing plants, NGL fractionation facilities, and hydrogen conditioning or handling equipment.
The study models outcomes under two primary scenarios:
• A business-as-usual Reference Case, in which existing policies and regulations as of April 1, 2025 remain largely unchanged over the next 25 years, informed by historic and current data from leading U.S. and international energy agencies, regulatory bodies, and industry datasets and updated to reflect H.R. 1, the One Big Beautiful Bill Act of 2025, and the U.S. Energy Information Administration (EIA) Short-Term Energy Outlook (June 2025).
• A Low Carbon Scenario that reflects greenhouse gas (GHG) reduction policies adopted at the state, provincial, and international levels as of April 1, 2025, including measures scheduled to take effect over the next 25 years. It also incorporates binding subnational emissions targets in the U.S. and Canada and applies them directly as jurisdiction-specific constraints that shape fuel selection, energy demand, and infrastructure use without assuming any new nationwide federal climate mandates.
1 The INGAA Foundation was formed in 1990 by the Interstate Natural Gas Association of America (INGAA) to convene industry leaders from natural gas and additional complementary clean energy solutions to identify and address critical matters related to the development, construction, operation, and maintenance of the gas infrastructure value chain through research, engagement, and outreach.
Across both scenarios, the report finds that natural gas remains the backbone of the North American energy system. Even as renewable generation and nuclear power grow and energy efficiency expands, the demand for energy remains too large to be met without natural gas playing a central role. Two market forces dominate the long-term outlook: rapidly rising demand for electricity, particularly from data centers, and sustained growth in LNG exports serving global markets.
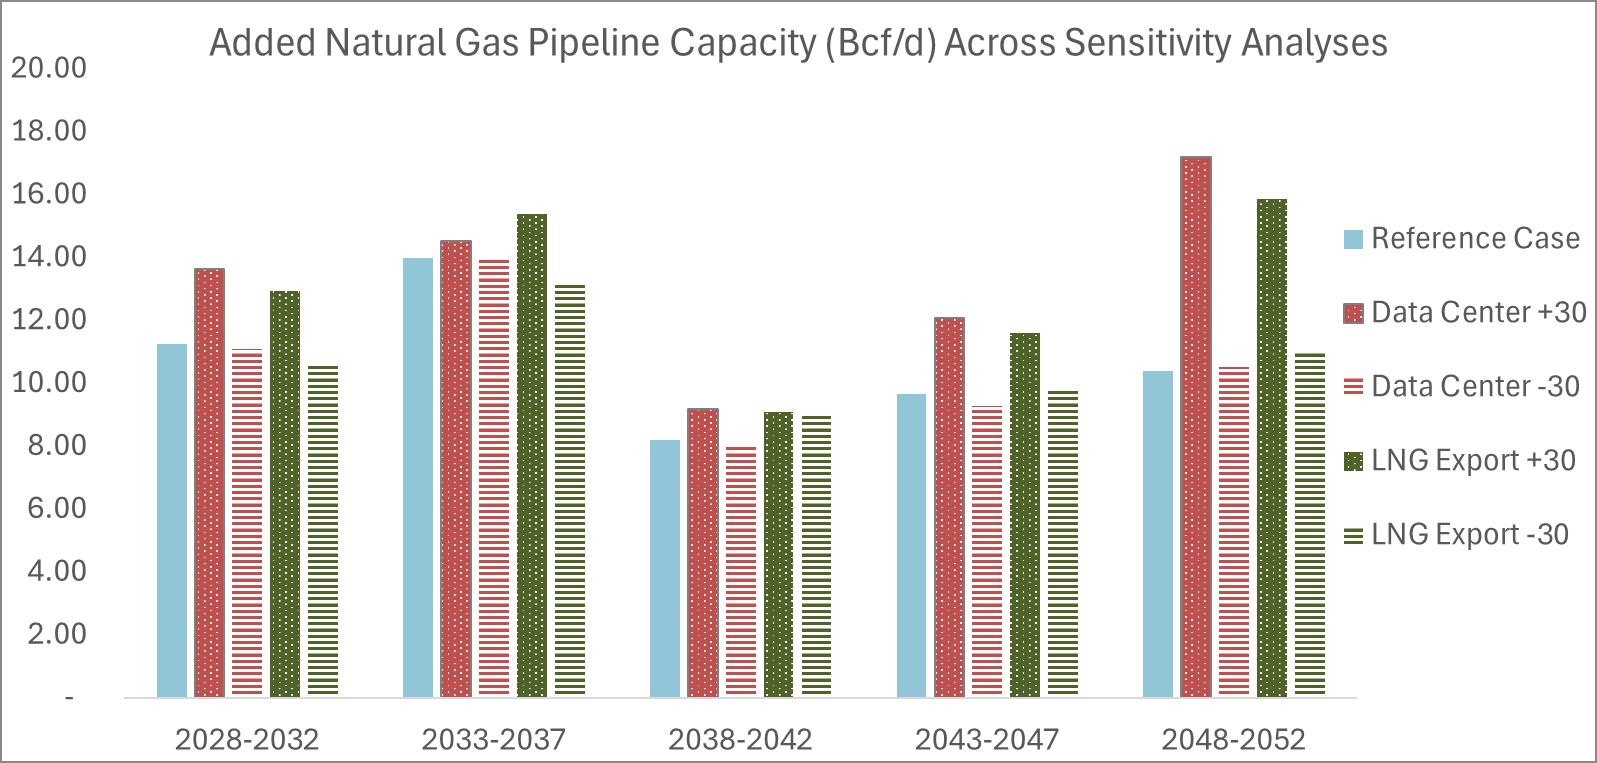
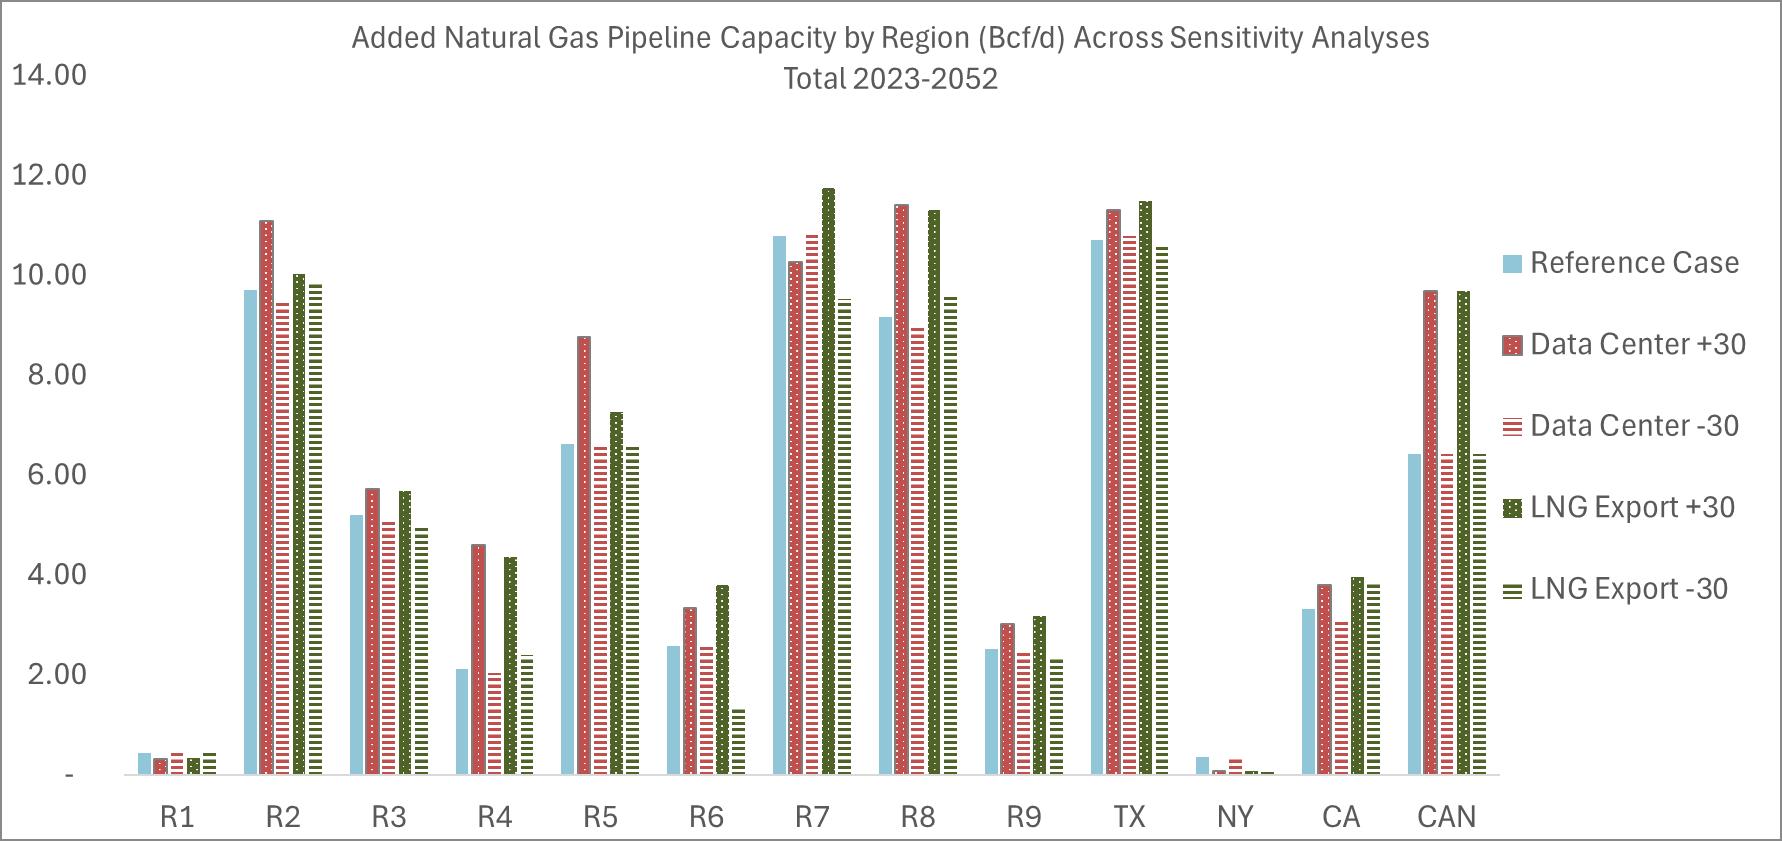
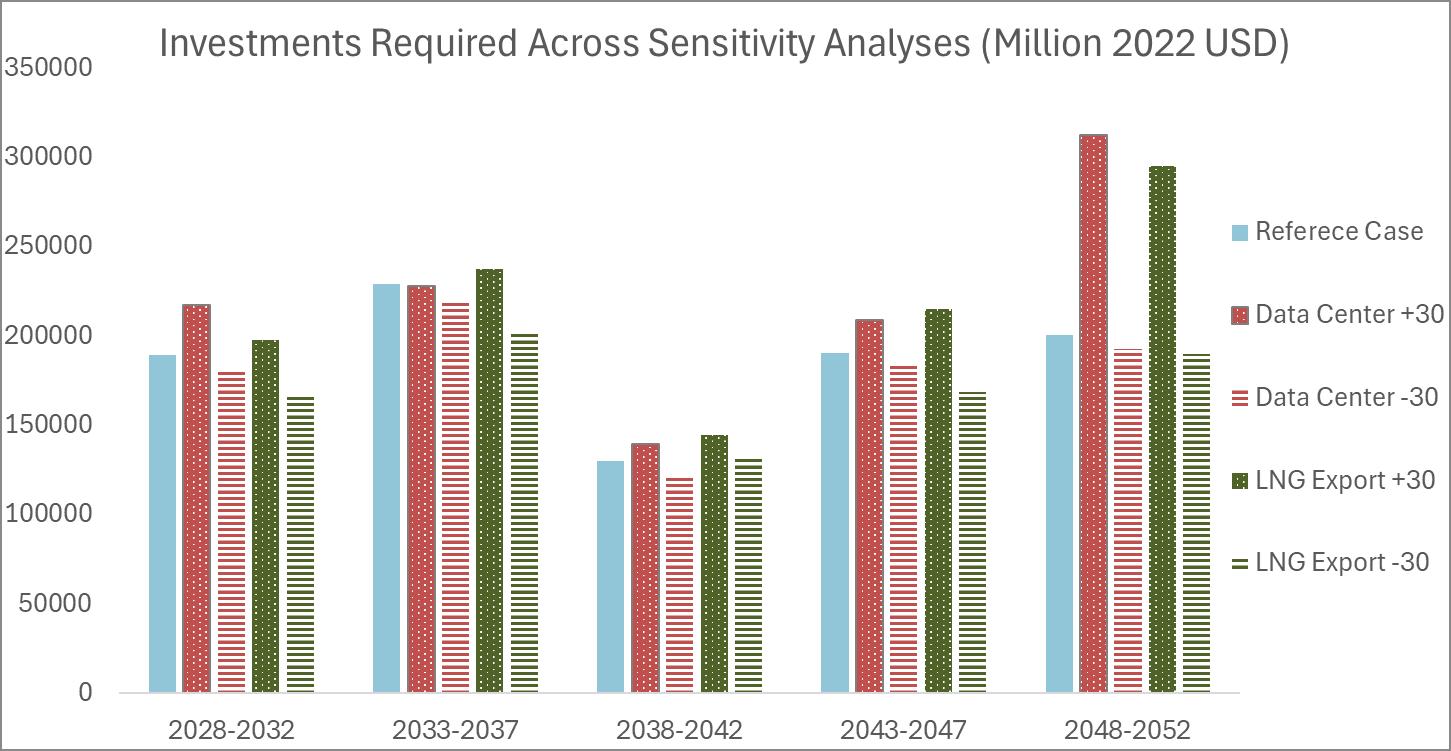
The study also includes a sensitivity analysis of the Reference Case to test how the model responds to variations in the two key market drivers that affect infrastructure requirements. These sensitivities evaluate higher- and lower-trajectory scenarios for LNG exports and data center electricity demand, confirming that natural gas pipeline and compression needs increase materially under stronger-than-anticipated demand conditions. The sensitivity analyses show that the modeled infrastructure requirements are not highly sensitive to moderate variations in key demand drivers. As a result, the estimates presented represent a stable baseline. Higher requirements would be associated with more pronounced shifts in exports, electricity demand growth, or peak demand conditions.
The 2025 Infrastructure Report also finds that:
• Electricity generation from all energy sources is projected to reach 5,900 terawatt hours (TWh) in 2052 in the Reference Case. For context, according to EIA, the U.S. total electricity consumption in 2022 was roughly 4,070 TWh, meaning projected 2052 generation would exceed total U.S. power demand in 2022 by more than 40 percent.
• Data centers are a major contributor to rising electricity demand. The U.S. Department of Energy (DOE) estimates data center energy consumption could reach 800 TWh annually by 2052, up from 300 TWh in 2025.
• Of the $1.2 trillion to $1.4 trillion (2022 USD) in total midstream investment needed over the next 25 years, natural gas pipelines and LNG export facilities account for most of this investment followed by oil pipelines, with the highest investment needs in regions with strong production growth, expanding export capacity, and rising electricity consumption.
• LNG exports represent the single largest source of incremental natural gas demand over the study horizon. Under both the Reference Case and the Low Carbon Scenario, U.S. LNG exports more than triple by 2052, supported by favorable resource availability, competitive pricing, and global efforts to displace higher-emissions fuels. In the Low Carbon Scenario, global climate policies further reinforce LNG demand as importing countries seek lower-
carbon alternatives to coal, increasing the importance of LNG export and interconnected natural gas pipeline infrastructure concentrated along the Gulf Coast.
• U.S. annual natural gas production increases from 36 trillion cubic feet (Tcf) in 2022 to 49 Tcf in 2052 in the Reference Case. Growth is concentrated in Texas, the Middle Atlantic (New Jersey and Pennsylvania), the West South Central (Louisiana, Arkansas, and Oklahoma), the East North Central (Indiana, Illinois, Michigan, Ohio, and Wisconsin), and the Mountain (Arizona, Colorado, Idaho, Montana, New Mexico, Nevada, Utah, and Wyoming) regions. According to EIA, the U.S. consumed roughly 32.50 Tcf of natural gas in 2023, meaning the projected 13 Tcf increase in annual production would account for 40 percent of the entire U.S. natural gas market in 2023
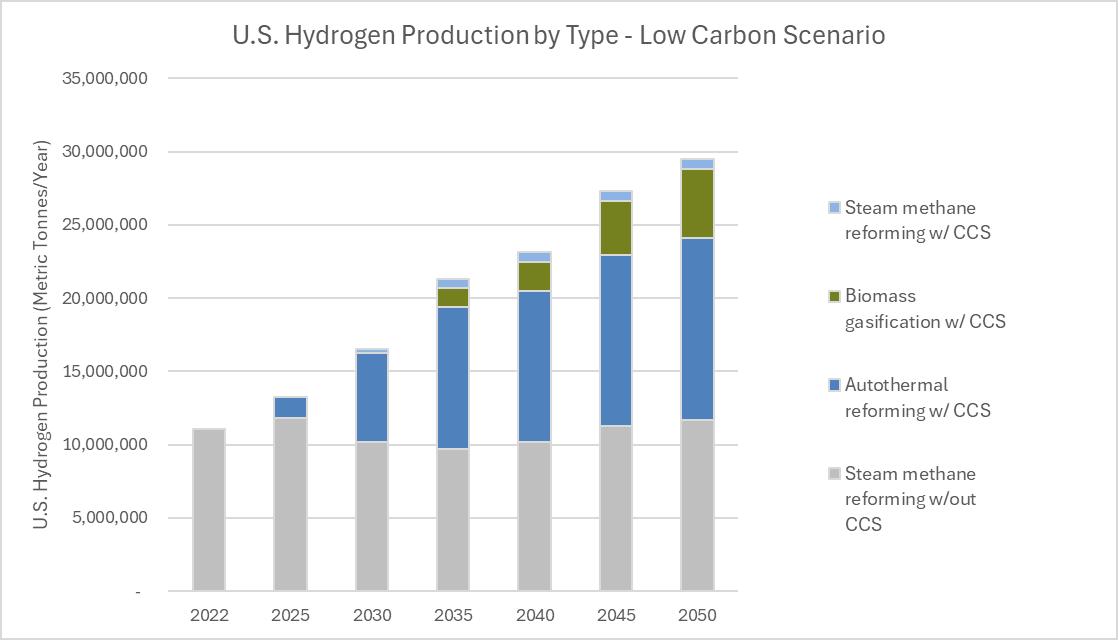
• New to this report, emerging fuels and decarbonization strategies, such as hydrogen production and carbon capture and storage (CCS), were found to incrementally contribute to infrastructure needs, particularly under the Low Carbon Scenario. While these systems remain smaller in scale than natural gas over the study period, they reinforce the need for forward-looking infrastructure planning.
Across the analyzed scenarios, natural gas is needed to meet North America’s rising energy demands through 2052. Natural gas demand continues to grow across a wide range of policy and market conditions, driven by electricity demand from data centers and global LNG consumption, and will continue to grow even as renewables and other low carbon energy sources expand simultaneously. This report provides the analysis and insights needed by the midstream infrastructure industry to begin planning today for the pipelines, compression, and related infrastructure required to meet that demand and ensure a strong, resilient, and secure energy system through 2052.
1. Introduction
1.1. Background
The INGAA Foundation’s 2025 Midstream Infrastructure Report examines the future need for and cost of developing the midstream infrastructure in North America required to meet projected energy demand through 2052. The analysis reflects anticipated economic conditions, public policy considerations, and market dynamics affecting the construction and utilization of midstream infrastructure across the U.S. and Canada.
The INGAA Foundation periodically reassesses North American midstream infrastructure needs to reflect changes in supply, demand, technology, regulation, and public policy. This report represents the ninth edition of that analysis and builds upon prior studies by updating assumptions, extending the analytical horizon through 2052, and incorporating new market developments.
For the purposes of this report, midstream infrastructure refers to the network of physical assets and associated systems that connect energy production to end-use markets by enabling the gathering, transportation, processing, and conditioning of natural gas, natural gas liquids (NGLs), crude oil, refined products, hydrogen, and CO₂ (commodities)
Within this context, midstream infrastructure includes:
• Pipeline systems for natural gas, NGLs, crude oil, refined products, hydrogen, and CO₂, including transmission and, where applicable, gathering lines;
• Compression and pumping stations necessary to maintain flow, pressure, and product integrity;
• Processing and treatment facilities, including natural gas processing plants, NGL fractionation facilities, and hydrogen conditioning or handling equipment.
Collectively, these assets form the operational backbone of the North American energy system, supporting reliable access to markets, system resilience, and the movement of energy commodities required to meet growing demand. Midstream infrastructure also plays a critical role in managing emissions through the transportation of CO₂ for CCS and in facilitating the integration of emerging fuel sources, such as hydrogen and renewable natural gas, alongside traditional hydrocarbons
The analysis covers infrastructure supporting oil, natural gas, LNG, and NGL markets, as well as emerging fuel sources and complementary infrastructure required for CCS. Demand projections consider core domestic natural gas markets, electric power generation (including growth driven by data centers and electrification), residential and commercial consumption, industrial and feedstock use, and export markets, including both pipeline transportation to LNG terminals and the potential export of hydrogen and its derivatives.
The report uses both a qualitative discussion and quantitative analysis, where feasible, to assess factors that can influence the timing, cost, and feasibility of midstream infrastructure development. These factors include permitting and regulatory uncertainty, legal and administrative challenges, jurisdiction-specific restrictions on new natural gas services, and the availability or deployment of technologies that may affect asset utilization or public acceptance. These considerations are treated as risks and uncertainties that may affect infrastructure development trajectories and, consequently, the report’s projections.
As with any long-term infrastructure assessment, the multi-decade timeframe introduces uncertainty related to future demand, costs, regulatory frameworks, and policy direction. Federal, state, and provincial governments in the United States and Canada continue to evolve their approaches to energy policy, climate objectives, and infrastructure development. While many jurisdictions have expressed support for oil, natural gas, hydrogen, CCS, and the infrastructure required to support growing electricity demand, policy positions and regulatory outcomes may vary over time and across regions. Therefore, the projections and findings in this report should be contextualized against evolving market and policy conditions.
1.2. Study Regions
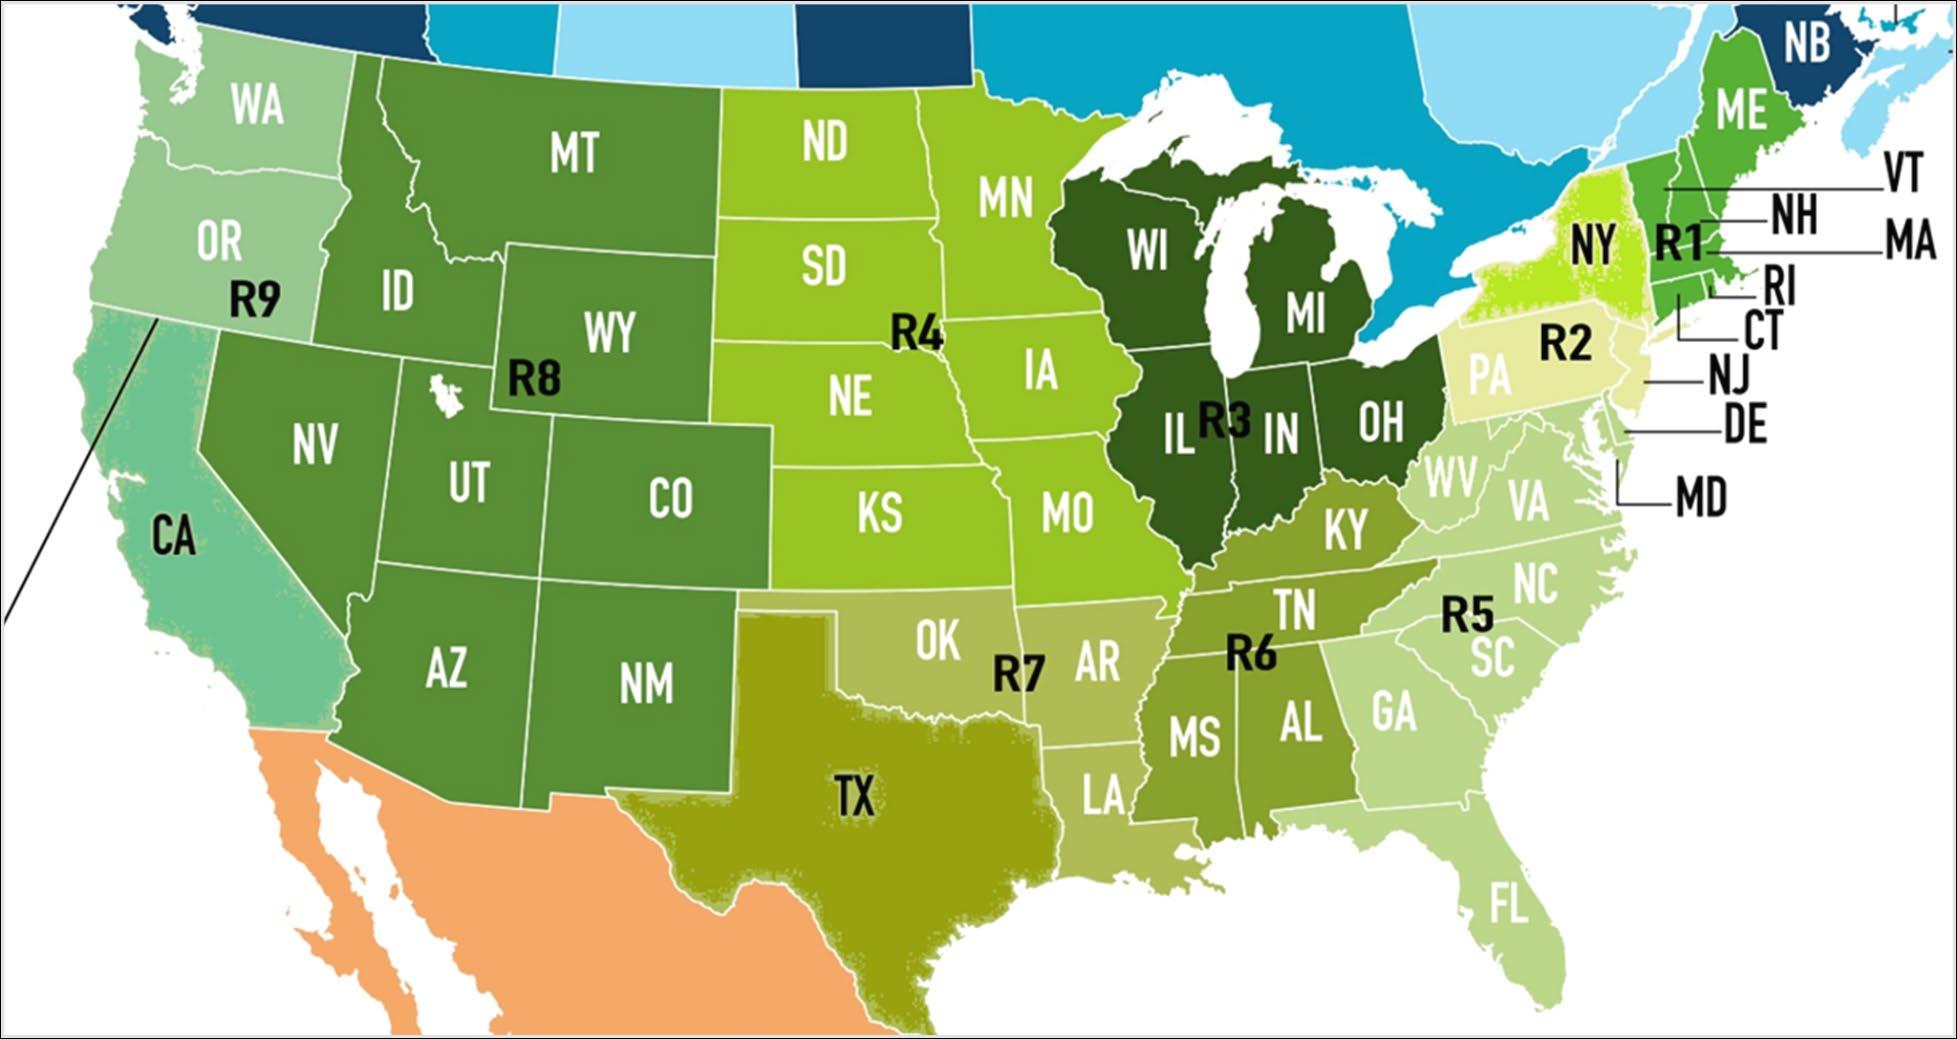
This report details the current and anticipated outlook and market conditions for U.S. and Canadian midstream infrastructure. It reports data in total volumes and investment dollars, aggregating data by state and province to the extent that detailed information and forecasts are available. U.S. data is assembled by region to accommodate differences in market conditions, costs, and demand across and among the various parts of the country. Those regions are defined in Table 1 and illustrated in Figure 1
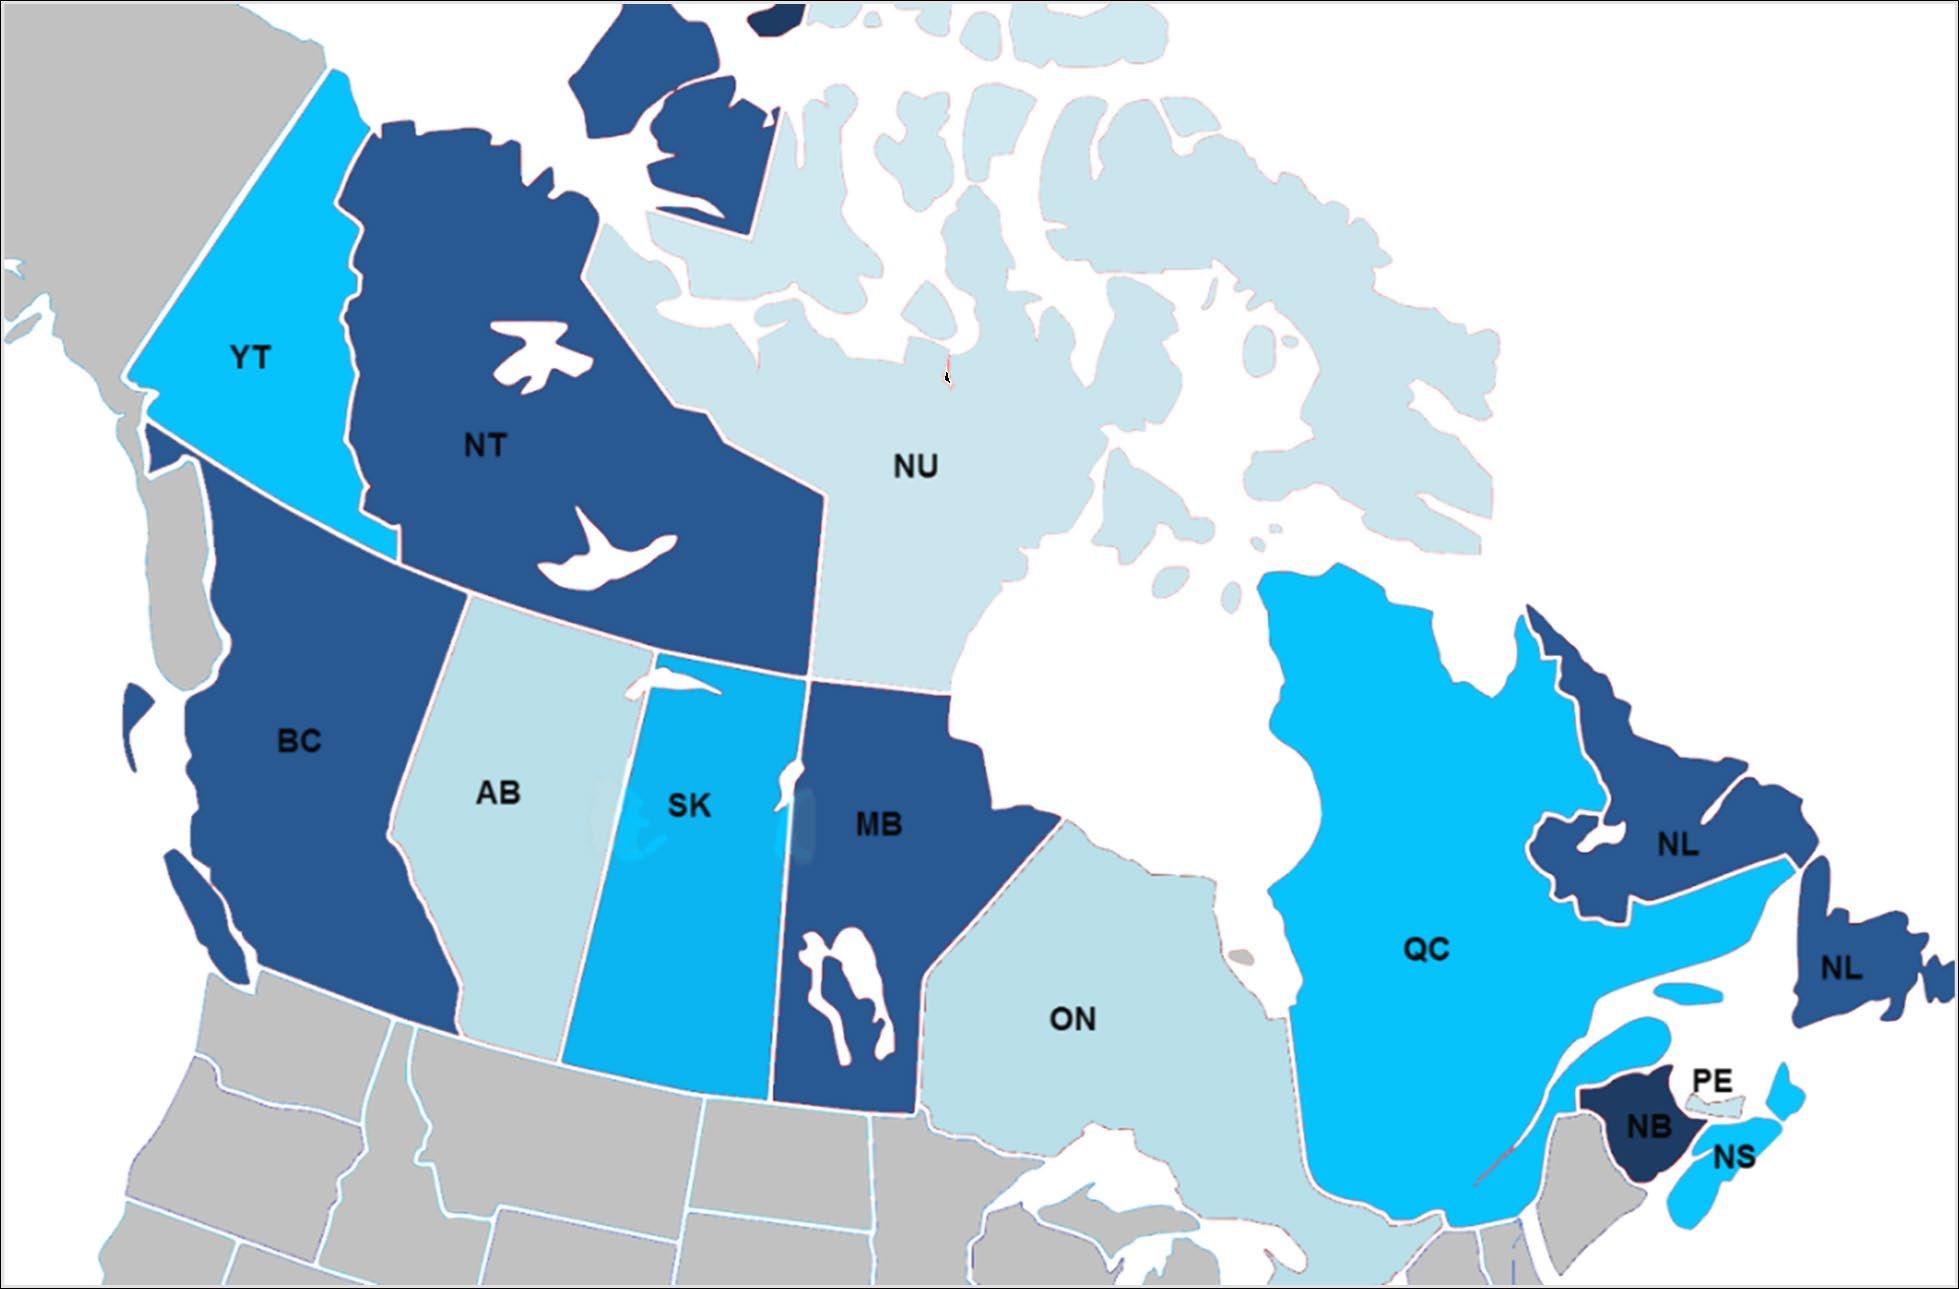
NATEM-Canada covers the 10 Canadian provinces plus the three territories, as described in Table 2 and Figure 2. While data is detailed for every Canadian province and territory, Canadian results are presented on a national basis under the single designation “CAN.”
R1 New England CT, MA, ME, NH, RI, VT
R2 Middle Atlantic NJ, PA
R3 East North Central IN, IL, MI, OH, WI
R4 West North Central IA, KS, MN, MO, ND, NE, SD
R5 South Atlantic DC, DE, FL, GA, MD, NC, SC, VA, WV
R6 East South Central AL, KY, MS, TN
R7 West South Central AR, LA, OK
R8 Mountain AZ, CO, ID, MT, NM, NV, UT, WY
R9 Pacific AK, HI, OR, WA
CA California CA
TX Texas TX
NY New York NY
Table 1 - North American TIMES Energy Model (NATEM)-U.S. Model Regions
Figure 1 - Map of U.S. Study Regions Used in NATEM Model
Table 2 - North American TIMES Energy Model (NATEM)-CANADA Model Regions
Region code
Region Name
AB Alberta
BC British Columbia
MB Manitoba
SK Saskatchewan
ON Ontario
QC Quebec
NB New Brunswick
NL Newfoundland and Labrador
NS Nova Scotia
PE Prince Edward Island
NT Northwest Territories
NU Nunavut
YT Yukon
Figure 2 - Map of Canada Study Regions Used in NATEM Model
1.3. Research Team and Data Sources
The research team consisted of senior leaders from the University of Houston (UH), Wood, and ESMIA Consultants.
The UH team was led by the Division of Energy and Innovation, with support from faculty and staff at the C.T. Bauer College of Business.
Wood, a global leader in engineering and consulting, provided key project management leadership as well as domain expertise for the midstream sector.
ESMIA Consultants, which is based in Canada, contributed a detailed economy-wide energy system model, the North American TIMES Energy Model (NATEM), which was used to model components of the North American energy system to 2052 with an emphasis on natural gas midstream infrastructure. The ESMIA team also provided expertise in the analysis and interpretation of the model results.
The University of Houston used historic and current data to support the techno-economic modeling associated with this report. The data was principally gathered from publicly available sources, including:
The United States Energy Information Agency (EIA)
The International Energy Agency (IEA)
Electric Power Research Institute (EPRI)
Datasets developed by the Oil and Gas Journal (OGJ) Research Organization
Rextag GIS Data for the Energy Sector in the U.S. and Canada
The Federal Energy Regulatory Commission (FERC)
Canadian Energy Regulator (CER)
Canadian Energy Futures Report (2023)
Various state and provincial databases
This data was supplemented to reflect changes made by the enacted H.R. 1, the One Big Beautiful Bill Act of 2025, and updated to include the analysis contained in EIA’s Short-Term Energy Outlook (June 2025). Other policy and regulatory factors were considered as they existed on April 1, 2025.
2. Methodology
The analysis was conducted by a consortium of independent technical and market experts assembled by The INGAA Foundation. The University of Houston provided academic leadership and economic analysis, Wood contributed global engineering, cost, and project development expertise, and ESMIA supplied the NATEM model, an economy-wide techno-economic optimization model used to assess long-term energy system evolution. This multidisciplinary approach integrates market fundamentals, engineering realities, and policy considerations to provide a comprehensive and objective assessment of future midstream infrastructure needs.
2.1. Techno-Economic Modeling Framework (NATEM)
NATEM is a dynamic least-cost optimization model based on the linear programming approach and contains three components:
• The first component is the objective and corresponds to minimizing the net total discounted cost of the entire energy system. A single optimization, which searches for the maximal net total surplus, simulates market equilibrium for each commodity (energy, material, demand). Maximizing the net total surplus (i.e., the sum of producer and consumer surpluses) is operationally done by minimizing the net total cost of the energy system.
• The second component is variables and corresponds mainly to future investments and activities of technologies for each period of time, the amount of energy produced or consumed by technologies, as well as energy imports and exports. An additional output is the implicit price (shadow price) of each energy form, material, and emission, as well as the reduced cost of each technology (reduction required to make a technology competitive).
• The third component is constraints and corresponds to various limits (e.g., the amount of energy resources available) and obligations (energy balances throughout the system and useful energy demand satisfaction).
ESMIA’s modeling approach considered the North American energy economy across all regions with a focus on midstream infrastructure serving the natural gas sector. In doing so:
• ESMIA used both economy-wide NATEM-USA and NATEM-Canada models for all nine census regions and, separately, California, New York, and Texas, and all of Canada (modeled by province) The modeling considered existing and committed policies and regulations affecting the oil and gas industry.
• ESMIA used its advanced representation of existing and future technologies and processes in its model for CCS, hydrogen production and use, ammonia production and use, and the ability to export emerging fuels.
• The model represents the natural gas upstream, midstream, and downstream sectors independently through techno-economic parameters for resource supply (including imports), production/conversion, transportation, end-use technologies, and demand for energy services, including exports.
• The NATEM model was calibrated with energy data sets available from IEA, EIA, the OGJ, Rextag, and other data identified in Section 1.3.
The model runs from 2023 to 2052 in 5-year increments, with 2022 and earlier used for calibration The first modeled period is 2025, representing 2023 to 2027. Additionally, 16 subannual time periods are used to capture seasonal production fluctuations to account for electricity production and hydrogen electrolysis. These 16 time periods represent all four seasons (spring, summer, fall, and winter) and four daily periods (morning peak, midday, evening peak, and night) This temporal granularity balances the need for detail in the electricity production sector (e.g., availability of renewables) and electrolytic hydrogen production (e.g., due to Inflation Reduction Act (IRA) 45V time-matching requirements) against computational constraints.
This analysis utilizes an annual, energy system-level approach for modeling natural gas and oil, which allows the results to provide a clear, comparable view of baseline transmission expansion needs across regions and scenarios. The NATEM model evaluated average annual demand, and did not evaluate peak-day demand, non-ratable demand, seasonal variability, or the amount of additional capacity needed to serve contracted load during planned maintenance periods. The report discusses these considerations and notes that the model may understate required capacity and mileage by up to 1.8 times. The impact of these considerations on the modeled capacity additions are discussed in the results section.
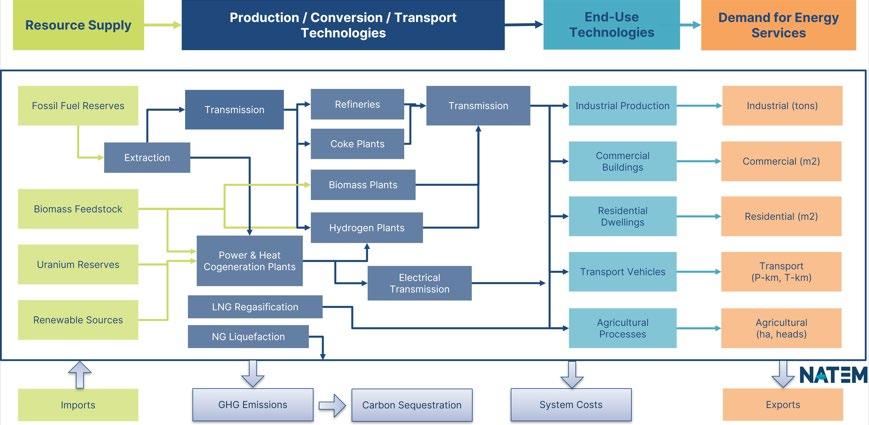
Figure 3 illustrates the comprehensiveness of the NATEM model scope in representing the North American energy system, which is critical for evaluating current and future infrastructure needs. The model inherently considers competition between resources, interactions between demand and supply, and very high technological granularity including representation of thousands of technologies.
2.2. Scenarios
The report develops two core scenarios – the Reference Case and the Low Carbon Scenario – to frame the analysis of future North American midstream infrastructure needs. Together, these scenarios bind a range of plausible policy and market outcomes and provide insight into how differing regulatory environments may affect natural gas demand, infrastructure utilization, and investment requirements over the study period.
2.2.1. Reference Case
The Reference Case serves as the baseline for this analysis and represents a business-asusual outlook based on the existing energy policy environment. It reflects federal, state, provincial, and local policies and regulations in effect in the U.S. and Canada as of April 1, 2025. Under this scenario, no additional climate policies or regulatory measures beyond those already enacted or formally committed are assumed to be implemented during the study period.
The Reference Case assumes continued application of current regulatory frameworks governing energy production, transportation, and consumption, as well as prevailing technology performance and cost trends. One exception to the April 1, 2025 policy cutoff is the inclusion of
Figure 3 - Simplified Representation of North American Energy Systems
provisions contained in the H.R. 1, the One Big Beautiful Bill Act of 2025, which was enacted in mid-2025 and is treated as a committed policy. Macroeconomic conditions, fuel prices, and technology costs are modeled using median assumptions consistent with reference-case projections from publicly available sources.
Within the modeling framework, the Reference Case establishes baseline energy service demands and determines the resulting natural gas, oil, NGL, hydrogen, and CO2 flows required to meet those demands. Midstream infrastructure requirements are then derived endogenously 2 based on the least-cost combination of existing assets, expansions, and new facilities needed to satisfy projected supply and demand under current policy conditions.
2.2.2. Low Carbon Scenario
The Low Carbon Scenario explores the implications of more aggressive GHG reduction efforts in North America and globally. In the U.S., this scenario incorporates binding GHG reduction targets established by individual states that have adopted economy-wide or sector-specific emissions goals. In Canada, the scenario incorporates provincial GHG reduction targets. These constraints are implemented directly in the model by limiting emissions in the relevant jurisdictions, thereby influencing fuel choice, energy consumption patterns, and infrastructure utilization.
Unlike the Reference Case, the Low Carbon Scenario does not assume a uniform national climate policy in either the U.S. or Canada. Instead, it reflects a patchwork of state and province-level climate actions that were in place or formally adopted as of April 1, 2025. This distinction is made explicitly to avoid conflating existing subnational policies with hypothetical future federal mandates. Appendix D summarizes the states’ progress toward their clean energy targets as of the date of April 2025
In addition to domestic policy differences, the Low Carbon Scenario assumes stronger global climate action relative to the Reference Case. While specific international policies such as carbon border adjustment mechanisms, explicit carbon pricing, or tighter global emissions standards are not modeled individually, their combined effect is represented through alternative assumptions for international energy markets. These assumptions influence global natural gas
2 Endogenously refers to variables that are determined within the model based on their internal relationships, assumptions, and constraints, rather than being specified as external inputs.
demand, particularly for LNG, and therefore affect North American production, pipeline flows, and export infrastructure requirements. In this context, “higher” global climate action refers to a policy environment in which emissions constraints are more stringent and more widely adopted than in the Reference Case, altering fuel demand and trade patterns.
As in the Reference Case, technology costs and performance are modeled using central cost assumptions. Differences in outcomes between the two scenarios are driven primarily by policyinduced changes in emissions constraints, fuel demand, and market conditions rather than by assumptions about technological breakthroughs.
Together, these two scenarios provide a structured framework for evaluating how midstream infrastructure needs may evolve under differing policy and market conditions. The Reference Case illustrates infrastructure requirements under a continuation of today’s policy environment, while the Low Carbon Scenario highlights how more aggressive climate action, implemented largely through state and provincial policies and reinforced by global market shifts, could alter demand for natural gas and related midstream assets.
2.3. Assumptions and Criteria
The North American energy system is both complex and dynamic. In collaboration with The Foundation’s steering committee (see Appendix I) and with support from the study’s leadership team, ESMIA developed a set of assumptions. In order to accurately interpret the study’s results, it is essential to understand the modeling assumptions upon which the principal scenarios and sensitivities are based, including energy service demand, midstream infrastructure needs, and pipeline cost
2.3.1. Energy Service Demand
Energy service demands are the primary drivers of model outcomes and represent underlying “useful” demand, such as industrial output or building floor space requiring heating or cooling. Demand for natural gas is therefore not specified explicitly but is derived endogenously based on these service demands and other economic and technological factors. For example, higher Gross Domestic Product (GDP) growth increases projected industrial activity which, in turn, can lead to greater demand for natural gas and competing fuels.
Macroeconomic inputs for the U.S. – including GDP and population growth – are sourced from the U.S. Bureau of Economic Analysis (2023) for state-level GDP, and EIA’s Annual Energy
Outlook 2025 for population and national projections. For Canadian inputs, macroeconomic assumptions are drawn from Canada’s Energy Futures 2023 published by the Canadian Energy Regulator. These variables are not entered directly into the NATEM model; instead, they are used to develop initial projections of energy service demand. Tables 3 and 4 illustrate trends in GDP for both the U.S. and Canada, a key factor in determining future energy demand.
Source: Annual Energy Outlook 2025, EIA; Bureau of Economic Analysis
Table 4 - Projections for CAN GDP (Millions 2023 CAD)
Source: Canada’s Energy Future 2023, Canada Energy Regulator
2.3.2. Energy Prices and International LNG Demand
Energy prices, together with regional resource availability, interregional connectivity, and production costs, influence modeled import and export flows. Trade prices and volumes between domestic regions are determined endogenously within the model, with international price assumptions serving as a benchmark against which regional production and transportation economics are evaluated.
Table 5 projects global oil and natural gas prices used to represent international import and export markets and are sourced from EIA’s Annual Energy Outlook 2025. Near-term price assumptions for 2025 reflect updates from EIA’s Short-Term Energy Outlook (June 2025). These prices provide an external reference for international trade within the modeling framework.
Table 3 - Projections for U.S. GDP (Billions 2023 USD)
Table 5 - Projections for World Energy Prices (2022 USD/Mbtu for gas and 2022 USD/barrel)
Natural Gas
Source: Annual Energy Outlook 2025, EIA.
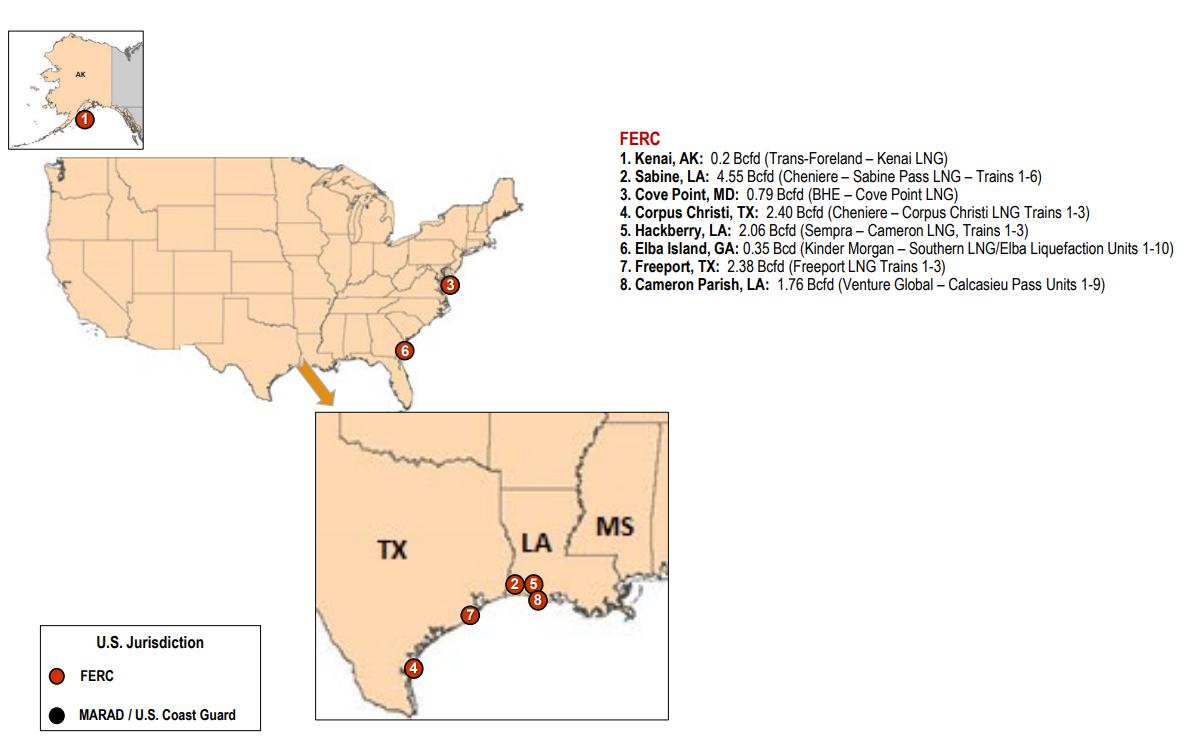
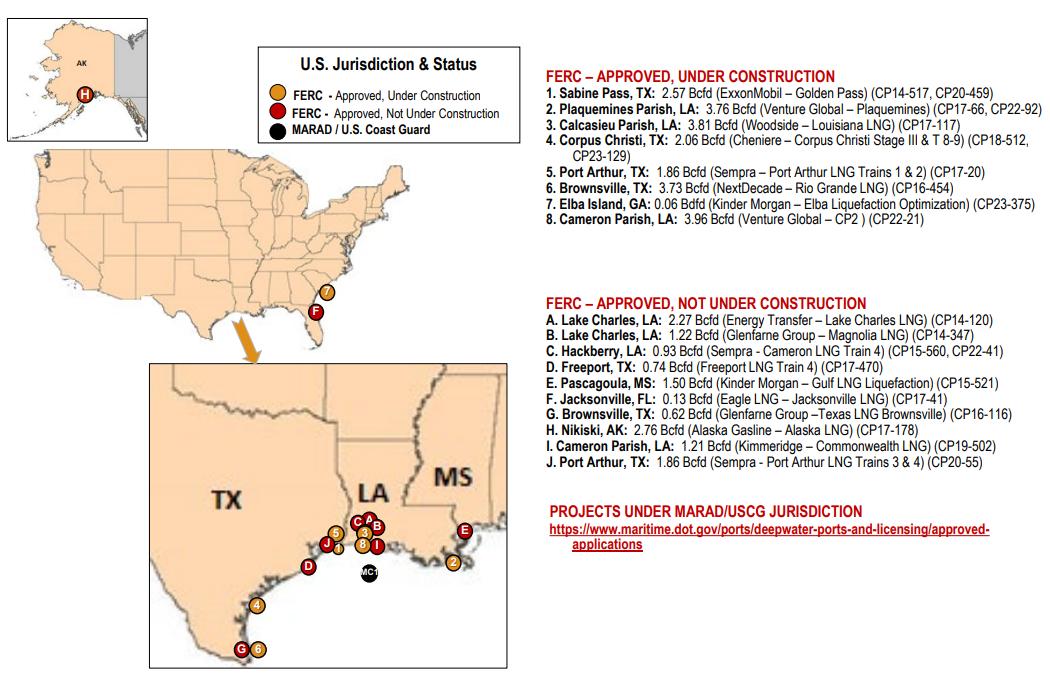
International LNG demand is assumed to be a key driver for the natural gas sector in the U.S. in the upcoming years. Based on a review of public data from FERC through April 2025, U.S. LNG export capacity was calculated from existing, proposed, under construction, and approved LNG export terminals in both scenarios. See Table 6 and Appendix K.
Table 6 - Projections for Maximum U.S. LNG Export
Source: Federal Energy Regulatory Commission, April 2025.
(Bcf/d)
This report assumes global action on climate will lead emerging countries to replace coal with less carbon-intensive fuels, including LNG. As a result, export capacity is significantly higher in the Low Carbon Scenario.
2.3.3.
Demand from Data Centers
Data centers consume significant amounts of electricity, and natural gas is the largest single fuel source used for electricity generation in the U.S. The scale of data center growth is therefore likely to impact gas use, although clean electricity targets will also affect the sector. DOE estimates that by 2052, demand from data centers could reach 800 TWh per year, as shown in Table 9 S&P Global Ratings estimates that U.S. data centers’ energy use could increase natural gas demand between 3 bcf/d and 6 bcf/d by 2030. The NATEM model optimizes the electricity mix in line with policies described in this document.
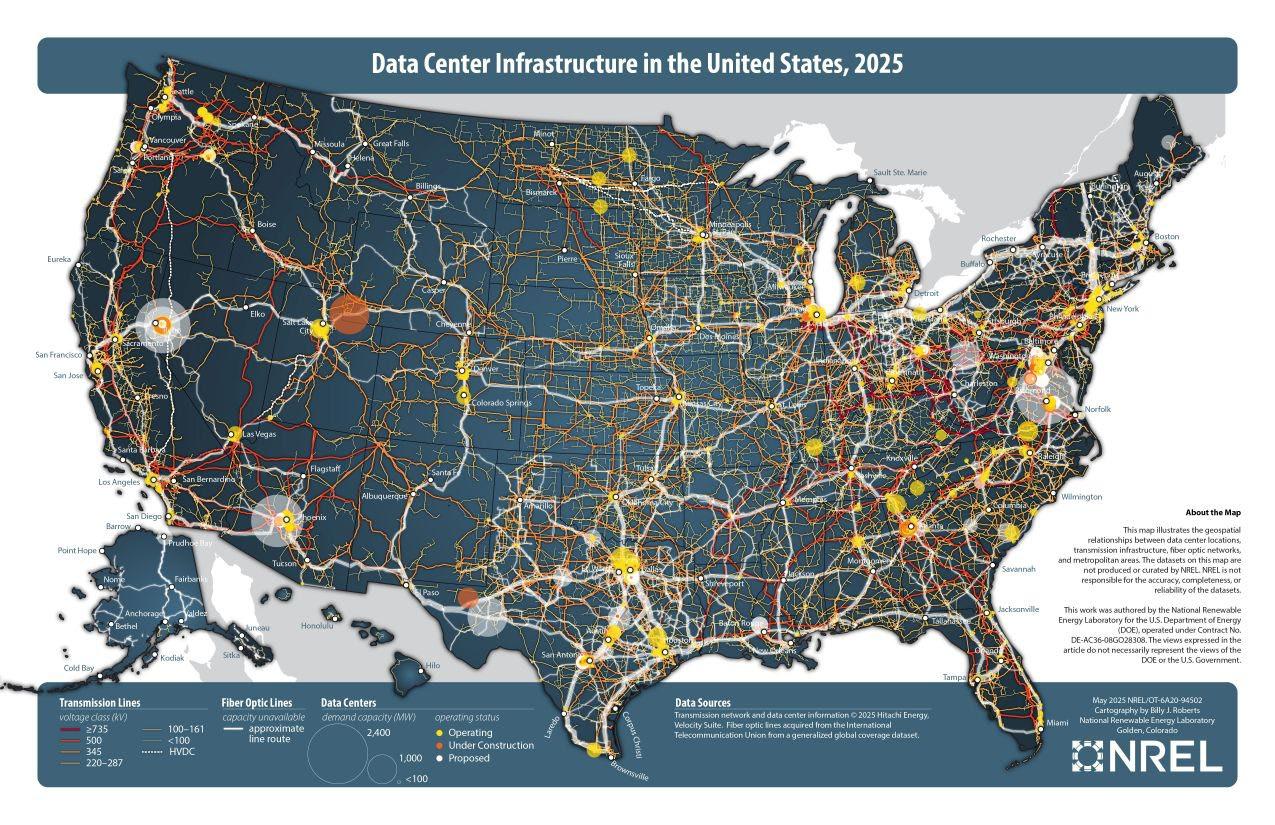
Based on recent industry trends, data center demand will continue to grow in the medium-tolong term as shown below in Table 7. Appendix J contains an image from the National Renewable Energy Laboratory (NREL) which depicts data center infrastructure in the U.S. in 2025
Source: Lawrence Berkeley National Laboratory, 2024 Report on U.S. Data Center Energy Use
The May 2024 Electric Power Research Institute (EPRI) report, “Powering Intelligence: Analyzing Artificial Intelligence and Data Center Energy Consumption,” estimates data center power consumption by region in 2023. This report utilizes EPRI’s regional analysis and assumes that the regional share of data centers’ power consumption will not change prospectively from 2023 to 2052, thus enabling demand estimations from data centers for each region through 2052. Tables 8 and 9 illustrate demand growth, which will remain concentrated in the South Atlantic region (R5), with both Texas and the Mountain region (R8) maintaining a strong share.
Table 7 – U.S. Electricity Demand from Data Centers (TWh)
Table 8 - Share of Data Center Power Consumption by Region for 2023
Source: EPRI, Powering Intelligence: Analyzing Artificial Intelligence and Data Center Energy Consumption (May 2024) Table 9 - Future Data Center Electricity Demand by Region (TWh)
2.3.4.
Midstream Infrastructure Needs
For simplicity, the model assumes as its baseline that existing midstream infrastructure is operating in equilibrium with current supply and demand conditions and, therefore, the development or expansion of new midstream infrastructure – including natural gas and oil pipelines, compression, and processing facilities – must occur to meet any increase in demand beyond current levels. Reallocation or repurposing of existing assets cannot be assumed to satisfy any incremental increase in demand in this analysis. This assumption enables the evaluation of long-term regional and inter-regional market dynamics over a 25-year study horizon.
To estimate midstream infrastructure needs in terms of physical units – such as pipeline mileage, number of compressors, and associated facilities – this study relied upon a set of standardized assumptions:
• Pipeline length and mileage per facility: Based on typical distances observed between production areas, processing plants, and transmission networks, with data gathered from Rextag.
• Pipeline diameter: Assumed average sizes tied to expected throughput requirements by commodity type (gas, oil, CO2, or hydrogen).
• Compression and pumping requirements: Calculated as horsepower (hp) or pump capacity per mile of pipeline, based on historic performance and design benchmarks.
These assumptions make it possible to scale future needs: every increase in consumption translates into a corresponding need for new natural gas, oil, CO2, or hydrogen pipelines, compressors, processing, and gathering facilities. Table 10 lists the assumptions used to estimate new midstream infrastructure development.
Table 10 - Assumptions for New Infrastructure Development
Infrastructure Component
Crude Oil and Natural Gas Gathering Lines
Processing Plants
Assumptions
Assumes an average diameter of 6 inches and a length of 6 miles.
Assumes incremental gas production will require new investment in processing capacity.
Existing and future pipeline infrastructure is categorized into 3 distinct categories:
Small/short pipelines: These have an average diameter of 12 inches and an average length of 40 miles. They typically serve as lateral pipelines connecting industrial facilities, distribution networks, or a power plant.
Crude Oil, Natural Gas, NGL Pipelines
Compressor Station Requirement for Natural Gas Pipelines
Pumping Requirement for Oil Pipelines
Medium pipelines: These have an average diameter of 24 inches and an average length of 120 miles, typically representing intrastate transmission pipelines.
Large/long pipelines: These have an average diameter of 36 inches and an average length of 250 miles, typically corresponding to interstate transmission pipelines.
Additional pipeline capacity introduced within a region must maintain the same proportional distribution as existing infrastructure.
Assumes 10,000 hp is required every 40 miles for small and medium pipelines
Assumes 25,000 hp is required every 60 miles for large pipelines.
Assumes 7,000 hp is required every 40 miles for small and medium pipelines.
Assumes 20,000 hp is required every 60 miles for large pipelines.
Small/short pipelines: average diameter of 10 inches and average length of 20 miles.
Hydrogen Pipelines
Hydrogen Compressors
CO₂ Pipelines
2.3.5. Pipeline Costs
Medium pipelines: average diameter of 14 inches and average length of 185 miles.
Large/long pipelines: average diameter of 16 inches and average length of 300 miles.
Assumes 15,000 hp is required every 60 miles
Assumes an average diameter of 12 inches and an average length of 150 miles.
The historical unit costs for oil and natural gas pipeline and compressor/pumping station construction are based on data from the Oil & Gas Journal survey of U.S. projects completed between 1980 and 2022. Due to limited cost data for 2020–2022, when pipeline construction
was near its lowest point, average pipeline construction costs for those years, and through 2023, were estimated using a regression analysis of historical trends. A statistical regression was performed between average U.S. pipeline construction costs and GDP over historical periods, with the resulting coefficients applied to forecast average U.S. pipeline construction costs from 2023 to 2052 based on projected GDP figures.
The analysis uses the 2019 national average U.S. pipeline unit cost of $351,600 per diameter inch-mile 3 (expressed in 2022 USD) as the starting benchmark. To account for regional variability, adjustment factors were derived from historical data to quantify the deviation of regional costs from the national average.
Table 11 illustrates this variability. For example, costs in R1, which corresponds to New England, are more than twice that in Texas.
R4
3 Pipeline costs are calculated from a composite unit cost based on historical project actual costs. These are simplified to “dollars per diameter inch-mile,” e.g., 100 miles of 30-inch diameter pipe would have an estimated total cost of 100 x 30 x $351,600 = $1,054,800,000.
Table 11 - Pipeline Regional Cost Factors
For gathering lines, cost estimates were also derived from Oil & Gas Journal data; only projects with pipelines less than 12 inches in diameter were included to better reflect typical gathering systems. In addition, adjustments were made to isolate and refine cost components related to right-of-way acquisition and environmental permitting. The average unit cost for U.S. gathering lines in 2019 was approximately $87,800 per diameter inch-mile, expressed in 2022 USD. Costs are not broken down by region due to the low variability between regions.
2.3.6. Compressor Costs
The report estimates and projects construction costs for natural gas compressor stations using a similar methodology. In this case, the dataset obtained from the Oil & Gas Journal was completed through 2022, eliminating the need for regression-based gap-filling for recent years. This allowed for a more direct analysis of historical cost trends and provided a robust basis for forward-looking projections
Based on available data, the average construction cost for U.S. natural gas-fired compressor stations was approximately $3,900 per hp (in 2022 USD) as of 2022. This is a national average and incorporates a range of project types and sizes. As with pipelines, regional cost differentials were accounted for using historical cost dispersion metrics, as shown in Table 12 Since there is little publicly available information regarding the costs for pumping stations as needed for oil and NGL lines, the study assumes pumping costs on average and over the entire system will approximate the cost of compression.
Table 12 - Compressor Regional Cost Factors
(New England)
R2 (Middle Atlantic)
R3 (East North Central)
R4 (West North Central)
R5 (South Atlantic)
R6 (East South Central) 0.89
R7 (West South Central) 0.92
R8 (Mountain)
2.3.7. Other Costs
Appendix C provides detailed cost assumptions for other infrastructure components, including power plant construction, residential natural gas appliances, direct air capture systems, and hydrogen production facilities with CCS. These estimates encompass capital cost breakdowns, technology-specific parameters, and relevant installation factors, offering a comprehensive view of the investment requirements across various segments of the energy system.
Gas processing costs, excluding compression, are estimated at approximately $650,000 per million cubic feet per day (MMcf/d) of processing capacity based on industry reports from Evercore and Energy Transfer Partners and project reported costs, including of the Beckville processing plant built by Enbridge Energy Partners and the Bighorn gas processing plant built by ONEOK. Capital costs for LNG export facilities, based on data from DOE export applications and other public sources, average between $5 billion and $6 billion per Bcf/d of export capacity (2022 USD)
Lease equipment costs are derived from historical EIA Oil and Gas Lease Equipment and Operating Cost data, adjusted to 2022 USD using the Producer Price Index from the U.S. Bureau of Labor Statistics. These estimates indicate average lease equipment costs of approximately
$350,000 per gas well and $520,000 per oil well. These costs escalate at the same rate as pipeline and compressor costs.
2.3.8. Key Policies
Policies are modeled in NATEM using various constraints and model parameters, such as subsidies, which can be applied for specific technologies if they meet certain conditions. Key policies and impacts modeled for this study, including those in the enacted IRA of 2022, were updated to reflect changes made in the H.R. 1, the One Big Beautiful Bill Act of 2025. Those changes are expected to considerably reduce the influence of IRA policies, as tax credits phase out for many clean energy investments. The end of the electric vehicle tax credit, for example, may support long-term demand for oil, though technology cost competitiveness will still play a role. CCS benefits under the new law, which aligns the tax credit for CO₂ used in enhanced oil recovery and commercial utilization with the higher geologic storage rate at $85/ton 4
2.4. Special Considerations
Many factors, including macroeconomic factors, may impact future demand for natural gas, oil, CO2, and hydrogen pipelines. Each has the potential to impact the cost or timing of infrastructure development, but they do not lend themselves to modeling due to the difficulty of quantifying their impact on input parameters or high uncertainty.
Nevertheless, the following factors are sufficiently important to warrant consideration. This report should be considered alongside implications of the below listed special considerations to determine if changes to costs, as well as the market, will have an impact on the industry.
4 For more detail, see Appendices C, F-J.
2.4.1. DUC Wells and DTIL Wells
“Drilled but Uncompleted” wells, often referred to as DUCs, are oil and gas wells that have been drilled to their target depth but have not been completed.
Tracking the inventory of DUC wells offers insight into industry activity levels, responsiveness to market signals, and potential future production capacity. EIA’s Drilling Productivity Report indicates 4,510 DUCs in April 2024, including 893 DUCs in the Permian Basin.
“Deferred Turn in Line” (DTIL) wells have been completed but not turned to production pending a price the operator finds sufficient. In the fourth quarter of 2024, for example, between three and four Bcf/d of gas came online rapidly from DTIL wells after cold weather increased demand and prices.
DUC and DTIL inventory indicate industry’s ability to bring natural gas wells into production quickly, necessitating infrastructure to bring this new production to market.
2.4.2. Permitting
The midstream infrastructure industry is the backbone of the energy system, ensuring the safe and efficient transportation of vital resources. Continued expansion of this sector is impacted by a complex web of federal, state, and local permitting processes. These permits govern everything from pipeline routes and construction methods to environmental impact mitigation and operational safety.
The current permitting system is characterized by lengthy delays, overlapping reviews, and inconsistent requirements across agencies, which can lead to project delays, increased costs, and uncertainty for developers. Interstate natural gas pipeline operators, for example, must obtain permits from the Federal Energy Regulatory Commission (FERC), the U.S. Army Corps of Engineers (USACE), and various state environmental agencies, which can involve extensive informal and formal public outreach and engagement, environmental analyses, and inter-agency coordination. Pipelines can spend months or years navigating this regulatory process, and litigation over government authorizations can add additional years Protracted timelines can hinder the timely development of necessary energy infrastructure, potentially impacting energy security and economic growth.
The permitting process for the midstream industry significantly impacts developers’ ability to make needed, timely, expansions and should be considered as a potential impact to achieving required buildout to meet demand. All of these elements make the current permitting process
lengthy, expensive, and uncertain. There are ongoing bi-partisan policy discussions happening in the U.S. Congress to pass a comprehensive permitting reform package that, if successful, would provide the clarity and certainty needed to build the infrastructure required to meet growing energy demand.
2.4.3. Supply Chain, Tariffs, and International Trade
Impacts to supply chains also affect midstream infrastructure development. Lead times for certain equipment, including compressors and gas turbines, have significantly lengthened, and pipeline operators report challenges in securing sufficient skilled labor for construction, safety, and related activities. If these conditions persist, they could delay project schedules and increase capital costs.
Trade policy developments, including the imposition of tariffs, may also influence midstream project economics. Tariffs on imported equipment, including but not limited to turbines, compressors, or pipeline-grade steel, may increase input costs for infrastructure projects. Tariff policy may impact longer-term domestic manufacturing capacity, but those uncertainties are not considered for this report
Retaliatory tariffs imposed by trading partners also could affect the economics of U.S. energy exports, including pipeline exports of natural gas to Mexico and Canada and seaborne exports of LNG, hydrogen, or ammonia produced from natural gas. Changes in relative costs could influence export volumes and market competitiveness.
Supply chain constraints and trade-related cost pressures represent factors that could influence the timing, cost, and scale of future midstream infrastructure development and associated energy flows.
3. Results and Interpretation
Identifying the regions in which energy production is expected to increase, and the magnitude of that growth, is essential to assessing future midstream infrastructure requirements. Interpretation of the techno-economic modeling results presented in this report requires an understanding of the key assumptions and parameters underlying the Reference Case.
• For each commodity implicated in the study, the model assumes the market is in equilibrium, i.e., the supply of natural gas to be produced or added to expected import volumes will equal the amount of natural gas needed to meet anticipated demand, including exports.
• The model assumes markets will make the most economic choice of fuels and investments to achieve the lowest energy cost. For the alternative Low Carbon Scenario, the analysis introduces constraints consistent with response to climate concerns. These include increasing government regulation of GHG emissions, which tends to limit the use of fossil fuels compared to the Reference Case.
• In any supply-demand model, it is necessary to define upper bounds for recovery of natural gas resources; the model assumes an upper limit on natural gas production consistent with EIA’s Annual Energy Outlook 2025, High-Oil and Gas Supply Scenario.
As used in the context of this report, “legacy midstream” refers to the energy commodities analyzed in previous years’ INGAA Foundation infrastructure reports – natural gas, crude oil, and natural gas liquids. In this edition, the definition of midstream has been expanded to include emerging fuels and technologies, such as hydrogen and CCS transportation. These are presented with more detail in Section 5.
3.1. Legacy Midstream Findings – Natural
Gas,
Oil, and Natural Gas Liquids
3.1.1.
Natural Gas
North America has significant natural gas resources. According to the Potential Gas Committee September 2025 report “Potential Supply of Natural Gas in the United States,” 5 total future gas supply in the U.S , as of year-end 2024, was 4,500 Tcf. That represents a 15 percent increase over the comparable year-end estimate in 2022. The Canadian Gas Association estimates that Canada has more than 1,300 Tcf of natural gas.
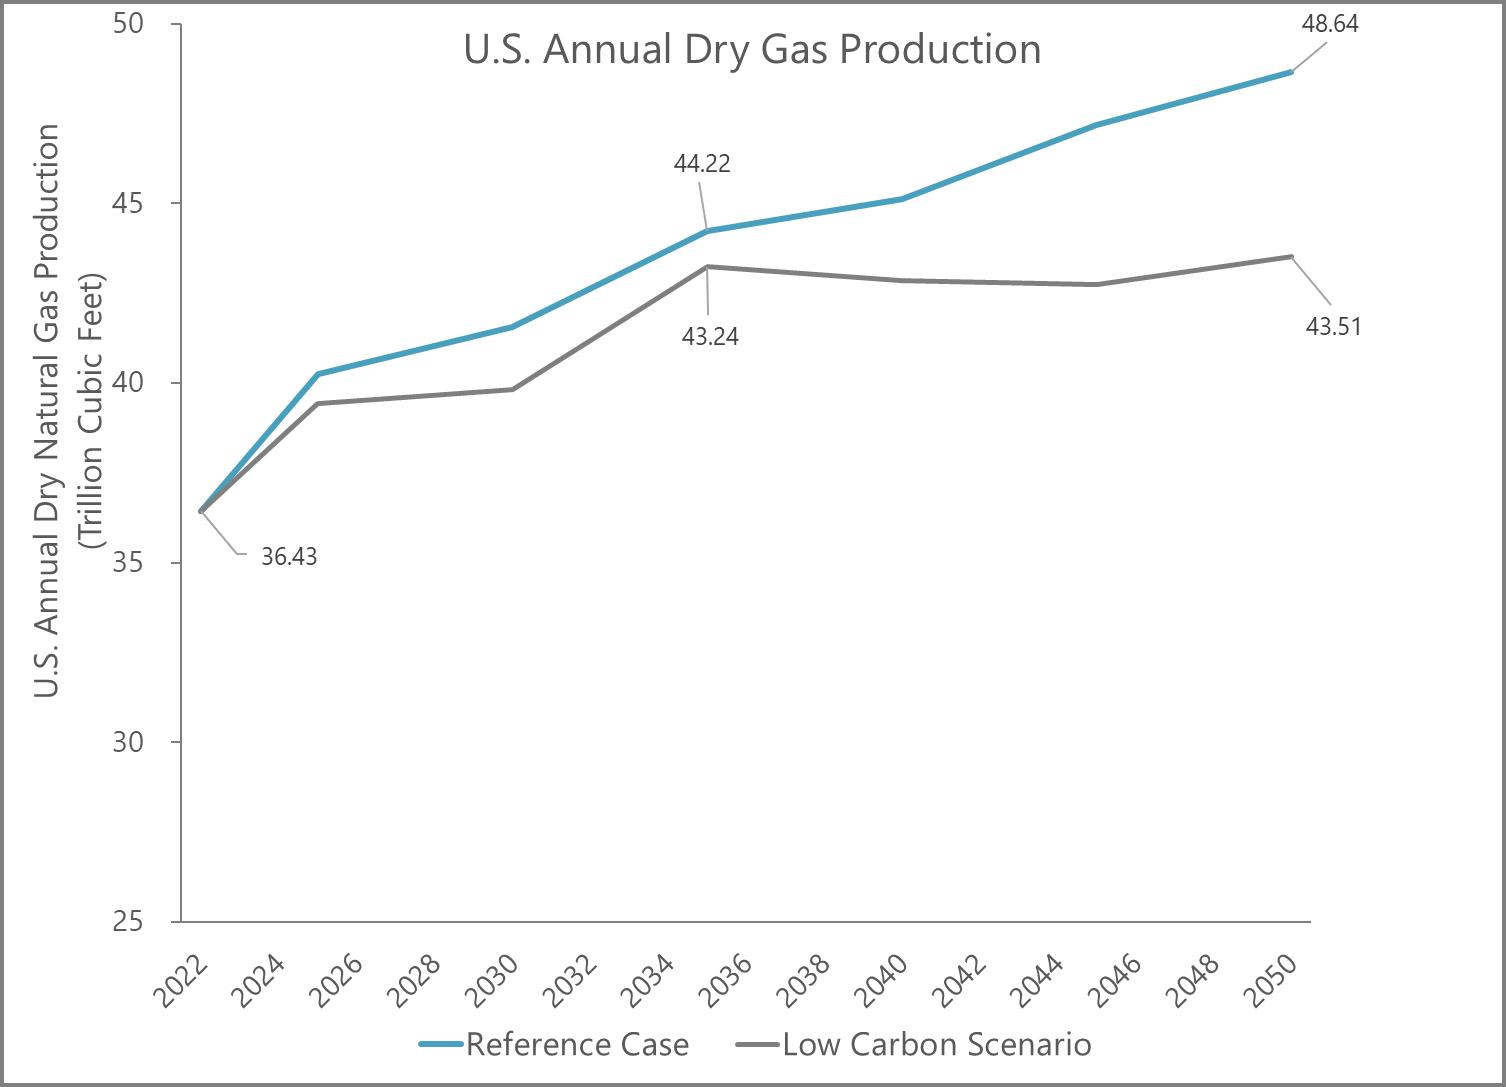
Natural gas production and consumption will continue to grow, powering the need for new infrastructure. Dry gas production in the U.S. will rise from 36 Tcf/yr in 2022 to 42 Tcf/yr in 2030 in the Reference Case. Increased LNG export capacity coming online and increased domestic consumption, namely electricity demand from data centers, drive this increase. Production grows more modestly after 2030, reaching 49 Tcf/yr in 2052, as illustrated in Figure 4 and detailed in Table 13.
The Low Carbon Scenario finds a similar significant rate of increase to 2030, when production reaches 40 Tcf/yr Production peaks in 2035 at 43 Tcf/yr, before rebounding to 44 Tcf/yr in 2052
The lower gas production in the Low Carbon Scenario is a direct result of GHG emission targets, which may reduce domestic consumption of natural gas while limiting production and downstream activities (including liquefaction).
Table 14 provides similar data for dry natural gas production in Canada for both the Reference Case and the Low Carbon Scenario.
5 The Potential Gas Committee (PGC) is a group of approximately 80 volunteer geoscientists and engineers that provides biennial assessments of technically recoverable U.S. natural gas yet-to-find resources since 1964 The PGC is supported by the Potential Gas Agency (PGA) at the Colorado School of Mines.
The analysis finds a more modest increase in dry natural gas production in Canada and less variation between the Reference Case and Low Carbon Scenario Nevertheless, the Low Carbon Scenario sees more moderate growth as a result of GHG reduction targets.
Figure 4 - U.S. Annual Dry Gas Production
Table 13 - U.S. Annual Dry Gas Production
Table 14 - Canada Annual Dry Gas Production
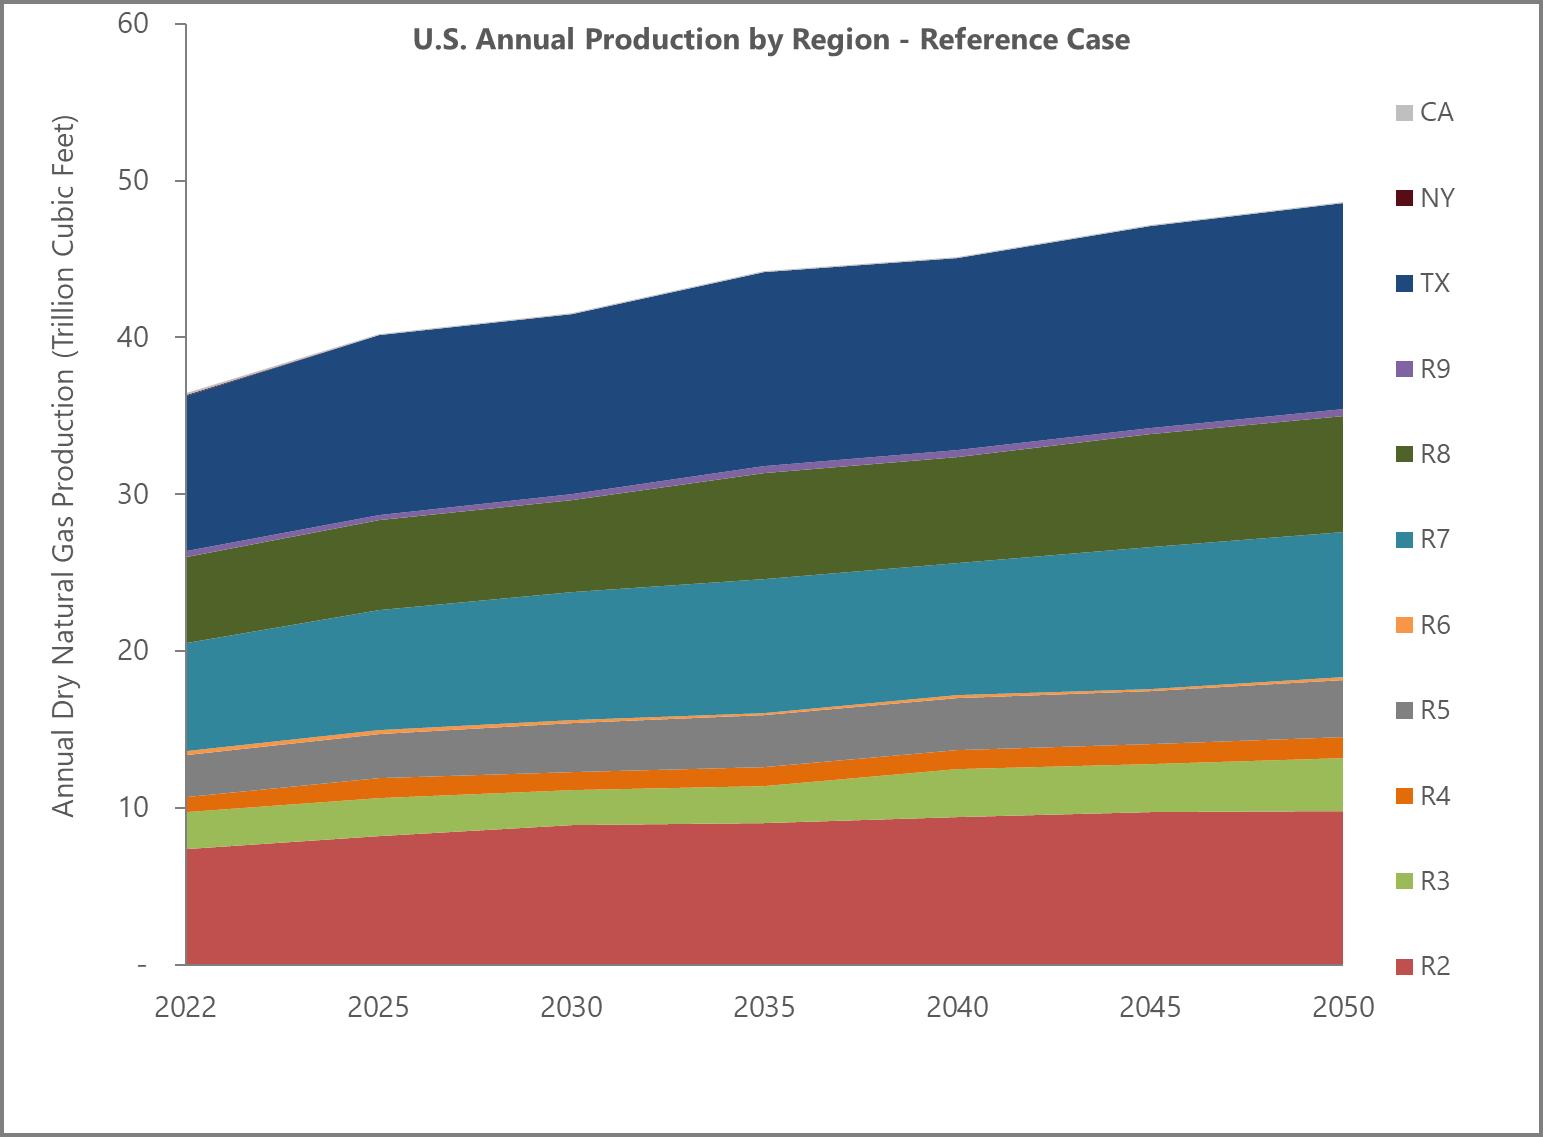
In the Reference Case, the U.S. dry natural gas market is projected to grow by approximately 34 percent between 2022 and 2052, driven by strong production increases across several key regions, as illustrated by Figure 5 and Table 15. The Northeast, particularly the Middle Atlantic and East North Central regions (R2 and R3), benefit from prolific output from the Marcellus and Utica shales. In the South, Texas and the rest of West South Central (R7) region show robust growth fueled by the Permian, Eagle Ford, and Haynesville basins. The West North Central (R4) and Mountain (R8) regions (which includes New Mexico, and Colorado), contribute to growth through plays like the Anadarko Basin, San Juan Basin, and Mancos Shale. Even Alaska (R9) is expected to see modest gains, while California and the East South Central region (R6) show more stable or fluctuating trends
This regional expansion is tied to the development of major basins that support dry gas production. The Appalachian Basin remains the largest contributor, with high-efficiency wells and proximity to demand centers. The Haynesville Shale is gaining momentum due to its proximity to LNG export terminals and high initial productivity. The Permian Basin, while primarily an oil play, is a major source of associated gas. Emerging basins like Mancos Shale within the San Juan Basin offer long-term potential, especially with infrastructure improvements. These trends reflect a dynamic shift in U.S. energy strategy, emphasizing domestic production, export capacity, and industrial demand for natural gas
Figure 5 - U.S. Annual Dry Gas Production by Region - Reference Case
Table 15 - U.S. Annual Dry Gas Production by Region, Reference Case 6
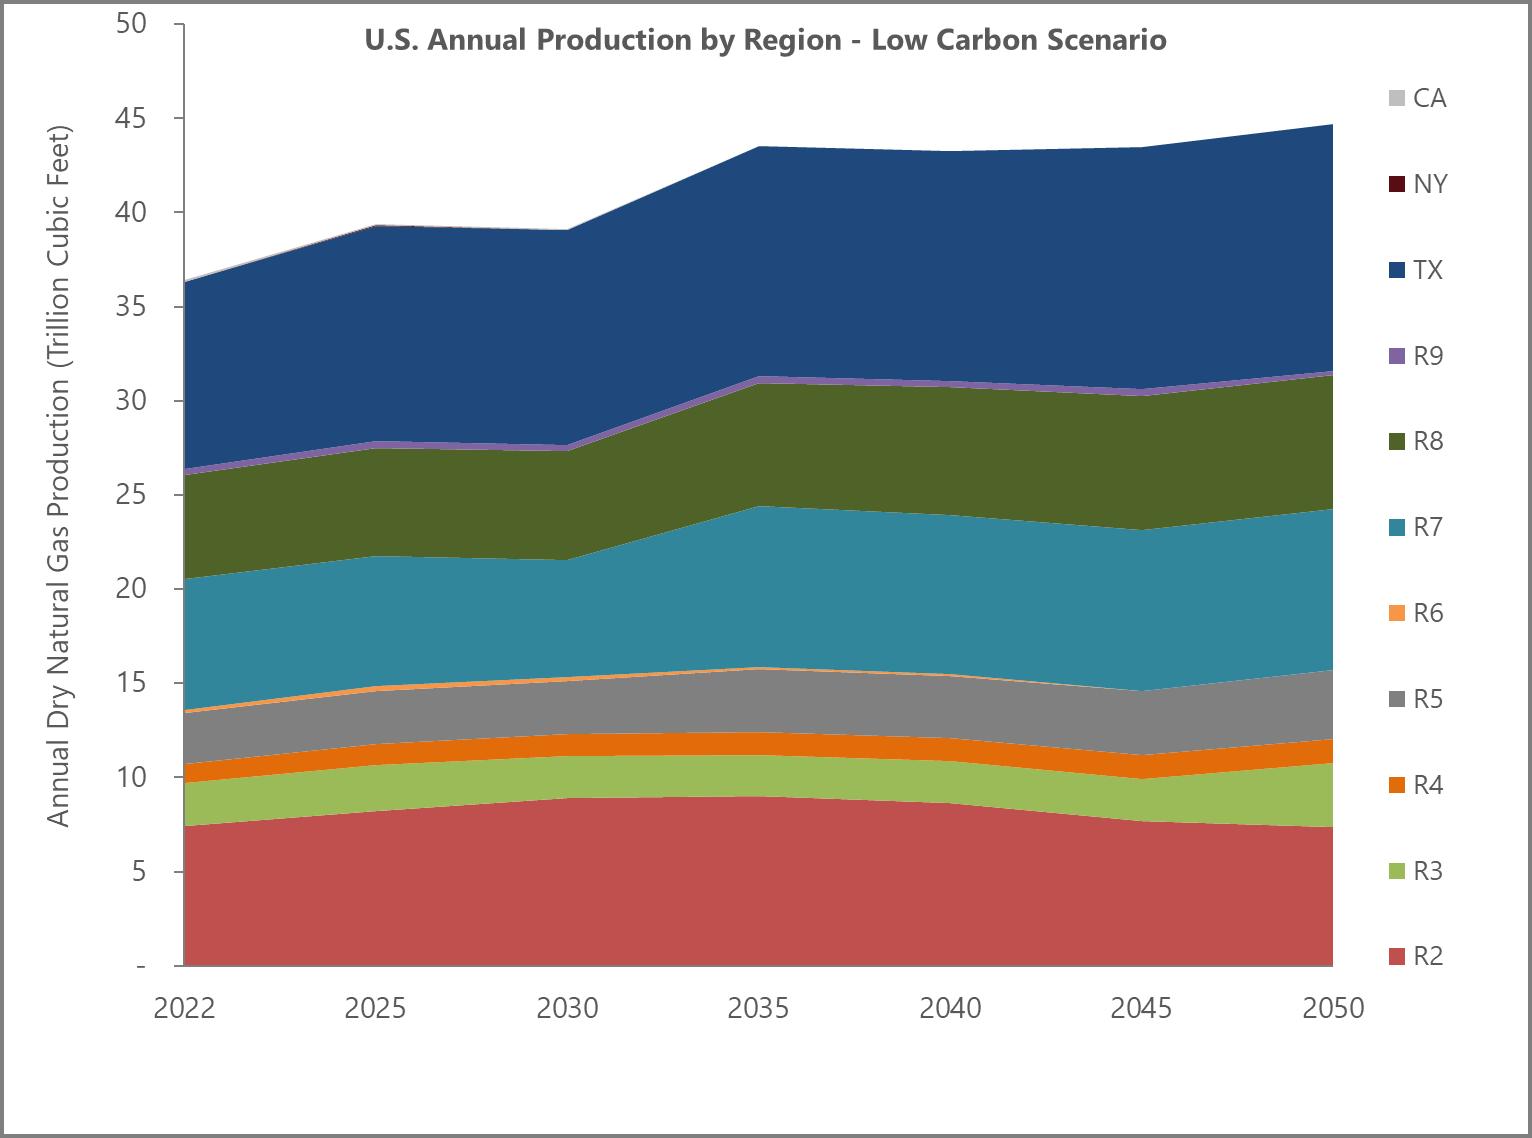
In contrast to the Reference Case, regional growth under the Low Carbon Scenario is more limited. As illustrated by Figure 6 and Table 16, although the Middle Atlantic region (R2) shows initial growth, long-term production resembles 2022 levels. This region has relatively stringent GHG reduction targets, reaching 80 percent in 2052, and neighboring regions including New England (R1) and New York do as well, which will reduce regional gas demand. The West South Central region (R7), on the other hand, reduces gas production in the short term to meet its 2030 GHG reduction target of 22 percent. Long term, natural gas production grows (albeit less than in the Reference Case) as reductions are made across other sectors, such as transportation, buildings, electricity generation, and refineries. The development of biofuels and hydrogen production with carbon capture also allows emission cuts. Texas, which has no emission reduction targets, will see long-term growth equivalent to the Reference Case. The Mountain region (R8) sees slightly more limited growth, by about 4 percent. Alaska and California both see declines in production. California has the strictest GHG regulations among the regions
6 The reader may notice small discrepancies in the data table total values presented here and the sum of the row values, due to rounding of the annual values. These small discrepancies do not alter in any way the conclusions of this report.
Figure 6 –
U.S. Annual Gas Production by Region - Low Carbon Scenario
Table 16 - Annual U.S. Gas Production by Region, Low Carbon Scenario
Carbon Scenario
3.1.2. Oil
Crude production is expected to rise to 13.1 million barrels per day (MMbp/d) in 2030, up from 11.8 MMbp/d in 2020, in the Reference Case, dropping to 11.0 MMbp/d in 2052
In the Low Carbon Scenario, crude oil demand peaks in 2030 at approximately 13.0 MMbp/d, dropping to 10.5 MMbp/d by 2052 This is primarily due to increased use of electric vehicles in the light-duty market and, to a lesser degree, more efficient internal combustion engines Table 17 illustrates these trends.
Electrification gradually reduces use of refined oil products domestically; the initial rise in oil production is sustained by a projected increase in crude oil exports, up 50 percent by 2030, and relative to 2022, up by 100 percent in 2052 under the Reference Case. The same trend is observed in the Low Carbon Scenario, although in practice more stringent global climate policies could result in demand for crude oil and oil products remaining relatively flat.
Exports will depend on trends in international oil markets: high adoption of electric vehicles globally could depress crude oil production further; conversely, a strong export market for crude oil and associated products could sustain domestic production over the medium term Demand for aviation fuel is projected to remain strong, and the model projects an increase in imports to meet this demand
Considered together, this presents a challenge for oil refineries because demand for different products, in particular gasoline vs aviation fuel, trend differently Refineries may prioritize jet fuel production, which typically requires different processing conditions. Operational implications for refineries include:
• Reconfiguration of units (e.g., hydrocrackers, distillation towers) to shift yield toward jet fuel
• Feedstock adjustments: Heavier crudes may be favored for jet fuel production.
• Economic trade-offs: Refineries may face reduced overall throughput if they are unable to balance product demand efficiently.
The downstream sector is currently grappling with these changing market dynamics.
Tables 18 and 19 illustrate anticipated oil production in various regions over the report time horizon.
Table 17 - U.S. Annual Oil Production
Table 18 - U.S. Annual Oil Production by Region, Reference Case
Table 19 - U.S. Annual Oil Production by Region, Low Carbon Scenario
Carbon Scenario
Canadian oil production data, highlighted in Table 20, demonstrates a modest decrease in 2025 followed by equally modest increases through 2052. The Reference Case and Low Carbon Scenario take different paths to the same 2052 production levels. While Canada also experiences decreasing domestic demand due to light-duty vehicle electrification, growth in the export of crude and oil products sustains continued growth in production. Canadian exports in absolute terms remain below U.S. exports.
Tables 21 and 22 reflect the amount of energy derived from the production of various oil products in both the Reference Case and Low Carbon Scenario in the U.S. While the rates of decline for each product differ through 2052, most show a decline in both the Reference Case and Low Carbon Scenario As consumer demand for both gasoline and diesel drop because of
Table 20 - Canada Annual Oil Production
the adoption of electric vehicles, reduced refinery production drives a reduction in crude production. Tables 23 and 24 reflect the same data for Canada.
Table 21 - U.S. Annual Oil Products Production by Type, Reference Case
Table 22 - U.S. Annual Oil Products Production by Type, Low Carbon Scenario
In Canada, fossil transportation fuel production goes up for the export market, with some shifts in other petroleum products over the period.
3.1.3. Electricity Demand
Electricity generation capacity in the U.S. has grown only modestly in recent years, with population growth and the increase in electric vehicles offset by increased efficiency. Data center demand, along with increasing electrification, may change that.
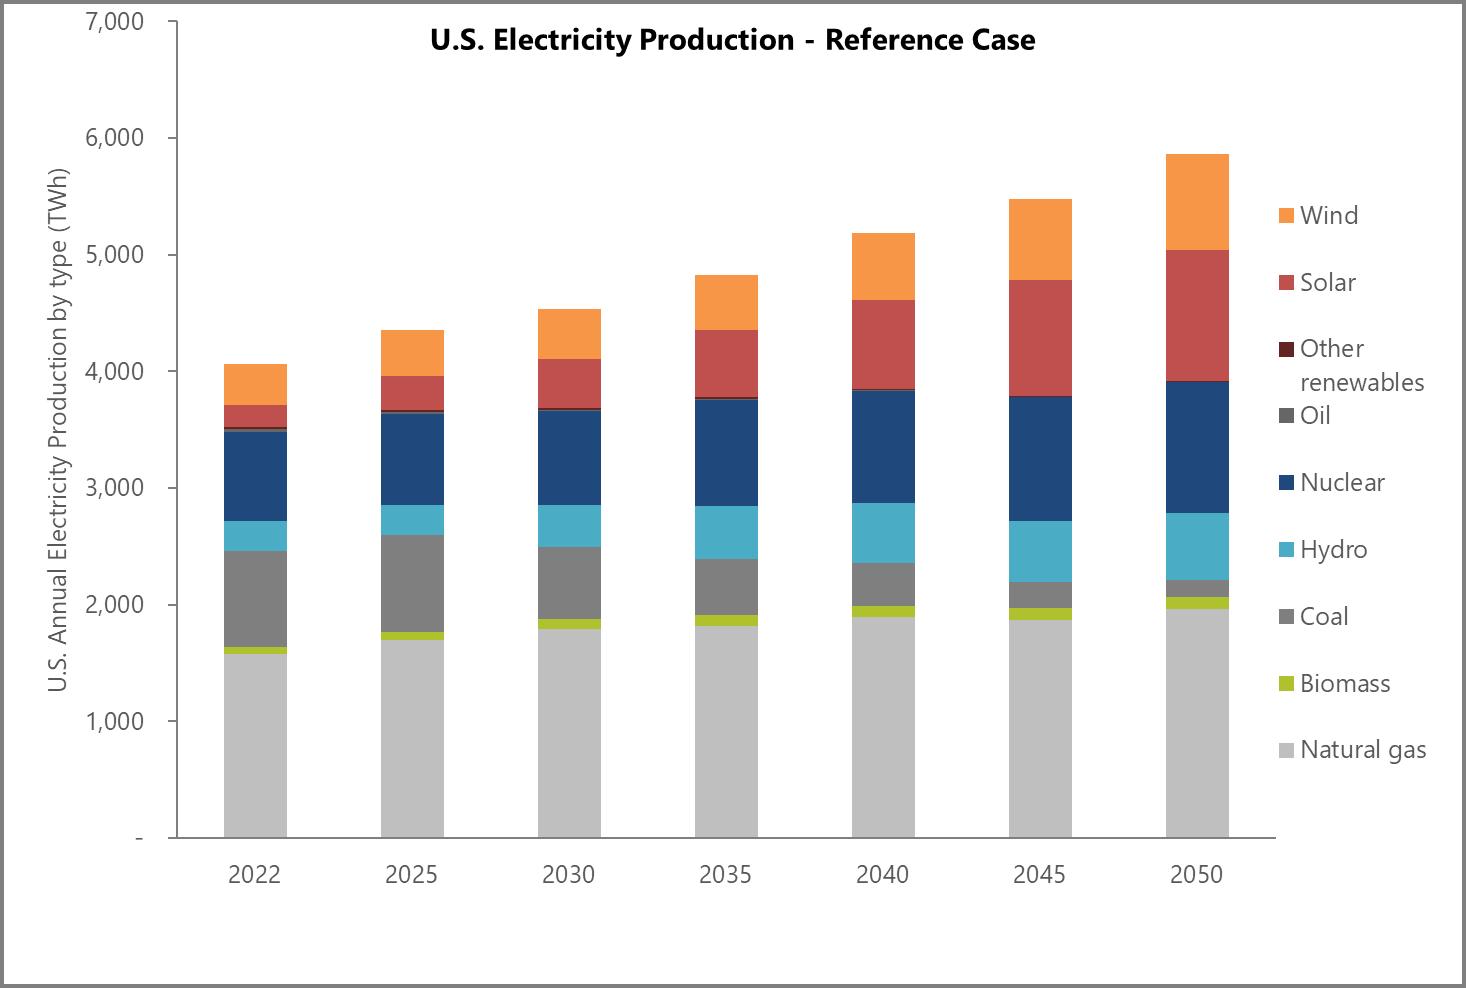
Demonstrated in Figure 7 and Table 25, electricity production from all sources was 4,063 TWh in 2022 and is expected to rise to 5,858 TWh in 2052. This electricity production is expected to be primarily met by renewables in regions with favorable wind and solar resources, such as solar in California and the South Atlantic (R5) region. Nuclear and hydro will experience significant growth as well. Even still, the analysis finds a 24 percent increase in electricity produced from natural gas (with and without CCS), rising to 1,962 TWh by 2052 from 1,582 TWh in 2022 and accounting for around 33 percent of total generation in 2052 7 The increased demand for natural gas, even as its share as a source of generating fuel drops, reflects both the growth of the total volume of electricity and the ongoing competitiveness of natural gas power plants to meet the need for reliability, resilience, renewable firming, and load-following in regions with high dependence on renewables.
Firming and load-following 8 with natural gas-fired generation requires greater natural gas deliverability, increasing the potential pipeline and storage capacity needed to meet rapidly changing demand for natural gas, even when renewables decrease daily average gas demand.
7 Natural gas accounted for 39 percent of U.S. electricity generation in 2022, according to EIA.
8 Firming refers to the use of dispatchable generation resources to ensure electricity supply is available when variable renewable generation (such as wind or solar) is unavailable or produces less output than expected. In this context, natural gas–fired generation provides firm generating capacity that can be called upon to maintain system reliability during periods of low renewable output.
Load-following describes the ability of a generation resource to adjust output in response to short-term changes in electricity demand or variability in renewable generation. Natural gas–fired power plants are commonly used for load-following due to their operational flexibility, including relatively fast ramp rates and frequent start-stop capability.
In the U.S., the Low Carbon Scenario sees electricity generation rise to 6,297 TWh by 2052, shown in Table 26, and higher natural gas electricity production than 2022 levels although less demand for natural gas-fueled generation than in the Reference Case Natural gas-fired generation will reach 1,733 TWh in 2052, which is somewhat lower than the Reference Case, largely due to stringent GHG reduction targets, and represents a growth of 10 percent relative to 2022. Under this scenario, natural gas will make up 27.5 percent of total generation in 2052. The remaining growth is primarily fueled by solar, wind, and nuclear power. Higher production relative to the Reference Case is driven primarily by increased electrification of transportation.
Table 26 - U.S. Annual Electricity Production by Type, Low Carbon Scenario
Electricity generation in Canada increases in both scenarios (Tables 27 and 28) but because carbon emissions restraints are already prevalent in Canada and its provinces, natural gas-fired generation is lower in both scenarios. In particular, the Clean Electricity Regulations encourage the use of gas for peaking purposes only, with long-term emission limits leading to a pronounced drop in natural-gas generation by 2052.
3.1.4. LNG Exports and Domestic Natural Gas Consumption
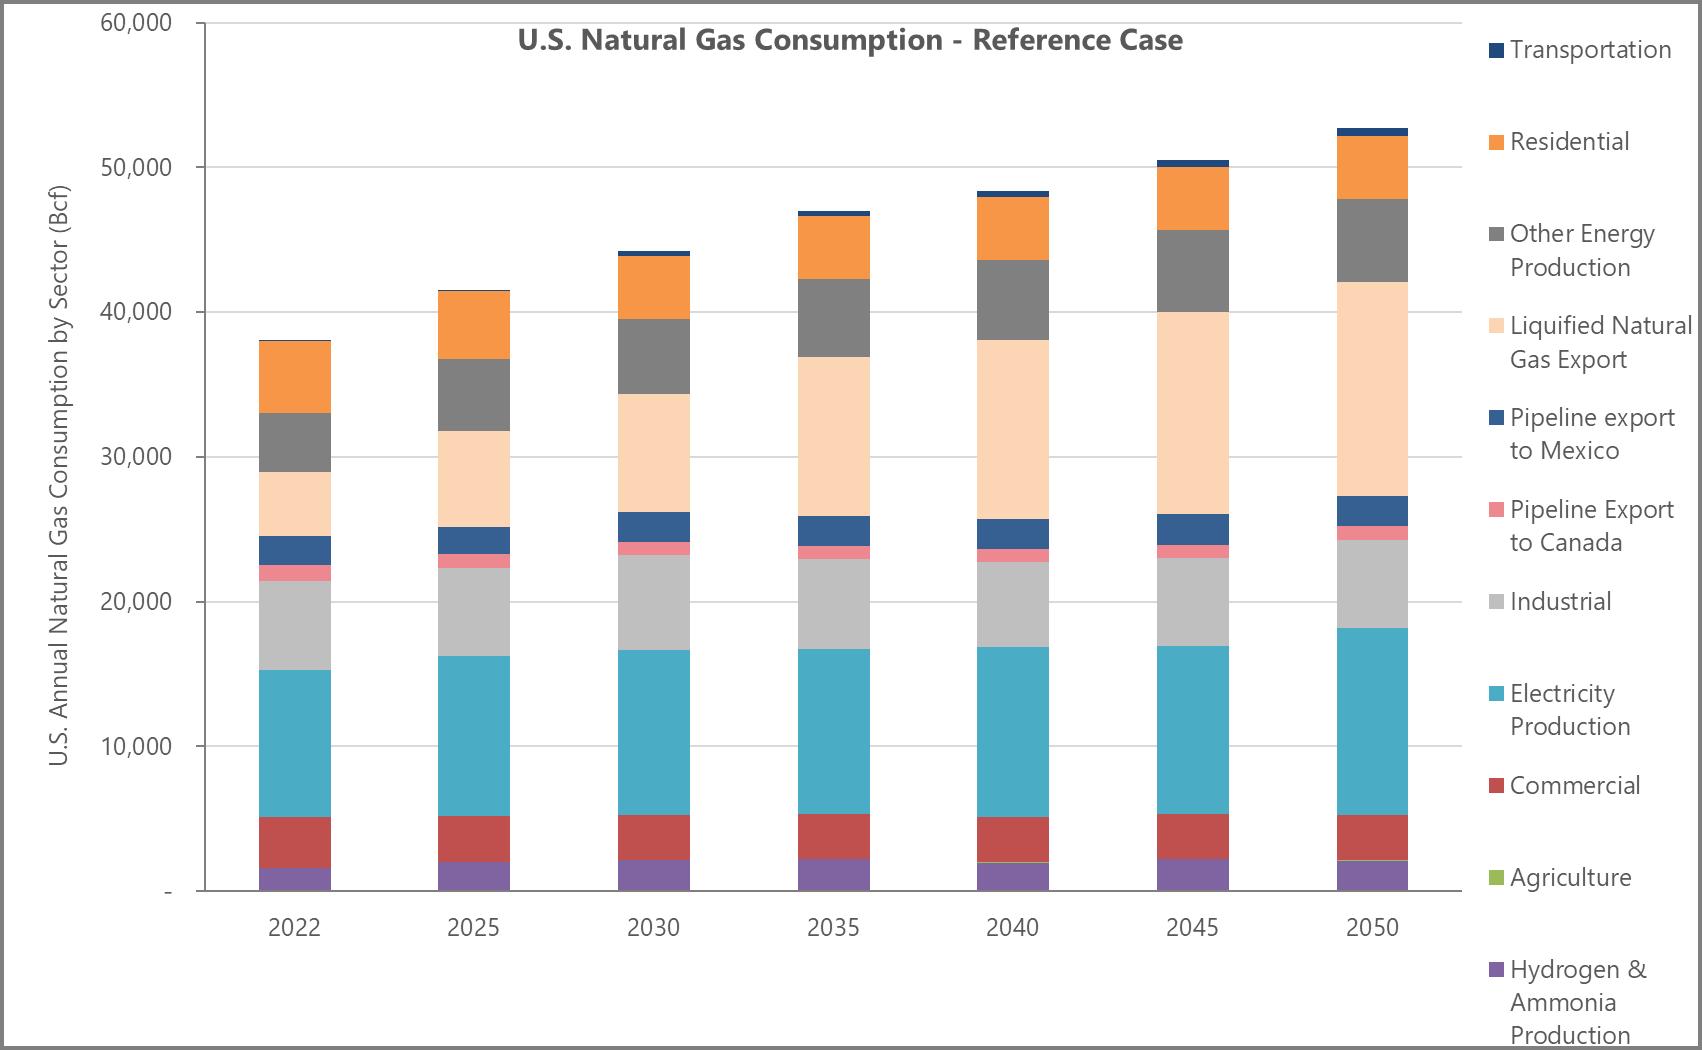
An assessment of future natural gas end-use demand is a critical input to determining the scale and scope of additional midstream infrastructure the North American industry will be required to develop over the coming years. In the Reference Case, as illustrated by Figure 8 and Table 29, natural gas consumption in the U.S. varies by sector but rises more than 38 percent overall, principally driven by LNG exports and data center demand.
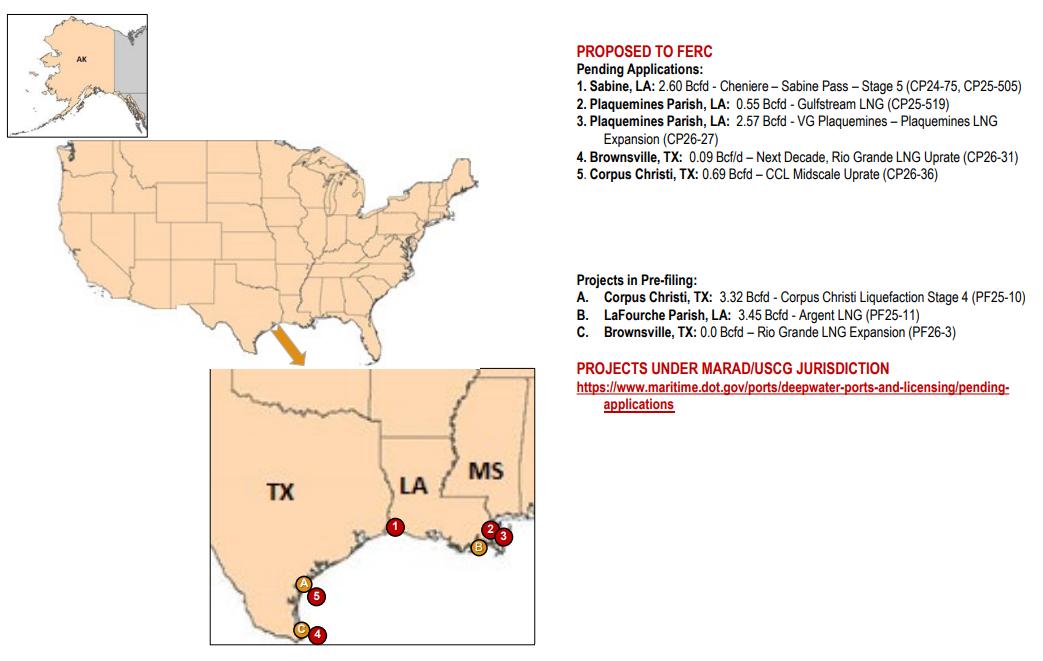
LNG exports are projected to increase substantially over the study period, rising by approximately 3.3 times from 2022 levels to reach 40.5 Bcf/d by 2052, while total electricity demand increases by roughly 27 percent. Appendix K presents maps showing existing LNG terminals, facilities under construction, and proposed projects across the U.S. as of April 2025. Growth in LNG exports reflects global market conditions and prices assumed in the modeling framework and contributes to overall increases in natural gas flows through the system.
Figure 8 - U.S. Natural Gas Consumption - Reference Case
Domestic natural gas consumption is projected to grow by approximately 14 percent over the study period. A portion of this growth occurs in the “other energy production” category, which includes natural gas used to support energy-related activities such as LNG terminal operations, compression, primary extraction, refining, and related processes. These uses increase in conjunction with overall energy system activity.
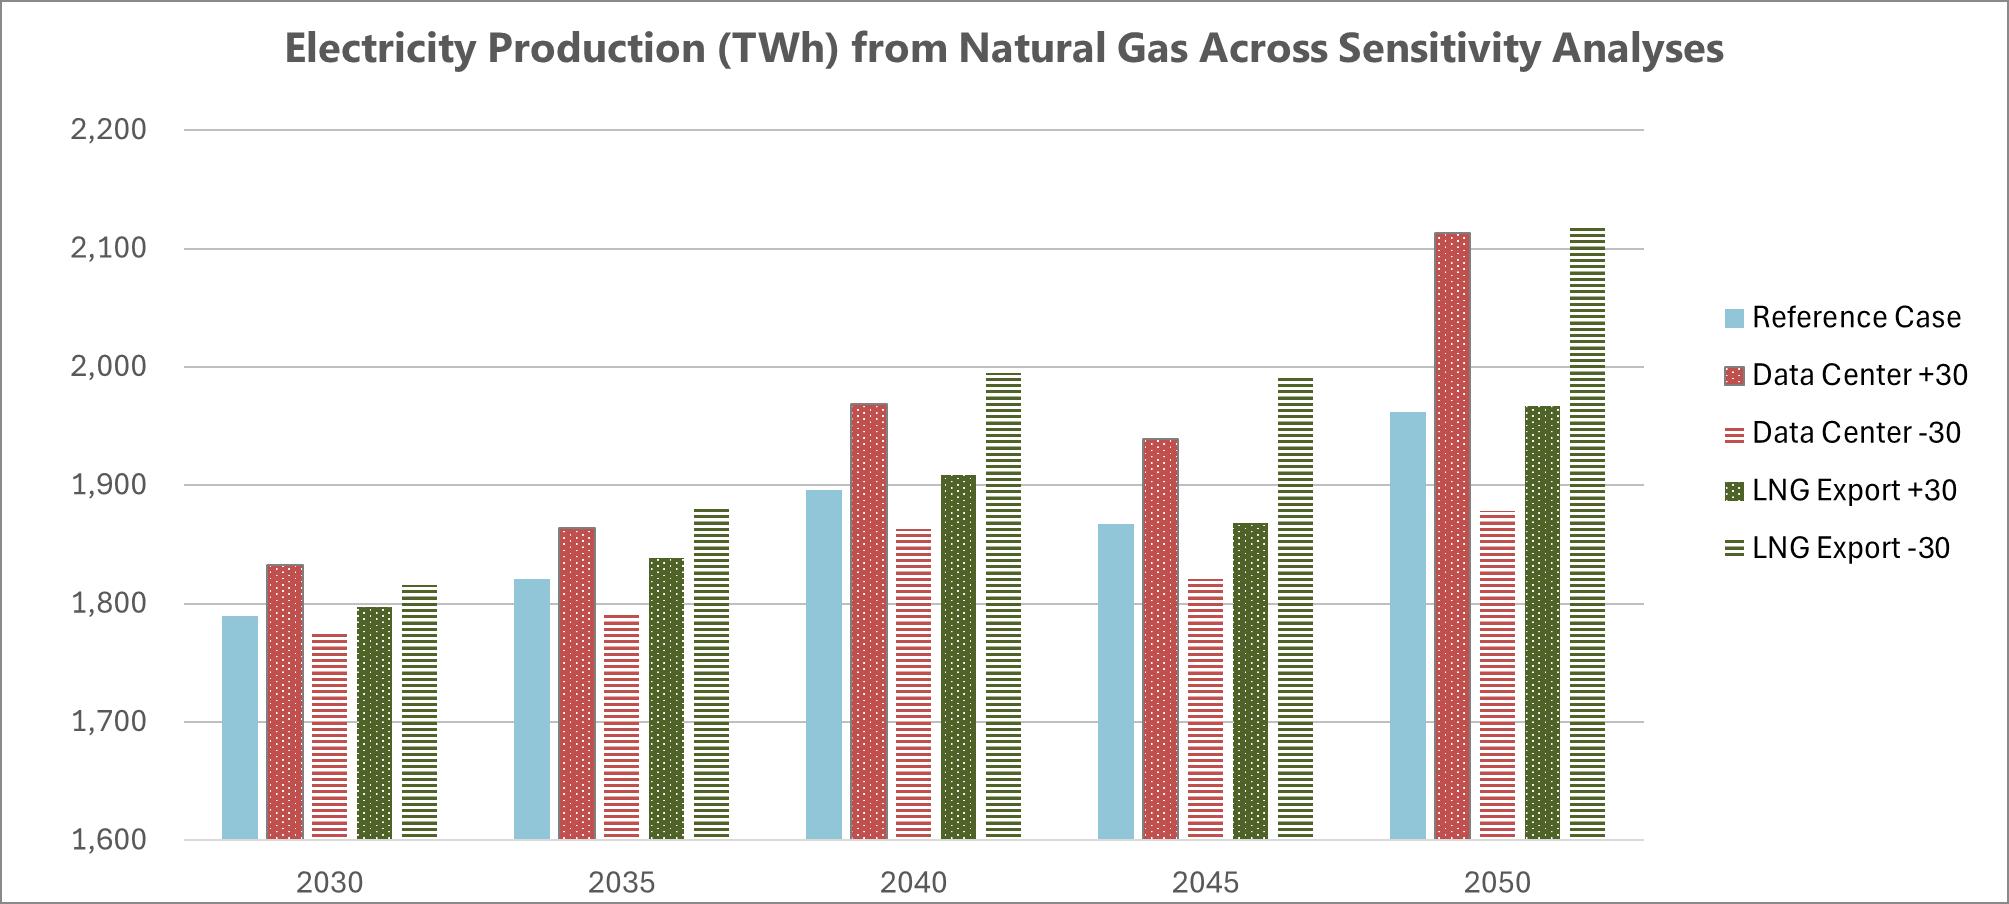
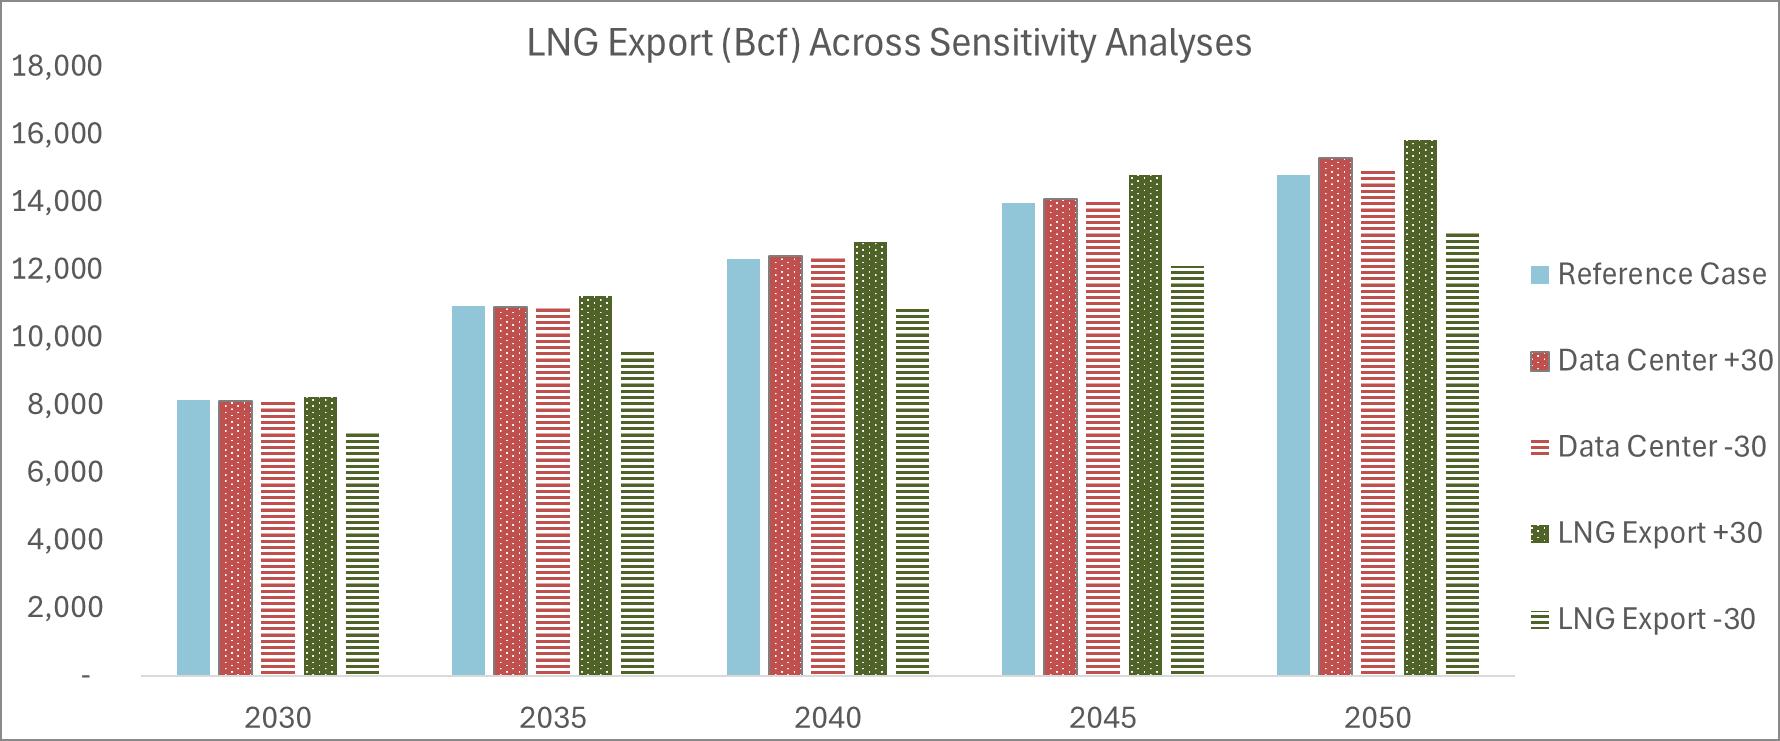
Industrial natural gas demand remains relatively stable over the study period in the Reference Case, reflecting a combination of efficiency improvements, structural changes in industrial output, and fuel flexibility across certain subsectors. The model allows industrial consumers to respond to relative fuel economics and technology availability, including the use of alternative fuels where feasible. The study’s sensitivity analysis of the LNG Export -30 scenario indicates that lower LNG export volumes would be associated with higher domestic gas availability, supporting additional growth in industrial and power sector gas demand. Electricity demand outcomes under these alternative cases are discussed further in the sensitivity analysis.
Table 29 - U.S. Natural Gas Consumption by Sector, Reference Case
Natural gas demand is lower overall in the U.S. Low Carbon Scenario, as detailed in Table 30. LNG exports more than triple, whereas gas use for electricity generation sees a more limited growth of 11 percent LNG export demand is slightly higher than in the Reference Case, reaching 41.1 Bcf/d in 2052, as natural gas shifts to exports while domestic consumption remains stable overall. Further growth of LNG exports may be limited by GHG reduction targets in certain regions, such as the West South Central (R7).
Canadian natural gas consumption also rises moderately in the Reference Case, going to 7,518 Bcf in 2052 from 5,842 Bcf in 2022 (see Table 31) with both pipeline and LNG exports leading the change. Long term, competition in demand between the U.S. and other international markets suggests Canada will respond to U.S. demand before building additional export capacity for other international markets. In practice, these dynamics will depend on price signals and how quickly the U.S. can ramp up its own production in the case of stronger-than-expected LNG market growth. Overall, while certain sectors, such as commercial buildings, see decreasing
Table 30 - U.S. Natural Gas Consumption by Sector, Low Carbon Scenario
consumption of natural gas with increasing electrification, other sectors, including industrial, increase the use of gas to sustain GDP growth – leading to a slight overall decline in domestic consumption
Table 31 - Canada Natural Gas Consumption by Sector, Reference Case Reference Case
In the Canadian Low Carbon Scenario (Table 32), natural gas consumption rises to 6,979 Bcf in 2052 from 5,852 Bcf in 2022, reflecting increases in pipeline exports to the U.S. and LNG exports to Europe and Asia Nevertheless, exports are about 7 percent lower than in the Reference Case, and domestic consumption decreases by a further 7 percent to meet GHG reduction targets.
3.2. Pipeline Expansions
Consistent with the modeling framework described earlier in this report, the analysis estimates future midstream infrastructure requirements based on average annual flows rather than peak demand While midstream operators size their infrastructure to meet peak demand rather than average annual flows, system-level, long-term models cannot directly quantify peak demand due to wide variations in contractual obligations, region, pipeline configuration, shipper mix, and end-use demand. The use of average annual flows reflects the level of detail available in longterm demand and supply forecasts and allows for a consistent comparison across modeled scenarios and regions. Using this framework, the model evaluates the capacity, investment, and timing of incremental pipeline infrastructure needed to support projected demand for all midstream products, i.e., natural gas, natural gas liquids, oil, CO₂, and hydrogen, through 2052
These capacity estimates should be interpreted as representing the additional capacity needed to provide the average annual flow estimated by the model. As explained, developers must design and build facilities to meet the peak or highest level of contracted demand. The capacity additions shown in Table 33 represent a conservative indicator of incremental infrastructure needs rather than a comprehensive design standard.
Table 32 - Canada Natural Gas Consumption by Sector, Low Carbon Scenario
This distinction between average and peak annual demand can be highlighted by observed operating data. As one example, the average throughput on the U.S. natural gas transmission system during January 2024 was approximately 103 Bcf/d, while peak daily deliveries reached roughly 184 Bcf/d, driven in part by Winter Storm Enzo. This implies an illustrative average-topeak load factor of approximately 1.8. While this relationship is based on a specific event, it reinforces why average-capacity results should not be interpreted as sufficient to meet peak hour or day conditions.
Table 33 summarizes the modeled demand for additional natural gas pipeline capacity in the U.S. and Canada under both the Reference and Low Carbon Scenario in five-year increments spanning 2023 through 2052. For natural gas transmission pipelines connecting adjacent regions, incremental capacity was allocated evenly between origin and destination regions for reporting purposes. Over the study period, the Reference Case indicates an average incremental requirement of approximately 70 Bcf/d of additional natural gas transmission capacity, including 6.4 Bcf/d in Canada. Under the Low Carbon Scenario, the analysis identifies an average need for 54.3 Bcf/d of additional capacity, including 4.5 Bcf/d in Canada, reflecting continued reliance on natural gas even as emissions targets are introduced.
Tables 34 and 35 reflect additional pipeline capacity demand by region in both scenarios The Reference Case shows significant growth in the Middle Atlantic (R2) and West South Central (R7) regions and Texas, the latter two owing to significant growth in production and LNG exports
Growth in the Middle Atlantic (R2) stems mainly from domestic trade, including the South Atlantic (R5) to support data center demand. Growth in pipeline capacity in the Mountain region (R8) is driven by trade to neighboring regions and increasing imports from Canada.
The most significant increased demand for natural gas pipeline capacity in the Low Carbon Scenario is in Texas, followed by the Mountain region (R8). The shift in pipeline capacity needs between regions is a direct result of GHG targets; Texas, which has not set targets, increases
Table 33 - U.S. and Canada Additional Natural Gas Pipeline Capacity
pipeline capacity additions to take a larger share of the LNG export market. Capacity is significantly reduced in the Middle Atlantic (R2), and moderately lower in the Mountain and West South Central regions (R8 and R7).
34 - U.S. &
(California)
The expansion of natural gas transmission pipeline mileage is projected to exceed 33,800 miles within the U.S. and reach approximately 37,160 miles when accounting for both the U.S. and Canada. Under the Low Carbon Scenario, the projected expansion is comparatively lower, amounting to roughly 25,500 miles across the U.S. and Canada. Tables 36 and 37 display findings by region for each scenario.
Based on the study assumptions, transporting the projected natural gas volumes also would require substantial compression. In the Reference Case, total demand for compression associated with natural gas transmission is estimated to exceed 12 million hp by 2052, reflecting higher pipeline throughput and network expansion. Under the Low Carbon Scenario, reduced demand for natural gas results in a lower compression requirement of approximately 8.6 million hp. Tables 38 and 39 display the results by region.
As displayed in Table 40, when combined, the U.S. and Canada require additional NGL capacity in both scenarios. Under the Reference Case, an additional 2.35 MMbp/d of U.S. and Canadian NGL pipeline capacity is needed by 2052; under the Low Carbon Scenario, an additional 2.22 MMbp/d is needed.
Table 39 - U.S. and Canada Added Compression by Region, Low Carbon Scenario
Table 40 - U.S. and Canada Added Natural Gas Liquids Pipeline Capacity
Regional and Canadian oil pipeline capacity increases are shown in Table 41 for both the Reference and Low Carbon Scenario
Table 41 - U.S. and Canada Added Oil Pipeline Capacity
Oil pipeline capacity needs over the period for both scenarios in the U.S. regions and Canada are shown in Tables 42 and 43
Table 42 - U.S. and Canada Added Oil Pipeline Capacity by Region, Reference Case
(New York)
3.2.1. Gathering Lines
Gathering lines are designed to move gas from wellheads to processing plants, compression stations, or transmission pipelines, and typically handle lower volumes than interstate transmission lines. Typical average gas flow for gathering lines depends on the size of the line, pressure, and production basin.
For modeling the gathering lines and future natural gas pipeline infrastructure needs, the analysis assumes 6-inch diameter with throughput of 4 MMcf/d, over a length of 6 miles
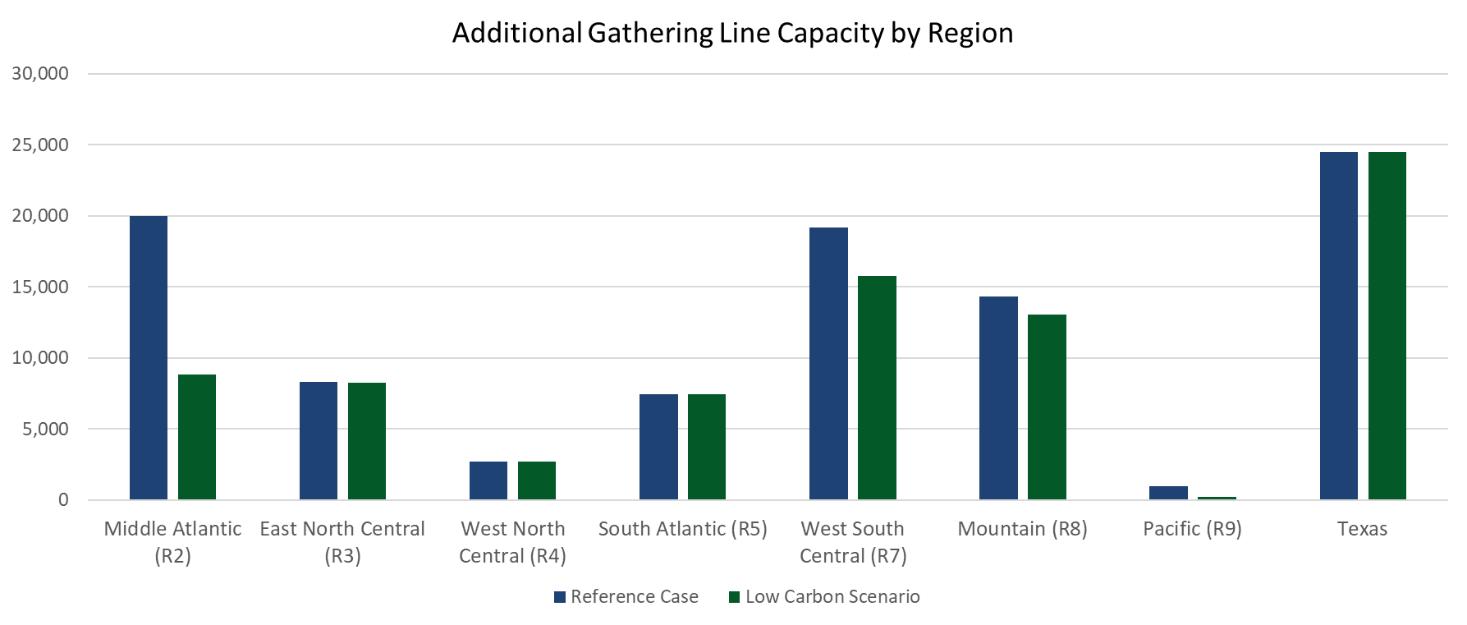
The results of projected need for minimum gathering lines are shown in Tables 44 and 45 below Figure 9 shows the results by region.
Table 44 - U.S. and Canada Added Natural Gas Gathering Line Capacity in Miles
Table 45 - U.S. and Canada Added Natural Gas Gathering Line Capacity in Bcf/d
Figure 9 - Additional Gathering Line Capacity by Region
3.3. Infrastructure Investment Costs
Over the study period, this analysis predicts total investments for all commodities discussed (natural gas, oil, NGL, hydrogen, and CO2) will approach $1.2 trillion in 2022 dollars, with an annual average of $40 billion (2022 USD) in the Reference Case. The largest share of the investment costs are derived from natural gas pipelines and LNG export terminals due to anticipated corresponding demand. This includes a sharp rise in LNG export terminal investments until the mid-2030s to meet expected international demand.
Investments in natural gas pipelines, a necessary backbone for LNG expansion and for domestic distribution, follow the same trend, with an additional long-term increase in the 2052 period.
By contrast, the midstream oil sector is projected to experience significantly lower investment levels, reflecting expectations of relatively flat demand over the time horizon examined in this report. Investments in hydrogen and CO2 pipelines are modest and immaterial compared to natural gas pipelines.
Table 46 details investment expectations by infrastructure type in five-year increments in the Reference Case. Table 47 provides the same breakout for the Low Carbon Scenario.
As discussed above, the model uses average annual throughput, so the analysis does not fully reflect the investment needed to provide peak delivery. If we assume a square relationship between capacity and cost and a difference of 1.8 times between average and peak delivery, 9 then North America needs to invest 1.34 times more in natural gas transmission pipelines to meet peak delivery requirements. This may increase total investment by 15 percent in the Reference Case. While gas compression investment may increase as well (approximately 1.6 times), the proportion of total investment is less significant, increasing total investment by about 4 percent.
9 Using the example factor of 1.8 to estimate increased design capacity needs, the relationship between pipeline diameter and capacity is roughly square or greater (power of 2.5 based on the Panhandle B equation) whereas costs scale linearly with diameter (dollar per diameter inch-mile).
Table 48 provides the total North American midstream investment cost by region in the Reference Case. The majority of the investment needed will be in natural-gas producing regions, including Texas, Mountain (R8), Middle Atlantic (R2) and East North Central (R3), and LNGexporting regions such as Texas and West South Central (R7). Investments in the South Atlantic region (R5) are similar to the Middle Atlantic region (R2) due to strong demand from electricity. Investments in New England (R1) and in California remain modest, given the high costs and the stringent regulations in those regions. Table 49 provides the same data for the Low Carbon Scenario. Table 48 - Infrastructure
Investment Costs by Region, Reference Case
Total investments over the period are higher in the Low Carbon Scenario than in the Reference Case, mainly due to increased international demand for LNG and resulting added capacity in LNG export terminals and natural gas pipelines connecting the terminals to production sites. The Low Carbon Scenario predicts 20 percent lower investment in natural gas pipelines due to lower total production and consumption, and to regional shifts. At the same time, increased investment in hydrogen and CO₂ pipelines driven by the GHG reduction targets more than make up for this difference. Through 2052, total investments under the Low Carbon Scenario are expected to reach about $1.4 trillion with an average of around $49.7 billion per year.
Detailed investment estimates for major components in the pipeline system are provided in fiveyear increments for both the individual components and by region in Appendix C.
3.4. Direct and Indirect Jobs Estimates Resulting from Midstream Infrastructure Investments
Jobs estimates are typically calculated using sophisticated models, such as computational general equilibrium macroeconomic models, and reported in many public-facing studies. The analysis in this report relies on a simplified multiplier approach based on a 2015 Standard & Poor’s report on general infrastructure, an API/PwC 2012 report on the Total U.S. Oil and Gas Industry Impact Multiplier and some general data on construction and infrastructure. The report used the Google-based AI tool Gemini to summarize data available from these sources.
This analysis revealed that a $1.2 trillion investment in the midstream infrastructure industry would result in a low-end estimate of 12 million jobs and a high-end estimate of 24 million jobs over 25 years. Of these numbers, between 2 and 4 million are direct jobs, a range of 4 to 8 million are indirect jobs, and the analysis suggests induced jobs range from 6 to 12 million. An investment of the magnitude required to meet the reported infrastructure demand would produce an average of 414,000 to 828,000 jobs per year during the study period, varying with the investment
3.5. Interpretation and Summary of Key Findings
Natural gas remains a core component of the North American energy system through 2052, under both the Reference Case and Low Carbon Scenario, supporting domestic consumption, electricity generation, data centers, and LNG export demand. While growth moderates under emissions constraints, overall production and infrastructure requirements remain substantial.
• LNG exports represent the single largest source of incremental natural gas demand over the study horizon. Under both scenarios, U.S. LNG exports more than triple by 2052, supported by favorable resource availability, competitive pricing, and global efforts to displace higher-emissions fuels. In the Low Carbon Scenario, global climate policies further reinforce LNG demand as importing countries seek lower-carbon alternatives to coal, increasing the importance of export-oriented pipeline infrastructure concentrated along the Gulf Coast.
• Natural gas production increases under both scenarios, driven by domestic demand and exports. In the Reference Case, dry gas production in the U.S. and Canada rises from 42.19 Tcf/yr in 2022 to 55.57 Tcf/yr by 2052. Growth is slower in the Low Carbon Scenario, reaching approximately 50 Tcf/yr by 2052. Production gains are widespread in the Reference Case, led
by major shale basins, while the Low Carbon Scenario concentrates growth more heavily in Texas.
• Electricity demand growth drives natural gas consumption, even as its share of total generation declines. Gas-fired generation increases in absolute terms to meet higher electricity demand in both scenarios, reaching 1,962 TWh in the Reference Case and 1,733 TWh in the Low Carbon Scenario by 2052. This reflects the continued role of natural gas in providing reliability and operational flexibility.
• Oil demand peaks around 2030 and declines thereafter in both scenarios, falling to approximately 10.9 MMbp/d in the Reference Case and 10.5 MMbp/d in the Low Carbon Scenario by 2052, indicating a slower growth trajectory relative to natural gas.
• Significant expansion of natural gas transmission infrastructure is required. Under the Reference Case, more than 33,800 miles of new natural gas transmission pipelines are needed in the United States by 2052, increasing to just over 37,000 miles when Canada is included. The Low Carbon Scenario reduces total expansion to approximately 25,500 miles across the U.S. and Canada.
• Infrastructure growth is concentrated in later years and in key regions. More than half of new natural gas transmission mileage in the Reference Case occurs in the final decade of the study period. Texas accounts for the largest regional expansion, reflecting its role as a major production center, LNG export hub, and industrial demand region. The Middle Atlantic (R2) and West South Central (R7) regions also experience substantial growth, though requirements are lower under the Low Carbon Scenario due to emissions constraints.
• Gathering pipeline expansion is driven by production intensity and export infrastructure. Texas has the highest gathering pipeline requirements due to its extensive production footprint, continued drilling activity, and proximity to Gulf Coast LNG export terminals, which are projected to handle 40.5 Bcf/d by 2052.
4. Sensitivity Analysis
The project consortium conducted additional sensitivity analyses to evaluate the robustness of the findings of both the Reference Case and Low Carbon Scenario and to better understand the uncertainty associated with emerging demand drivers. This section examines the impacts of LNG exports and electricity demand from data centers, the two factors with the greatest potential influence on future natural gas demand and associated pipeline capacity and investment requirements through 2052. These drivers were selected because of their scale, growth potential, and uncertainty within the modeling framework, rather than as forecasts of specific outcomes.
In the North American market, particularly in the U.S. and Canada, LNG exports are projected to expand to meet growing global energy demand with or without the application of CCS. While the Reference Case and Low Carbon Scenario provide two distinct views of how LNG exports may affect natural gas pipeline infrastructure needs, the report develops additional sensitivity cases to evaluate market responses under higher- and lower-export conditions relative to the Reference Case. Model testing indicated that variations within a range of less than ±30 percent did not produce material differences from the base results in the Reference Case. Therefore, the sensitivity analysis focuses on ±30 percent cases to illustrate the potential impacts of higher- and lower-than-expected LNG export demand.
Electricity demand from data centers represents a second emerging source of uncertainty, reflecting the rapid growth of digital services, artificial intelligence, and cloud computing, as well as uncertainty around technology efficiency and geographic siting. Because natural gas–fired generation plays a significant role in meeting incremental electricity demand in many regions, changes in data center growth assumptions can materially affect natural gas consumption and associated pipeline requirements. Accordingly, the report developed sensitivity cases to evaluate higher and lower data center electricity demand relative to the Reference Case, using the same ±30 percent variation to illustrate potential impacts on natural gas demand and infrastructure needs.
The four sensitivity cases were analyzed independently because the model inherently includes the interdependence between the two variables.
In the Reference Case, LNG exports and electricity drive the need for 70 Bcf/d of additional pipeline capacity between 2023 and 2052. If LNG export demand increases by more than 30 percent over the Reference Case (the LNG Export +30 case) the demand for additional pipeline capacity rises to 83 Bcf/d. Should LNG exports drop 30 percent below the Reference Case (the LNG Export -30 case), the model forecasts a demand for new pipeline capacity of 68 Bcf/d. Natural gas transmission pipeline capacity is more sensitive to increases in exports. The LNG Export -30 case allows for some flexibility in exports between Texas and West South Central regions (R7) In the Reference Case, West South Central (R7), was a larger exporter than Texas, but the LNG-low limit becomes a constraint for West South Central (R7), meaning Texas will increase exports. This occurs as gas is traded from West South Central (R7) to Texas, demonstrating the strength of the LNG market price signal. On the other hand, in the LNG Export +30 case, exports from West South Central (R7) increase.
Similarly, in the sensitivity analysis focusing on increased demand primarily from data centers, natural gas pipeline capacity is more impacted by an increase in demand – reaching 84 Bcf/d in cumulative additions, whereas the Data Center -30 case maintains similar pipeline needs as the Reference Case
In all sensitivities, production capacity is close to the assumed limit, requiring higher imports from Canada to fulfill demand in the LNG Export +30 case. Disregarding supply limitations, increasing export demand is likely to be met by increasing domestic production, especially in Texas and West South Central (R7), which are projected to be the largest exporting regions. Supply chain or regulatory constraints on the speed of new construction and discovery of unproved reserves could be limiting factors.
Table 50, which repeats data from Table 46, for ease of reference, shows the costs per infrastructure type for the Reference Case. Succeeding tables show changes resulting from the LNG Export +30 sensitivity case (Table 51) and the LNG Export -30 sensitivity case (Table 52).
Total and average costs rise in the LNG Export +30 case due to higher investments in natural gas pipelines and LNG export terminals Conversely, in the LNG Export -30 case, the model shows robust total investment, with the same order of magnitude as the Reference Case as regional flexibility helps to maintain similar export levels.
Increased electricity production to meet data center demand will also play a role in determining pipeline and other infrastructure needs. Table 53 reiterates projected generation by fuel type through 2052
Table 53 - Annual Electricity Production by Type, Reference Case
Case
As with the LNG sensitivity case, the model provided data for a Data Center ±30 percent sensitivity analysis. Table 54 shows that a 30 percent increase in data center demand (Data Center +30 case) increases electricity production by 247 TWh. Table 55 demonstrates that a 30 percent decrease in data center demand (Data Center -30 case) would result in a reduction in electricity production by 215 TWh. The difference in the two cases arises due to the elasticity of electricity demand in other sectors. For example, falling demand in a given region may decrease the price of electricity as new capacities are built out and in turn increase demand from buildings that may otherwise rely on other fuels.
In the Data Center +30 case, the analysis finds the increase in electricity production will be generated principally by natural gas. This is true in every time increment, and most pronounced in the period between 2045 and 2052. Natural gas meets about 62 percent of the new demand (representing an increase of 3,209 Bcf in consumption), with the remainder coming mainly from variable renewable generation. In the Data Center -30 case, natural gas-generated electricity falls compared to the Reference Case in every fiveyear period through 2052 (representing an additional 1,896 Bcf of consumption compared to 2,787 Bcf for the Reference Case). However, the fall in natural gas-generated electricity represents only 35 percent of the drop in data center demand. Variable renewable generation takes a greater hit, suggesting it is more sensitive to data center demand growth. Certain regions will also be more sensitive to these changes, depending both on their projected portion of data center demand and their potential for renewable generation.
The impact of the sensitivity of LNG exports on electricity generation from natural gas is more nuanced. In general, electricity demand from gas remains similar to the Reference Case in the LNG Export +30 case, as gas is directed towards LNG exports. In the LNG Export -30 case, natural gas shows higher marketplace penetration due to natural gas moving to the power sector and displacing solar, wind, and nuclear generation. This demonstrates competition and elasticity for gas demand between LNG exports and power generation and suggests domestic markets may show greater gas uptake if the export market is weaker than expected.
Figure 10 illustrates how electricity production would be affected by greater or lower demand via the sensitivity analyses.
An increase in LNG export demand potential is only partly reflected in the actual exports (about a 7 percent increase in 2052), which suggests domestic consumption of natural gas retains the market’s preference. Further, because the assumed production supply limit has already been reached in the Reference Case, the only way to increase LNG exports is by increasing imports from Canada. LNG exports likely would increase further if production were to grow. Thus, exports track the Reference Case, with the period 2040 to 2052 showing the largest spread. In each time period, the LNG Export -30 case shows lower demand for natural gas than in the Reference Case; however, demand in 2052 is only about 12 percent lower than in the Reference Case due to regional flexibility allowing the shift of export demand from West South Central (R7) to Texas
Figure 10 - Electricity Production from Natural Gas Across Sensitivity Analyses
Figure 11 shows the impact on LNG exports across the sensitivity analyses, while Figure 12 shows the additional natural gas pipeline capacity comparing the Reference Case to each of the sensitivity cases.
Figure 11 - LNG Exports Across the Sensitivity Analyses
Figure 12 - Added Natural Gas Pipeline Capacity Across the Sensitivity Analyses
As in the Reference Case and Low Carbon Scenario, the sensitivity cases offer a complex picture when reduced to a regional view. Texas has the most consistent requirement for added infrastructure across the analysis, while the West North Central (R4), South Atlantic (R5), West South Central (R7), and Mountain (R8) regions, and Canada show the widest variations. In the case of Texas, pipeline capacity increases in both +30 percent sensitivity cases and remains relatively stable in the -30 percent cases. This is because in the LNG Export -30 case, Texas increases its LNG exports relative to the Reference Case as demand shifts away from the West South Central region (R7) In the Data Center scenario, Texas maintains similar levels of natural gas use for electricity, decreasing renewable power generation instead.
The series in Figure 13 shows the regional impact of natural gas transmission pipeline additions (in miles) required in the four sensitivity cases. Light to dark blue indicates low to high cumulative additions by regions.
In West South Central (R7), the results are much more sensitive to LNG exports, as this region reached its full export potential in the Reference Case and therefore would experience a direct impact on infrastructure when export demand is reduced. The region is projected to serve only about 1 percent of data center demand, meaning reduced data center demand will have limited impact – while gas flows between regions decrease slightly, consumption in West South Central (R7) increases. In the Data Center +30 case, higher Canadian imports allow West South Central (R7) to increase regional consumption while reducing trade to other regions; overall, this slightly decreases total pipeline capacity requirements in the region.
The South Atlantic region (R5) has the greatest impact from increased data center demand, as it is projected to absorb 30 percent of demand. The Mountain region (R8) shows highest sensitivity to the +30 percent cases because the region tends to take the largest share of increasing Canadian imports, which may then be further traded domestically. The West North Central region (R4) shows similar sensitivity to the +30 percent scenarios for the same reason –increasing domestic trade in the long term to satisfy increasing demand in other regions
Figures 13 - Regional Impact of Pipeline Additions
14 compares additional pipeline capacity needed by region across the Reference Case with the various sensitivities.
Figure
Figure 14 - Added Natural Gas Pipeline Capacity by Region Across Sensitivity Analyses
Consistent with the Reference Case, the impact of the sensitivities on total infrastructure investment costs (including gathering lines, compressors, LNG terminals, NGL pipelines, oil pipelines, hydrogen pipelines, and CO2 pipelines) show increases to the Reference Case on the order of 18 percent for the +30 percent cases across the entire period for both LNG and electricity production. In the -30 percent LNG sensitivity, investments tend to be lower than the Reference Case until the 2048–2052 period, at which point they almost reach parity with Reference Case investment demands. This analysis sees about 6 percent lower investment compared with the Reference Case, with the largest impact on LNG export terminals, followed by natural gas pipelines. In contrast, the Data Center -30 case shows similar levels of total investment as in the Reference Case, with a negligible impact on natural gas pipelines. Figure 15 illustrates the range of investment impacts.
Figure 15 – Investments Required Across the Sensitivity Analyses
5. Emerging Fuels and CCS Findings
In addition to traditional oil and natural gas transportation, the definition of midstream infrastructure applied in this study includes emerging systems required to support evolving energy supply chains, such as hydrogen pipelines, CO2 transportation for CCS, and infrastructure associated with certified natural gas. As energy markets respond to decarbonization goals, technology innovation, and shifting end-use demand, these emerging fuels and services are expected to play an increasingly important role in the North American energy systems and associated infrastructure requirements.
This section builds on the Reference Case and Low Carbon Scenario presented earlier in the report to examine how growth in certified natural gas, hydrogen production, and CCS deployment may affect future midstream infrastructure needs. The analysis focuses on the scale, location, and timing of incremental pipeline capacity and investment required to support these emerging energy pathways, recognizing that outcomes are highly dependent on policy, market conditions, and technology adoption. Together, these findings highlight how midstream infrastructure may evolve beyond conventional natural gas and liquids transportation to support a broader set of energy commodities and emissions management solutions through 2052.
5.1. Certified Natural Gas
Certified natural gas, often referred to as Responsibly Sourced Gas (RSG) or Independently Certified Gas (ICG), refers to natural gas produced, processed, and transported by companies whose operations adhere to independently verified environmental, social, and governance (ESG) standards. These standards typically include minimizing methane emissions, ensuring well integrity, protecting water resources, reducing land disruption, and considering the impact on local communities. Third-party organizations audit and often monitor operations to provide assurance about the environmental footprint of the gas.
Certified natural gas offers a pathway for U.S. LNG exporters to potentially gain a competitive edge as global markets focus on reducing GHGs. By sourcing and exporting certified gas, companies can demonstrate to environmentally conscious buyers, particularly in Europe and Asia, that their LNG has been produced with significantly lower methane emissions and higher environmental standards. This differentiation could lead to premium pricing or preferred access to markets that prioritize cleaner energy sources.
The modeling framework used in this analysis does not explicitly differentiate certified natural gas from other natural gas production, nor does it track ESG attributes, methane intensity, or certification status along the supply chain. Accordingly, certified natural gas is not modeled as a distinct commodity, and its potential market impacts are not reflected quantitatively in the results. The discussion of certified natural gas is therefore provided for informational context only, to describe evolving market practices and potential considerations for LNG exporters that fall outside the scope of the infrastructure model
5.2. Hydrogen
Hydrogen is often touted as an alternative to more carbon-intensive diesel and other fuels for both industrial and heavy-duty transportation. It can be exported as hydrogen/liquid hydrogen or converted to ammonia and exported.
Increased adoption of hydrogen will result in the need for more dedicated pipelines and other infrastructure and, in the case of natural gas-based production, higher demand for natural gas. But how much hydrogen production grows is likely to depend on policy decisions and implementation – hydrogen production is far higher (by close to 17 million metric tonnes (MMt) in 2052) in the Low Carbon Scenario than under the Reference Case.
Current hydrogen production is often referred to as “gray hydrogen,” produced from natural gas using steam methane reforming (SMR) technology without CCS. Hydrogen can also be produced from water using electrolysis technology, labeled “green hydrogen” when the electricity used is supplied by renewable sources. Another form of hydrogen is produced through biomass gasification with or without CCS – the addition of carbon capture achieves negative emissions since biomass is accounted as “neutral” from an emissions perspective in national inventories. In the short-to-medium term, “blue hydrogen” production, similar to gray hydrogen with the addition of carbon capture, is of interest. Variants of the reforming processes, such as autothermal reforming, are also modeled.
The availability and structure of the Clean Hydrogen Production Tax Credit under Section 45V of the Internal Revenue Code plays a significant role in shaping the economics of electrolytic hydrogen production. Qualifying for the credit requires facilities to meet certain emissions intensity criteria and other regulatory requirements, including clean electricity sourcing and verification standards, as defined in the final IRA 45V regulations released in early 2025.
Current eligibility rules generally require that hydrogen production facilities be placed in service and begin construction by specified deadlines to qualify. This regulatory and timing framework means that in the near term, deployment of electrolyzers – and therefore growth in electrolytic hydrogen production – is shaped by whether projects can meet 45V qualification criteria and construction timelines. Broader adoption also depends on the availability of clean, costcompetitive electricity, as lifecycle emission calculations for credit eligibility incorporate electricity sourcing and matching requirements
In contrast, the Section 45Q tax credit offers a financial incentive tied to the amount of CO₂ captured and sequestered or utilized, supporting hydrogen production pathways that incorporate carbon capture (commonly referred to as “blue hydrogen”). Because 45Q is based on measurable quantities of CO₂ captured and stored, it can provide predictable support for natural gas-based hydrogen production facilities that integrate carbon capture systems.
Taken together, these federal tax credits influence the economic competitiveness of different hydrogen production pathways. The 45V credit is closely tied to clean hydrogen production performance and construction timing, while 45Q supports carbon capture investments embedded in hydrogen facilities and other industrial processes. In the short to medium term, these tax incentives may support some development of hydrogen infrastructure and production capacity, but barriers such as capital costs, electricity supply economics, and regulatory compliance will continue to influence the scale and pace of deployment.
Table 56 shows current hydrogen production using natural gas-based technologies. Reference Case results demonstrate growth in hydrogen production (about 15 percent between 2022 and 2052) and continued use of steam methane reforming without CCS. Demand for hydrogen in the Reference Case shows limited growth; there will be growth from the transportation sector, primarily for heavy-duty trucks, and from the plastics and fertilizer industries to keep pace with projected population and GDP growth, while refinery use will drop due to slowing demand for hydrogen to produce motor fuels. Although the carbon intensity of hydrogen was not accounted for in the Low Carbon Fuel Standard (LCFS) modeling (as well as increasing stringency of targets beyond 2030), in practice it is likely that blue or green hydrogen would be used in the medium term to generate further credits.
Table 56 - U.S. Annual Hydrogen Production, Reference Case
Reference Case
Hydrogen production is significantly higher in the Low Carbon Scenario, as seen in Figure 16 and Table 57, reaching 29.5 MMt/yr in 2052. Considering all forms of technology and including CCS to decarbonize those based on fossil fuels, hydrogen production grows from 11.1 MMt/yr in 2022 in the Reference Case to approximately 12.8 MMt/yr in 2052.
Growth of autothermal reforming and steam methane reforming technology, both with CCS, may be supported by the 45Q tax credit and the emission reduction targets in this scenario. Similarly, biomass gasification with CCS may also benefit from this tax credit while achieving negative emissions.
Note that electrolysis does not show up in the scenario results. This outcome likely reflects several related factors.
First, electrolytic hydrogen production is highly sensitive to regional electricity prices, which vary based on resource availability, policy requirements, and competing electricity demand. Regions with aggressive decarbonization targets may experience higher electricity prices due to constraints on low carbon generation or strong demand from other sectors, reducing the economic attractiveness of electrolysis. By contrast, regions with abundant renewable resources – such as Texas – may have lower electricity costs but lack policy drivers that would otherwise create sustained demand for green hydrogen. Together, these conditions limit the competitiveness of electrolytic hydrogen across regions in the modeled results.
Second, the modeling used 16 annual time periods per year, which underestimates possible renewables curtailment or over-supply that could create favorable electricity prices for electrolysis during those times. Nonetheless, the overall increase in production will generate increased demand for pipelines for hydrogen, CO₂ sequestration, and the underlying natural gas needed for production to meet domestic market demand. New demand sectors for hydrogen include industrial (for example, high temperature heat applications), transportation (e.g., heavyduty trucking), and biofuel upgrading.
Table 57 - U.S. Annual Hydrogen Production by Type, Low Carbon Scenario
Hydrogen production in Canada will grow under both the Reference Case and Low Carbon Scenario (with 8 percent greater long-term production over current levels) and reflects a wider range of production technologies, as shown in Tables 58 and 59. Growth in the Low Carbon Scenario stems primarily from new transportation sector demand. The Investment Tax Credit for
Figure 16 - U.S. Hydrogen Production - Low Carbon Scenario
Low Carbon Scenario
Clean Hydrogen helps to support the short-term deployment of electrolysis capacity, whereas GHG reduction targets lead to greater electrolysis use in the long term. Biomass gasification with and without CCS also grows in both scenarios, with CCS favored to achieve greater emission reductions. Finally, autothermal reforming with CCS shows long-term capacity deployment in the Low Carbon Scenario. Nevertheless, the hydrogen production mix in Canada remains dominated by gray hydrogen with close to 90 percent of production in 2050. More stringent GHG reduction targets across Canada would shift the mix further in favor of green and blue technologies
Table 58 - Canada Annual Hydrogen Production, Reference Case
Expected demand for hydrogen pipeline capacity requirements are reflected in Table 60 Hydrogen pipeline growth is expected to be much stronger in the Low Carbon Scenario based on increased production and new consumption sectors. Transportation sector growth is seen in both scenarios. In the Low Carbon Scenario, industrial use of hydrogen grows significantly, as does the use of hydrogen for biofuel upgrading, which will require additional pipeline buildout.
Table 60 - U.S. and Canada Added Hydrogen Pipeline Demand
Tables 61 and 62 reflect regional distribution of capacity demand increases for both scenarios.
Table 61 - Added Hydrogen Pipeline Capacity by Region, Reference Case
Table 62 summarizes the required hydrogen pipeline capacity as miles of pipe using a simplified consistent set of assumptions10 . Pipeline diameters and representative lengths were defined based on the configurations presented previously in Table 10 of the report, reflecting the assumed mix of short, medium, and long-distance hydrogen transport required to meet project capacity. All pipelines were assumed to operate at an ambient temperature of 70°F to provide a consistent basis for evaluating hydrogen flow behavior. When determining pipeline requirements, transport distance and diameter are closely linked, with shorter distances generally allowing smaller diameters and longer distances necessitating larger diameters to sustain required flow rates.
10 The pipeline capacity requirements in Section 5 are based on physics-based transport calculations used to size pipelines for modeled hydrogen and CO₂ flows. Investment values in this section were estimated using a simplified cost model applied to the resulting pipeline mileage. Tables 46 and 47, by contrast, report total installed costs (TIC) generated within the integrated cost framework using diameter-inch-mile cost relationships and including right-of-way, labor, and other associated project costs.
The report used the DOE’s NETL Hydrogen Pipeline Cost Model as the primary methodological reference to estimate hydrogen pipeline pipe-only capital costs. DOE/NETL cost curves indicate that a representative transmission-scale pipeline, approximately 16 inches in diameter, has a pipe construction capital cost on the order of $1.1-1.2 million per mile, excluding compression and above-ground facilities. Normalizing this cost by diameter yields an implied pipe-only cost of approximately $0.07-0.08 million per inch-mile. An average of $0.075 million per inch-mile was used to determine the investment requirements summarized in Table 64 Compression costs are summarized in Table 65, and assumptions remained at $3,900 per hp.
Table 63 - U.S. and Canada added Hydrogen Pipeline Capacity in Miles
Table 64 - U.S. and Canada Added Hydrogen Pipelines Investment Required
Table 65 - U.S. and Canada Added Hydrogen Pipeline Compression Investment
5.3. Carbon Capture and Storage
Additional CO2 pipeline capacity will also be needed, although how much depends on future policy decisions.
Table 66 presents both the Reference Case and Low Carbon Scenario, illustrating the dramatic impact of climate assumptions on CO2 pipeline capacity. The Reference Case demonstrates expected capacity demand when CO2 is utilized principally for enhanced oil recovery (fulfilled through existing capacity) and new buildout for carbon capture on electricity generation plants (101,595 t/d) The Low Carbon Scenario (projecting additional CO2 pipeline capacity of 1.5 million t/d) accounts for significant regulatory restrictions on emissions requiring new pipelines to move CO2 from its source to where it will be used or permanently stored. Sectors utilizing CCS include hydrogen, electricity, and biofuel production, as well as processes in hard to abate industrial sectors such as chemicals, pulp and paper, cement fertilizer, and food and beverage plants.
Table 67 and Table 68 document the regional requirements for both the Reference Case and the Low Carbon Scenario.
Table 66 - U.S. and Canada added CO2 Pipeline Capacity
Table 69 summarizes the pipeline mileage required to transport the projected volume of CO2 in the tables above. Under the Reference Case, an additional 2,556 miles of CO2 will be needed in the U.S. and Canada through 2052; and additional 37,806 miles will be needed under the Low Carbon Scenario. The pipeline capacity estimates shown in the table were based on an average CO₂ pipeline length of 150 miles and a single pipeline diameter of 12 inches, operating in dense phase with pure CO₂. Ambient temperature was assumed to be 70°F, and compression requirements were not explicitly modeled. Capital costs summarized in Table 70 were estimated using an inch-mile approach, with a unit cost of 0.05 million dollars per inchmile, based on the NETL CO₂ Transport Cost Model developed by the Office of Fossil Energy and Carbon Management.
Several important considerations are relevant when interpreting these results, as each could materially affect pipeline sizing and required capacity. Pipeline length is a key driver: shorter transport distances can generally be accommodated with smaller diameters, while longer
distances typically require larger diameters or additional compression to maintain dense-phase flow. Required CO₂ flow rates are dependent on the design and scale of the capture facilities, as well as whether the CO₂ is destined for utilization or permanent sequestration. CO₂ purity is also important, as higher impurity levels alter fluid properties and reduce effective transport capacity. Operating pressure assumptions influence both compression needs and allowable throughput, and variations in temperature, particularly near the CO₂ critical point, can significantly affect dense-phase behavior. In practice, inlet temperatures from capture facilities and regional or seasonal ambient conditions are carefully evaluated as part of a detailed pipeline design.
5.4. Interpretation and Key Results
Emerging fuels and carbon management technologies could meaningfully expand midstream infrastructure requirements over the study period, though outcomes vary widely across scenarios and are strongly influenced by policy and market conditions.
• Certified natural gas may influence LNG market positioning, as international buyers increasingly consider emissions performance and supply-chain attributes in procurement decisions. While certification is not explicitly modeled, evolving market preferences could affect how U.S. LNG competes in global markets without materially changing underlying natural gas flow requirements.
Table 69 - U.S. and Canada Added CO2 Pipeline Capacity in Miles
Table 70 - U.S. and Canada Added CO2 Pipelines Investment Required
• Hydrogen production increases under both scenarios, with substantially higher growth in the Low Carbon Scenario. U.S. hydrogen production reaches approximately 1.8 million terajoules by 2052 in the Reference Case and more than doubles to 4.2 million terajoules in the Low Carbon Scenario, reflecting stronger policy support and broader end-use adoption.
• Expanded hydrogen production drives new pipeline infrastructure needs. Incremental hydrogen output requires additional dedicated pipeline capacity, totaling approximately 25,000 tonnes per day by 2052 in the Reference Case and more than 77,000 tonnes per day in the Low Carbon Scenario, with growth driven by transportation, industrial use, and biofuel upgrading.
• Carbon capture and storage significantly increase CO₂ pipeline requirements, particularly under more stringent emissions constraints. In the Reference Case, additional CO₂ pipeline capacity reaches approximately 101,600 tonnes per day by 2052, while the Low Carbon Scenario requires substantially greater buildout – on the order of 1.5 MMt per day –reflecting expanded capture across power generation, hydrogen production, and industrial sectors.
6. Conclusion
Natural gas and the infrastructure that moves it will remain an essential and expanding component of the North American energy system through 2052. Across the scenarios modeled, total energy demand significantly rises. Meeting that demand reliably and affordably will require substantial, sustained investment in pipeline infrastructure.
While renewable generation, nuclear power, and efficiency gains all increase over time, higher consumption of natural gas persists, driven in large part by the rapid expansion of data centers and places new demands on system flexibility and deliverability. Global LNG markets emerge as the largest source of incremental demand, elevating the role of North American midstream infrastructure in supporting both domestic reliability and international energy security.
Meeting energy demand through 2052 presents a tremendous opportunity for the midstream infrastructure industry. This study finds that North America needs more than 37,000 miles of new natural gas transmission pipelines in the Reference Case and 25,500 miles of new natural gas transmission pipelines in the Low Carbon Scenario, along with substantial additions of compression horsepower and gathering and processing infrastructure. These estimates represent minimum buildout levels; higher LNG exports, faster-than-expected electricity demand growth, or more frequent peak-demand events could materially increase infrastructure needs further
While emerging fuels such as hydrogen and expanded deployment of CCS require additional infrastructure, natural gas transmission pipelines remain the dominant driver of investment over the study’s horizon. Together, total midstream investment across all commodities is projected to approach $1.2 trillion to $1.4 trillion (2022 USD) through 2052.
The size of the investment in natural gas infrastructure needed to meet future energy demand highlights the critical importance of an efficient and predictable regulatory framework. Inefficient, inconsistent, or unduly burdensome permitting processes can frustrate the timely construction of critical infrastructure, stifling economic growth and technological innovation. Conversely, with appropriate planning and execution, midstream infrastructure can expand to meet the moment, strengthening energy security, enhancing system resilience, promoting accessible and affordable energy, and supporting a pragmatic and balanced energy mix for North America through 2052
List of Figures
Figure ES-1 - U.S. & Canada Additional Natural Gas Transmission Pipeline Capacity
Figure ES-2 - Cumulative Transmission Capacity Growth Over the Study Period
Figure 1 - Map of U.S. Study Regions Used in NATEM Model
Figure 2 - Map of Canada Study Regions Used in NATEM Model
Figure 3 - Simplified Representation of North American Energy Systems
Figure 4 - U.S. Annual Dry Gas Production
Figure 5 - U.S. Annual Dry Gas Production by Region - Reference Case
Figure 6 - Annual U.S. Annual Gas Production by Region - Low Carbon Scenario
Figure 7 - U.S. Electricity Production - Reference Case
Figure 8 - U.S. Natural Gas Consumption - Reference Case
Figure 9 - Additional Gathering Line Capacity by Region
Figure 10 - Electricity Production from Natural Gas Across Sensitivity Analyses
Figure 11 - LNG Exports Across the Sensitivity Analyses
Figure 12 - Added Natural Gas Pipeline Capacity Across the Sensitivity Analyses
Figures 13 - Regional Impact of Pipeline Additions
Figure 14 - Added Natural Gas Pipeline Capacity by Region
Figure 15 - Required Investments Across the Sensitivity Analyses
Figure 16 - U.S. Hydrogen Production - Low Carbon Scenario
List of Tables
Table 1 - North American TIMES Energy Model (NATEM)-U.S. Model Regions
Table 2 - North American TIMES Energy Model (NATEM)-CANADA Model Regions
Table 3 - Projections for U.S. GDP (Billions USD 2023)
Table 4 - Projections for CAN GDP (Millions CAD 2023)
Table 5 - Projections for World Energy Prices (USD 2022/Mbtu for gas and USD 2022/barrel)
Table 6 - Projections for Maximum U S LNG Export Capacity (Bcf/d)
Table 7 - Electric Demand from Data Centers (U.S.) (TWh)
Table 8 - Share of Data Center Power Consumption by Region for 2023
Table 9 - Future Data Center Electricity Demand by Region (TWh)
Table 10 - Assumptions for New Infrastructure Development
Table 11 - Pipeline Regional Cost Factors
Table 12 - Compressor Regional Cost Factors
Table 13 - U.S. Annual Dry Gas Production
Table 14 - Canada Annual Dry Gas Production
Table 15 - U.S. Annual Dry Gas Production by Region, Reference Case
Table 16 - Annual U.S. Gas Production by Region, Low Carbon Scenario
Table 17 - U.S. Annual Oil Production
Table 18 - U.S. Annual Oil Production by Region, Reference Case
Table 19 - U.S. Annual Oil Production by Region, Low Carbon Scenario
Table 20 - Canada Annual Oil Production
Table 21 - U.S. Annual Oil Products Production by Type, Reference Case
Table 22 - U.S. Annual Oil Products Production by Type, Low Carbon Scenario
Table 23 - Canada Annual Oil Products Production by Type, Reference Case
Table 24 - Canada Annual Oil Products Production by Type, Low Carbon Scenario
Table 25 - U.S. Annual Electricity Production by Type, Reference Case
Table 26 - U.S. Annual Electricity Production by Type, Low Carbon Scenario
Table 27 - Canada Annual Electricity Production by Type, Reference Case
Table 28 - Canada Annual Electricity Production by Type, Low Carbon Scenario
Table 29 - U.S. Natural Gas Consumption by Sector, Reference Case
Table 30 - U.S. Natural Gas Consumption by Sector, Low Carbon Scenario
Table 31 - Canada Natural Gas Consumption by Sector, Reference Case
Table 32 - Canada Natural Gas Consumption by Sector, Low Carbon Scenario
Table 33 - U.S. and Canada Additional Natural Gas Pipeline Capacity
Table 34 - U.S. & Canada Added Natural Gas Pipeline Capacity by Region, Reference Case
Table 35 - U.S. & Canada Added Natural Gas Pipeline Capacity by Region, Low Carbon Scenario
Table 36 - U.S. & Canada Added Natural Gas Pipeline Mileage by Region, Reference Case
Table 37 - U.S. & Canada Added Natural Gas Pipeline Mileage by Region, Low Carbon Scenario
Table 38 - U.S. and Canada Added Compression by Region, Reference Case
Table 39 - U.S. and Canada Added Compression by Region, Low Carbon Scenario
Table 40 - U.S. and Canada Added Natural Gas Liquids Pipeline Capacity
Table 41 - U.S. and Canada Added Oil Pipeline Capacity
Table 42 - U.S. and Canada Added Oil Pipeline Capacity by Region, Reference Case
Table 43 - U.S. and Canada Added Oil Pipeline Capacity by Region, Low Carbon Scenario
Table 44 - U.S. and Canada Added Natural Gas Gathering Line Capacity in Miles
Table 45 - U.S. and Canada Added Natural Gas Gathering Line Capacity in Bcf/d
Table 46 - Investment Costs by Infrastructure Type, Reference Case
Table 63 - U.S. and Canada added Hydrogen Pipeline Capacity in Miles
Table 64 - U.S. and Canada Added Hydrogen Pipelines Investment Required
Table 65 - U.S. and Canada Added Hydrogen Pipeline Compression Investment Required
Table 66 - U.S. and Canada added CO2 Pipeline Capacity
Table 67 - U.S. and Canada Added CO2 Pipeline Capacity by Region, Reference Case
Table 68 - U.S. and Canada Added CO2 Pipeline Capacity by Region, Low Carbon Scenario
Table 69 - U.S. and Canada Added CO2 Pipeline Capacity in Miles
Table 70 - U.S. and Canada Added CO2 Pipelines Investment Required
Appendix A – Modeled IRA Policy Assumptions
Policy Years Modeled
IRA 45V Hydrogen Production Tax Credit
IRA 45Q Carbon Capture Tax Credit
IRA 48D Investment Tax Credit for Clean Electricity
IRA 45Z Clean Fuels Production Tax Credit
2023-2032 with tax credit available up to 2042
IRA 30D Clean Vehicle Credit
2023-2032 with tax credit available up to 2044
2023-2032 with phase-out over next 2 years
2025-2027
2023-2032
IRA 25C Energy Efficient Home Improvement Tax Credit
IRA 25D
Residential Clean Energy Tax Credit
2023-2032
2023-2032
IRA HighEfficiency Electric Home Rebate Program (HEEHR)
2023-2032
Short Description
Assumed that electrolyzers would take this credit, while methane reforming with CCS is assumed to take the 45Q credit. Time-matching is modeled using the 16 representative time periods with new (additional) renewable energy power plants and a limit on capacity factor of 80 percent – leading to $3/kg credit.
Assumptions include a credit of $85/tCO2 for hydrogen production plants (with carbon capture and sequestration), $85/tCO2 for power plants, a credit of $60/tCO2 for EOR production (use of CO2), and $180/ton for DAC.
Clean electricity production plants take the ITC (rather than the 45Y production tax credit). The report assumes a 30 percent ITC for: wind, solar, hydro, nuclear, geothermal, biomass with CCS.
A tax credit for the production of low emission transportation fuels, including sustainable aviation fuels (SAF). It is assumed that a tax credit of $1/gallon for non-aviation fuels (e.g., biodiesel, cellulosic ethanol) and $1.25/gallon for SAF (e.g., bio jet, synthetic Fischer-Tropsch) and $1.75/gallon for bio jet produced with CCS.
While the maximum credit may reach $7,500, due to the increasing requirements on the source of critical minerals and battery components, the analysis assumes a credit of $6,900 between 2023-2024, $6000 in 2025-2026 and $5,000 in 20272032.
For the residential sector, a 30 percent credit for electric and natural gas heat pumps, electric and natural gas heat pump water heaters, and biomass stoves and boilers is applied. Also, a 30 percent subsidy on high efficiency natural gas water heaters and central air conditioners is used.
For the residential sector, the analysis applies a 30 percent credit on the following equipment: rooftop solar panels, solar water heaters, wind turbines, geothermal heat pumps, fuel cells, and battery storage. The credit is reduced to 26 percent in 2033 and 22 percent in 2034.
Subsidies on high-efficiency electric residential equipment of 50 percent, including heat pumps, heat pump water heaters, electric stoves and cooktops, and electric heat pump clothes dryer, with a total budget cap of $4.275 billion split over the rebate period.
Appendix B – Modeled
Policy
Carbon Price: Federal Fuel Charge
Canadian Federal Policies
Short Description
The fuel charge is applied to the combustion of fuel types and end uses. It is applied to residential, commercial, and transportation sectors, but international aviation and marine fuel are exempt.
Exemptions - emissions-intensive trade-exposed industries covered by OBPS.
The fuel charge increases from nominal $65/t CO2e in 2023 to $170/t in 2030 at $15/tCO2e/y. After 2030, fuel charge stays at $170/t
Carbon Price: Output Based Pricing System (OBPS)
Incentives for Light-Duty ZEVs and Zero-Emission
Vehicle Infrastructure Program
Incentives for Medium-Duty ZEVs and Heavy-Duty ZEVs
The details vary per province since provinces can implement their own systems, as long as they are as stringent as the federal one. For example, Quebec has a carbon market. The OBPS targets large industrial emitters, as well as electricity generating facilities. The OBPS is modeled as an increasing proportion of industrial emissions that are subject to a carbon price (industrial emitters receive a free allocation of emissions to maintain competitiveness).
Subsidies for LDZEVs and for charging stations and H2 refueling stations based on funding amounts available.
For infrastructure program, a 50 percent investment cost subsidy with a total budget of 680 M 2022 CAD from 2023 to 2028 for Canada is implemented.
For LDZEV a $5000 (nominal) for BEV and FCEV vehicles and a $2500 (nominal) for PHEV vehicles from 2022 to 2025 with a cumulative budget of 3.03 B 2022 CAD for Canada is used.
Subsidies for relevant vehicles based on funding amounts.
Subsidy amounts are: $100,000 (nominal) for BEV and FCEV and $50,000 (nominal) for PHEV from 2022 to 2026, for the heavy-duty freight segment and intercity bus segment in NATEM. Total budget is 572.6 M 2022 CAD for Canada.
Clean Technology Investment Tax Credit
Tax credit of 30 percent from 2023 to 2033, for renewable electricity generation, stationary electricity storage, active solar heating equipment, heat-pumps, CSP, SMRs, off-road ZEV vehicles, charging stations, geothermal heat recovery. The tax credit falls to 15 percent in 2034 and 0 in 2035 and after. (The tax credit does not apply to residential sector technologies.)
Investment in Tax Credit for Clean Hydrogen
Technologies are being assigned exogenously to a CI bucket. This tax credit is applied to hydrogen and ammonia producing technologies. Tax credit
40 percent for a CI of less than 0.75 kgCO2e/kgH2 (applied for electrolyzers and ATR with CCS) between 2023 and 2030, falls linearly to 20 percent in 2034 and to 0 percent in 2035 and after.
Policy
Short Description
25 percent for a CI greater than or equal to 0.75 kg, but less than 2 kgCO2e/kgH2; (applied for SMR with CCS) between 2023 and 2030, falls linearly to 12.5 percent in 2034 and to 0 percent in 2035 and after.
If the CCUS tax credit is higher, it replaces the hydrogen tax credit. The tax credit falls to 0 in 2035.
Investment Tax Credit for CCUS
Tax credit of 37.5 – 60 percent for DAC and CCUS projects, including:
60 percent for DAC between 2022 and 2030, 30 percent between 2031 and 2040, 0 percent from 2041 onwards.
50 percent between 2022 and 2030, 25 percent between 2031 and 2040, 0 percent from 2041 onwards for electricity generating plants with CCS (biomass, coal and natural gas-fired).
50 percent between 2022 and 2030, 25 percent between 2031 and 2040, 0percent from 2041 onwards for industrial technologies with CCS.
37.5 percent between 2022 and 2030, 18.75 percent between 2031 and 2040, 0 percent from 2041 onwards for CO2 pipelines, carbon sequestration and steel slag carbonatation technology.
*Synthetic (e-fuel) fuel production is assumed to be excluded from this ITC
* Biomass gasification + CCS technologies (for hydrogen production) and pyrolysis for biochar are not covered by the H2 ITC or the CCUS ITC
Investment Tax Credit for Clean Electricity
Tax credit added for large hydro and nuclear plants. Other technologies are covered by the Clean Technology tax credit or CCUS Tax credit. Tax credit of 15 percent from 2024 to 2034. The tax credit falls to 0 percent in 2035.
Clean Fuel Regulations (CFR) The CFR assumptions are based on values used in the Regulatory Impact Assessment Statement (RIAS) for the CFR. The policy is applied at national, not provincial, level with Carbon Intensity (CI) reduction at 3.5 g CO2e/MJ in 2023 and reaching 14 g CO2e/MJ in 2030 then staying at 14 g/MJ for subsequent years. The assumed lifecycle CI for ethanol, biodiesel, CNG, LNG, and propane are from the RIAS. CI for hydrogen based on ECCC examples from the lifecycle model, using SMR with 25 percent RNG (this assumption is used as only one CI by type of fuel can be implemented in the current state of the model). The modeling does not include impacts of banked credits or any generation of compliance category 1 credits.
Federal Methane Goals from 2018 (regulations have not been implemented for more recent goals)
Includes: Federal methane regulations (2018) to reduce oil and gas methane emissions from 2012 levels by 45 percent by 2025. Drop is linear from 2021 current value to the 2025 value (constant after 2025).
An Emissions Reduction Fund to invest in green technologies to lower or eliminate methane and other GHG emissions from the oil and gas sector.
Note: Strengthened methane regulations will not be committed in time for the study.
Policy
Short Description
Heat Pump Grants / Funding Oil to Heat Pump Affordability (OHPA) Grant: subsidies to switch from oil heating to heat pumps, of up to $10,000 ECCC Home Heating Oil Transition (HHOT) (announced September 2022). Total 250 million 2022 CAD funding under HHOT
Coal-fired electricity phases out by 2035
Clean Electricity Regulations (pending approval)
Reduction of CO₂ Emissions from Coal-fired Generation of Electricity Regulations. Modeled as no new non-CCS coal-fired electricity starting in 2016 (start year of the model) (instead of July 1, 2015). Existing plants with an end-life after 2030 must retrofit to CCS.
The regulations apply according to the year of construction of the installation. Plants built before 2025 are subject to regulation 25 years after the date of commissioning or as of January 1, 2035, whichever is later. The 'planned' plants, which start construction before the end of 2027 and are commissioned before the end of 2034, can operate without limit until the end of 2049. Plants built on or after 1 January 2025, which are not 'planned', are subject to the regulations as of 1 January 2035. The annual emission limit for each plant is calculated on the basis of the applicable emission intensity, which is 65 t/GWh between 2035 and 2049 and falls to zero from 2052. Offset credits can be used to cover emissions above the annual limit, up to a maximum of 35 t/GWh in 2035-2049 and up to 42 t/GWh from 2052 onwards. The price of the credits aligns with the federal carbon price. Currently, the federal price is assumed to remain constant after 2030 at $170/t.
PROJECTED DATA
Appendix
D – State Progress Towards Clean Energy Targets, as of April 2025
1. Washington
Target: 100 percent clean electricity by 2045
Latest progress: Hydro remains dominant; natural gas ~18 percent of in-state generation (2024). Non-hydro renewables ~10 percent (mostly wind). Hydro + nuclear + other renewables comprise the majority of in-state generation.
Gap/Takeaway: Substantial majority is already clean; remaining challenge is replacing natural gas and ensuring imports are clean by 2045.
Source: EIA State Energy Profile Washington (2023 data)
2. North Carolina
Target: 12 percent clean electricity by 2021
Latest progress: Renewable generation ≈ 15 percent of total in-state generation (2023); solar capacity and generation growing rapidly (Top 4 in U.S. solar capacity).
Latest progress: Renewables 43 percent of total in-state generation in 2024; wind ≈ 67 percent of renewable share.
Gap/Takeaway: Strong momentum; 57 percent of electricity still from non-renewable sources.
Source: EIA State Energy Profile Colorado (2023 data)
11. Texas
Target: 10,000 MW renewable capacity by 2025
Latest progress: Target surpassed years ago; ~42,300 MW wind capacity by end-2024 + large utility-scale solar; renewables ≈ 30 percent of total generation.
Gap/Takeaway: Original 10,000 MW target long exceeded; continuing expansion supports broader clean electricity goals.
Source: EIA State Energy Profile Texas (2023 data); DSIRE
12. Minnesota
Target: 100 percent carbon-free electricity by 2040
Latest progress: Renewables 33 percent of net generation (2023); zero-carbon sources (including nuclear) provide majority.
Gap/Takeaway: Renewables alone at 33 percent; additional clean resources needed for 100 percent target.
Source: EIA State Energy Profile Minnesota (2023 data); Clean Energy Economy Minnesota Factsheet
13. Illinois
Target: 100 percent clean energy by 2050
Latest progress: Renewables 14 percent of in-state generation (2023), more than double vs a decade earlier.
Gap/Takeaway: Significant growth but still below 100 percent target.
Source: EIA State Energy Profile Illinois (2023 data); IPA Clean Energy Dashboard
14. Virginia
Target: 100 percent renewable electricity by 2050
Latest progress: Renewables 12 percent of generation (mostly solar + biomass); solar alone ~7 percent; nuclear adds ~32 percent zero-carbon share.
Source: EIA State Energy Profile Virginia (2023 data)
15. Maryland
Target: 50 percent renewable by 2030
Latest progress: Renewables 13 percent of total generation (2023); solar ~50 percent of renewable share.
Gap/Takeaway: Below RPS trajectory (32.6 percent by 2024, 52.5 percent by 2030).
Source: EIA State Energy Profile Maryland (2023 data); reporting on RPS shortfall PEER
16. Delaware
Target: 40 percent renewable by 2035
Latest progress: Renewables 9 percent of in-state generation in 2024; solar 8 percent.
Gap/Takeaway: Well below 2035 target; significant expansion needed.
Source: EIA State Energy Profile Delaware (2023 data)
17. Connecticut
Target: 45 percent GHG reduction by 2030; net-zero by 2050
Latest progress: Transportation and residential heating emissions fell 2 percent and 5.6 percent (2023); CO₂ rose 1.5 percent due to Millstone nuclear downtime.
Gap/Takeaway: Slightly behind trajectory; may miss 2030 reduction target by ~5 points.
Source: EIA State Energy Profile Connecticut (2023 data); AP News
18. Massachusetts
Target: Significant power-sector decarbonization by 2030
Latest progress: ~50 percent of electricity load supplied by clean energy (2023).
Gap/Takeaway: Further acceleration required to meet 2030 decarbonization target.
Source: EIA State Energy Profile Massachusetts (2023 data); Massachusetts Government 2023 Climate Report Card
19. Vermont
Target: 100 percent renewable electricity by 2035
Latest progress: Nearly 100 percent of in-state electricity from renewables; 57 percent from conventional hydro (2023).
Gap/Takeaway: Alternative compliance payments still necessary; ongoing support for remaining gaps.
Source: EIA State Energy Profile Vermont (2023 data)
20. New Hampshire
Target: 100 percent clean electricity by 2040
Latest progress: Energy efficiency measures installed 889 GWh (enough for 82,354 households); EV registrations 9,247 (~41× increase from 2014).
Gap/Takeaway: Progress positive but slower than other New England states.
Source: EIA State Energy Profile New Hampshire (2023 data); Frontier Group
21. Rhode Island
Target: 100 percent renewable electricity by 2030
Latest progress: Solar ≈ 2/3 of renewable generation, totaling ~13 percent of state electricity (2023). “Revolution Wind” project construction paused.
Gap/Takeaway: Delays may slow progress toward 2030 target.
Source: EIA State Energy Profile Rhode Island (2023 data)
22. Maine
Target: 100 percent clean electricity by 2040; 30 percent petroleum reduction by 2030
Latest progress: Clean electricity sector grew 11 percent, adding 300 jobs (2023). Petroleum still 50 percent of energy consumption.
Gap/Takeaway: High petroleum use may hinder achievement of targets.
Source: EIA State Energy Profile Maine (2023 data); 2023 Main Clean energy Industry Report
Appendix E – Greenhouse Gas Reduction Targets by Region
R4 (West North Central)
R5 (South Atlantic)
R6 (East South Central)
Note: these values are calculated from state-level targets
Appendix F – Clean Electricity Policies
Several states have implemented clean electricity standards and/or renewable portfolio standards (RPS) as well as targets for clean electricity grids. Due to the significant use of gas in the electric power sector, these policies have a high impact on medium-to-long-term gas demand. These standards may favor renewable capacity development over fossil-fuel options to meet new electricity demand, especially in regions with strong renewables potential. However, natural gas with CCS is also considered in terms of policy impact, specifically concerning the 45Q tax credit. State targets for clean energy standard/RPS are identified below:
Washington: 100 percent clean energy by 2045
North Carolina: 12 percent of clean electricity by 2021
New-York: 100 percent carbon-free electricity by 2040
Oregon: 50 percent of renewable electricity by 2040, coal phased out by 2035
California: 100 percent carbon-free electricity by 2045
New Mexico: 100 percent carbon-free electricity by 2045
Nevada: 100 percent carbon-free electricity by 2050
New Jersey: 100 percent carbon-free electricity by 2035
Arizona: 15 percent of renewable electricity by 2025
Colorado: 30 percent of renewable electricity by 2020
Texas: 10,000 megawatts of renewable electricity by 2025
Minnesota: 100 percent carbon-free electricity by 2040
Illinois: 100 percent clean energy by 2050
Virgina: 100 percent renewable electricity by 2050
Maryland: 50 percent of renewable electricity by 2030
Delaware: 28 percent renewable electricity by 2030 and 40 percent renewable electricity by 2035 with a least 10 percent from PV by 2035
New Jersey: 50 percent renewable electricity by 2030
Connecticut: 48 percent of renewable electricity by 2030
Massachusetts: 80 percent of clean electricity by 2050
Vermont: 100 percent of renewable electricity by 2035
New Hampshire: 25.2 percent of renewable electricity by 2025
Rhode Island: 100 percent of clean electricity by 2033
Maine: 80 percent of renewable electricity by 2030 and 100 percent of renewable electricity by 2050
R6 (East South Central)
R7 (West South Central)
R8 (Mountain)
(Pacific)
TX (Texas)
Appendix G – Regulations with Limited Consideration in the Modeling
Regulations relating to permitting were considered for implementation in the model. Typically, the techno-economic optimization approach does not consider the effect of permitting processes. Increasing construction time or costs because of permitting in one sector may lead to an unfair comparison to another sector, where these additional costs have not been considered. Impacts related to permitting should be analyzed outside the model, based on the model results.
Among policies considered but not implemented in the model:
Bureau of Land Management (BLM) pipeline management: This rule mainly relates to permitting, right-of-way and land conservation.
Class VI and Class II primacy permit reform – CO2 and EOR: Primacy means the authority to regulate and enforce Underground Injection Control (UIC) program requirements within a state, territory, or tribal jurisdiction. Four states currently have primacy over class VI wells: Louisiana, North Dakota, Wyoming, and West Virginia. Thirty-two states have primacy for class II wells.
PHMSA – DOT: The cost of compliance with the following PHMSA regulations were not accounted for in the modeling input assumptions. Some regulatory costs may be considered capital costs during a new project, while others may be considered operational costs over the life of the project.
Gas Transmission Rule Part 1 (October 2019)
Gas Transmission Rule Part 2 (August 2022)
Requirement of Valve Installation and Minimum Rupture Detection Standards (a.k.a. “Valve Rule”) (April 2022)
EPA Cross-State Air Pollution (“Good Neighbor” provision)
NATEM covers many GHGs including methane (CH4), nitrous oxide (N20), hydrofluorocarbons (HFCs), perfluorocarbons (PFCs), sulfur hexafluoride (SF6) and nitrogen trifluoride (NF3).
Nitrogen oxides (Nox) targeted by the EPA Good Neighbor Plan, are not part of National Inventory Report GHG definition.
Appendix H – Canadian Policies
Assumed in the Model
The following federal policies are modeled in NATEM-Canada. Provincial policies are also modeled but not detailed here since Canadian results are analyzed at an aggregate level.
Carbon Price: Output-Based Pricing System for big industries
Clean Technology Investment Tax Credit
Investment Tax Credit for Clean Hydrogen
Investment Tax Credit for CCUS
Investment Tax Credit for Clean Electricity
Federal Methane Goals from 2018
Clean Fuel Regulations (CFR)
Incentives for ZEVs and Zero-emission vehicle infrastructure program (chargers)
Heat pump grants/funding
Coal-fired electricity, phases out by 2035
Clean Electricity Regulations
Appendix I – INGAA Foundation Steering Committee
INDUSTR Y
Paul Amato – Iroquois Pipeline Operating Company
Kelly Dunn – TC Energy
Mark Herreth – P-PIC
Craig Meier – Sunland Construction
Russell Morris – Air Products
Aaron Purdy – Kinder Morgan
Susan Waller – Natural Allies for a Clean Energy Future
INGAA AND INGAA FOUNDATION
Amy Andryszak
Joan Dreskin
Michael Istre, Project Manager
Abigail Miller
Hebe Shaw
Chris Smith
Appendix J – Data Center Infrastructure in the U.S., 2025
Appendix K – Existing, Approved but not Built and Proposed LNG Terminals in the U.S. (FERC, as of April 2025)
Existing U.S. LNG Export Terminals
Approved, Not Yet Built U.S. LNG Export Terminals
Proposed U.S. LNG Export Terminals
About the INGAA Foundation
The INGAA Foundation (Foundation) was formed in 1990 by the Interstate Natural Gas Association of America (INGAA) to facilitate the construction and operation of natural gas pipelines for the benefit of the consuming public and the natural gas industry. The Foundation is a not-for-profit 501(c)(6) trade association based in Washington, DC.
The Foundation is uniquely positioned as the forum to convene industry leaders who will develop and deliver safe, affordable, reliable, clean energy solutions into the future through creative problem solving using networking and collaborative efforts, fostering individual and workforce development, and assuring that key industry decision makers are well-informed.
Our Vision:
Develop and deliver safe, affordable, reliable, clean energy solutions for the people of North America and the world.
Our Mission:
Convene industry leaders from natural gas and additional complementary clean energy solutions to identify and address critical matters related to the development, construction, operation, and maintenance of the gas infrastructure value chain through research, engagement, and outreach.
Contact foundation@ingaa.org for more information.