SURFACE FALL 2025
Newsletter
Surface imaging, analysis & metrology news from Digital Surf
Join us!
www.digitalsurf.com
IN THIS ISSUE
YOUR NEW LAB ASSISTANT: AI-POWERED ANALYSIS WITH MOUNTAINS® 11.1
® MOUNTAINS 11.1 9.3 NEW MOUNTAINS®
A smarter, smoother Accelerating surface analysis experience automation... and much more
APPLICATION APPLICATION
European study advances Force spectroscopy: AFM nanometrology Strengthening polylactic acid on silicon nanowires polymers by calcification
WHAT’S FEATURENEW? SPOTLIGHT
With version 11, 3D visualization Welcome to the fascinating reaches a whole new level world of fiber analysis
SURFACE SURFACE METROLOGY METROLOGY Q&A Q&A How should I correctly
measure a surface? What cut-off value should I use?
EVENTS SOCIAL NEWS && SOCIAL
Trade show & product news Events highlights What’s hot online What’s hot online
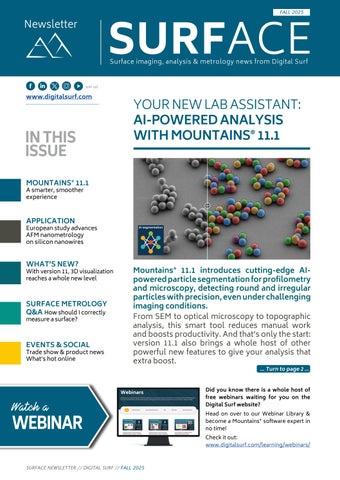
AI segmentation
Mountains® 11.1 introduces cutting-edge AIpowered particle segmentation for profilometry and microscopy, detecting round and irregular particles with precision, even under challenging imaging conditions. From SEM to optical microscopy to topographic analysis, this smart tool reduces manual work and boosts productivity. And that’s only the start: version 11.1 also brings a whole host of other powerful new features to give your analysis that extra boost.
Watch a
WEBINAR SURFACE NEWSLETTER // DIGITAL SURF // FALL 2025
… Turn to page 2 …
Did you know there is a whole host of free webinars waiting for you on the Digital Surf website? Head on over to our Webinar Library & become a Mountains® software expert in no time! Check it out: www.digitalsurf.com/learning/webinars/