Solutions Manual
ISBN: 9781394190324
Chapter1:ThroughputConcepts
1.1 Ashifthas7.5hoursofplannedproductiontime.Theactualproductiontimeinashiftwas 6.8hours.Theshiftexperienced0.15hourofstarvedtime,0.25hourofblockedtime,0.2hour ofequipmentdowntime,and0.1hourofworkdelaytime.CalculatetheoperationalavailabilityandToyota’sformulaavailabilityforthisshift.
Solution:
●
●
1.2 Amanufacturingsystememploys320people.Overoneweek,itutilized13,400laborhours andproduced4800units.Calculatetheproductivityperemployeeandperhourforthisweek.
Solution: ●
1.3 Inoneweek,ashopincurredadirectlaborcostof$100k,materialcostof$150k,equipment costof$45k,utilitycostof$7kandoverheadcostof$13k.Calculatethepercentageofdirect laborcostinthetotalcost.
Solution:
1.4 Anoperationhasaknownthroughputtimeof4.5hoursandathroughputrateof50jobsper hour.CalculatetheaverageWIPlevelforthisoperationinthelongrunbasedonLittle’sLaw.
Solution:
● WIP = TT × TR = 4.5 × 50 = 225(units)
ManufacturingSystemThroughputExcellence:Analysis,Improvement,andDesign,FirstEdition.HermanTang. ©2024JohnWiley&Sons,Inc.Published2024byJohnWiley&Sons,Inc. Companionwebsite:www.wiley.com/go/Tang/ManufacturingSystem
2 ManufacturingSystemThroughputExcellence–Analysis,Improvement,andDesign
1.5 Aproductionlinehaseightworkstationswithcycletimesof58,56,57,60,59,56,55,and59 seconds,respectively.Estimatethelong-runaverageWIPforthisproductionline.
Solution:
● TT = 58 + 56 +
●
● WIP = TT × TR = 0.128 × 60 = 7.7(units)
0.128(hour)
1.6 Ifaprocesshasacycletimeof48seconds,estimatethecorrespondingtheoreticalthroughput rateinJPH.
Solution:
●
1.7 BasedonthedatafromExercise1.1andknownproductionoutputof480units,calculatethe standaloneavailability(Asa )andstandalonethroughputrate(TRsa ).
Solution:
● Asa = Actualproductiontime Plannedproductiontime Starvedtime
● TRgross = 480 6.8 = 70.59 (JPH)
● TRsa
Chapter2:SystemPerformanceMetrics
2.1 Ashophadplannedtoproduce450unitsduringastandardeight-hourshift.However,it endedupproducing451unitsin8.5hours.Calculatetheshop’svolumeattainment(VA)and scheduleattainment(SA)performance.Commentontheresults.
Solution:
● A = Actualproductiontime Plannedproductiontime = 8.5 8 = 106.25%
● VA = Actualproducedunits
2.2 Aplantoperatestwoshifts,sixdaysaweek.Eachshiftis8.5hourslong,inclusiveof ahalf-hourlunchbreakandthree15-minutebreaksfornonproductionactivities.The plantisdesignedtohaveathroughputrateof60unitsperhour.Overtheweek,theplant manufactured4440units,outofwhich90requiredrepairs.Also,therewereeventsleading to12hoursofunplanneddowntime.Calculatetheplant’sspeedperformanceoftheweek.
Solution:
● P(unitbased)= Actualunitsproduced Plannedunitsinuptime = 4440 ((
● DesingCT = 3600 TR = 3600
● ActualCT
● P(cycletimebased)= DesignCT
2.3 Aproductionlineisdesignedtohaveacycletimeof60seconds,butitoperatesat61.2seconds. Estimatethethroughputrateofthisproductionline.Iftheproductionrunsfor7.5hoursper shift,determinethenumberofunitslostashiftduetothespeedperformancerate.
Solution:
● P(cycletimebased)= designCT actualCT = 60 61.2 = 98.04(%)
● LostTR = 60 3600 61.2 = 1.18 (JPH)
● Shiftlost = 1.18 × 7.5 = 8.8(units)
2.4 UsingthedataprovidedinExercise2.2,calculatetheOEEfortheweek.
Solution:
● Q = 4440 90 4440 = 97.97%
●
2.5 Aproductionsystemoperatedfor80hoursacrossfiveworkingdays,withanOEEof85%. CalculateitsTEEP.
Solution:
● TEEP = OEE × U = 85%× 80 5×24 = 56.7%
2.6 Aqualityimprovementprojectcanenhancethequalityratefrom98.0%to98.5%.Itcanalso leadtoa0.1%improvement(92.0–92.1%)inoperationalavailabilityanda0.2%improvement (94.3–94.5%)inthespeedperformance.ComparetheestimatedOEEandcalculatedOEE (refertosubsection2.2.3).
Solution:
● oldOEE1 = A × P × Q = 92% × 94.3% × 98% = 85.02%
● newOEE2 = A × P
● ΔOEE = OEE2 OEE1 = 0.71%
● ΔOEE ≈ΔA +ΔP +ΔQ = 0.1% + 0.2% + 0.5% = 0.8%
2.7 Foranoperation,thesignificanceofthethreeelementsofOEEareassignedvaluesof7,4,and 5,respectively.Overaweek,thesethreeelementsweremeasuredtobe91%,99%,and95%, respectively.CalculatetheoriginalOEEandtheweightedOEEusingthemethodintroduced insubsection2.3.1.2.
Solution:
● OEE = A × P × Q = 85.59%
● w
● OEEw = (AwA ) × (PwP ) × (QwQ ) = 83.58%
2.8 ContinuingfromExercise2.4,assumeastandaloneavailabilityof96%.Whatwouldbethe simplifiedstandaloneOEE?ComparethiswiththeresultsobtainedinExercise2.2.
Solution: ● OEEsa simplified = A
2.9 Ifasystem’sthroughputis0.5JPHlessthanitstarget,andtheunitprofitis$1400,calculate themonetarylossforoneweekofproduction,assuming75workinghours.
Solution:
● 0.5 × 75 × $1400 =− $52,500
3
4 ManufacturingSystemThroughputExcellence–Analysis,Improvement,andDesign
Chapter3:BottleneckIdentificationandBufferAnalysis
3.1 Asystemcomprisesfiveworkstations,eachwithcycletimesof52,55,58,50,and51seconds, respectively.Estimatethethroughputratesofthesystemandidentifywhichworkstation servesasthethroughputbottleneck.
Solution:
● Station3:TR = 3600 CT (seconds) = 3600 58 = 62.07 (JPH) istheslowestworkstation.
3.2 Fourmanufacturingsubsystems,arrangedinseries,haveactiveperiodsaccountingfor95%, 89%,91%,and85%oftheproductiontimeinaweek,respectively.Determinewhichsubsystem actsasthethroughputbottleneck?
Solution:
● Subsystem1,asithasthehighestactivetime.
3.3 Asystemconsistsofsevenoperations.Theirstarvedandblockedtimes(duetovarious reasons)overaweekofproductionarelistedinTable3.3.Usingtheconceptofa“turning point,”identifytheoperationthatisthebottleneckandprovidearationaleforyourchoice.
Table3.3
Operation1234567
Starvedtime(minute)50702040304050
Blockedtime(minute)40305070606050
Solution:
● Operation3,asithasthelowestcombinedstarvedandblockedtime.
3.4 Aconveyor,whichhasatransfertimeofoneminutebetweentwosystemswithacycletime of55seconds,isinoperation.WhatwouldbetherecommendedminimumquantityofWIP unitstosupportsystemthroughput?
Solution:
●
3.5 Asystemthatincludesfoursubsystemsarrangedinseriesoperatesinacontinuousflow. ThefiveconveyorsassociatedwiththesesubsystemsholdWIPunitsof40,65,10,20and32, respectively(refertoFigure3.22).Identifythebottleneckinthesystem’sthroughput.
Solution:
● Subsystem2,asitsupstreamconveyorhasthehighestWIPunits.
3.6 Aconveyor,withacapacityequivalentto15minutesofproductiontimeandtypicallyfilled totwo-thirdsofitscapacity,isinoperation.Determinethedurationforwhichtheconveyor cancompensateforthedowntimeofitsupstreamanddownstreamsystems.
Solution:
● (2/3)Coveruptotenminutesoftheupstreamsystemuntiltheconveyorbecomes empty.
● (1/3)Coverupfiveminutesofthedownstreamsystemuntiltheconveyorbecomesfull.
3.7 Aproductionlinefunctionsatarateof50unitsperminute,andtheWIPchangealarmisset toactivateatthree-fourthsoftheproductionrate.IfthenumberofWIPunitsontheconveyor dropsby120unitswithinthreeminutes,wouldtheWIPchangealarmbetriggered?
Solution:
● Alarm: 3 4 × 50 = 37.5units∕ min
● ΔWIP Δt = 120 3 = 40 (units∕ min ) > 37.5
Chapter4:QualityManagementandThroughput
4.1 Theimplementationofanautomatedin-processinspectionnecessitatesanewinvestment of$40,000,aimedatreducingthecostofinternalfailures.Givenanestimatedweeklycost savingof$1500frominternalfailuresandassumingnootherchangesincosts,calculatethe break-evenpointforthisinvestment.
Solution:
● Break–even = Totalcost Totalgainsorsavings = 40,000 1500 = 26.67 (weeks)
4.2 Animprovementprojectrequiresaninvestmentof$15,000andisprojectedtoyieldacost savingof$3500perquarterduetoimprovedproductqualityoverthenexttwoyears.The company’sminimumacceptablerateofreturn(MARR)issetat14%.Determinewhether thisprojectisworthundertaking.
Solution:
● UsingExcel’srate()function:“=rate(2*4,3500,–15000)”
● Rate = 16.4% > MARR
4.3 Animprovementprojectrequiresaninvestmentof$15,000,andthecompany’sMARRis14%. Calculatetheminimumexpectedcostsavingperquarterfromimprovedproductqualityover twoyears,whichwouldmakethisprojectworthwhile.
Solution:
● UsingExcel’spmt()function:“=pmt(0.14,2*4,–15000)”
● Saving = $3.33.55
4.4 Amanufacturingsystemconsistsofeightworkstationsinseries,withTPYvaluesof0.99, 0.98,0.95,0.97,0.98,0.95,0.98,and0.99,respectively.CalculatetheRTYoftheentiresystem.
Solution:
● RTY = 0.99 × 0.98 × 0.95 × 0.97 × 0.98 × 0.95 × 0.98 × 0.99 = 0.808
4.5 Asystemcomprisesthreeparallel,identicalsubsystems,eachwithmeanvaluesofaquality attributeof15.2,14.5,and13.7,respectively.Estimatethemeanvalueofthisqualityattribute forthecombinedproductsfromallsubsystems.
Solution:
● �� = 15.2+14.5+13.7 3 = 14.47
4.6 Asystemcomprisestwoparallel,identicalsubsystems,eachwithsimilarmeanvaluesfor aqualityattributebutdifferentvariations.Thestandarddeviationsforthisattributeare5.5 and7.3forthetwosubsystems,respectively.Estimatethestandarddeviationvalueofthis qualityattributeforthecombinedproductsfrombothsubsystems.
Chapter5:MaintenanceManagementandThroughput
5.1 Arobothasafailureprobabilityof0.0002perhour.Calculateitsreliabilityforeighthours ofwork.Ifthefailureprobabilityisreducedto0.0001perhour,whatwouldbetheimproved reliabilityovereightworkhours?
Solution:
● UsingExcel’sexp()function.
● = exp( 0.0002*8) = 99.84%
● = exp( 0.0001*8) = 99.92%
5.2 Overathree-monthproductionperiod,thefourmostfrequentfailuremodes(A,B,C,andD) occurred10,13,9,and8times,respectively.Theaveragedowntimeforthesemodeswas 8,3,12,and7minutes,respectively.Iftheconsequenceratingisconsideredthesameforall modes,whichfailuremodeshouldbeprioritizedformaintenance?
Solution:
● Failure C hasthehighestseverity,as S3 = F 3 × D3 × C3 = 108
5.3 Anassemblylineencountered92failuresoverathree-monthproductionperiod,amounting to900workinghours.DeterminetheMTBFforthisline.
Solution:
●
5.4 Themaintenancedepartmentspent1050minutesrectifying92failuresonanassemblyline overathree-monthperiod.WhatistheMTTRforthisline?
Solution:
5.5 IftheMTBFofaproductionlineis15.5hoursforagivenperiod,whatwouldbethecorrespondingfailurerate?
Solution: ● �� = Numberoffailures
5.6 IftheMTBFandMTTRofaproductionlineare15.5and0.25hours,respectively,foragiven period,calculatetheavailabilityofthisproductionline.
Solution:
5.7 Duringamonth’sproduction,unplannedmaintenancefordowntimeaccountedfor125out ofthetotal600maintenancehours.WhatwouldbethePMPandtheunscheduleddowntime ratio?
Solution:
5.8
Amaintenancedepartmentincurredexpensesof$85kand$100konvariousmaintenance tasksovertwoconsecutivemonths.Theestimatedcostsforthroughputandqualityforthese twomonthswere$250kand$230k,respectively.Calculatethetotalmaintenancecostfor thesetwomonths.
Solution:
● $50 + $250 = $335(k)
● $100 + $230 = $330(k)
5.9 AmaintenancedepartmentadherestothethreeelementsofOEEtoguideitsmaintenance activities.Duringashift,threefundamentalissuesarereported,aslistedTable5.10.Due toresourceconstraints,themaintenancedepartmentcanimmediatelyaddressonlytwoof theseissues.Whichtwoshouldbeprioritizedforimmediateattention?(refertoTable5.8 fortheratings)
Table5.10
Issue APQ
1Downtime = 4minutesSlowby0.6minuteNone
2NoneSlowby2.5minutesDefect = 1.9%
3Downtime = 8minutesNoneDefect = 0.3%
Chapter6:ThroughputEnhancementMethodology
6.1 TheTRdataforamonthexhibitsastandarddeviationof2.7andameanof56.Calculatethe coefficientofvariation(CV)forthisdata.
Solution:
● CV = Standarddeviation Mean = 2.7 56 = 4.82%
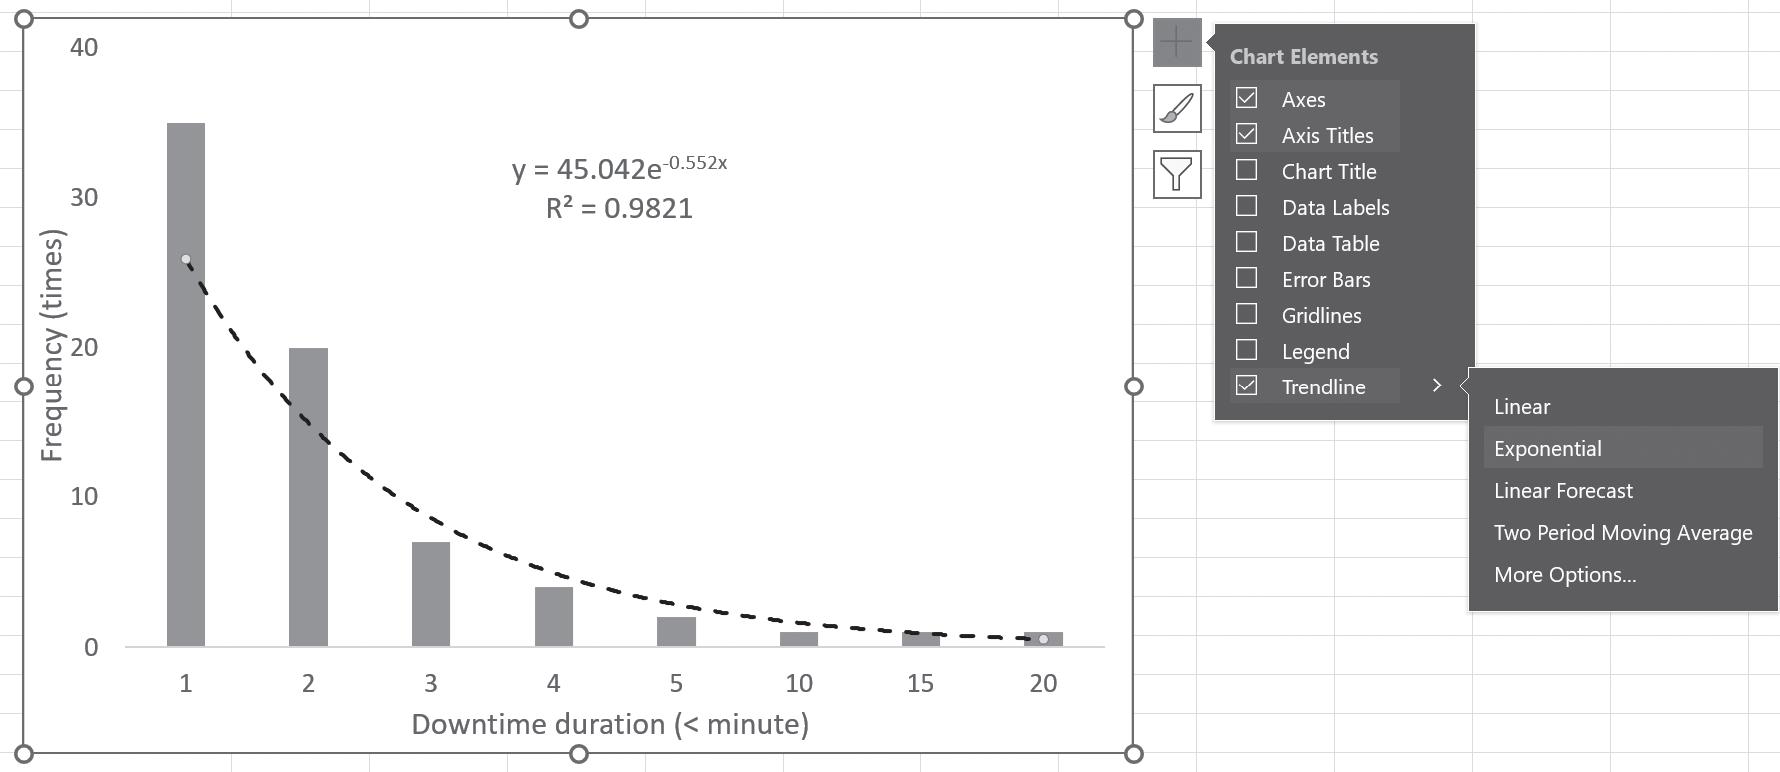
6.2 Thetable(Table6.6)liststhedowntimedurationsandcorrespondingfrequenciesofasystem foroneweek.UtilizeMSExcelorsimilarsoftwaretoperformdatacurvefittingandanalyze theoverallcharacteristicsofthesystem.
Table6.6
Downtime(<minute)12345101520 Frequency(times)3520742111
8 ManufacturingSystemThroughputExcellence–Analysis,Improvement,andDesign
Solution:
● UsingExcel’strendlinefunction:
6.3 Aserialproductionlineconsistsoffiveworkstations,eachwithcycletimesof55,58,54,57, and52seconds,respectively.Estimatethecycletimeforthisline.
Solution:
● CTserial ≈ Max{CTop.1 ,CTop.2 , CT op.n } = Max{55,58,54,57,52} = 58(seconds)
6.4 Aparallelmanufacturingsystemcomprisesthreeidenticallegs,eachwithanequalproductionvolume.Thecycletimesforthesethreelegsare85,88,and87seconds,respectively. Determinethecycletimeforthissystem.
Solution:
● CTparallel ≈ Average{CTseg.1 ,CTseg.2 , ,CTseg n } n =
6.5 Threeimprovementprojectproposalshavebeenrated(withoutweights)asshowninTable 6.7.Basedonthethreefactors,determinewhichproposalshouldbeprioritizedforsupport. Providearationaleforyourchoice.
Table6.7
Proposal(1)Benefits(2)Technology(3)Resources A342
B3.53.53 C42.53.5
Solution:
● ProposalBhasthehighestprioritywithanoverallscoreof36.75.
6.6 Aninternalsurveywasconductedtoassessthelevelsofimportanceandagreementforvariousimprovementtasks,aslistedinTable6.8.Basedonthesurveyresults,identifythetop threetasksthatshouldbeprioritized.
Solution:
● Thetopthreetasksare6,1,and4withgapsof0.9,0.8,and0.6,respectively.
Chapter7:AnalysisandDesignforOperationalAvailability
7.1 Amanufacturingsystemhassevenworkstationsinserieswithreliabilityvaluesof0.98,0.95, 0.97,0.98,0.95,0.98,and0.98,respectively.Calculatethetheoreticalreliabilityofthesystem.
Solution:
●
7.2 Amanufacturingsystemhastwoparallelsubsystems,eachwithfiveworkstationswitha reliabilityof0.98.Determinethesystem’sreliabilitywhenoperatingatfullcapacity(both subsystemsworking)andathalfcapacity(onlyonesubsystemworking).
Solution:
● RA = RB = 0.985 = 90.4%
● R1 = RA × RB = 81.7%atfullcapacity
● R2 = RA × (1 RB ) + (1 RA ) × RB = 17.4%athalfcapacity
7.3 Amanufacturingsystemcomprisestwoparallelsubsystemsandoneserialsubsystem,each withfiveworkstations,asshowninFigure7.30.Theworkstationreliabilityvaluesintheparallelsubsystems A and B are0.97,andthoseintheserialsubsystem C are0.98.Allsubsystems havefiveworkstations.Calculatethesystem’sreliabilitywhenoperatingatfullcapacity(all subsystemsworking)andathalfcapacity(oneparallelsubsystemworkingwiththeserial subsystem).(RefertoTable7.6foraparallelsystemanalysis.)
Figure7.30
Solution:
● RA = RB = 0.975 = 85.9%
ManufacturingSystemThroughputExcellence–Analysis,Improvement,andDesign
● RC = 0.985 = 90.4%
● R1 = RA × RB × RC = 66.7%atfullcapacity
● R2 = (RA × (1 RB ) + (1 RA ) × RB ) × RC = 21.9%athalfcapacity
7.4 Amanufacturingsystemhassevenworkstationsinserieswithreliabilityvaluesof0.98,0.96, 0.97,0.98,0.95,0.98,and0.99,respectively.Identifytheworkstationmostcriticaltosystem throughputinproduction.
Solution:
● Rsystem = 0.98 × 0.96 × 0.97 × 0.98 × 0.95 × 0.98 × 0.99 = 82.4%
● I5 = Rsys R5 = 82.4% 95% = 0.868
● Station5hasthehighestrelativeimportance.
7.5 Aprocesshasareliabilityof85%andagrossTRof80JPH.Ifaslowmanualbackupwitha TRof60JPHcanbedesignedfortheprocesstoimproveitsreliability,whatistheTRofthe processwithbackupoveranextendedperiod?WhatistheTRifthemanualbackisonly80% reliable?
Solution:
● TRwbackup = TRgross × R + TRbackup × (1 R) = 80 × 85% + 60 × (1 0.85) = 77.0(JPH)
● TRwbackup = TRgross × R + TRbackup × (1 R) × Rbackup = 80 × 85% + 60 × (1 0.85) × 80% = 75.2(JPH)
7.6 Aprocesshasareliabilityof0.85.Toimproveitsreliability,anidenticalprocessisdesignedas anautomatedbackupwithaswitchreliabilityof0.97andintegratedintotheoperation.What istheimprovedreliabilityoftheoperation?
Solution:
● Rimproved = R + [(1 R) × Rbackup × Rswitch ] = 0.85 + (1 0.85) × 0.85 × 0.97 = 97.4%
Chapter8:SystemDesignforThroughputAssurance
8.1 Twolines,linkedinserieswithnobufferbetweenthem,haveindividualthroughputrates of55and56JPHandoperationalavailabilitiesof92%and90%,respectively.Estimatethe throughputcapacityattheendofthesecondline.
Solution:
● TR = Min{TR1 × A1 ,TR2 × A2 } = Min{55 × 0.92,56 × 0.90} = 50.4(JPH)
8.2 TwosystemshaveTRsof55and56JPHandoperationalavailabilitiesof92%and90%,respectively.Abufferbetweenthemhasimpactfactors B1 = 1.037and B2 = 1.045.Estimatethe throughputcapacityattheendofthesecondsystem.
Solution:
● TR = Min{TR1 × A1 × B1 ,TR2 × A2 × B2 } = Min{55 × 0.92 × 1.037,56 × 0.90 × 10.45} = 52.47(JPH)
8.3 AmanufacturinglinehassevenworkstationswithadesignCTof50seconds.ThedesignCT foreachworkstationis45,42,47,50,38,40,and43seconds,respectively.Calculatetherange ofworkloadsforallworkstations.
ManufacturingSystemThroughputExcellence–Analysis,Improvement,andDesign 11
Solution:
● Range = Max{45,42,47,50,38,40,43}–Min{45,42,47,50,38,40,43} = 12(seconds)
● Range = Max{90.0%,84.0%,94.0%,100.0%,76.0%,80.0%,86.0%}–Min{90.0%,84.0%,94.0%, 100.0%,76.0%,80.0%,86.0%} = 24(percentagepoints)
8.4 AmanufacturingsystemhassixworkstationswitharequirednetTRof60JPH.Thedesign resultsarethegrossTRandavailabilityforeachoperation,listedinTable8.6.ChecktheprojectednetTRforeachworkstationanddetermineifthesystemdesignmeetsitsthroughput requirement.WhatisthenetTRrangeacrossalloperations?
Table8.6
Workstation123456
DesigngrossTR616564656662 Availability(%)999295939698
Solution:
● NetTR:60.39,59.80,60.80,60.45,63.36,and60.76forthesixworkstations,respectively.
● AsnetTR2 = 59.80 < 60(JPH),thedesigndoesnotmeettherequirement.
8.5
Theindividualavailability(reliability)valuesofworkstationsinaproductionlinearelisted Table8.7.IfthenetTRisrequiredtobeatleast80JPH,whatisthemaximumpermissible CTforeachworkstation?(Hint:calculaterequiredgrossTR,thenCT)
Table8.7
Workstation12345678
Reliability(%)9498979496959994
Solution:
● Using:grossTR = netTR A
● Using:CT = 3600 grossTR
Workstation12345678
GrossTR85.1181.6382.4785.1183.3384.2180.8185.11 MaxCTallowed42.344.143.742.343.242.844.642.3
8.6 AmanufacturingsystemhassixworkstationswithdifferentOEEcapabilities,listedinTable 8.8.ThedesignobjectiveforthesystemisanetTRofatleast60JPH.Toachieveagood balanceforthethroughputperformance,calculatethedesignCTforeachoperation.
12 ManufacturingSystemThroughputExcellence–Analysis,Improvement,andDesign
Table8.8
Workstation123456 OEE(%)938890899291
Solution:
● Using:grossTR = netTR OEE
● Using:CT = 3600 GrossTR
Workstation123456
GrossTR64.5268.1866.6767.4265.2265.93 TargetCT55.852.854.053.455.254.6