HEAV
M etro Phoenix
ECONOMIC SNAPSHOT
2016
COVER HOME REPRESENTED BY PAIGE HEAVEY: HOW DO I COMPARE?
Sold in 15 days at 99.5% of List Price! Paige Heavey Group
Paige Heavey Group Real Estate Dashboard Real Estate Dashboard
602.770.3311
www.paigeheaveygroup.com
1/1/2015 - 12/31/2015 as compared to the market (ARMLS) Source: Local MLS Data. Due to MLS reporting methods and allowable reporting policy, this data is only informational
1/1/2015 - 12/31/2015 as compared to the market (ARMLS)
and may not be completely accurate. Therefore, Coldwell Banker does not guarantee the data accuracy. Data maintained by the MLS's may not reflect all real estate activity in the market.
Sales Price vs. List Price (SP/LP) A HIGH SALES PRICE TO LIST PRICE RATIO The higher the SP/LP, the more money on average that my sellers make on their home
97.66
Paige Heavey
% %
96.0
SP/LP: Maricopa County
56 DAYS
Paige@PaigeHeaveyGroup.com Real Estate Assoc. Broker Coldwell Banker Residential Brokerage
Market Total: Maricopa County
602.770.3311
49 DAYS
50 40 30 20 10 0
Honored to be recognized in the Top 2% Statewide, Top 6% Worldwide
Biltmore | Paradise Valley Office 3113 E Lincoln Drive Phoenix, AZ 85016
39 Homes Sold
Days on Market (DOM)
Closed Sales
LOW DAYS ON MARKET
HIGH CLOSED PROPERTIES
The lower the DOM, the faster on average that my client's' homes sell. Statistics often show the lower the DOM, the higher the sales to list price ratio.
The higher the closed sales, the more clients the Paige Heavey Group helped sell their home. This shows a proven record of delivering for our sellers, significantly above the market average
©
2016 Coldwell Banker Real Estate LLC. All Rights Reserved. Coldwell Banker Real Estate LLC fully supports the principles of the Fair Housing Act and the Equal Opportunity Act. Each Coldwell Banker Residential Brokerage office is owned by a subsidiary of NRT LLC. Real estate agents affiliated with
Coldwell Banker Residential independent contractor sales associates and are not employees of Coldwell Brokerage Source: Local MLSBrokerage Data.areDue to MLS reporting methods this data is Banker onlyResidential informational. Data maintained by the MLSs may not reflect all real estate activity in the market. ©2016 Coldwell Banker Real Estate LLC. All Rights Reserved. Coldwell Banker Real Estate LLC fully supports the principles of the Fair Housing Act and the Equal Opportunity Act.
PaigeHeaveyGroup.com If your home is currently listed, this is not a solicitation for that listing.
Produced by Desert Lifestyle Publishing • 480.460.0996 • www.DesertLifestyle.net
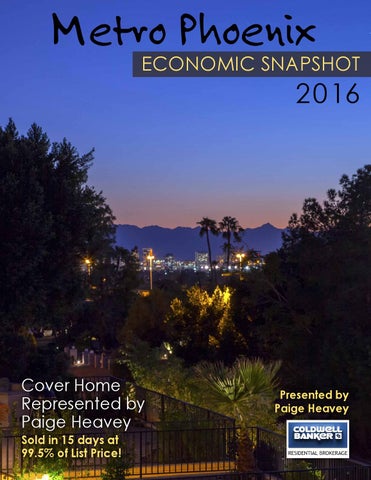
Cover Home Represented by Paige Heavey Sold in 15 days at 99.5% of List Price!
Presented by Paige Heavey
2016 Outlook Brightest Since 2007
Economic Update By Elliott Pollack | Elliott D. Pollack & Co.
L
et’s start with the good news. The year 2016 will be the best year that the Greater Phoenix economy has had since 2007 and will feel a bit better because we are on the upswing. In 2007, the economy was slowing. In 2016, it should be improving. For some slightly less good news, it has become evident that the slower rate of growth we have experienced in this recovery has become our new reality at least for the foreseeable future. This is especially true in Arizona where we have been so affected by the slowdown in population flows. The number of people who have moved from abroad, between states and between counties is down 26% from the early 2000s. In addition, Arizona’s capture rate of those who move is also down. The result has been a rate of population growth that is about half of what has been the historic norm for this point in the cycle. Part of the reason for the slowdown in population is our employment outlook. The unemployment rate, while low, is higher than what was normal for this point in the cycle. And the number of jobs being created is also lower. We are not getting the normal movement of people who are chasing jobs. When those people show up, they bring with them their own demand for goods and services that creates even more jobs and, thus, more population flows. Also, slower population flows have lengthened the time it has taken to absorb excess housing and commercial space that was built in the 2005-2007 time period. That being said, given our post-2007 reality, the state, and especially Greater Phoenix, are doing well.
The state was ranked 12th in terms of employment growth as of November. Greater Phoenix employment should grow by close to 2.9% in 2015 and 3.1% in 2016. Those are the best growth rates of this cycle. Jobs in leisure and hospitality, financial activities, education and health services, and professional and business services lead the way. A big positive has been the strong comeback in the housing market. Single family permits in Greater Phoenix increased by close to 50% in 2015 and should be up another 20% to 25% in 2016. The apartment market is strong and has the best demographics perhaps ever. The office market is improving and is about two years away from a boom. Industrial is also improving. Retail is still lagging. Thus, construction markets should do well in 2016 and 2017. This is important. The lack of a meaningful recovery in construction employment has been a major factor in slower overall employment growth. And while homebuilders are already complaining of shortages in skilled construction trades, higher wages will take care of that. 2016 should be a good year for the economy overall and construction in particular. Jobs should be up by over 3% in Greater Phoenix. The unemployment rate should continue to decline. Population flows will be up, but not by much. Housing should continue its rapid recovery. And retail sales, especially auto sales, should be up. Given the new reality, it’s a good picture.
Greater Phoenix Economic Forecast POPULATION >
Residential Real Estate
S
everal of the housing markets in the US have now surpassed their pricing at the height of the boom in 2006 or 2007. These include Boston, Dallas, Denver, Portland and San Francisco. The housing market in Greater Phoenix has completed its return to normal, but is still a long way below the peak pricing that was reached in 2006. This is because we had a fully-fledged speculative bubble in Phoenix, like Las Vegas, Miami and Tampa, where prices reached very unrealistic levels before collapsing. Most of the cities that have surpassed their former peaks had relatively modest price rises and falls, so it was easier for them to recover. The exception is San Francisco which has been fueled by the success of the technology industries and a complete lack of new buildable land. For Phoenix, there is really no reason to expect us to get back to 2006 levels in the medium term. However, at the start of 2016 the Greater Phoenix housing market is in a healthy state and is likely to see appreciation rates well in excess of inflation, except for a few isolated segments. Mind you, inflation is tame these days, well under 1%, so this is not a very difficult target.
• The annual median sales price gained 9% from $192,500 to $209,000
SALES PRICE PER SQUARE FOOT Greater Phoenix • ARMLS Residential
The luxury market had an excellent first half of 2015 but lost momentum in August. The price range between $500,000 and $1,000,000 is still doing reasonably well, with very modest appreciation. Above $1,000,000 demand has dropped since the stock market started looking uncertain in mid 2015. There is also a slight excess of supply, so prices are falling gently in several areas, especially at the top end and in the most remote locations. There is still a strong market for new or newly rebuilt custom homes in this price range, but older homes are suffering from too much competition and too few potential buyers. Investors with the stomach for million dollar rehab projects are few and far between, so homes in need of modernization “...At the start of 2016 the can stay on the Greater Phoenix housing market for a long time unless priced market is in a healthy state...” aggressively.
[
RETAIL SALES >
Source: Elliott D. Pollack & Co., December 2015
SALES PER MONTH Greater Phoenix • ARMLS Residential • Measured Monthly
• The annual average sales price increased 5% from $249,870 to $262,873
3.1% increase in 2016 3.3% increase in 2017
20% increase in 2016 10% increase in 2017
Between $250,000 and $500,000, supply is lower than normal but it is being replenished by new home builders, the majority of whom are focused on this target price range. New single family home permits in Maricopa and Pinal Counties exceeded 16,000 in 2016 having fallen below 12,000 in 2014. Demand remains normal and healthy and appreciation has typically been in the range 2% to 5% for this price segment. There are occasional problems for homes that have been neglected or in need of modernization. Most normal buyers seem to have little patience for renovation projects these days. There are plenty of active fix and flip investors, but sellers need to allow for the fact that these investors are not looking to pay market price for your home.
• The annual average price per sq. ft. rose by 5% from $128.13 to $133.97
EMPLOYMENT >
SINGLE FAMILY PERMITS >
strongly as the locations inside the freeway loops.
For the overall market across Greater Phoenix, as of January 2016, the annual numbers based on ARMLS sales were as follows, compared with January 2015:
1.8% increase in 2016 1.9% increase in 2017
5.0% increase in 2016 5.0% increase in 2017
By Michael Orr | Director of Real Estate Studies at ASU & Principal of The Cromford Report
These are consistent with a healthy market, but the situation varies a lot depending on price range and the location and age of the home. Let us look at each of these factors. The price range below $250,000 is chronically short of supply and the number of buyers is far in excess of the unusually low number of homes for sale. Not surprisingly, appreciation has been strongest for these entry-level homes and condition is rarely a constraint. Location can be an issue – the outer reaches of the valley are not attracting buyers as
In summary, the overall Greater Phoenix housing market is healthier now than it was 12 months ago and the prospect of gradually rising mortgage interest rates is unlikely to have a serious negative effect. The questions still unanswered are whether more of the millennial generation will choose to buy rather than rent in 2016, and whether lenders will relax their underwriting guidelines to people with good but not great credit. One or both of these could possibly lead to an uptick in demand in the low to medium price ranges. This could transform a healthy market into a hectic one.
2016 Outlook Brightest Since 2007
Economic Update By Elliott Pollack | Elliott D. Pollack & Co.
L
et’s start with the good news. The year 2016 will be the best year that the Greater Phoenix economy has had since 2007 and will feel a bit better because we are on the upswing. In 2007, the economy was slowing. In 2016, it should be improving. For some slightly less good news, it has become evident that the slower rate of growth we have experienced in this recovery has become our new reality at least for the foreseeable future. This is especially true in Arizona where we have been so affected by the slowdown in population flows. The number of people who have moved from abroad, between states and between counties is down 26% from the early 2000s. In addition, Arizona’s capture rate of those who move is also down. The result has been a rate of population growth that is about half of what has been the historic norm for this point in the cycle. Part of the reason for the slowdown in population is our employment outlook. The unemployment rate, while low, is higher than what was normal for this point in the cycle. And the number of jobs being created is also lower. We are not getting the normal movement of people who are chasing jobs. When those people show up, they bring with them their own demand for goods and services that creates even more jobs and, thus, more population flows. Also, slower population flows have lengthened the time it has taken to absorb excess housing and commercial space that was built in the 2005-2007 time period. That being said, given our post-2007 reality, the state, and especially Greater Phoenix, are doing well.
The state was ranked 12th in terms of employment growth as of November. Greater Phoenix employment should grow by close to 2.9% in 2015 and 3.1% in 2016. Those are the best growth rates of this cycle. Jobs in leisure and hospitality, financial activities, education and health services, and professional and business services lead the way. A big positive has been the strong comeback in the housing market. Single family permits in Greater Phoenix increased by close to 50% in 2015 and should be up another 20% to 25% in 2016. The apartment market is strong and has the best demographics perhaps ever. The office market is improving and is about two years away from a boom. Industrial is also improving. Retail is still lagging. Thus, construction markets should do well in 2016 and 2017. This is important. The lack of a meaningful recovery in construction employment has been a major factor in slower overall employment growth. And while homebuilders are already complaining of shortages in skilled construction trades, higher wages will take care of that. 2016 should be a good year for the economy overall and construction in particular. Jobs should be up by over 3% in Greater Phoenix. The unemployment rate should continue to decline. Population flows will be up, but not by much. Housing should continue its rapid recovery. And retail sales, especially auto sales, should be up. Given the new reality, it’s a good picture.
Greater Phoenix Economic Forecast POPULATION >
Residential Real Estate
S
everal of the housing markets in the US have now surpassed their pricing at the height of the boom in 2006 or 2007. These include Boston, Dallas, Denver, Portland and San Francisco. The housing market in Greater Phoenix has completed its return to normal, but is still a long way below the peak pricing that was reached in 2006. This is because we had a fully-fledged speculative bubble in Phoenix, like Las Vegas, Miami and Tampa, where prices reached very unrealistic levels before collapsing. Most of the cities that have surpassed their former peaks had relatively modest price rises and falls, so it was easier for them to recover. The exception is San Francisco which has been fueled by the success of the technology industries and a complete lack of new buildable land. For Phoenix, there is really no reason to expect us to get back to 2006 levels in the medium term. However, at the start of 2016 the Greater Phoenix housing market is in a healthy state and is likely to see appreciation rates well in excess of inflation, except for a few isolated segments. Mind you, inflation is tame these days, well under 1%, so this is not a very difficult target.
• The annual median sales price gained 9% from $192,500 to $209,000
SALES PRICE PER SQUARE FOOT Greater Phoenix • ARMLS Residential
The luxury market had an excellent first half of 2015 but lost momentum in August. The price range between $500,000 and $1,000,000 is still doing reasonably well, with very modest appreciation. Above $1,000,000 demand has dropped since the stock market started looking uncertain in mid 2015. There is also a slight excess of supply, so prices are falling gently in several areas, especially at the top end and in the most remote locations. There is still a strong market for new or newly rebuilt custom homes in this price range, but older homes are suffering from too much competition and too few potential buyers. Investors with the stomach for million dollar rehab projects are few and far between, so homes in need of modernization “...At the start of 2016 the can stay on the Greater Phoenix housing market for a long time unless priced market is in a healthy state...” aggressively.
[
RETAIL SALES >
Source: Elliott D. Pollack & Co., December 2015
SALES PER MONTH Greater Phoenix • ARMLS Residential • Measured Monthly
• The annual average sales price increased 5% from $249,870 to $262,873
3.1% increase in 2016 3.3% increase in 2017
20% increase in 2016 10% increase in 2017
Between $250,000 and $500,000, supply is lower than normal but it is being replenished by new home builders, the majority of whom are focused on this target price range. New single family home permits in Maricopa and Pinal Counties exceeded 16,000 in 2016 having fallen below 12,000 in 2014. Demand remains normal and healthy and appreciation has typically been in the range 2% to 5% for this price segment. There are occasional problems for homes that have been neglected or in need of modernization. Most normal buyers seem to have little patience for renovation projects these days. There are plenty of active fix and flip investors, but sellers need to allow for the fact that these investors are not looking to pay market price for your home.
• The annual average price per sq. ft. rose by 5% from $128.13 to $133.97
EMPLOYMENT >
SINGLE FAMILY PERMITS >
strongly as the locations inside the freeway loops.
For the overall market across Greater Phoenix, as of January 2016, the annual numbers based on ARMLS sales were as follows, compared with January 2015:
1.8% increase in 2016 1.9% increase in 2017
5.0% increase in 2016 5.0% increase in 2017
By Michael Orr | Director of Real Estate Studies at ASU & Principal of The Cromford Report
These are consistent with a healthy market, but the situation varies a lot depending on price range and the location and age of the home. Let us look at each of these factors. The price range below $250,000 is chronically short of supply and the number of buyers is far in excess of the unusually low number of homes for sale. Not surprisingly, appreciation has been strongest for these entry-level homes and condition is rarely a constraint. Location can be an issue – the outer reaches of the valley are not attracting buyers as
In summary, the overall Greater Phoenix housing market is healthier now than it was 12 months ago and the prospect of gradually rising mortgage interest rates is unlikely to have a serious negative effect. The questions still unanswered are whether more of the millennial generation will choose to buy rather than rent in 2016, and whether lenders will relax their underwriting guidelines to people with good but not great credit. One or both of these could possibly lead to an uptick in demand in the low to medium price ranges. This could transform a healthy market into a hectic one.
HEAV
M etro Phoenix
ECONOMIC SNAPSHOT
2016
COVER HOME REPRESENTED BY PAIGE HEAVEY: HOW DO I COMPARE?
Sold in 15 days at 99.5% of List Price! Paige Heavey Group
Paige Heavey Group Real Estate Dashboard Real Estate Dashboard
602.770.3311
www.paigeheaveygroup.com
1/1/2015 - 12/31/2015 as compared to the market (ARMLS) Source: Local MLS Data. Due to MLS reporting methods and allowable reporting policy, this data is only informational
1/1/2015 - 12/31/2015 as compared to the market (ARMLS)
and may not be completely accurate. Therefore, Coldwell Banker does not guarantee the data accuracy. Data maintained by the MLS's may not reflect all real estate activity in the market.
Sales Price vs. List Price (SP/LP) A HIGH SALES PRICE TO LIST PRICE RATIO The higher the SP/LP, the more money on average that my sellers make on their home
97.66
Paige Heavey
% %
96.0
SP/LP: Maricopa County
56 DAYS
Paige@PaigeHeaveyGroup.com Real Estate Assoc. Broker Coldwell Banker Residential Brokerage
Market Total: Maricopa County
602.770.3311
49 DAYS
50 40 30 20 10 0
Honored to be recognized in the Top 2% Statewide, Top 6% Worldwide
Biltmore | Paradise Valley Office 3113 E Lincoln Drive Phoenix, AZ 85016
39 Homes Sold
Days on Market (DOM)
Closed Sales
LOW DAYS ON MARKET
HIGH CLOSED PROPERTIES
The lower the DOM, the faster on average that my client's' homes sell. Statistics often show the lower the DOM, the higher the sales to list price ratio.
The higher the closed sales, the more clients the Paige Heavey Group helped sell their home. This shows a proven record of delivering for our sellers, significantly above the market average
©
2016 Coldwell Banker Real Estate LLC. All Rights Reserved. Coldwell Banker Real Estate LLC fully supports the principles of the Fair Housing Act and the Equal Opportunity Act. Each Coldwell Banker Residential Brokerage office is owned by a subsidiary of NRT LLC. Real estate agents affiliated with
Coldwell Banker Residential independent contractor sales associates and are not employees of Coldwell Brokerage Source: Local MLSBrokerage Data.areDue to MLS reporting methods this data is Banker onlyResidential informational. Data maintained by the MLSs may not reflect all real estate activity in the market. ©2016 Coldwell Banker Real Estate LLC. All Rights Reserved. Coldwell Banker Real Estate LLC fully supports the principles of the Fair Housing Act and the Equal Opportunity Act.
PaigeHeaveyGroup.com If your home is currently listed, this is not a solicitation for that listing.
Produced by Desert Lifestyle Publishing • 480.460.0996 • www.DesertLifestyle.net
Cover Home Represented by Paige Heavey Sold in 15 days at 99.5% of List Price!
Presented by Paige Heavey