X
•
2 0
ENIX O H P • • 20 2 IX
6
M
ET
PHOEN O R I
26
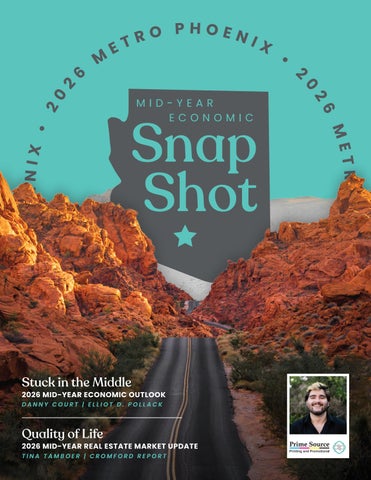
MID-YEAR ECONOMIC
ME
Snap Shot
TRO PH
METRO
O
2026 MID-YEAR REAL ESTATE MARKET UPDATE TINA TAMBOER | CROMFORD REPORT
25
PH
E
Quality of Life
20
DANNY COURT | ELLIOT D. POLLACK
•
N
O E N
2026 MID-YEAR ECONOMIC OUTLOOK
IX
Stuck in the Middle
Stuck in the Middle
2026 MID-YEAR ECONOMIC OUTLOOK By: Danny Court with Elliot D. Pollack & Company
When we published our outlook in January, we were searching for stability. Six months later, we are still searching. The first half of 2026 pulled the economy in two directions at once, with inflation reaccelerating and the labor market is now showing signs of cooling, leaving the Federal Reserve, and the rest of us, without an easy path forward. The clearest story of the year is inflation moving the wrong way. Consumer prices rose 4.2% over the twelve months through May, the fastest pace since 2023 and up from 2.6% at the end of last year. The Fed’s preferred gauge, the PCE index, tells the same story at 4.1%. The increase trace to both tariffs finally working their way into consumer prices, an effect economists long warned about that has now arrived, and geopolitical conflicts affecting the oil supply chain. At the same time, the job market downshifted. Employers added just 57,000 jobs in June, less than half of what forecasters expected and the weakest month since February, after averaging closer to 164,000 per month from March through May. The unemployment rate has held near 4.2%, still low by
any standard, but the momentum has clearly faded. Cautious households are showing up in the data as well, with credit card balances falling in May for the first time in months. This combination, rising prices alongside a softening labor market, is the most difficult situation the Fed can face. Cutting rates would risk fueling inflation, while raising them would risk deepening the slowdown. So the Fed has stood still, holding its target for all of 2026, and the minutes of its June meeting revealed a committee split right down the middle over what comes next. We expect the Fed to hold through the rest of the year, and if it moves at all, we believe a hike is more likely than a cut. In Arizona, growth has slowed but the long-term story remains intact. Job gains have been modest and homebuilding has pulled back under the weight of mortgage rates near 6.5%. Even so, the state continues to attract residents and high-wage employers, and in-migration remains the engine of our economy. We expect a soft second half, followed by gradual improvement as inflation moderates into 2027.
Greater Phoenix Economic Forecast Population 1.5% increase | 2025 1.4% increase | 2026 1.3% increase | 2027
Employment 0.7% increase | 2025 1.0% increase | 2026 1.7% increase | 2027
Retail Sales 3.4% increase | 2025 3.2% increase | 2026 4.5% increase | 2027
Single Family Home Permits
-20.9% decrease | 2025 -8.0% decrease | 2026 6.0% increase | 2027
“Quality of Life IS DIRECTLY RELATED TO TOLERANCE OF UNCERTAINTY” - T O N Y R O B B I N S
2026 Mid-Year Real Estate Market Update By: Tina Tamboer with Cromford Report The year opened with optimism and stronger buyer and seller activity. In January, the Cromford® Market Index reached 89.4, just shy of the 90.0 threshold that would have ended a 14-month buyer’s market. With conventional mortgage rates in the low-6% range, new weekly contracts were up 10% over 2025 by mid-March, outperforming both 2023 and 2024. However, the Iran conflict in early March disrupted oil trade and pushed mortgage rates from 5.99% to 6.64% within weeks. Demand and supply both lost momentum, and higher rates drove the Cromford® Market Index deeper into buyer’s market territory. The result has been near-zero price appreciation despite sales increasing 4.6% year over year. Sales over $1 million appreciated 3% in value while closed sales increased 13% during the first half of 2026. This segment’s market share grew from 10% to 11%, a modest increase that doesn’t materially affect the median price but does elevate the average to a 4.7% annual gain. Sales over $10 million reached 44 by June, up 132% from 19 last year and already surpassing 2025’s full-year record of 32 sales. Strong stock market performance, healthy corporate profits, and increased international attention have all supported the luxury market in Greater Phoenix. Conversely, the lowest price tier continues to struggle under affordability constraints, aging housing stock, and rising HOA costs. Prices for homes under $300,000 declined 6.4% for condos and townhomes and 3.3% for single-family homes.
Meanwhile, prices in the mainstream $300,000$1 million range remain essentially flat, with annual price-per-square-foot changes of less than 1%. The new ROAD to Housing Law may benefit the most affordable segment through reduced regulations, expanded grants, and lending programs, but it is unlikely to have an immediate impact on mid-priced homes or HOA costs. On a positive note, Greater Phoenix average hourly wage growth has quietly outpaced both inflation and home price growth since mid-2023, rising 5.6% in 2024 and 5.8% in 2025. Markets still lack certainty surrounding Iran, inflation, and the new Federal Reserve chair. A lasting agreement could bring mortgage rates back into the low-6% range and provide a meaningful boost to housing demand during the second half of the year.
Annual changes: PRICE PER SQ FT
+0.7%
JUN 2025: $297.90 JUN 2026: $300.00
MEDIAN SALES PRICE
+0%
JUN 2025: $455,000 JUN 2026: $455,000
AVERAGE SALES PRICE
+4.7%
JUN 2025: $593,569 JUN 2026: $621,417
ANNUAL MLS SALES
+4.6%
6/24-6/25: 67,804 6/25-6/26: 70,946
METRO PHOENIX BY THE NUMBERS VALLEYWIDE AVERAGE INCREASE IN SALE PRICE
$37,096
1/25-12/25 VS 1/26-6/26
CITY
# OF LISTINGS
AVG SALE PRICE
1/25-6/25 VS 1/26-6/26
PRICE PER SQ FT
DAYS ON MARKET
MID 2025
MID 2026
+/-
2025
MID 2026
+/-
2025
MID 2026
+/-
2025
MID 2026
+/-
Anthem Apache Junction Avondale Buckeye Carefree Casa Grande Cave Creek Chandler El Mirage
190 366 434 1,346 41 535 286 1,234 148
181 409 414 1,466 53 432 307 1,311 137
-9 + 43 - 20 + 120 + 12 - 103 + 21 + 77 - 11
$662,441 $493,804 $430,853 $467,943 $1,707,380 $356,539 $1,092,667 $650,758 $357,699
$648,442 $491,403 $434,639 $466,703 $1,634,535 $355,614 $1,091,069 $650,474 $350,991
- $13,999 - $2,401 + $3,786 - $1,240 - $72,845 - $925 - $1,598 - $284 - $6,708
$279.48 $265.58 $223.43 $231.77 $477.09 $194.62 $386.09 $295.36 $233.09
$277.87 $267.17 $223.11 $228.73 $456.69 $190.05 $392.10 $294.84 $231.98
- $1.61 + $1.59 - $0.32 - $3.04 - $20.40 - $4.57 + $6.01 - $0.52 - $1.11
81 71 78 85 92 91 89 63 59
87 72 89 89 106 94 86 61 64
+6 +1 + 11 +4 + 14 +3 -3 -2 +5
Fountain Hills Gilbert Glendale Gold Canyon Goodyear Laveen Litchfield Park Maricopa Mesa
224 1,502 1,192 265 1,123 364 290 934 2,449
248 1,559 1,207 285 1,094 382 324 915 2,576
+ 24 + 57 + 15 + 20 - 29 + 18 + 34 - 19 + 127
$1,086,563 $688,837 $492,430 $605,665 $516,524 $496,204 $629,351 $367,352 $558,613
$1,221,503 $713,018 $496,756 $626,212 $519,865 $494,486 $634,993 $361,316 $556,926
+ $134,940 + $24,181 + $4,326 + $20,547 + $3,341 - $1,718 + $5,642 - $6,036 - $1,687
$388.90 $289.32 $254.53 $279.56 $238.33 $231.95 $244.97 $187.46 $270.72
$401.09 $293.14 $251.01 $282.35 $239.75 $226.22 $249.24 $183.31 $270.93
+ $12.19 + $3.82 - $3.52 + $2.79 + $1.42 - $5.73 + $4.27 - $4.15 + $0.21
83 68 69 104 79 78 92 95 71
91 61 70 105 84 79 101 99 67
+8 -7 +1 +1 +5 +1 +9 +4 -4
New River Paradise Valley Peoria Phoenix Queen Creek Rio Verde San Tan Valley Scottsdale Sun City
68 198 1,321 5,250 851 92 1,367 2,177 521
92 199 1,440 5,399 853 124 1,344 2,487 479
+ 24 +1 + 119 + 149 +2 + 32 - 23 + 310 - 42
$659,242 $4,870,667 $606,309 $632,648 $756,946 $1,046,285 $451,536 $1,575,005 $342,820
$681,786 $5,840,018 $611,495 $663,002 $766,484 $1,044,633 $461,608 $1,722,511 $336,323
+ $22,544 + $969,351 + $5,186 + $30,354 + $9,538 - $1,652 + $10,072 + $147,506 - $6,497
$280.73 $868.84 $269.60 $305.88 $278.89 $402.73 $222.33 $498.36 $206.91
$303.16 $964.28 $264.83 $311.85 $280.57 $400.23 $220.23 $516.22 $198.23
+ $22.43 + $95.44 - $4.77 + $5.97 + $1.68 - $2.50 - $2.10 + $17.86 - $8.68
102 107 76 70 91 113 75 84 84
104 105 76 67 92 129 81 88 82
+2 -2 +0 -3 +1 + 16 +6 +4 -2
Sun City West Sun Lakes Surprise Tempe Tolleson Waddell Wickenburg Wittmann Youngtown
528 216 1,810 455 257 222 140 108 63
546 274 2,065 492 232 252 166 119 55
+ 18 + 58 + 255 + 37 - 25 + 30 + 26 + 11 -8
$423,068 $526,402 $465,477 $611,658 $425,483 $537,947 $584,924 $521,888 $357,467
$413,251 $503,440 $468,622 $618,781 $415,513 $561,017 $687,702 $505,135 $342,583
- $9,817 - $22,962 + $3,145 + $7,123 - $9,970 + $23,070 + $102,778 - $16,753 - $14,884
$227.79 $264.20 $235.44 $309.72 $232.49 $246.41 $295.64 $277.86 $240.00
$222.90 $259.61 $230.11 $309.87 $222.65 $243.57 $308.17 $252.47 $227.59
- $4.89 - $4.59 - $5.33 + $0.15 - $9.84 - $2.84 + $12.53 - $25.39 - $12.41
79 79 84 62 60 86 115 97 77
85 79 92 62 75 87 141 111 114
+6 +0 +8 +0 + 15 +1 + 26 + 14 + 37
Statistics gathered from ARMLS. All information deemed reliable but not guaranteed. (Single-Family Residences)
Mickey Murphy PROJECT MANAGER | GRAPHIC ARTIST DLP PROGRAM DIRECTOR 480.921.0511 MICKEY@PRIMESOURCEAZ.COM PRIMESOURCEAZ.COM If your home is currently listed, this is not a solicitation for that listing.
Produced by Prime Source & DLP • 480.921.0511 • PrimeSourceAZ.com