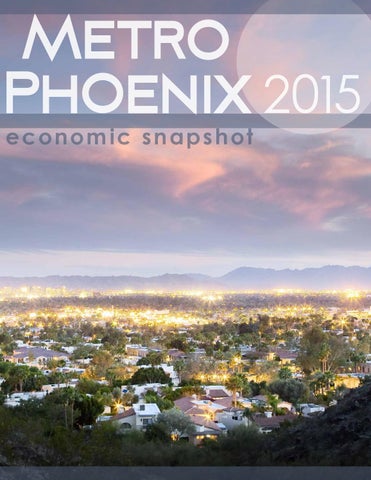
Metro Phoenix 2015 economic snapshot
2015 Should be the Strongest Year Since 2006
Economic Update
By Elliott Pollack | CEO, Elliott D. Pollack & Co.
T
he year 2015 should be the best year the U.S. economy has seen since 2006. Consumers have spent the last six years restructuring their balance sheets and are in much better financial shape in terms of the amount of debt they have. Businesses are awash with cash and are finally reaching a level of capacity utilization that has historically been associated with investment in plant and equipment. Government, in the absence of gridlock in Washington, should be a positive for the economy. Indeed, only construction is lagging. At this point, we would normally have a boom year. Yet, while economic activity will pick up, there is not likely to be such a boom in this cycle, at least not in 2015 or 2016. While consumers have gone a long way to fixing their balance sheets, they still have a way to go. Even though they will be spending on non-revolving credit for things such as autos and student loans, they are unlikely to loosen the strings on their credit cards all that much. In addition, it’s almost impossible to have a boom without significant construction spending. Nonetheless, nationally 2015 will be a good year. In Arizona, it should also be the best year that we have had since 2006. The state, which fell off the cliff between 2006 and 2010, really has staged a significant recovery in employment growth. Indeed, in terms of employment growth we went from being 49th out of the 50 states in 2009 and 2010 to being 12th in 2014. The problem is, when we compare ourselves to what the state has done historically, it’s really not very good. That’s why things in the state really don’t feel as they should. Two things have changed, both of which are significant but transitory. First, growth itself is an industry in Arizona. In terms of population growth, if the state would have grown at the normal rate of 3.2% that would mean we would have added 210,600 new people in 2014 instead of only 86,200. When new people show up they tend to need housing, clothes, cars, lawyers, bankers, Slurpees and tickets to ball games. In other words, they create their own level of goods and services that causes the need for more jobs. Thus, it is an accelerant to the cycle. Unfortunately, last year the state grew at about 1.3% or about 40% of normal. The result is, while jobs are growing, they are growing at a rate by historic standards that have been considered mediocre. The second factor is connected. Fewer people means less demand for housing, especially single family housing, but it also means less demand for office space, industrial space and retail. Why are population flows in housing doing so poorly? Fewer people are moving nationally due to a series of factors including, but not limited to, a large number of households that are under-equitied (i.e. after selling their homes they don’t have enough money left to cover moving costs and for a down payment). Of the people moving, fewer are moving to Arizona. There are other factors as well. Millennials are not only more likely to be living at home with mommy and daddy than they ever were before, but they have delayed marriage. When one delays marriage they delay having children and therefore delay the demand for housing. And, of course, financing is more difficult to get. Indeed, those who were foreclosed on or had short sales are in what we like to call the “penalty box”. They probably can’t get financing for
a new home for at least 1-3 more years. By the way, we believe that more than three quarters of the difference between a normal cycle and what we are going through now, in the Greater Phoenix area, is due to the ongoing malaise in the single family housing market. Things will change over time. More people will be in a position to move. And as they see jobs being created in Greater Phoenix, more will move to the area. Millennials will eventually get married, have children and buy homes. Those in the penalty box will get out of the penalty box and financing, which is as difficult today as it was easy from 2004-2006, will again reach some happier medium in between the two extremes. The result is that Arizona, especially Greater Phoenix, will continue to gain strength in 2015 and 2016, but they still will not be in a boom situation. Once again, the outlook is only negative if one compares it to where Arizona and Greater Phoenix would normally be at this point in the cycle. It does not mean that there aren’t continuing problems. Our new Governor, Doug Ducey faces a billion dollar shortfall in the state’s budget that will not be easily remedied. On a national level, we face potential grid lock in Washington. We don’t know how much slack remains in labor markets. In addition, long term demographics are not quite as favorable as they have been. Population growth is slower, the transition of women into the labor force has ended, and baby boomers are retiring in mass. This will cause a long term growth rate in the economy to be at least a ½ % below the long term growth rate of 3%. Overall, though, the outlook is positive. For Greater Phoenix, 2015 and 2016 are likely to be good years. Employment is likely to grow by 2.8% in 2015 and almost 3.0% in 2016. Population should pick up in Greater Phoenix to perhaps 1.6% this year and 1.8% next. Strong growth is likely to be delayed until 2017 or 2018. Personal income should be up in real terms in both 2015 and 2016. Single family permits after a surprising decline of 17% in 2014 should be up about 23% in 2015 and additional 23% in 2016. Multifamily construction should remain strong. The amount of office space being constructed, while low by historic standards, should be higher over the next few years than it was over the last two. Same thing is true with industrial space, especially in big boxes. Retail will continue to be slow, but vacancy rates should be declining. It appears to us that the construction boom and, therefore, a boom in the economy will be delayed until 2017 or 2018. That does not mean, however, that you won’t have a broad smile on your face through 2015 and 2016.
ARIZONA ECONOMIC FORECAST 2015 - 2016
POPULATION 1.5% increase in 2015 1.7% increase in 2016
RETAIL SALES 5.0% increase in 2015 4.5% increase in 2016
EMPLOYMENT 2.7% increase in 2015 2.8% increase in 2016
SINGLE FAMILY PERMITS 20.0% increase in 2015 18.0% increase in 2016
GREATER PHOENIX ECONOMIC FORECAST 2015 - 2016
POPULATION 1.6% increase in 2015 1.8% increase in 2016
RETAIL SALES 5.0% increase in 2015 4.5% increase in 2016
EMPLOYMENT 2.8% increase in 2015 3.0% increase in 2016
SINGLE FAMILY PERMITS 22.6% increase in 2015 23.1% increase in 2016
Source: Elliott D. Pollack & Co. forecasts as of January 2015.
Residential Real Estate
T
he housing market recovery in Greater Phoenix started in earnest in September 2011 and by the end of 2013 it had taken us all the way back to a normal balanced market. 2014 turned out to be a relatively quiet year consolidating this stability, with lower than normal volumes and investors curtailing the frantic purchase activity that lasted from 2009 through mid 2013. After the high volumes and rapid price increases of 2012 and 2013, most sellers, and in particular new home developers, were disappointed with 2014, but in retrospect it was merely a normal and rather uneventful period. In volatile Phoenix, normal and uneventful is unusual and felt a little strange. Throughout 2014, buyers had a slight edge over sellers in negotiations. This was because competition from other buyers was low with investors no longer very interested in most properties. With low numbers of lender owned or distressed homes, bargain prices were few and far between. Most sellers were able to keep contract prices at a fairly high percentage of asking prices but often agreed to concessions to close the deal. In particular, it was common for sellers to pay the buyer’s closing costs. New home incentives increased in a similar fashion. The most obvious impact of the new market conditions was a slowdown in price increases. After 2 years at the top of the national tables for price appreciation, Phoenix was relegated to an also-ran position. 2014’s numbers were as follows (compared with 2013): • The annual average price per sq. ft. rose by 8% from $118.48 to $128.11 • The annual average sales price increased 7% from $232,967 to $249,746 • The annual median sales price gained 9% from $176,000 to $192,000 These are tame compared with the previous two years but are still far in excess of inflation which stayed between 1.0% and 2.1% throughout the last two years. However most of these home price increases occurred some time ago and prices have been very stable for the past 9 months. The supply of new listings increased sharply during the first quarter of 2014 but then moderated and was fairly weak during the fourth quarter. 2015 started with only 21,326 active listings across Greater Phoenix, which is 5% down from a year earlier. This is adequate to meet the current low level of demand, but if demand increases back to a normal level it could quickly become overwhelmed.
By Michael Orr | Director of Real Estate Studies at ASU & Principal of The Cromford Report
Some sources have drastically overestimated the number of homes owned by institutional investors but in fact they own less than 14,000 single family homes across Greater Phoenix and have neither added to this total nor sold very many over the last 18 months. The institutional investors have been focused on achieving high occupancy rates for the single family homes they already own in Greater Phoenix and while vacancy rates for rentals remain low this situation is likely to persist. Only when rental vacancies increase beyond an acceptable level are we likely to see any significant selling of these assets through the normal channels.
ACTIVE LISTING COUNTS Greater Phoenix • ARMLS Residential
Transaction Type (group) Lender Owned Short Sales Normal
SALES PER MONTH
Greater Phoenix • ARMLS Residential • Measured Monthly
Demand for rentals remained very high during 2014, a corollary of the weak demand for homes to buy. There are many reasons for this weakness in demand for homes to buy including: • The tight underwriting rules imposed by lenders • Lack of sufficient savings for a down payment • Millennials deferring life events such as marriage and starting a family • High levels of student loan debt • Unwillingness to commit to significant additional debt in uncertain times • Unjustified fear of prices falling, generated by memories of the recent housing crash of 2008 • Foreclosures between 2008 and 2013 causing major issues with potential buyers’ credit history Sales volumes were lower in 2014 than 2013, especially for single family homes. We can see an increasing trend away from single family homes towards condos, townhomes and mobile homes. Compared with 5 years ago sales in 2014 were down 22% for single family homes, up 11% for apartments, up 13% for townhomes and up 29% for mobile homes. In stark contrast to the rest of the market, high end luxury homes had a second consecutive excellent year in 2014, buoyed by a rising stock market and excellent availability of jumbo financing at very attractive terms to well qualified borrowers. Many families who lost their homes through foreclosure in 2008 will become eligible for conventional loans in 2015. A push from FHA, Fannie Mae and Freddie Mac to increase the availability of mortgages to those with
Transaction Type (group) Lender Owned Short Sales Normal
good but not great credit is likely to stimulate an increase in demand in 2015 over 2014. Unemployment is declining and job growth improving although this is tempered by relatively slow growth in average earnings. These trends will probably shift demand gradually away from renting and towards ownership. At the moment it is still unclear how fast this trend will emerge but it is very likely that 2015’s demand will be higher than 2014. The new home market was very subdued in 2014 with sales down 9% from the prior year. Home builders have been reluctant to build homes in excess of current demand, so when demand improves we are likely to see some supply problems emerge. Construction jobs are still well below 2007 levels and a shortage of skilled labor is likely to be felt in the event of any significant recovery in volume. The Greater Phoenix housing market has entered a period of stability with a normal balance between buyers and sellers. The highest demand areas tend to be closer to employment opportunities while demand is weaker in outlying areas. In the current market, there is no longer any strong upward or downward pressure on home prices and 2015 is likely to see far less price movement than over the last three years.
2015 Should be the Strongest Year Since 2006
Economic Update
By Elliott Pollack | CEO, Elliott D. Pollack & Co.
T
he year 2015 should be the best year the U.S. economy has seen since 2006. Consumers have spent the last six years restructuring their balance sheets and are in much better financial shape in terms of the amount of debt they have. Businesses are awash with cash and are finally reaching a level of capacity utilization that has historically been associated with investment in plant and equipment. Government, in the absence of gridlock in Washington, should be a positive for the economy. Indeed, only construction is lagging. At this point, we would normally have a boom year. Yet, while economic activity will pick up, there is not likely to be such a boom in this cycle, at least not in 2015 or 2016. While consumers have gone a long way to fixing their balance sheets, they still have a way to go. Even though they will be spending on non-revolving credit for things such as autos and student loans, they are unlikely to loosen the strings on their credit cards all that much. In addition, it’s almost impossible to have a boom without significant construction spending. Nonetheless, nationally 2015 will be a good year. In Arizona, it should also be the best year that we have had since 2006. The state, which fell off the cliff between 2006 and 2010, really has staged a significant recovery in employment growth. Indeed, in terms of employment growth we went from being 49th out of the 50 states in 2009 and 2010 to being 12th in 2014. The problem is, when we compare ourselves to what the state has done historically, it’s really not very good. That’s why things in the state really don’t feel as they should. Two things have changed, both of which are significant but transitory. First, growth itself is an industry in Arizona. In terms of population growth, if the state would have grown at the normal rate of 3.2% that would mean we would have added 210,600 new people in 2014 instead of only 86,200. When new people show up they tend to need housing, clothes, cars, lawyers, bankers, Slurpees and tickets to ball games. In other words, they create their own level of goods and services that causes the need for more jobs. Thus, it is an accelerant to the cycle. Unfortunately, last year the state grew at about 1.3% or about 40% of normal. The result is, while jobs are growing, they are growing at a rate by historic standards that have been considered mediocre. The second factor is connected. Fewer people means less demand for housing, especially single family housing, but it also means less demand for office space, industrial space and retail. Why are population flows in housing doing so poorly? Fewer people are moving nationally due to a series of factors including, but not limited to, a large number of households that are under-equitied (i.e. after selling their homes they don’t have enough money left to cover moving costs and for a down payment). Of the people moving, fewer are moving to Arizona. There are other factors as well. Millennials are not only more likely to be living at home with mommy and daddy than they ever were before, but they have delayed marriage. When one delays marriage they delay having children and therefore delay the demand for housing. And, of course, financing is more difficult to get. Indeed, those who were foreclosed on or had short sales are in what we like to call the “penalty box”. They probably can’t get financing for
a new home for at least 1-3 more years. By the way, we believe that more than three quarters of the difference between a normal cycle and what we are going through now, in the Greater Phoenix area, is due to the ongoing malaise in the single family housing market. Things will change over time. More people will be in a position to move. And as they see jobs being created in Greater Phoenix, more will move to the area. Millennials will eventually get married, have children and buy homes. Those in the penalty box will get out of the penalty box and financing, which is as difficult today as it was easy from 2004-2006, will again reach some happier medium in between the two extremes. The result is that Arizona, especially Greater Phoenix, will continue to gain strength in 2015 and 2016, but they still will not be in a boom situation. Once again, the outlook is only negative if one compares it to where Arizona and Greater Phoenix would normally be at this point in the cycle. It does not mean that there aren’t continuing problems. Our new Governor, Doug Ducey faces a billion dollar shortfall in the state’s budget that will not be easily remedied. On a national level, we face potential grid lock in Washington. We don’t know how much slack remains in labor markets. In addition, long term demographics are not quite as favorable as they have been. Population growth is slower, the transition of women into the labor force has ended, and baby boomers are retiring in mass. This will cause a long term growth rate in the economy to be at least a ½ % below the long term growth rate of 3%. Overall, though, the outlook is positive. For Greater Phoenix, 2015 and 2016 are likely to be good years. Employment is likely to grow by 2.8% in 2015 and almost 3.0% in 2016. Population should pick up in Greater Phoenix to perhaps 1.6% this year and 1.8% next. Strong growth is likely to be delayed until 2017 or 2018. Personal income should be up in real terms in both 2015 and 2016. Single family permits after a surprising decline of 17% in 2014 should be up about 23% in 2015 and additional 23% in 2016. Multifamily construction should remain strong. The amount of office space being constructed, while low by historic standards, should be higher over the next few years than it was over the last two. Same thing is true with industrial space, especially in big boxes. Retail will continue to be slow, but vacancy rates should be declining. It appears to us that the construction boom and, therefore, a boom in the economy will be delayed until 2017 or 2018. That does not mean, however, that you won’t have a broad smile on your face through 2015 and 2016.
ARIZONA ECONOMIC FORECAST 2015 - 2016
POPULATION 1.5% increase in 2015 1.7% increase in 2016
RETAIL SALES 5.0% increase in 2015 4.5% increase in 2016
EMPLOYMENT 2.7% increase in 2015 2.8% increase in 2016
SINGLE FAMILY PERMITS 20.0% increase in 2015 18.0% increase in 2016
GREATER PHOENIX ECONOMIC FORECAST 2015 - 2016
POPULATION 1.6% increase in 2015 1.8% increase in 2016
RETAIL SALES 5.0% increase in 2015 4.5% increase in 2016
EMPLOYMENT 2.8% increase in 2015 3.0% increase in 2016
SINGLE FAMILY PERMITS 22.6% increase in 2015 23.1% increase in 2016
Source: Elliott D. Pollack & Co. forecasts as of January 2015.
Residential Real Estate
T
he housing market recovery in Greater Phoenix started in earnest in September 2011 and by the end of 2013 it had taken us all the way back to a normal balanced market. 2014 turned out to be a relatively quiet year consolidating this stability, with lower than normal volumes and investors curtailing the frantic purchase activity that lasted from 2009 through mid 2013. After the high volumes and rapid price increases of 2012 and 2013, most sellers, and in particular new home developers, were disappointed with 2014, but in retrospect it was merely a normal and rather uneventful period. In volatile Phoenix, normal and uneventful is unusual and felt a little strange. Throughout 2014, buyers had a slight edge over sellers in negotiations. This was because competition from other buyers was low with investors no longer very interested in most properties. With low numbers of lender owned or distressed homes, bargain prices were few and far between. Most sellers were able to keep contract prices at a fairly high percentage of asking prices but often agreed to concessions to close the deal. In particular, it was common for sellers to pay the buyer’s closing costs. New home incentives increased in a similar fashion. The most obvious impact of the new market conditions was a slowdown in price increases. After 2 years at the top of the national tables for price appreciation, Phoenix was relegated to an also-ran position. 2014’s numbers were as follows (compared with 2013): • The annual average price per sq. ft. rose by 8% from $118.48 to $128.11 • The annual average sales price increased 7% from $232,967 to $249,746 • The annual median sales price gained 9% from $176,000 to $192,000 These are tame compared with the previous two years but are still far in excess of inflation which stayed between 1.0% and 2.1% throughout the last two years. However most of these home price increases occurred some time ago and prices have been very stable for the past 9 months. The supply of new listings increased sharply during the first quarter of 2014 but then moderated and was fairly weak during the fourth quarter. 2015 started with only 21,326 active listings across Greater Phoenix, which is 5% down from a year earlier. This is adequate to meet the current low level of demand, but if demand increases back to a normal level it could quickly become overwhelmed.
By Michael Orr | Director of Real Estate Studies at ASU & Principal of The Cromford Report
Some sources have drastically overestimated the number of homes owned by institutional investors but in fact they own less than 14,000 single family homes across Greater Phoenix and have neither added to this total nor sold very many over the last 18 months. The institutional investors have been focused on achieving high occupancy rates for the single family homes they already own in Greater Phoenix and while vacancy rates for rentals remain low this situation is likely to persist. Only when rental vacancies increase beyond an acceptable level are we likely to see any significant selling of these assets through the normal channels.
ACTIVE LISTING COUNTS Greater Phoenix • ARMLS Residential
Transaction Type (group) Lender Owned Short Sales Normal
SALES PER MONTH
Greater Phoenix • ARMLS Residential • Measured Monthly
Demand for rentals remained very high during 2014, a corollary of the weak demand for homes to buy. There are many reasons for this weakness in demand for homes to buy including: • The tight underwriting rules imposed by lenders • Lack of sufficient savings for a down payment • Millennials deferring life events such as marriage and starting a family • High levels of student loan debt • Unwillingness to commit to significant additional debt in uncertain times • Unjustified fear of prices falling, generated by memories of the recent housing crash of 2008 • Foreclosures between 2008 and 2013 causing major issues with potential buyers’ credit history Sales volumes were lower in 2014 than 2013, especially for single family homes. We can see an increasing trend away from single family homes towards condos, townhomes and mobile homes. Compared with 5 years ago sales in 2014 were down 22% for single family homes, up 11% for apartments, up 13% for townhomes and up 29% for mobile homes. In stark contrast to the rest of the market, high end luxury homes had a second consecutive excellent year in 2014, buoyed by a rising stock market and excellent availability of jumbo financing at very attractive terms to well qualified borrowers. Many families who lost their homes through foreclosure in 2008 will become eligible for conventional loans in 2015. A push from FHA, Fannie Mae and Freddie Mac to increase the availability of mortgages to those with
Transaction Type (group) Lender Owned Short Sales Normal
good but not great credit is likely to stimulate an increase in demand in 2015 over 2014. Unemployment is declining and job growth improving although this is tempered by relatively slow growth in average earnings. These trends will probably shift demand gradually away from renting and towards ownership. At the moment it is still unclear how fast this trend will emerge but it is very likely that 2015’s demand will be higher than 2014. The new home market was very subdued in 2014 with sales down 9% from the prior year. Home builders have been reluctant to build homes in excess of current demand, so when demand improves we are likely to see some supply problems emerge. Construction jobs are still well below 2007 levels and a shortage of skilled labor is likely to be felt in the event of any significant recovery in volume. The Greater Phoenix housing market has entered a period of stability with a normal balance between buyers and sellers. The highest demand areas tend to be closer to employment opportunities while demand is weaker in outlying areas. In the current market, there is no longer any strong upward or downward pressure on home prices and 2015 is likely to see far less price movement than over the last three years.
RETURN SERVICE REQUESTED
14528 E DESERT VISTA TRAIL 4 BED + DEN | 5.5 BATH | 3,430 SQFT | $749,900 40’x50’ RV Garage | Take a Tour at: http://www.tourfactory.com/1281420 Fun filled home for the family! Perfect for entertaining! Builder’s own home with lots of amenities!! Incredible backyard featuring a resort style pool with beach entry, huge spa, 9 hole putting green, trampoline, basketball hoop, outdoor kitchen created with built in bar just need to add equipment, and extended covered patio. Just in time to enjoy this summer! Guys will love the RV garage with 1/2 bath and plenty of storage. The ‘’Man Cave/Casita’’ is upstairs complete with kitchenette and bath. This property could accommodate 10+ cars plus extra slab parking. Wood tongue and groove ceilings with large vega pole beams in LR and Master. 3 laundry hookups, 4 car garage in main house with tons of cabinets. All on 1.06 acres. Won’t last!! Rio Verde Real Estate Recap HOMES - Currently, there are 90 active homes on the market and 20 homes under contract.
LAND - Currently, there are 147 active lots on the market and 7 lots under contract. Rio Verde Land The following lots have closed since last publication. Keep in mind the price is determined by location, water availability, paved or dirt road, floodplain, etc. 17502 E. Barwick 1.14 acres 16700 E. Morning Vista 1.10 acres 16416 E. Lone Tree Trail 1.00 acre * 28705 N. 139th Street 1.11 acres 274xx N. 160th Street 2.50 acres 29800 N. 164th Street 3.92 acres 31XXX N. 176th Street 3.75 acres 27100 N. 150th Street 5.00 acres * Listed or Sold by Bonnie Burke
$37,250 $40,000 $42,999 $51,000 $85,000 $95,000 $133,000 $260,000
Bonnie Burke
ABR, CDPE, CIAS, CLHMS, CRS, e-PRO, GRI Integrity Based, Service Driven
480.720.8001 / 1.888.899.0496 Bonnie@BonnieBurke.com www.BonnieBurke.com
“Integrity Based, Service Driven!” RIO VERDE FOOTHILLS HOMES
Address Sq. Ft. Bed Bath Acre
Days On List Price Market
14536 E Monument Dr 31635 N 160th St * 15312 E Skinner Dr 14919 E Roy Rogers Rd * 31113 N 152nd St 15440 E Cavedale Dr 28521 N 158th St * 13911 E Quail Track Rd 16432 E Duane Ln 33412 N 139th Pl 35108 N 139th Way 28717 N 139th Pl 14703 E Horned Owl Trl 35029 N 139th Way 14032 E Mark Ln 14231 E Cavedale Dr 35618 N 142nd Pl * 33620 N 139th Way * 26813 N 150th St * 14528 E Desert Vista Trl 16436 E Duane Ln 13821 E Westland Rd 29415 N 164th Pl 30319 N 139th St 13713 E Monument Dr 26706 N 142nd Pl 17340 E Morning Vista Ct 28812 N 141st St 14838 E Lomas Verde Ln 15030 E Chaparosa Way 28024 N 156th St
1,815 1,270 2,449 2,916 3,643 2,955 3,153 2,601 3,543 3,641 3,582 3,102 3,143 4,184 2,400 2,975 2,879 3,895 3,230 3,430 4,115 4,150 3,348 4,458 3,693 3,989 3,863 3,646 4,000 2,181 7,094
17 34 7 4 30 27 22 37 20 12 15 24 43 7 22 55 16 26 30 21 20 34 6 12 57 37 19 20 21 1 36
$364,000 $439,000 $459,000 $499,000 $499,000 $529,000 $549,000 $549,900 $549,900 $549,900 $599,000 $585,000 $589,900 $595,000 $624,900 $650,000 $659,500 $699,000 $745,000 $749,900 $749,900 $785,000 $815,000 $899,000 $997,000 $1,000,000 $1,099,000 $1,250,000 $1,500,000 $2,500,000 $10,000,000
29106 N 153rd St 28905 N 148th St 28721 N 168th St * 16418 E Milton Dr 27015 N 136th St 16538 E Desert Vista Trl 14327 E Old West Way 33314 N 142nd Way 29208 N 148th St 36009 N 136th St * 29619 N 143rd St 29621 N 156th St 28825 N 160th St 30714 N 148th St 14211 E Dove Valley Rd 13634 E Windstone Trl 14235 E Dale Ln 14329 E Lowden Ct
2,000 2,394 2,063 2,398 2,100 3,479 3,669 3,623 2,750 2,610 2,810 2,789 4,280 1,500 3,514 3,231 3,322 4,851
82 174 24 79 58 187 260 81 117 195 17 229 111 355 85 34 38 37
$349,900 $359,000 $399,000 $414,000 $490,000 $499,900 $575,000 $585,000 $639,500 $387,000 $435,000 $445,000 $479,000 $499,000 $499,900 $725,000 $769,000 $1,385,000
Days On Market 56 110 18 141 214 45 80 19 171 356 26 345 52 95 341
List Price
Sold Price
$280,000 $379,905 $389,900 $440,000 $485,000 $484,500 $600,000 $599,990 $599,000 $599,000 $649,900 $699,000 $779,000 $1,125,000 $1,450,000
$262,000 $355,000 $384,900 $440,000 $460,000 $461,000 $520,000 $562,500 $595,000 $599,000 $625,000 $670,000 $750,000 $1,100,000 $1,400,000
Active Since Last Publication: 3 2 4 4 4 4 4 4 5 4 5 4 4 5 4 4 3 3 4 4 6 4 4 5 4 4 3 5 4 3 5
2 2 2 2.5 45 3.5 3 2 3.5 3.5 3 3 3 4 3 3 2 3 3 5.5 5 3.5 3 4 3.5 3 4 5.5 6 2 7
1-1.9 Acres 2-4.9 Acres 1-1.9 Acres 1-1.9 Acres 2-4.9 Acres 1-1.9 Acres 1-1.9 Acres 1-1.9 Acres 1-1.9 Acres 1-1.9 Acres 1-1.9 Acres 2-4.9 Acres 1-1.9 Acres 1-1.9 Acres 1-1.9 Acres 1-1.9 Acres 2-4.9 Acres 2-4.9 Acres 5-9.9 Acres 1-1.9 Acres 1-1.9 Acres 5-919 Acres 1-1.9 Acres 1-1.9 Acres 1-1.9 Acres 1-1.9 Acres -- 5-9.9 Acres 10+ Acres 10+ Acres 10+ Acres
Pending Since Last Publication: 3 4 4 3 3 4 4 4 4 4 3 3 4 1 3 4 5 5
2 2 2 2.5 2 3 3.5 3.5 2 2.5 2.5 2.5 4.5 1.5 3.5 3 4 5.5
1-1.9 Acres 1-1.9 Acres 1-1.9 Acres 1-1.9 Acres 5-9.9 Acres 1-1.9 Acres 1-1.9 Acres 1-1.9 Acres 2-4.9 Acres 1-1.9 Acres 1-1.9 Acres 1-1.9 Acres 1-1.9 Acres 5-9.9 Acres 1-1.9 Acres 2-4.9 Acres 1-1.9 Acres 2-4.9 Acres
Address Sq. Ft. Bed Bath Acre Closed Since Last Publication: 14032 E Red Range Way 2,240 3 2.5 1-1.9 Acres 31817 N 141st St 2,858 4 2.5 1-1.9 Acres 29505 N 146th St 2,567 4 2.5 1-1.9 Acres 17540 E Windstone Trl 3,123 4 3 1-1.9 Acres 14705 E Peak View Rd 2,671 3 2.5 1-1.9 Acres 16603 E Morning Vista Ln 2,780 3 3 2-4.9 Acres 27314 N 174th St 3,883 5 5 1-1.9 Acres 33305 N 142nd Way 3,534 4 3.5 1-1.9 Acres * 28706 N 138th St 3,335 4 4 5-9.9 Acres 33411 N 141st St 3,850 4 3.5 1-1.9 Acres * 14247 E Dove Valley Rd 3,236 4 2.5 1-1.9 Acres 15008 E Windstone Trl 2,379 3 3 5-9.9 Acres * 28416 N 151st St 3,394 4 3.5 1-1.9 Acres 14310 E Lowden Ct 4,259 4 3.5 2-4.9 Acres 29807 N 144th St 2,572 4 3 10+ Acres * Listed or Sold By Bonnie Burke
All information is deemed reliable but not guaranteed. The properties on this list have been listed/sold by various members of the MLS. If your home is currently listed, this is not a solicitation for that listing.
RIO VERDE FOOTHILLS
MARCH | APRIL 2015
Bonnie Burke • RE/MAX Excalibur 8510 E. Shea Blvd. #100 Scottsdale, AZ 85260
Produced by Desert Lifestyle Publishing • 480.460.0996 • www.DesertLifestyle.net
sweet sailing Above deck adventures
Homeownership Tax Breaks
More Green In Your Wallet!
Union Barrelhouse’s PB&J Grilled Cheese
Backyard Summertime Fun Found In This Cover Home Presented By Bonnie Burke