ISSUE 01
|
2026
ENGLISH GERMAN
DairyTalk Breeding. Genetics. Management.
AI & BREEDING · COVER STORY
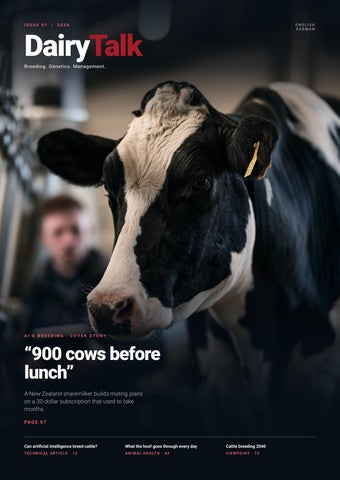
“900 cows before lunch” A New Zealand sharemilker builds mating plans on a 30-dollar subscription that used to take months. PA G E 0 7
Can artificial intelligence breed cattle?
What the hoof goes through every day
Cattle breeding 2040
TECHNICAL ARTICLE · 12
A N I M A L H E A LT H · 4 4
VIEWPOINT · 70
DairyTalk Breeding. Genetics. Management.
The technical magazine for modern dairy cattle breeding Twice a year. In English and German. For everyone who makes breeding decisions.
ISSUE 01 VOLUME 1
·
2026 ·
ISSUE 1
www.dairytalk.info
EDITORIAL
PUT KNOWLEDGE IN CONTEXT. MAKE BETTER DECISIONS. Dear readers, dairy farming is changing. New breeding methods, genomic information, digital systems and artificial intelligence are opening up possibilities that were barely thinkable a few years ago. At the same time the decisive question stays the same: how can we make better decisions for our animals, our herds and our businesses? DairyTalk wants to create a space for that. For well-founded technical articles, practical experience, international perspectives, and also for subjects where there is no easy answer. Neither the newest technology nor the loudest opinion should be at the center of it, but what actually holds up in practice. I will be glad if DairyTalk helps to set new thinking in motion, to share experience, and to look at cattle breeding and dairy farming from different points of view. I hope you enjoy reading it. Helmut Demmelhuber
“Better decisions begin with better questions.”
CONTENTS AI & BREEDING
A N I M A L H E A LT H
07
36
“900 cows before lunch” A New Zealand sharemilker builds mating plans on a 30-dollar sub‐ scription that used to take months.
12
Can artificial intelligence breed cattle?
Teat injury, chronic mastitis, the three-quartered cow: what the literature gives us.
44
What it can do, what it looks like in practice, and how to get started.
17
No farm is average Herdenanalyse 360°, FlexiHerdenindex° and Flexi-Mating° working together.
26
51
Shamonda and the spring that follows
MARKET & MARKETING
Understanding elite auctions Why the highest price is not auto‐ matically the market value.
FA R M & E C O N O M I C S
Which breed fits which farm? Holstein, Fleckvieh, Jersey and Brown Swiss compared on the num‐ bers.
The magazine does not end on paper.
What the hoof goes through every day
What is documented about the new orthobunyavirus and what a farm can do now.
58
32
DAIRYTALK PODCAST
Walking surfaces, the robot area and standing time — where hoof health is decided.
My animals – my data? Who owns the data from our anim‐ als – and who decides how they are used?
What a lost quarter really costs
64
Four buyers, four pricing logics Who bids at the 2026 Holstein elite auctions, what gets paid for and what goes unsold.
VIEWPOINT
70
Cattle breeding 2040 Which structures and data infra‐ structures the breeding of tomorrow needs.
www.dairytalk.info/podcasts-en
IMPRINT PUBLISHER
ISSUE 01 | 2026
Helmut Demmelhuber
Volume 1 · Issue 1
Oberer Weg 14
English | German
72070 Tübingen Germany E D I T O R I A L C O N TA C T
Phone +49 7071 855 403
I M A G E S & I L L U S T R AT I O N S
Image concept and art direction: Helmut Demmelhuber. Photographic and AI-generated imagery is selected and designed editorially. Further image credits are given with the individual article.
Email kontakt@dairytalk.info Web www.dairytalk.info EDITOR & RESPONSIBLE FOR CONTENT
Helmut Demmelhuber L AY O U T & D E S I G N
P U B L I C AT I O N
Published digitally at www.dairytalk.info COPYRIGHT
All articles, graphics and illustrations are protected by copyright. Reprinting, reproduction, distribution or adaptation – including in part
Helmut Demmelhuber
– only with the prior written permission of the publisher.
FREQUENCY
LIABILITY
Twice a year as a digital edition.
These articles are for technical information. They do not replace individual veterinary, breeding, legal or business advice. Despite careful checking, no guarantee can be given for the completeness and accuracy of the information.
T R A N S PA R E N C Y N OT E O N T H E U S E O F A R T I F I C I A L I N T E L L I G E N C E Artificial intelligence tools are used in part for research, data analysis, drafting, translation, editing and the visual design of DairyTalk. AI-generated content is not published unchecked. Selection, technical assessment, editorial work and responsibility for the published content rest with the publisher. AI-generated images serve as illustration and do not necessarily depict real animals, people, farms or situations.
Matthew Zonderop, Matamata · Photo: The Bullvine, thebullvine.com
AI & BREEDING · INTERVIEW
“900 cows before lunch” A New Zealand sharemilker builds mating plans on a 30-dollar subscription that used to take months. What he does would not be possible on a German farm today — and the technology is not the reason.
INTERVIEW: HELMUT DEMMELHUBER
Since one night in spring, when a spreadsheet he
system that is now in use on several New Zealand
had built over five weeks collapsed two weeks
farms. The New Zealand trade press has covered it
before the start of the breeding season, he has been
in detail; at Fieldays 2025 he was a finalist in the
developing an artificial intelligence – based mating
Innovation Awards.
Matthew Zonderop runs a herd of about 400 KiwiCross cows
ics.
as a 50:50 sharemilker near Matamata in New Zealand's Waikato. The farm belongs to someone else, the cows and the labor are his, and the two of them split the milk check. He cannot write code. He gets by in Excel the way most people do. For German readers, the interesting part of this story is less the technology than a precondition that does not exist here. We come back to that at the end.
“It was just cow data” Mr. Zonderop, the story of how you got started is well known by now. What usually gets told wrong? That it was a plan. It was Friday night, half past ten, five weeks
The office is on the hillside. The herd is the database.
of work in spreadsheets, and the whole workbook was lit up
How a job runs
red. I had heard about ChatGPT and thought: I have nothing to
Describe a specific case.
lose, this is not personal data, this is just cow data. A typo was the cause. Found and fixed in seconds.
A farm calls, say 900 cows in the South Island. The farmer
And then?
CSV file. Everything is in there: phenotypic data, the full
Then it asked whether I wanted the file analyzed further. I clicked yes. Over the next three hours the system pulled con‐ nections on its own — sorted lactation data, broke out somatic cell counts, separated fat and protein. Then it picked up the sire data from another worksheet and offered a com‐ parison without being asked. That is where I stopped. Thirty seconds had done what I had spent five weeks on. The second thought was less comfortable: I had just woken some‐ thing that every breeding company in the world has guarded
goes into MINDA, the national herd database, and exports a genomic profile, production history, health data, liveweights, every case of mastitis, every metritis, every lameness event, every lactation curve going back to the day the cow was born. One file. Standardized. Ready to download. And then the system does the math? First I spend twenty or thirty minutes on the phone with him. More components? Better rebreeding? Somatic cell count down? Tighten gestation length? Protect longevity? After that
for decades.
the system matches the cow data against the sire catalogs,
How long did it take from there to a system you could
report. My own 400 cows: about half an hour. The 900 from
actually use?
the South Island: done before lunch.
Six months. YouTube tutorials after the evening milking, pod‐
And before that?
casts in the truck while shifting cows, wording copied, rewrit‐ ten, fed back in. At some point I asked the system itself: can you help me ask you better questions? That was the turning point. You do not have to write code for artificial intelligence — it writes the code. What it does not have is the part that is written down nowhere.
works through 26 traits per animal and writes the mating
Months. I know, I did it. And at the end of those months there was always a quiet voice asking whether any of it was actu‐ ally right. If you have 400 cows and try it yourself, you sit with it for months — and are you ever really satisfied with the answers you arrived at? That voice is quiet for the first time in my working life.
For example? Why an American Holstein sire on a KiwiCross cow leads straight into a shed full of expensive, oversized disappoint‐ ments. Why the guardrails you set on an all-grass farm will ruin a farm running partial TMR. That was in my bones. What I was missing was a tool that can hold all of it at once. And no human can: 400 cows times 26 traits times eight generations of pedigree times a dozen sires in working memory — you do not fail at that out of laziness, you fail at it because of phys‐
08
Seven kilograms, not thirty-five What is the most important rule in your system? That you cannot go backwards with it. People come to me and say: I want bigger cows. Then we look at their data, their system, their location, how much feed they actually buy in. And we ask: will that really work on your farm? Most of the time the answer is no. Bigger cows do not automatically AI & BREEDING
mean more milk in New Zealand. We farm outside. And that turns into a number?
ings shows higher components and better fertility without a matching rise in milk volume. In a grazing system where every extra liter of feed costs money, that is the right combination.
Seven kilograms of liveweight in one season (about 15 lb).
But the numbers that go through the trade press — 12 percent
Not thirty-five. Mating works in both directions — you can
faster genetic gain, 18 percent fewer stillbirths — I treat with
repair traits or reinforce them. But the system is built so that
caution, and everyone should. Those are early figures.
you do not go backwards. Anyone chasing thirty-five kilo‐
Whether they hold up to independent review, I do not know.
grams in one generation breaks something he did not know
The long-term traits, mastitis resistance and functional sur‐
was load-bearing.
vival, will not tell their story for another five to eight years.
That sounds like the opposite of what you hear from vendors selling artificial intelligence. We have exceptionally productive and valuable animals today. From calving to full lactation in six weeks, and then on, year after year, in our environment. We can no longer treat them like a bulk commodity. We have to make sure the data we get from her is right — because her progeny influence the next generation. And the one after that.
One file is enough — if it exists.
When the competition sat at the kitchen table You are building a tool that competes with the national breeding organization's own mating program. How did they react? Waikato: grass, rhythm, and a system that keeps the record.
You would expect lawyers. Instead an email came: the chief executive wanted to come out to the farm. He brought the
Checking the work backwards
whole leadership team — head of genetics, scientific lead, the
The first progeny group from your own matings is out on
themselves. They sat at my kitchen table.
grass. What did you do with it? Something that would have been unthinkable two years ago. Before the calves went out to the grazing block, I pulled the genomic data on all of them, linked it to the full life history of each dam — size, maternal grandsire, lactation history, every health event, calving dates, first services, every case of mastitis, every lameness — matched the sire numbers and asked the system to tell me backwards how my mating program had actually worked.
technology people, the ones who write the MINDA dashboard
And? I said to one of them: you have spent your entire career on research and trials in genetics — I just did that in five minutes. That could have ended the conversation. It did not. They were excited. And then came the question I was not prepared for at all: what can we do to help? I am not a businessman. I am a dairy farmer who wants to breed the perfect cow. What came of it?
How long?
They give me additional sire data and check the relationship
Half an hour. And out came a verdict no human consultant
of the proposed sire teams against the national pedigree
could deliver in a month: this mating worked. This one was a failure. Not this sire again. This sire corrected a weakness that sat three generations deep on the dam side. What do the numbers say? Stay careful. The analysis of the farms working with our mat‐
AI & BREEDING
database. That check is fast, accurate and sits on the national pedigree base — there would be no reason to rebuild it. Their own mating tool offered eight weightable traits. We work through 26. What is your biggest risk? Not the farmer and his breeding work. It is the separate plat‐ 09
forms — the off-ramps from the genetics highway.
mating decisions you made four years ago is feasible here too, using milk recording and herd management data — and it
Putting it in context: what would work in Germany? That last sentence is exactly why this conversation matters for German farms. What Matthew Zonderop does fails here not because of the technology, but because of three precondi‐ tions.
is the only method you really learn from. What remains is a demand as unspectacular as it is persist‐ ent: structured, machine-readable exports of a farm's own herd data, for every farm, at no extra cost. Not as a conces‐ sion, but as a matter of course — it is the data of his animals. Whoever solves that will move more in the next five years than any new algorithm.
First: the file. The decisive advantage is not the model, it is the MINDA export — a standardized, downloadable file that holds everything on every animal. According to industry figures, the database covers about 93 percent of all dairy cattle in New Zealand. In Germany, genomic results reach the farmer mostly as individual PDF data sheets from the vit or Netrind system, one animal per file; for home-bred young sires, complete exports are in some cases not available at all. A farm with 300 genotyped animals has one spreadsheet there and 300 docu‐ ments here. Anyone who wants to evaluate those documents spends most of his time not on breeding, but on retyping. Second: the trait world. Zonderop works with BW, PW and TOP and bases the economic weighting on figures from DairyNZ.
BOX 1
Profile Matthew Zonderop, Matamata, Waikato, New Zealand. 50:50 sharemilker with about 400 KiwiCross cows: the farm owner provides the land, Zonderop provides the cows and the labor, and the milk income is shared — a form of farm business unknown in Germany that opens the path to farm ownership for many New Zealand farmers. Founder of Perfect Cow Breeding Solutions. The system builds farm-specific mating plans at herd and individual animal level, calculated across 26 traits per animal. Data basis: the farm's MINDA export, the NZAEL RAS lists, the breeding values BW, PW and TOP, and economic figures from
These values cannot be transferred to RZG, the German relat‐
DairyNZ. The relationship check on the sire teams runs
ive total merit index, or to the German sub-indexes; on top of
through LIC's national pedigree database.
that, both countries use different genetic bases and carry out
Finalist in the Innovation Awards at Fieldays 2025.
base changes at different times. A model that does not know these differences compares numbers that have nothing to do with each other — and then states the result in flawless sen‐ tences. A faulty spreadsheet looks faulty. A faulty artificial
BOX 2
intelligence answer looks like advice.
New Zealand terms
Third: the production system. The KiwiCross weighs around
MINDA — the national herd database of Livestock Improve‐
450 kg (992 lb) and makes up about 60 percent of New Zeal‐ and's dairy cow population of roughly 5.91 million animals. It is a cross of Holstein-Friesian and Jersey, systematically selected since the 1950s. The farm calves in a block, and the culling threshold is hard and recurring. An index optimized for that has little in common with a German robot herd.
ment Corporation (LIC); according to industry figures it covers about 93 percent of all dairy cattle in New Zealand. The farmer exports a standardized CSV file from it himself. BW — Breeding Worth — total merit index weighted by the expected economic contribution of the progeny in a grazing system. PW — Production Worth — an assessment of an individual
What can be transferred are three ways of thinking — and they
animal's performance to date, used as the basis for selection
cost nothing:
and culling decisions.
Set the weightings before choosing sires. Zonderop's twentyminute goal-setting call before the first calculation is the real core of it. Anyone who starts with the sire list is answering a question he never asked.
TOP — Traits Other than Production — conformation and functional traits. RAS list — Ranking of Active Sires from NZAEL, the national sire ranking. System 1 to 5 — a classification by feeding intensity, from all-
Correct in increments instead of jumping. The seven-kilogram rule is not a New Zealand specialty, it is simply breeding dis‐ cipline. It translates to any trait a German farm happens to be chasing. Check backwards. Holding your own progeny up against the 10
grass with no bought-in feed through to partial TMR feeding. KiwiCross — a cross of Holstein-Friesian and Jersey, system‐ atically selected since the 1950s and protected as a breed by LIC in 2005. Around 450 kg, about 60 percent of the national dairy cow population of roughly 5.91 million animals.
AI & BREEDING
Sharemilking — a farm business model in which the land and the herd belong to different parties and the milk income is split on an agreed share.
BOX 4
Three things all called “AI” In dairy cattle breeding, AI has always meant artificial insem‐ ination. In this article it means artificial intelligence — the
BOX 3
What is missing in Germany New Zealand
Germany
Data access
one standardized individual PDF data sheets from CSV from MINDA vit/Netrind, one animal per file
Coverage
about 93 percent spread across breeding organiz‐ of all dairy cattle ation, regional milk recording in one database body, herd program, milking equipment, veterinarian
Effort for 300 anim‐ als
one download
300 documents, to be merged by hand
same two letters in English and, as KI, in German too, which is why this article spells the term out wherever it could be read either way. Within artificial intelligence, a distinction is worth making: Statistical learning methods — the basis of genetic evalu‐ ation. Mature, validated, with published reliabilities. Machine learning and neural networks — pattern recognition in images, sensor data and spectra. Partly ready for practice in trait recording. Language models — they process text, bring sources together and explain relationships. Useful for preparation and advisory work, unsuitable for estimating breeding values, and prone to plausible-sounding errors without verification.
The technical ability to evaluate whole herds with artificial intelligence exists on both sides. The difference is not the model, it is the access.
AI & BREEDING
11
AI & BREEDING · TECHNICAL ARTICLE
Can artificial intelligence breed cattle? Artificial intelligence in dairy cattle breeding: what it can do, what it looks like in practice, and how to get started
H E L M U T D E M M E L H U B E R | M A N A G E M E N T C O N S U LTA N T A N D H O L S T E I N B R E E D E R
Cattle used to be bred on experience, a good eye and
the table: artificial intelligence. What it can do in
gut feeling. Then came performance recording,
practice — and what it cannot — is set out here from
breeding values and genomics. Now a new tool is on
two vantage points, the barn and the data lab.
From the barn to the data lab — and back Anyone who grew up in cattle breeding knows the craft in his bones: the smell of fresh hay, the stillness of a barn before the morning milking, the hours spent weighing up which sire suits
the sheer volume puts people up against their limits. Genomic data, performance data, pedigree information, breeding values — these are classic fields in which artificial intelligence can work through relationships that are barely manageable by hand.
which cow. For a long time that knowledge was inseparable
What it cannot do is be there in the barn. It does not see an
from personal experience — intuitive, tested, handed down
animal. It does not feel temperament. It does not know a
from one generation to the next.
farm's particular history, a family's personal breeding goals, or
Today a new tool has joined it: artificial intelligence. The author of this article grew up on a Bavarian dairy farm with about 50 registered Holstein cows. Breeding was daily life: up at four, milking, feeding, calving assistance, planning matings. At 15, after his father's serious accident, he took on
what the market will be asking for next year. Artificial intelli‐ gence is a powerful analytical tool — not a replacement for an experienced breeder. Artificial intelligence does not replace a breeder — but it makes him considerably stronger.
breeding responsibility early. By the time he finished high school, the family had to give up the herd. The passion stayed. He studied theology and education in Passau, Freiburg, Israel
Three applications with real value
and the United States. He worked in South Africa, in India, all
Three examples from practice in which artificial intelligence
over the world — but never out of touch with Holstein breed‐
can genuinely support a breeder and take work off his hands:
ing. In February 2025 he came back to Holstein breeding in earn‐ est, buying two breeding heifer calves at the MASTERRIND Exclusive sale in Verden — MASTERRIND is a German breed‐ ing cooperative — together with breeders Volker and Timo Carstens of Visselhövede.
1. Breeding plans and mating decisions Sire selection is one of the most frequent and most con‐ sequential decisions in day-to-day breeding. Genomic data, growing sire lineups and increasingly differentiated breeding goals make that choice steadily more complex. Anyone mat‐ ing several dozen cows today is looking at hundreds of proven
Now the cow fever has really got you, Volker Carstens said at the time, laughing. He was right.
or genomically evaluated sires, each with its own strengths in type, udder, feet and legs, health traits and production. This is where artificial intelligence can bring structure. The genomic profile of a cow is analyzed, the weaknesses identi‐ fied are matched against the sires actually available — from
The particular push toward artificial intelligence came a little earlier. A client reported that using ChatGPT was saving him roughly 40 percent of his working time. That sentence was the wake-up call. This time the author did not want to do what he
the farm's own semen tank, say, or from the current lineup of an artificial insemination organization. The result is a reasoned, ranked selection of two or three suitable sires, with a short explanation of why the combination makes sense.
had done with the PC and the smartphone — wait until a tech‐
One point matters here: this is not about replacing the
nology was long established before getting on board. He
breeder's judgment, it is about a structured second opinion. In
wanted to understand early what was actually possible.
larger herds in particular, or in complex embryo transfer pro‐
That double perspective — breeding practice on one side, digital transformation on the other — is the basis of this art‐ icle.
What artificial intelligence can do today — and what it cannot Most people so far use artificial intelligence mainly to write emails or text. That is useful, but in breeding it is a very small slice of what is possible. On farms, artificial intelligence is strongest where there is a lot of structured data and where AI & BREEDING
grams, the approach can help reach decisions faster and more systematically without overlooking something essential. Inbreeding and outcross management can be steered better the same way. For embryo transfer programs it goes further still. Artificial intelligence develops a complete rotation strategy for the OPU and embryo transfer use of a top female — first several flushes with very high total merit values, then targeted cor‐ rective sires, and after that phases for special traits such as polled, red factor or slick. One result was particularly telling: a sire the breeder himself was fond of was clearly ruled out, 13
with sound breeding reasoning that was fully transparent.
animal photographs. Modern image recognition systems can take high-quality shots — taken to a standard from defined angles — and derive indications of body structure, leg set, rump angle and udder attachment. Early tests show surprisingly precise results: on linear scoring from photographs, the deviation from the actual classification score was usually no more than one point, depending on image quality and angle. That makes it possible, for instance, to supplement the Triple-A system — an established method of assessing the morphology of breeding animals — with a preliminary evaluation from artificial intelligence, above all in combination with genomic profiles.
The machine calculates. The decision is made at the table.
None of this replaces an experienced judge or breeding advisor. The human eye — which sees an animal move, reads
2. Herd analysis and breeding strategy Where an individual mating is a classic operational problem, the herd level is about something else: strategic development across several generations. Artificial intelligence can help evaluate the genomic data of a
how it stands, senses the tension in its body — remains irre‐ placeable. But artificial intelligence can help make assess‐ ments more objective, put a bad day into perspective and add another point of view. That is especially useful for farms without regular access to a breeding advisor.
whole herd systematically and build a differentiated profile of
Tools and data
strengths and weaknesses. It often turns out that certain
Technically, a breeder interested in working with artificial
traits cluster — not by chance, but as a consequence of earlier breeding decisions. Feet and legs, udder health or fertility may have been improved or stabilized deliberately over several generations — but they may also have drifted the wrong way without anyone intending it. In practice: on the Carstens farm the complete genomic herd data were evaluated. Artificial intelligence produced a clear strengths-and-weaknesses analysis and identified the areas to work on. From that, a precise breeding strategy was defined — including first-, second- and third-choice sire recom‐ mendations for each animal, in a form that works in the barn every day. An analysis like that answers the central strategic questions. Where are the herd's genetic strengths? Which weaknesses
intelligence has a range of mature systems available. In prac‐ tical work these are mostly large language models: ChatGPT (OpenAI), Gemini (Google), Claude (Anthropic) and Perplexity are among the most widely used platforms. NotebookLM (Google) adds interesting options for structured analysis of longer documents — breeding reports or herd statistics, for example. The analyses draw on data sources including the following: Genomic breeding values for individual animals Pedigree information and ancestry data Technical articles, interviews and publicly available technical information
keep recurring? How is the herd's level of inbreeding develop‐
The author's own experience from breeding and consulting
ing? Which traits should be improved deliberately over the
work
coming years? Artificial intelligence can simulate different breeding strategies and show their likely effect on how the
Artificial intelligence does not work unsupervised here. It
herd develops.
works under control, in a structured way, and embedded in technical judgment. What matters is not the individual tool but
For farms that have not been able to draw on regular breeding
that the system is used reliably, transparently and alongside
advice, this opens up analytical capacity that used to be
professional experience. The value appears where data,
almost out of reach.
experience and practical logic come together.
3. Type evaluation from photographs One particularly promising application is image analysis of
14
The quality of the results depends heavily on the quality of the questions. Feed artificial intelligence blanket questions and you get blanket answers. Ask precise, context-rich questions and supply the relevant data, and the quality of the support AI & BREEDING
rises markedly. The technical term for this is prompt engineer‐ ing — the art of addressing an artificial intelligence system so that it actually delivers what it is capable of.
A practical guide: sire selection in five minutes The following sequence shows how artificial-intelligence-
Tip: instead of the PDFs you can simply photograph the prompt and the genomic data sheets from the printout and/or the screen and upload those.
supported sire selection fits into the working day. Two docu‐ ments are needed: the cow's genomic data from the vit/Net‐ rind system — the German dairy genetic evaluation and herd data systems — as a PDF, and the current sires in the semen tank, likewise as PDFs.
Or use the free artificial intelligence tools the author has built: https://www.dairytalk.info/KI-tools
Step 1: open a chat and enter the prompt Paste the following opening prompt straight into ChatGPT or a comparable system: “You are a professional sire analyst for Holstein cattle and you advise on matings on the basis of the uploaded PDF data. Please analyze the animal with the genomic data attached in the first PDF and compare it with the sires from the further PDFs (sires currently in the semen tank). Always apply our defined breeding goal: economical Holstein cows with high lifetime production and functional type, producing at least
A model does not make visible what stands in the dark.
12,000 kg of milk a year (about 26,500 lb) at ≥ 4.0% fat and ≥ 3.4% protein. Healthy udders, sound feet and legs and good fertility secure a long productive life. Inbreeding is to be
Opportunities and clear limits
avoided. Use only the sires contained in the uploaded PDF files. Do not use any other data, lists or internet sources. If a sire is not in the sire PDF, it must not be proposed. Please
What this opens up for farms
suggest 3 suitable sires from the semen tank for mating with
Analytical capability that used to be the preserve of special‐
this animal — ranked, with a short justification and a note on
ized advisory structures is now within easier reach of the indi‐
which of the animal's weak points the mating corrects. Then
vidual farm. That does not make professional breeding advice
also produce a short matrix (traffic-light scheme) showing
redundant — quite the opposite. But it does mean a breeder
which of the animal's weaknesses each sire corrects and
can come to a conversation with his advisor better prepared,
which traits remain neutral or carry risk.”
bring his data in more structured form, and question recommendations more critically.
Step 2: photograph the data sheets and/or upload the PDFs
Keeping the limits clearly in view
Load the cow PDF and the sire PDF or PDFs into the chat.
The danger lies in relying on algorithms blindly. Without tech‐ nical knowledge, critical judgment and accountability, artificial
Step 3: read the result and decide The system returns a ranked list of recommended sires with
intelligence can amplify a wrong turn. It remains a tool — what decides the outcome is the attitude, the competence and the integrity of the people using it.
reasoning, plus a traffic-light matrix showing which of the cow's weaknesses each sire corrects. Normally: take the firstranked sire. If he is not available, take the next best.
Getting started without fear of the technology Nobody has to be a technology expert to use artificial intelli‐ gence sensibly. The advice is deliberately simple:
AI & BREEDING
15
Set up an account with a trustworthy artificial intelligence
e.g. neutral analyst, experienced consultant, sparring partner
system — ChatGPT or Gemini, for example.
technical, pragmatic, critical, clear
Start small, with concrete questions out of your own barn and
An example of a four-step prompt:
your own business.
“I am a dairy farmer and I make management decisions for
Talk to it the way you would talk to a person.
my farm (person). My farm keeps about 150 cows and works
Work your way into prompting step by step — and let someone help you.
with milking robots (context). Suggest 5 concrete measures to improve fertility management and give a short reason for each (task). Answer as an experienced, practical consultant
Do not take answers on trust: compare them, sharpen them, ask follow-up questions.
for fertility and herd management — technically sound and easy to follow (role).”
Use the exchange with colleagues, and take the training on offer.
Conclusion: people, experience and artificial
Stay confident: you cannot break anything with artificial intelli‐
intelligence together
gence — but you can think a great deal more clearly. Cattle breeding has always been a combination of technical The best way in is with concrete questions out of your own
knowledge, experience and passion. Those three elements
working day. Export your herd data to a spreadsheet, hand it
are the foundation, and that will not change.
to an artificial intelligence system with a clear question, and you will quickly see what kind of analysis becomes possible.
Artificial intelligence adds a new tool to that foundation: one
It works best where experience, gut feeling and data come
that makes complex volumes of data manageable, gives
together.
structure to decisions, opens up new perspectives and provides analytical capacity that was previously hard to reach.
Practical tip: the four-step prompt formula for a high-quality
Treat it as a sparring partner rather than an autopilot and you
prompt:
will benefit from it.
1. Who am I? — the P e r s o n
The decisive difference is one of attitude. Breeding decisions
In what role or function am I addressing the system?
supported by artificial intelligence are not automated decisions. They are better-informed decisions — made by
e.g. employee, manager, project lead What matters: the
people who have more information, more clearly structured,
perspective I am working from
than before. Responsibility for breeding decisions still rests with the human being.
2. What is this actually about? — the C o n t e x t The future of cattle breeding does not lie in technology alone. What situation am I in? Organization,
farm,
It lies in the interplay of breeding instinct, decades of experi‐ project,
audience
Conditions,
particularities, goal or problem 3. What exactly should happen? — the T a s k
ence and the ability to use new tools intelligently. Master that interplay and you will have a real competitive advantage — not because you have more data, but because you draw better decisions from it.
What exactly do I want the system to do? analyze, structure, explain, compare, draft desired format (list, table, text, guide)
Together you are stronger: people + experience + artificial intelligence.
4. How should it think? — its R o l e In what role should it answer?
16
AI & BREEDING
AI & BREEDING · METHOD
No farm is average Herdenanalyse 360°, Flexi-Herdenindex° and Flexi-Mating° — the tools behind a farmspecific Breeding Planning 360°
H E L M U T D E M M E L H U B E R | M A N A G E M E N T C O N S U LTA N T A N D H O L S T E I N B R E E D E R
Herdenanalyse 360°, Flexi-Herdenindex° and Flexi-
five dairy farms — Holstein, Red Holstein and Fleck‐
Mating° are three artificial intelligence tools that
vieh (German Simmental), 150 to 700 head, with and
build on one another to produce a farm-specific
without genomic data, with milking robots and with a
Breeding Planning 360°. They answer three ques‐
parlor. This article describes how the tools work,
tions in a fixed order: where does this herd stand?
what they deliver, what they cannot do, and how a
Which animals fit its goal? And which sire fits which
farm can try them for itself.
cow? So far they have been used and developed with
Herdenanalyse 360°, Flexi-Herdenindex° and Flexi-Mating° – the artificial intelligence tools behind a farm-specific Breeding Planning 360°
How the tools came about This did not start as a software project. It started with a practical question. A good two years ago a client told me at a seminar that artifi‐ cial intelligence was saving him about forty percent of his working time. At that moment I made a decision: I did not want to be a late adopter again. So I started teaching myself.
It does not start with the number. It starts with the question.
At about the same time, after many years, I bought two breed‐ ing heifers — two Holstein calves, together with a farmer friend near Bremen. That put a very concrete question on the table: what are these animals actually worth? So the first
The breakthrough came through a contact in New Zealand.
attempt was not a mating, it was a market valuation based on
In an article on the trade portal The Bullvine I came across
pedigree and auction comparisons. The result was consider‐
Matthew Zonderop, a dairy farmer in the Waikato with about
ably better than I had expected.
400 KiwiCross cows. He had built an artificial-intelligencesupported mating system on his own — not with an off-the-
The first real breeding question came from the young woman
shelf program, but with data from his own herd out of MINDA,
farming that operation: “Could artificial intelligence help us
the New Zealand herd management system. That first contact
pick the right sire when my husband isn't home?”
turned into a technical exchange that continues to this day.
Out of that came the first prompt — a brief of the kind a sire
What mattered was less any single idea than the confirmation
analyst would write. Analyze this female on the basis of the
of a principle: make your own herd data properly available and
uploaded breeding values. Compare her only with the sires in
you can do breeding work with it, without waiting for a fin‐
this semen inventory. Name the biggest weakness to be cor‐
ished product. That is exactly where the development turned.
rected. Propose three sires in rank order, with a reason for
Individual questions to a language model became a data
each, a traffic light for each trait, and an honest note wherever
extraction routine for PDF documents, that became an inde‐
a requirement is not met. Even that first attempt contained
pendent data basis — and that finally became a chain that
two rules that still hold today: no external data and no
runs from the breeding goal through to the breeding plan,
estimated values.
instead of starting from scratch with every question. A
After that it moved quickly — from the second prompt to full
second independent case, different tools, the same principle.
breeding reports, to purpose-built applications, to the first
By his own account, the genomic total merit level of his herd
pilot farms.
is now well above the national average, and more than half of
And then came the wall. A procedure like this is only as good as the data it is given. Structured access to breeding data did not exist. Everything had to be assembled by hand: from cata‐
the current calf crop comes from the best quarter of his cows. His comment on it — that it is no accident which animals get selected — describes precisely the difference this is about.
logs, from screenshots, from PDF files in every imaginable
The tools this article describes grew out of that sequence: a
format. Without a dependable data basis there is no learning
practical question, an attempt, a wall, an exchange — and
— and without learning there is no meaningful mating optimiz‐
after that, so far, five farms that have put the whole thing to
ation.
the test. Further farms have already come forward wanting these artificial intelligence tools applied in their own herds. A procedure like this is only as good as the data it is given.
Why the order is what matters In practice, breeding planning almost always starts with the
18
AI & BREEDING
question: which sire do I use next on which cow? That is
Breeding Planning 360° as it was carried out on the pilot
understandable, because it is the only one of the three ques‐
farms.
tions that leads straight to a decision. It is simply the third question, not the first.
Step 0 – handing over the data. The farm pulls together what it already has: MLP data — MLP (Milchleistungsprüfung) is the
Two others come before it. Where does my herd actually
German milk recording scheme — breeding values, pedigrees,
stand? And where should it be going? Start at step three and
reports from the robot or herd program, and where possible
you are optimizing toward a goal nobody has examined. That
the culling reasons for several years. In practice this takes a
is precisely why the three tools build on one another: each one
few hours.
produces the basis for the next.
Step 1 – Herdenanalyse 360°. The sober assessment of
The starting problem is rarely a lack of information. An aver‐
where things stand: strengths, limiting factors, culling pattern,
age dairy farm today holds more data about its animals than
relationship structure.
ever before — milk recording, breeding values, pedigrees, insemination records, robot or herd management data, hoof trimming records, and increasingly genomic results. The data simply sit side by side instead of together. The breeding value is in the association portal, the milking data are in the robot, the culling reasons are in the herd program. Each source describes one slice of the same cow. The tools address exactly that gap.
The sequence: from farm data to a breeding plan
Step 2 – Flexi-Herdenindex°. Out of the analysis and a struc‐ tured conversation comes a measurable breeding goal for the farm. Trait weightings, must-have criteria, exclusions, replace‐ ment requirement. Cows, heifers and sires are then ranked against that goal — not against the breed's goal. Step 3 – Flexi-Mating°. For every cow, a reasoned mating proposal with alternatives. What comes out at the end is not a data sheet but a breeding plan — and a consolidated data basis for the herd that for many farms is the first of its kind.
Before the individual tools, here is the practical sequence of a
AI & BREEDING
19
01
TOOL
Herdenanalyse 360° Goal: an honest stocktaking before any recommendation is made.
Fig. 1: Herdenanalyse 360° – interactive dashboard of a sample farm. Key figures, RZG distribution, trade-off spread and herd profile all draw on the same verified data basis; the navigation on the left runs from the herd overview through to selection, weak points and reports. RZG is the German relative total merit index. Anonymized sample data.
The herd analysis brings together what is known about the indi‐
manager assumed the main breeding issue was feet and legs.
vidual cow — in practice six to eight sources that have never
The systematic evaluation pointed more strongly toward the
before appeared together in one table. Depending on what data
udder and toward how well individual cows suited the milking
exist, it looks at production and lifetime production, functional
system in place. The most revealing entries were the unremark‐
traits such as fertility, health and productive life, type and
able ones, such as “otherwise a good cow.” When a fundament‐
suitability for the milking system in place, the genetic structure
ally productive cow has to go because individual traits do not fit
with cow families, sire lines and degree of relationship, and the
the production system, that changes a breeding goal.
culling pattern.
In another analysis, certain problems appeared to cluster in
What the farm gets back: a picture at a glance, as a written
particular cow families. In breeding terms that would have been
evaluation report and as an interactive dashboard — level,
highly interesting. The statistical check showed the cluster
greatest strength, greatest weakness; a trait-by-trait comparison
could also have arisen by chance — and therefore could not be
against the farm's own must-have values; three to five concrete
allowed to become the basis of a breeding decision. Both res‐
genetic levers for this farm; and a picture of the inbreeding
ults belong together: one shows what an analysis can do, the
situation with risk areas and line concentration (Fig. 1).
other where it has to stay silent.
One principle runs through it: every statement carries a confid‐
The benefit: for the first time the farm gets a consolidated, data-
ence level. What is documented is called documented. What
based view of what its herd's strengths and weaknesses are —
was calculated is called calculated. What the data do not sup‐
not by feel, but from its own records. Only once the facts have
port is marked as open — not sold as a finding. Missing values
been named is it possible to judge what should be tackled
appear as a dash and are never estimated. No partial group is
through breeding, through feeding or through management. All
treated as the whole herd.
three routes cost different amounts.
From the pilot farms: one Fleckvieh farm had documented the culling of 668 cows over thirteen years — not scientifically, partly in free text and dialect, but over a long period. The farm
20
AI & BREEDING
02
TOOL
Flexi-Herdenindex° Goal: a ranking that reflects this farm's breeding goal — not the breed's.
Fig. 2: the same sire list, two rank orders. Sire E ranks 5th on RZG — and 2nd on this farm's weighting. The breeding values did not change. The question did.
Official total merit indexes such as RZG, GZW or TPI bundle
It applies to three groups of animals: to the farm's own cows,
many traits into one defined breeding goal and make selection
when deciding which animals should shape the next generation;
across a whole population possible. That weighting is built for
to the farm's own heifers, when rearing places are to be used
the breed. A robot-milking farm with tight heifer-rearing capacity
profitably; and to sire lists for use in the farm's own herd,
and a parlor farm selling breeding stock need different cows —
whatever the supplier.
but they get the same ranking.
From the pilot farms: on one farm there was a very highly rated
The Flexi-Herdenindex° does not replace any official breeding
sire in the semen tank. On a conventional ranking, using him
value and does not change one. It takes the breeding values
more heavily would have been the obvious move. But for the
that exist and weights them according to what the farm actually
trait the herd analysis had identified as particularly relevant, he
needs. Must-have criteria act as a filter ahead of the ranking,
did not deliver the improvement wanted. Other sires fit better.
not as a weighting inside it: a sire that misses a basic require‐
That did not make him a bad sire — they were two different
ment never appears at all. It is not an animal's genetics that
questions.
change — what changes is its significance for this farm.
AI & BREEDING
21
Two rankings of the same herd differ considerably depending
istically confirmed, and verified against a control. A breeding
on whether they are sorted by total merit index or by what the
value is not automatically responsible for a problem just
farm needs. On the pilot farms, of the twenty top-ranked anim‐
because of what it is called.
als in each case, often only a few appeared on both lists (Fig. 2).
The benefit: the farm selects for the traits that demonstrably work in its own herd — instead of the ones that ought to fit by
A further check produced what is perhaps the most surprising
name. Where rearing places are tight, that pays off immediately:
result of the work so far. The breeding values that, by their
every place one animal occupies is no longer available to
name, should have been responsible for a farm's main problem
another.
predicted nothing there. Two entirely different traits did — stat‐
03
TOOL
Flexi-Mating° Goal: the right sire for each individual cow, without losing sight of the herd goal.
Fig. 3: extract from a mating recommendation — three ranked proposals per cow with reasoning, the trade-off stated, and an inbreeding check for that exact pairing.
Every cow is looked at individually: what does she lack, what
Two rules are built in permanently. Every cow gets several
does she bring, and who is she related to? For every cow-sire
ranked proposals with reasoning — never just one name, and
combination the system checks the inbreeding coefficient,
never the answer that no suitable sire exists. And a usage limit
genetic defects and genetic particularities, that cow's specific
per sire, set by the farm, caps the concentration of individual
strengths and weaknesses, and the farm's requirements on
lines (Fig. 3).
semen type and replacement needs.
That second rule has a concrete origin. On one Red Holstein farm the requirements of the breeding goal had been translated into hard exclusion thresholds so consistently that on the first run no suitable sire was left for 96 of 101 cows. Mathematically explicable, worthless to the farm. Today a strict distinction is
22
AI & BREEDING
made between genuine exclusion criteria — wrong semen type,
Born out of practice: one farmer objected that with too high a
carrier conflict, inbreeding coefficient too high — and traits
share of beef semen he would have no replacements in two
where a trade-off is weighed.
years. He was right. Today the actual replacement requirement
What a sire's name does not tell you: on one pilot farm certain combinations looked entirely unremarkable — different names,
is calculated and the beef semen share is capped before any cow is bred.
apparently enough distance between the lines. Only a compar‐
The benefit: the assignment is backed by reasoning that can be
ison of the ancestors revealed closer common descent. The ten
followed and explained in the barn — to employees as much as
most frequent ancestors there accounted between them for
to the AI technician. A recommendation that says what is to be
more than forty percent of the gene pool. Relationship analysis
improved, which strength has to be preserved and where the
is therefore a fixed part of the mating logic and not an optional
compromise lies can be examined on its merits and rejected
extra: an unwanted rise in inbreeding cannot be taken back in
with reasons. A sire's name on its own cannot do that.
the next generation.
The mathematically perfect solution is worthless if it does not work in the barn.
helps bring together large and very different bodies of data, make relationships visible and present results in a form people can follow. It does not know the farm first-hand, it carries no responsibility, and it must not declare a hypothesis a finding merely because it sounds plausible. The data describe the herd. The computational models structure and compare. The breeder decides.
What the pilot farms have shown — and what is still open On four of five farms the analysis produced at least one find‐ Three tools that build on one another.
ing nobody had expected. On one farm the result of the sire selection was that the semen inventory on hand largely
What links the three tools
covered the coming requirement and there was a gap in only one area — no long shopping list was needed. In nearly every
The real difference from stand-alone evaluations lies not in
analysis, moreover, the first thing to appear was a set of
the tools themselves but in how they connect. Each step
strengths the farm manager was not aware of, and which can
hands its result to the next in structured form: the trait weight‐
quietly be lost while optimizing some other trait.
ings, the must-have thresholds, the areas to improve, the replacement requirement. Nothing is retyped, nothing is entered twice. From the breeding goal down to the individual cow-sire combination it stays traceable why a proposal looks the way it does.
Just as often it was not the farm that had to rethink but the computational logic that had to change. One breeder con‐ sidered an exclusion rule too severe — it would have screened out sires she knew from experience to be suitable. She was right; the hard minimum requirement became a target corridor
Just as important is keeping the levels apart. Weighting,
with an upper limit. Another breeder warned that optimizing
standardization and ranking are calculated deterministically
too hard would produce an ever more uniform herd. That was
and reproducibly — not generated in language. Relative values
also correct: one rule favored broadly usable sires so strongly
and absolute values are treated differently; adding them
that it screened out exactly the specialists who could have
together naively would be technically wrong. Sires from differ‐
corrected a particular weakness. It was replaced. One farm
ent breeding systems are evaluated separately and flagged as
manager merely asked where a figure came from — and in
converted, never mixed into one common ranking. That is the
doing so exposed a link built on animal names instead of ear
practical difference between systematic breeding planning
tag numbers. Since then everything is linked through the
and asking a chatbot: “Which sire would you take?”
lifetime animal ID alone.
Artificial intelligence has a clear and limited role in this. It
Being honest about it means saying what is not yet proven.
AI & BREEDING
23
The first calves mated under this procedure have not yet been
gree, relationship, genetic concentration and the semen
born. Five farms and the observation period so far are not
inventory on hand are to be looked at together for once — par‐
enough for a dependable statement about additional genetic
ticularly where genetics from different suppliers or breeding
progress. That is why what was expected is documented from
systems are used. And explicitly also farms that are already in
the outset — otherwise there is nothing to compare against
good shape genetically. Not every analysis has to find a weak‐
later. The next development step is validation against larger
ness. It can confirm that a strategy is working, and it can
real-world data sets. With artificial intelligence applications in
name strengths the farm manager was not aware of — in
animal breeding in particular, professional seriousness means
almost every pilot analysis that was exactly the case. Know
distinguishing between what works today and what still has to
those strengths and you can preserve them deliberately at the
be demonstrated.
next selection decision, instead of quietly losing them while
It is not the algorithm that decides whether the procedure holds up. The cows show that.
optimizing something else. Across all three starting positions, the same questions stand at the end: – What actually characterizes my economically and functionally best cows? – Which animals should shape the next generation — and which heifers do I keep when places get tight? – Which traits limit my herd, and can they be influenced through breeding at all? – Do the sires I am using today fit my farm's breeding goal — and does my semen inventory cover the coming require‐
Five farms, five starting points: structure beats template.
ment? – How broad is my genetic base, and where do relationship
Which farms this is worth it for Breeding Planning 360° is not aimed only at farms with an obvious problem. The approach is interesting anywhere the data that exist, the breeding goals and the actual decisions are to be tied together more tightly. Three starting positions can be distinguished from the analyses so far. First: open questions in the herd. Cows leave earlier than wanted and the causes are not clear-cut. More heifers are reared than are needed in the long run. Or it is unclear which animals should particularly shape the next generation. That is
risks arise? – Which cow will my farm need in five or ten years? Not every farm needs the same scope for that. The analysis follows the question asked and the data actually available. A fully genotyped herd opens up options that a herd with mainly production, pedigree and culling data does not. Both can be evaluated. The decisive point is therefore not whether a farm has a prob‐ lem. It is whether it wants to put its breeding decisions on a clearer, farm-specific footing.
the obvious occasion — and the one where a farm's own data most often surprise it. The Fleckvieh farm with the 668 docu‐ mented cullings was looking for its main issue somewhere other than where its own records located it. Second: changes on the farm. Moving to an automatic milking system, a planned expansion, rearing places getting tighter, a higher share of sexed semen or of beef breed matings, a reori‐
More pilot farms wanted After the first five herds the work moves into its next phase. More dairy farms are wanted, and explicitly across breeds: alongside Holstein, Red Holstein and German Fleckvieh, Brown Swiss and Jersey herds are equally welcome.
entation of the breeding goal. Changes like these shift what is
What is wanted is ordinary farms with different starting posi‐
asked of the cow — and with it the question of which genetics
tions, breeding goals, sizes and data situations: farms with
will fit the farm in future. Breeding works slowly: notice only
and without herd-wide genomics, robot-milking farms as well
after the rebuild that your breeding goal is still the old one and
as conventional milking systems, breeding-oriented herds as
you have lost a generation.
well as straightforward production farms. A farm without a
Third: systematic development. Herds in which many sires and lines have been used over the years and in which pedi‐
24
single genotyped cow was one of the most demanding cases in the work so far — and it could still be evaluated, because realized production data, milking system data, pedigrees and AI & BREEDING
culling records carried the gap. The farm receives a complete analysis of its herd, a farm-spe‐ cific breeding goal, its own ranking and concrete mating pro‐ posals — along with the tools to carry on by itself afterward. In return, its feedback goes straight into further development. That is how every substantial improvement so far has come about.
Flexi-Herdenindex° – setting the goal and ranking Which animals and which genetics fit this farm's breeding goal? Farm-specific weighting based on the defined herd breeding goal and the official breeding values, with musthave criteria as an upstream filter. Applies to: the farm's own cows, the farm's own heifers, sire lists whatever the supplier. Flexi-Mating° – the individual mating
A first conversation serves only to clarify the question and the data available. Before anyone talks about sires.
Which sire fits which cow — and why? Several ranked propos‐ als per cow with reasoning, an inbreeding check for each pairing, a farm usage limit per sire.
T H E T H R E E T O O L S AT A G L A N C E
Herdenanalyse 360° – where the herd stands Where does the herd really stand? Which strengths have to be preserved, which factors limit it, and which of those can
Takes into account: cow profile, herd goal, relationship, genetic defects, semen type, replacement requirement. Independent of supplier and breeding organization. More information: www.dairytalk.info/zuchtplanung-360
be influenced through breeding? Basis: MLP, breeding values, pedigree, milking system and herd management data, culling pattern, genomic data and anything else available.
SOURCES (SELECTION) ICAR (International Committee for Animal Recording): Guidelines for dairy cattle recording and Section on Functional Traits. vit Verden: Zuchtwertschätzung Milchrinder – methodological description and current evaluation results (German dairy genetic evaluation). ZAR/ZuchtData: Zuchtwertschätzung Fleckvieh – total merit index and sub-
Fleckscore: linear type classification in Fleckvieh. Wright, S.: Coefficients of inbreeding and relationship – methodological basis of the relationship calculation. Practical basis: analyses and experience from the author's consulting practice, 2026.
indexes (Fleckvieh genetic evaluation for Germany and Austria).
AI & BREEDING
25
A I & B R E E D I N G · DATA R I G HTS
My animals – my data? Data sovereignty in modern cattle breeding – between the EU Data Act, cooperative principles and the question of who decides about the most valuable resource of the future
H E L M U T D E M M E L H U B E R | M A N A G E M E N T C O N S U LTA N T A N D H O L S T E I N B R E E D E R
Our cows no longer produce only milk. They produce
future of cattle breeding. And that is exactly why the
data. Every calving, every insemination, every test
question of who gets to decide how those data are
day, every genomic test, every activity reading, every
used stopped being a technical question long ago. It
hoof treatment — all of it leaves digital traces that
is strategic, it is legal, and at its core it is a question
are steadily turning into economic value. Whoever
about what a cooperative is for.
controls those data controls a substantial part of the
1. The cow becomes a data generator D ATA C AT E G O R I E S I N M O D E R N C AT T L E B R E E D I N G
A cow's breeding record used to consist of a few handwritten entries: pedigree, calving date, milk yield. Today a single animal can have thousands of data points stored against it — from the tissue sample taken at birth, through daily sensor readings at the milking robot, to a genomic evaluation based on several hundred thousand SNP markers. That density is not a fringe phenomenon. It is the result of a technological transformation that has reached every part of dairy farming over the past ten years: genomics, precision farming, automated milking and feeding systems, hoof sensors, activity monitoring, heat detection, health monitor‐ ing. Every one of those technologies generates data. And every one of those data categories has a value — not only for the individual farm, but for AI studs, breeding organizations, software vendors, consulting firms and, increasingly, artificialintelligence-based analysis systems.
Animal data • Pedigree, performance recording, type, fertility, health data Genomic data • SNP profiles, haplotypes, genomic breeding values (RZG, the German relative total merit index, and its sub-indexes) Farm data • Milking robot logs, feeding data, sensors, hoof trimming, group management Advisory data • Mating lists, selection decisions, management recommend‐ ations Population data • Aggregated data from reference populations, estimated parameters for breeding value models
The milk stays in the tank and is paid for within a few days. The data stay in databases — and their value can rise for dec‐ ades.
These categories differ fundamentally — not only technically, but legally and economically. Genomic raw data arise directly
KEY POINT
data are not a by-product of modern dairy farming. They are a factor of production in their own right — and their economic value will keep growing.
from the animal. Genomic breeding values only come into existence when those raw data are linked to a reference popu‐ lation and to a statistical model that the breeding organization developed and operates. The whole debate about data access and data sovereignty hangs on that distinction.
So who actually generates these data: the farmer, the cow, the cooperative, the laboratory or the algorithm? The honest answer is: all of them together. And that is precisely where the problem lies.
KEY POINT
data do not arise at a single point — they arise along an entire value chain. Look only at the beginning or only at the end of that chain and you have missed the point. The herd becomes readable — the question is, for whom.
2. Which data arise — and who generates them?
3. The data value chain
Before anyone can talk about rights in data, it is worth under‐
the whole chain from animal to breeding value — and at the
standing which data actually arise in modern cattle breeding
question of who creates value where, and who shares in it.
To see why the data debate is so complex, it helps to look at
— and who is involved in producing them.
AI & BREEDING
27
Animal & farmer
Sample & lab
Database
Algorithm
Breeding value
Advice
Semen sales
Raw data
SNP profile
Storage
Model
RZG value
Mating
Revenue
Farmer
Laboratory
Organization
Organization
Organization
Advisor / org.
AI stud
Value is created at every stage of that chain — and a different
• Who may access the data, and in what format? Increasingly
party is involved at each stage. The farmer supplies the
governed by the EU Data Act.
animal and the sample. The laboratory supplies the SNP pro‐
Data portability
file. The organization supplies the database, the algorithm and the calculated breeding value. The advisor uses that value for mating recommendations. The AI stud sells semen on that basis. The interesting question — and it is also the uncomfortable one — is this: who shares in that value? And in proportion to which contribution? For the farmer it looks like this. He pays for the genomic test. He keeps the animal. He carries the economic risk. Through
• The right to receive your own data in a machine-readable format and pass them on. Familiar from the GDPR; the EU Data Act extends the principle considerably. Data sovereignty • The overarching principle: who decides how data are used? Not necessarily the party who generated them — but increasingly a policy goal.
membership fees and testing fees he funds a substantial part of the data collection. At the end he gets a PDF or a view in a data portal. Anyone who wants to use the data in a machinereadable format for his own analyses often runs into a wall.
The real question is therefore not: who owns the data? It is: who gets to decide how the data are used? That is a decisive difference — and it is the starting point of the European Data Act.
KEY POINT
whoever supplies the raw material should at least have a say in what happens to it. That is not a radical demand — that is fairness.
KEY POINT
who owns something is a question of property. Who gets to decide about it is a question of power. In the data economy of the twenty-first century it is almost always the second one that matters.
4. Who owns data at all? The legal reality Most farmers would answer instinctively: my animal's data belong to me. The intuition is understandable — and in legal terms largely wrong. Unlike a barn, a tractor or a cow, data are not a thing under German or European law. There is no classical ownership of data. Lawyers therefore speak today, more precisely, of rights of use, rights of access, data portability and data sovereignty — four terms, each aimed at a different aspect of control over data.
FOUR KEY LEGAL TERMS
Every sensor creates a claim.
Rights of use • Who may use the data, and for what purposes? Usually follows from contracts and terms of business. Rights of access
5. What does the EU say? The Data Act and what it means for cattle breeding The EU Data Act came into force in February 2024. It is the European Union's most comprehensive set of rules so far on
28
AI & BREEDING
who may access data generated through the use of digital
firmer legal ground under the Data Act than it did before. That
products and services. The original thinking was mainly about
is not a threat to the organizations — but it is a change they
farm machinery, tractors, milking robots and sensors — smart
have to adjust to.
farming, in other words. But the philosophy behind it reaches further. KEY POINT
The Data Act sets out a clear principle: whoever uses a
for the first time, the EU Data Act gives farmers' intuitive
product or a service and generates data in doing so should be
sense of fairness a legal footing. This is not an attack
able to access those data. He should be able to decide whom
on the organizations — it is a recalibration of the terms
he grants access to. And he should not be made structurally
of access.
dependent on individual providers who control his data. In concrete terms, the Data Act requires manufacturers and platform operators, among other things, to give users access to data in machine-readable formats and to make switching data to another provider easier. Protected algorithms and the findings derived from them may still fall under trade secret protection — but the raw data the user generated himself do not, not without further argument.
6. The breeding organizations' counterarguments — and why they are valid A fair analysis of this subject has to take the other side seri‐ ously. The breeding organizations have arguments that hold up — and they are not merely an expression of self-interest. A genomic breeding value does not come out of a cow's hair
T H E E U D ATA A C T – T H E K E Y P O I N T S F O R C AT T L E BREEDING
What the Data Act requires: • Users get access to the data they generate by using a sys‐ tem
sample alone. Behind it stand enormous reference popula‐ tions built up over decades, demanding computing centers, scientific models that are continuously recalibrated, and con‐ siderable investment in data quality assurance and infrastruc‐ ture. Without that collective infrastructure, genomic evalu‐ ation would not be possible — the SNP profile of a single
• Data must be provided in machine-readable, interoperable
animal would have no interpretable value without a reference
formats
population.
• Providers must not structurally obstruct a switch of data to competitors
The organizations therefore argue, rightly: the raw data come from the farmer. The breeding values calculated from them
• Passing data to third parties is the user's decision
are the result of our work and our investment. The EU Data
What the Data Act expressly does not require:
Act expressly acknowledges that position too — algorithms
• Disclosure of proprietary algorithms and calculation mod‐
and derived findings remain protectable.
els
The problem does not arise when organizations protect their
• Disclosure of the trade secrets of the organization
algorithms. The problem arises when organizations use the
processing the data
same argument to refuse access to the farmer's own raw data
• A right of access to aggregated population data from other farms
— even though those data are not their intellectual property at all.
For cattle breeding that means: • Genomic raw data (SNP profiles) → a farmer's right of
W H AT I S L E G I T I M AT E – A N D W H E R E T H E L I N E R U N S
access is very likely
Legitimate: protecting your own calculation models and
• Calculated breeding values → right of access likely, model protection remains • Reference population and algorithm → stay with the organ‐ ization
algorithms Legitimate: protecting aggregated population data from other farms Legitimate: protecting the breeding value infrastructure against free riding Not legitimate: refusing a fee-paying member access to raw
For organized cattle breeding this means something specific: a farmer's claim to receive his animal's genomic raw data in a CSV format and use them for his own analyses rests on far
AI & BREEDING
data on his own animals Not legitimate: structural dependency through proprietary data formats with no technical justification
29
Not legitimate: holding data as a means of tying members in rather than as a service
KEY POINT
organizations that protect their models are doing the right thing. Organizations that protect their members' data — from their own members — are confusing custody with ownership. At the end stands the animal, not the file.
7. Three future scenarios — and which one is likely What might the data landscape of cattle breeding look like in ten years? There are essentially three scenarios, and they differ considerably in their consequences for farmers, for organizations and for breeding as a whole.
Feature
Model A – closed world
Model B – controlled openness
Model C – full sovereignty
Data access
Only through the organization
CSV export on request
Farmer manages it himself
Choice of advisor
Association advisors only
External programs permitted
Free choice of any service provider
Sharing data
Organization decides
Farmer decides
Farmer decides
Openness to innovation
Low
Medium
High
Data security
High (central)
Medium
Depends on the farmer
Compatible with the EU Data Act
No
Yes
Yes
Model A — the closed world — is in effect still the reality in many organizations today. It offers stability and data quality assurance, but it creates structural dependencies that are becoming increasingly hard to defend under the EU Data Act.
KEY POINT
controlled openness is not a compromise between two extremes. It is the model that comes closest both to the
Model C — full data sovereignty for the farmer — is theoretic‐
logic of the EU Data Act and to the founding idea of the
ally consistent but risky in practice: hold all data in a decent‐
cooperative.
ralized way and you lose the reference population, without which genomic evaluation does not work. That route would make the weakness of the individual farm against the collect‐ ive infrastructure visible all over again. Model B — controlled openness — is the most likely and the most sensible scenario. The farmer gets access to his own animal and genomic data in machine-readable formats. He can use external programs, produce his own analyses and steer his own data flow. The organization goes on protecting its models and the aggregated population level. Both sides keep what belongs to them.
8. The cooperative question: administering or enabling? Cooperatives were founded to give farmers more independ‐ ence and more market power. That was their basis for doing business. Whether they still follow that mandate consistently today is not a sentimental question — it is a strategic one. In the context of the data economy it comes out like this: if data become the most important resource in the cattle breed‐ ing of the future — should cooperatives administer data on behalf of their members? Or should they enable their
30
AI & BREEDING
members to use those data on their own terms? The difference is not trivial. An organization that administers data makes decisions about access, format and onward shar‐ ing. An organization that enables its members builds infra‐ structure, explains how things fit together, builds tools — and hands control back to where the data arose. The first role is more comfortable. The second is truer to what a cooperative is. And it is also the smarter business. In a world where external data platforms, artificial-intelligence-based analysis services and international genetics companies increasingly compete for access to farmers' data, organizations that strengthen their members' handling of data will generate more trust, and with it more loyalty, than those that treat data primarily as a resource of the organization.
of the future — the question is who mints it The question of who owns the data of modern cattle breeding cannot be answered simply in legal terms — and it cannot be resolved simply in political terms either. But it can be asked honestly. And that is the first step. The answer that does this subject justice is not: the data belong exclusively to the farmer. It is: the data arise jointly — but the farmer should be able to decide for himself who may use them and in what format they are made available to him. That is not a radical position. It is the basis the EU Data Act is built on. It is the logic the cooperatives were originally committed to. And it is the precondition for organized cattle breeding to go on playing, in a data-driven agriculture, the central role it still holds today. The farms of the future will produce enormous quantities of
KEY POINT
enable your members and you stay relevant. Administer
valuable data. Whoever controls those data will help shape cattle breeding. The only question is who that should be — and whether farmers really will be the ones at the wheel.
their data without involving them and sooner or later you will be replaced by providers who do it better.
If data become the most important resource in the cattle breeding of the future — should cooperatives administer data on behalf of their members, or enable their members to use those data on their own terms?
Conclusion: data are the currency
SOURCES (SELECTION) Regulation (EU) 2023/2854 of the European Parliament and of the Council on harmonised rules on fair access to and use of data (Data Act), OJ L 2023/2854. Regulation (EU) 2016/679 (GDPR): Article 20 – right to data portability. European Commission (2022): Data Act – Proposal and Impact Assessment. Brussels. ICAR (2022): Guidelines for genomic data management and interoperability. Rome.
AI & BREEDING
vit (2024): Zuchtwertschätzung Rind – explanatory notes and methods (German dairy genetic evaluation). Verden. Meuwissen, T. H. E. et al. (2001): Prediction of total genetic value using genome-wide dense marker maps. Genetics 157. European Parliament (2023): Report on the Data Governance Act and its application in the agricultural sector. Practical basis: experience from the author's consulting practice and the DairyTalk analyses.
31
FA R M & E C O N O M I C S · T E C H N I C A L A R T I C L E
Which breed fits which farm? Holstein, Fleckvieh, Jersey and Brown Swiss compared on the numbers
H E L M U T D E M M E L H U B E R | M A N A G E M E N T C O N S U LTA N T A N D H O L S T E I N B R E E D E R
Breed choice used to be a question of region, of tra‐
Swiss pursue fundamentally different breeding
dition, or simply of whatever semen was on offer.
goals. Put the wrong animals in the wrong barn and
Today it is a strategic decision with measurable eco‐
you lose money. Choose the right ones and you gain
nomic consequences. Holstein, German Fleckvieh
stability and return.
(German Simmental), Jersey and Braunvieh / Brown
Four breeds — four concepts Choosing the right breed is one of the most consequential management decisions in dairy farming. It touches not only production and genetics, it reaches deep into the economics
balance between milk, beef and fitness. With production from 7,000 to over 10,000 kg of milk (about 15,400 to 22,000 lb) combined with strong growth performance, the breed offers a combination that gets underrated in comparisons based on volume alone.
of the business: feed costs, replacement rate, calf revenue,
One point matters in particular: Fleckvieh calves fetch consid‐
health costs — all of it ties directly back to the breed.
erably higher prices on the market than Holstein calves. On
Four breeds dominate dairy farming in the German-speaking countries, and they follow clearly different concepts.
farms where calf revenue plays a meaningful role, that shifts the gross margin picture substantially in Fleckvieh's favor. On top of that comes a robustness that absorbs management mistakes better.
Holstein — maximum milk production with functional protection Holstein is the highest-producing dairy breed in the world. Genetic potential of 10,000 kg of milk (about 22,000 lb) and more is standard today, and top animals go well beyond that mark. Modern breeding programs long ago moved past rais‐ ing volume alone: fertility, productive life, udder health and metabolic stability are an integral part of the breeding goals —
Jersey — efficiency and components in focus At around 7,000 kg of milk (about 15,400 lb), Jersey cows deliver less volume but score with extremely high compon‐ ents: around 6% fat and over 4% protein. In component-based milk pricing and in cheese marketing, those are decisive advantages.
expressed in Germany in the RZG, the German relative total
Their small body size cuts maintenance costs noticeably. Jer‐
merit index, and internationally in TPI and LPI.
seys are regarded as particularly feed-efficient — an argument
The decisive factor with Holstein: the breed is less forgiving of management mistakes. Variable forage quality, patchy reproductive monitoring or insufficient cow observation show
above all for grazing-based or forage-limited systems. The flip side: weaker calf and cull values, and a clear disadvantage where milk is paid for primarily by volume.
up quickly in rising veterinary and replacement costs. Keeping Holsteins successfully takes a consistently run farm and health system.
Braunvieh / Brown Swiss — longevity and protein Braunvieh and Brown Swiss occupy a middle position, with a clear orientation toward protein and productive life. The breed scores particularly on lifetime production: where Holstein cows are often replaced after three or four lactations, wellmanaged Brown Swiss herds stay in production longer. The economic advantage often only shows up in a multi-year calculation: lower replacement costs, stable health and a favorable casein profile for cheesemaking add up across the lactations.
The breed does not decide alone. But it does decide with you.
German Fleckvieh — the economical allround cow
Side by side: strengths, weaknesses and where each fits The following overview summarizes the central differences between the four breeds:
German Fleckvieh follows a fundamentally different concept:
FA R M & E C O N O M I C S
33
Breed
Breeding goal
Main strength
Farm focus
Distinctive feature
Holstein
Milk production + function
Maximum milk
Intensive farm
Fastest genetic progress
German Fleckvieh
Balance of milk/beef/fitness
Versatility
Mixed systems
Highest calf revenue
Jersey
Efficiency + components
Fat & protein
Grazing / efficiency
Highest feed efficiency
Braunvieh/BS
Protein + longevity
Productive life
Sustainable systems
Best for cheesemaking
Table 1: comparison of the four main dairy breeds by breeding
works well: each breed is given 1 to 5 points per criterion. The
goal, strength and where they fit on the farm.
comparison does not replace a proper economic analysis — it makes the logic behind a decision visible.
Putting numbers on it: a simplified scoring model For a practical farm-level comparison, a simple scoring model
Criterion
Holstein
Fleckvieh
Jersey
Brown Swiss
Milk volume
5
3
2
3
Fat / protein
3
4
5
5
Feed efficiency
3
4
5
4
Calf revenue
2
5
2
3
Health stability
3
4
4
5
Productive life
3
4
4
5
Management demand
2
4
4
4
Table 2: simplified scoring model for comparing breeds (1 = low, 5 = very strong). How to read it: a majority of points in a column shows where that breed has the advantage.
Replacement costs, driven by productive life Holstein wins the comparison on milk volume — but loses on health and fertility costs where management is patchy. Fleck‐
The most economical breed is not the same everywhere. It is
vieh scores on the breadth of its revenue base. Jersey is con‐
the breed that best fits the milk pricing system, the forage
vincing in component-based systems and falls behind where
base, the barn and the management.
milk is paid by volume. Brown Swiss often shows its strength only in the multi-year average, through low replacement rates
Gross margin decides — not lactation yield
and stable health.
A common mistake in breed comparisons is looking only at milk volume. What decides the outcome is gross margin per cow per year — and that comes out of several levers. Milk revenue (volume × price, depending on the pricing sys‐ tem) Calf revenue and the cull cow's share of revenue Feed and forage costs Animal health and breeding costs
34
It is not lactation yield that pays the bill.
FA R M & E C O N O M I C S
Which breed for which farm?
Crossbreeding as a strategic option
A farm analysis should start from four central questions:
For farms with concrete fertility or health problems, cross‐
Marketing: is milk paid for by volume or by components? Are calf prices a meaningful part of revenue? Feeding: is an intensive feeding system with high-quality silage available — or is the farm forage-based?
breeding can be a legitimate short-term strategy. Holstein × Jersey or Holstein × Fleckvieh show measurable heterosis effects in fertility and lifetime production. But crossbreeding requires a clear rotation plan and a long-term breeding pro‐ gram — otherwise genetics blur across several generations.
Management: is consistent fertility and health management in place, or is the farm relying on robustness and a low level of intervention?
Conclusion: genetics deliver production — the system decides the profit
Location: intensive freestall barn, grassland site or grazing system?
The breeding goals of modern dairy breeds are clearly eco‐ nomic in their orientation, but they differ fundamentally in
Those four parameters make the breed choice almost inevit‐
emphasis. Holstein optimizes for maximum milk volume,
able. Analyze all four consistently and you will not make bad
Fleckvieh for balance, Jersey for efficiency and components,
decisions.
Brown Swiss for stability and longevity. What matters is not the search for the “best” breed — that
Opportunities and clear limits
question is wrongly framed. What matters is the question of the right combination of genetics and farm strategy: which
Where a single breed becomes risky In practice, purebred herds are the norm — but not always the optimum. Farms that commit their whole herd to a single breed without questioning the farm system risk a structural
breed works most efficiently in my system? Which animals deliver the highest gross margin under my specific condi‐ tions? Do not pick the best breed — pick the one that fits the farm.
mismatch. A Holstein herd on a poorly run farm with weak for‐
Answer that question consistently, and bring breed choice into
age quality will deliver poor results year after year — not
line with the pricing system, the forage base and the manage‐
because of the breed, but because of the mismatch between
ment, and the business will succeed over the long run —
the genetics and the reality of the farm.
whatever breed is on the sign at the gate.
FA R M & E C O N O M I C S
35
A N I M A L H E A LT H · P R A C T I C E
What a lost quarter really costs Teat injury, chronic mastitis, the three-quartered cow: what the literature gives us on recovery, compensation and the culling decision
H E L M U T D E M M E L H U B E R | M A N A G E M E N T C O N S U LTA N T A N D H O L S T E I N B R E E D E R
A permanently lost udder quarter does not automat‐
how to live and calculate with a three-quartered cow.
ically end a cow's productive life. It changes her pro‐
It rests on published studies, on the genetic evalu‐
duction, her somatic cell count, and the arithmetic
ation documentation of vit — the German dairy
that decides whether she stays. This article works
genetic evaluation center — and on the culling stat‐
through four questions in a fixed order: what can be
istics for the vit region. The argument is methodolo‐
prevented, what has to happen in the first hours after
gical, not drawn from the author's own farm cases.
an injury, what three quarters actually deliver, and
Prevention, first response, milking on, doing the math: what a
phase of at least 150 milliseconds, and an air admission
farm actually controls when a teat is injured, mastitis turns
within the ISO range of 4 to 12 liters per minute.
chronic, and a quarter is lost
Teat condition is an early indicator, not a cosmetic issue. A systematic review of 18 papers concludes that severe teat-
Two routes to the same place
end hyperkeratosis is a risk factor for both clinical and sub‐
A kick from the neighboring cow, a teat caught on the barn fittings, a crush in the headlock — those are the pictures that come to mind first with a three-quartered cow. They are not wrong, but they are only half the story, and probably not the bigger half.
clinical mastitis. Among the figures reported are a 2.28-fold odds of clinical mastitis and a 6.01-fold odds of mastitis caused by Escherichia coli; for mild to moderate keratosis, by contrast, the association with somatic cell count was rather favorable.4 So not every degree of keratosis is a problem — severe keratosis is. It can be scored without any equipment:
The second route is quieter and takes longer. A quarter becomes inflamed, is treated, settles down, flares up again. At some point the question is no longer whether it can be treated once more, but whether it should be. That this is the more common route is clear from the indications under which quar‐ ters are dried off: in a German study of 25 quarters on ten farms in North Rhine-Westphalia, 17 cases had recurrent mastitis behind them and a single one a teat lesion.1 Focus only on the kick and you are working on the rarer cause. One caveat first. How common three-quartered cows are in German herds is not documented — there is no survey on it, neither from milk recording nor from herd health programs, only clinic populations and single-farm evaluations. Anyone
twenty teats straight after take-off, once a month, always the same group. On safe footing the evidence gets thinner. A German-language literature review on preventing teat injuries cites a firmly attached udder carried above the hock, non-slip flooring, com‐ fortable lying surfaces, avoiding metabolic disorders, regular hoof trimming, serviced milking equipment, not overmilking, and udder supports and hobbles.5 The paper dates from 2002 and quantifies no risk measures. I found no peer-reviewed paper that sets freestall dimensions or flooring against the risk of mechanical teat injury. The measures are plausible and standard in advisory work — but documented in the sense of a quantified risk reduction they are not.
who quotes a figure here is estimating. The order of magnitude at the other end can be documented.
THE LEVERS BEFORE THE DAMAGE
In the 2024/25 recording year, udder disease accounted for
1 S E T TA K E - O F F E A R L I E R
12.8 percent of all cullings in the vit region and milkability for
400 to 600 grams per minute cost no milk. Take off at 200
2.5 percent — third place behind infertility and feet. The share
grams and you are milking teat tissue dry instead of the
rises with herd level, from 7.8 percent in herds up to 6,999 kg
udder. The setting sits in the control unit and is changed in
to 13.7 percent above 10,000 kg.2 Raise the production level and you raise the udder problem with it.
five minutes — with the milking equipment technician, not on your own. 2 H AV E T H E S Y S T E M T E S T E D A N D W R I T E T H E NUMBERS DOWN
Prevention: the levers in the barn
System vacuum, pulsation rest phase, air admission. The test report belongs in the file. Without a previous value there
The three-quartered cow usually gets discussed once she is already standing there. But a farm has more influence before than after, spread across four areas: milking equipment, teat condition, safe footing and drying off. The milking equipment has the hardest numbers behind it — and it is the area where nothing has been adjusted on many farms for years.
is no way to say next time whether anything has changed. 3 STOP OVERMILKING
Attach only once milk is flowing, no hand stripping on a quarter that is already empty. Not a technical problem but a question of the standing instruction in the parlor. 4 S C O R E T E AT E N D S M O N T H LY
Take-off threshold first. A review of milking machine settings
Twenty teats straight after take-off, always the same group,
concludes that taking the unit off at 400 or 600 grams of milk
the result on a sheet of paper. If the share of severe keratosis
flow per minute shortens milking time without any negative
rises, that is a signal to the milking equipment — long before
effect on yield or composition; a take-off threshold of 800
the cell count reacts.
rather than 200 grams per minute substantially reduced tissue
5 F LO O R I N G , F E E T, M E TA B O L I S M
thickening and hyperkeratosis at the teat end. Translated:
Secure footing in the alley and at the feed fence, regular hoof
most systems overmilk at the end, and that costs teat tissue
trimming, no unsteady cows. A cow that gets up confidently
without producing milk. The same paper cites a system
steps on her own teat less often.
3
vacuum of at least 30 to 32 kilopascals, a pulsation rest A N I M A L H E A LT H
37
6 T R E AT D RY I N G O F F A S A J O B I N I T S O W N R I G H T
later leaves the herd for exactly that reason. These are also
On 765 German farms the median new-infection risk over the
patients of a university clinic: animals get referred where the
dry period was 24 percent in the north, 25 percent in the east
trip to the clinic is worth making.
and 8 percent in the south, with very wide variation between farms.6 The variation is the message: the difference between
The lever sits before the clinic. In a prospective study of 106
farms is bigger than the difference between regions.
lactating cows, the risk of fistula formation was 8.3 times
Points 1, 2, 4 and 6 are documented. Points 3 and 5 come
higher when the teat was sutured 48 to 72 hours after the
from a literature review with no quantified risk measures —
injury rather than within 24 hours. Suture material and suture
professionally uncontroversial, but without an effect size.
technique, by contrast, had no effect.12 The paper comes from Iran and from a grazing system; the absolute level of risk does not transfer to German freestall herds, but the direction does.
What breeding can get hold of is above all udder attachment.
What counts is the hour, not the suture material. See a bleed‐
In 29,284 French Holstein first-lactation cows, udder depth,
ing teat on Friday evening and wait until Monday and you have
fore udder attachment and udder balance were favorably
already decided the outcome.
associated with somatic cell score and clinical mastitis, with genetic correlations between −0.29 and −0.46.7 The heritabilit‐ ies in the German genetic evaluation are usable: udder depth
T H E F I R S T H O U R S A F T E R A T E AT I N J U RY
0.33, front teat placement 0.26, rear 0.23. That a deep udder
1 S P OT I T B E F O R E M I L K I N G
8
gets stepped on more often is plausible but not quantified. The breeding route is the slow one in any case — for the cow standing at the parlor tomorrow morning with blood on the unit it is of no help at all. The take-off threshold is the cheapest preventive measure on the whole farm. It costs five minutes at the control unit.
Blood on the unit, milk from a wound, the cow flinching as the unit goes on. Look only when you take the unit off and half the time window is often gone already. 2 V E T E R I N A R I A N T H E S A M E D AY, N OT T H E N E X T
The evidence supports treatment within 24 hours; a delay to 48 to 72 hours was associated with markedly more frequent fistula formation. Here it is the farm that determines the outcome, not the clinic. 3 TA K E T H E A N I M A L O U T O F T H E G R O U P
A bleeding teat in the group gets stepped on a second time. A quiet individual pen with a dry lying surface costs nothing and prevents the follow-on damage while you wait for the veterinarian. 4 D O N OT L E AV E T H E Q U A RT E R T O I T S E L F
Milk accumulating raises pressure on the wound and increases pain. Regular, controlled emptying — by hand and into a separate container — is part of first response, not only of aftercare. 5 R E C O R D T H E Q U A RT E R ' S C E L L C O U N T B E F O R E S U R ‐ The cell count counts too — quarter by quarter.
G E RY
In a Swiss evaluation, a high cell count on admission carried
The teat injury: the time window decides The most dependable German data on acute teat injury come from the Clinic for Ruminants at the University of Leipzig: 120 teat injuries in 116 German Holstein cows, May 2012 to July 2017. In 70.8 percent the teat sphincter was involved.9 Of the teats treated, 87.4 percent were milkable after healing and 7.2 percent were amputated.10 That figure tends to be read as reassurance. It is not. At
an unfavorable prognosis for the rest of the lactation. And without a quarter milk sample there is no comparison value for later.13 6 C H E C K C LO S E LY F O R T H E F I R S T T E N D AY S A F T E R S U R G E RY
Signs of inflammation in that window also carried an unfa‐ vorable prognosis in the same evaluation. These are the days in which it is decided whether the quarter stays functional — and these are the days in which, in a normal working week, nobody looks.
follow-up after at least 700 days, 21.5 percent of the surgic‐ ally treated animals had been slaughtered because of problems with that teat or its quarter.11 The teat can almost always be saved, and yet a good one in five operated cows
38
A N I M A L H E A LT H
This sequence does not replace a veterinary assessment. It
around day 10 there was an increase in swelling, hardening
sorts out what is in the hands of the milking staff, and it
and signs of pain.19 Drying off a quarter is therefore not an
belongs on the wall of the parlor — that is where the decision
omission but an intervention with a course of its own. It
is made.
belongs scheduled, documented, checked daily for the first two weeks — and, if at all possible, not placed in peak lacta‐
In 100 hard-milking teats, peak flow rate, average flow rate
tion.
and milk yield before surgery were 20, 14 and 53 percent of the values of healthy comparison teats; six months afterward they were 79, 76 and 71 percent.14 A substantial improvement — and the evidence that the starting level is not reached again. Budget for the old production after teat surgery and you are budgeting wrong. And amputation? It is not necessarily the end. In a Canadian evaluation of 22 cows with distal partial teat amputation, 13 of the 18 animals that could be followed up — 72 percent — were still in the herd at the start of the following lactation.15 The sample is small, but it works as an order of magnitude and it contradicts the assumption that amputation means
The decision is made at the animal, not in the table.
slaughter.
When the inflammation does not resolve
What three quarters deliver — and what that costs
On the more common second route the decisive figure is not
This is where the common account departs furthest from the
bacteriological cure but full cure — and the gap between the
evidence. The statement that the remaining quarters take over
two is wide. In an evaluation of 2,883 clinical mastitis cases
part of the milk production is correct — it just means less than
on twelve farms in northern Germany, the bacteriological cure
it sounds like. In a study from Kiel in which individual quarters
rate was 73.3 percent, the full cure rate 21.4 percent and the
went unmilked for twelve days, daily yield per cow fell to 75
recurrence rate 18.8 percent.16 By pathogen, bacteriological
percent when three quarters were milked; the quarters still
cure ranges from 44.7 percent for Staphylococcus aureus to
being milked raised their output by 4 percent each.20
87.1 percent for coliforms.17 Four percent per quarter. That is the documented order of The finding behind that: the pathogen is gone in three of four
magnitude — not a third, not a half. The cow ends up at
cases — the quarter is not, in four of five. What remains is a
roughly three quarters of her previous production, which is
quarter with an elevated cell count that can flare up again. For
where simple quarter arithmetic would put her anyway. The
practice this means the follow-up after a mastitis treatment
data come from a short-term trial in 1990; for today's produc‐
must not stop at clinical improvement. Take no check sample
tion levels that is a caveat worth stating.
after three weeks and you will learn about the chronic Compensation does happen. It is time-dependent, lactation-
infection only at the next flare-up.
dependent — and it is partial compensation, never a replace‐ A study from Belgium and the Netherlands covering 117 clin‐
ment.
ical mastitis cases shows how often production does not come back: only 47 percent of the inflamed quarters reached
The field gives us the figure to calculate with. In the Danish
the expected milk yield again within four weeks, against 68
field trial the production loss of the cows with a dried-off
percent for the non-inflamed quarters of the same cows.
18
quarter averaged 4.1 kg per day more than that of the control
That does not prove the loss is irreversible — four weeks are
cows, with a 95 percent confidence interval of 3.1 to 5.0 kg.
not a lactation. To my knowledge there is no study following
The greatest capacity to compensate was shown by
three-quartered cows through a complete lactation.
multiparous cows in early lactation.21
Where a quarter is deliberately dried off, it works less com‐
Worked through: a cow loses a quarter on day 120 of lacta‐
pletely than assumed. In a randomized Danish field trial with
tion. That leaves 185 milking days to day 305. At 4.1 kg of
70 cows, around day 40, 35 percent of the dried-off quarters
additional loss per day, that comes to 759 kg of milk, or 574 to
had not atrophied and only 6 percent were completely dry;
925 kg across the confidence interval. At 45 cents of milk price per kilogram that is 342 euros, in a range of 258 to 416
A N I M A L H E A LT H
39
euros.22 That is less than many expect — and it is why a threequartered cow rarely fails on milk loss alone. She fails on what stands beside it: somatic cell count, labor time in the parlor, the milking system. The figure comes from Danish organic farms and concerns deliberately dried-off quarters, not the acute injury case. Anyone with quarter-level yields from the milking system should use that quarter's actual pro‐ duction — and the guide figure becomes a farm figure.
Living with a three-quartered cow If the cow stays, daily routine changes in several places — and the most important one is invisible. With the quarter gone, the basis on which the cell count is calculated changes: the com‐ posite somatic cell count is not an average across four quar‐ ters, it is a mean weighted by the quarter milk yields.25 Two things follow from that. If a chronically infected quarter
HOW TO WORK IT OUT FOR YOUR COW
with a high cell count drops out of the calculation, the cow's
S T E P 1 D E T E R M I N E T H E D AY S R E M A I N I N G
composite cell count falls — even though nothing has
From today's day of lactation to the day this cow would actu‐
improved in the condition of the other three. And the milk
ally be dried off on this farm — not to the end of lactation as
volume across which the cells of the remaining quarters are
the textbook has it.
distributed has become smaller; any increase now shows up
S T E P 2 S E T T H E D A I LY LO S S
more strongly than before.
With quarter yields from the milking system: the affected quarter's actual output over the last four weeks before it failed. Without them: 4.1 kg per day as a guide, deliberately calculated across the range of 3.1 to 5.0 kg. S T E P 3 M U LT I P LY BY Y O U R O W N M I L K P R I C E
Your payout price, not the average producer price. If you receive cell count premiums, calculate with the price that will apply at the expected cell count — not with today's.
For herd health management that means a three-quartered cow has to be assessed afresh once the quarter is gone, not against her old cell count history. Monitor her only through the composite cell count and you will see an improvement that is not one, and miss a deterioration that is. In practice: record a new baseline and set the alert threshold against that — not against the herd threshold.
STEP 4 WEIGH THE CELL COUNT RISK AGAINST IT
The California Mastitis Test belongs in the routine, but it has
Three quarters will now carry the entire milk volume, and a
limits. In a study of 520 quarters from 131 cows, the sensitiv‐
new infection shows up more strongly than before. This item
ity of the CMT on the third day after calving was 56.7 percent
cannot be put into euros with any honesty, but it belongs
for any pathogen and 66.7 percent for major pathogens, with
named before the calculation starts.
specificity around 55 percent.26 As a screen it is fast and use‐
STEP 5 SET IT AGAINST THE REPLACEMENT
ful; as an all-clear it is no good. So with a three-quartered cow:
What does the heifer who is actually available cost — not the
run the CMT at every opportunity when you are at the udder
one who would theoretically be available? And what will she
anyway — plus a bacteriological quarter milk sample when a
deliver in her first lactation against this cow with three
decision about her future is being made or she is to be dried
quarters? If you have no dependable figure for the heifer, you
off.
have none for the three-quartered cow either. The calculation decides nothing on its own. It makes sure
There is one piece of reassurance. According to a German
the decision hangs on numbers and not on the look of the
study on 16 farms with 1,126 cows, an infected quarter did
udder.
not raise the new-infection risk of the other quarters of the same cow.27 A three-quartered cow is therefore not a walking source of infection for her own udder. She is a cow with less
Which quarter is lost makes a difference. In a Lithuanian eval‐
reserve.
uation of 229 cows on milking robots in 2016, front quarters accounted for 42.2 percent and rear quarters for 57.8 percent of the milk.23 A Polish study of 1,891 first-lactation cows puts
T H E T H R E E - Q U A R T E R E D C O W D AY T O D AY
the difference at roughly 1 kg more per rear quarter at 28.5 kg
M A R K H E R V I S I B LY — O N T H E A N I M A L A N D I N T H E
of daily production.
PROGRAM
24
The gap varies by population, the direc‐
tion is stable — and it is precisely the rear quarters that are
A colored mark every milker sees before attaching, and an
more often affected by teat injuries. So anyone working
entry in the herd management program. Relief staff and holi‐
through step 2 without quarter-level yields should calculate at the upper end of the range for a rear quarter.
40
day cover do not know the cow, and one wrongly attached unit is enough.
A N I M A L H E A LT H
D O N OT M I L K T H E Q U A RT E R
Plug the liner or shut the quarter off, and no hand stripping. Overmilking is named explicitly in the literature as a risk factor — here on a quarter that is already compromised. Q U A RT E R C E L L C O U N T S I N S T E A D O F C O M P O S I T E
The composite value misleads in both directions on these animals. Without quarter-level values you are monitoring the wrong measure. S E T A N E W A L E RT T H R E S H O L D
Note the baseline after the quarter is lost and set the threshold against that value. The cow's old history has become worthless as a benchmark. C O R R E C T T H E P R O D U C T I O N E X P E C TAT I O N
Around three quarters of the previous level, and rather less if it is a rear quarter. Keep measuring her against her old lacta‐
– Which quarter is gone — front or rear, and how much milk did it actually give most recently? – What are the cell counts of the three remaining quarters, measured individually and not derived from the compos‐ ite? – What stage of lactation is she at, and which lactation? – How sound is she outside the udder — fertility, feet, meta‐ bolism? – How high is her breeding value, and are there daughters from her in the herd or on the way? – Is there a rearing place and a heifer actually available? – Will the milking system cope with her — and at what effort?
tion curve and you will cull her for the wrong reason.
On that last point, an honest answer: whether and how a
CLARIFY IT WITH THE MILKING SYSTEM BEFORE
single quarter can be permanently deactivated on the com‐
DECIDING
mon milking robot systems could not be established in this
Whether and how a single quarter can be permanently deac‐
research from a dependable, dated source; the manufacturers'
tivated on your own system is a question for the service
herd management documentation is not public. Anyone
partner — in writing, before the cow stays. On a robot there is
facing the decision should ask their own service partner and
the added question of whether attachment works reliably
get the answer in writing. What is documented is that attach‐
with three quarters.
ment depends on teat placement, and that udder type traits
The effort per animal is small. But it comes up every day, in
can be estimated from the robot's teat coordinates with herit‐
places where nobody asks — which is why it belongs written
abilities between 0.37 and 0.67 — considerably higher than
down.
from classification.29
Conclusion: documented, calculated, open Four statements are documented. First: the more common route to a dried-off quarter is not injury but inflammation that resolves bacteriologically and not cytologically. Second: with an injury the hour decides, not the suture material — and saving the teat is not the same as keeping the cow. Third: compensation is in the order of 4 percent per quarter. Fourth: an earlier take-off at 400 to 600 grams per minute costs no A three-quartered cow is not a special case. She is a calculation.
milk and measurably spares teat tissue. Calculated, not measured, is everything that follows from this
The decision: stay or go
for the individual farm — the milk price calculation, the com‐ parison against a replacement, the effect on herd cell count.
A three-quartered cow is not a reason to cull, she is a cow
Those calculations are only as good as the quarter-level data
with a changed basis of calculation. The question is not
that go into them. Without them you are deciding by feel.
whether she has lost a quarter, but whether she is better with three quarters than the heifer who would take her place. The benchmark is the expected remainder of her own productive life — in the vit region, culled cows in 2024/25 averaged 38.2 months of productive life and 31,691 kg of lifetime produc‐ tion.28 A second-lactation cow with three healthy quarters stands quite differently in that comparison than a fifthlactation cow with an elevated cell count.
Three things remain open. How common three-quartered cows are in German herds has not been surveyed. How their production develops across a complete lactation has not been studied — every available paper ends after weeks. And what share barn design and flooring have in the risk of mech‐ anical teat injury has not been quantified. All three gaps concern questions that are decided in the barn every day. It is not the missing quarter that decides whether the cow
A N I M A L H E A LT H
41
stays, it is the condition of the other three.
SOURCES (SELECTION) 1 Tho Seeth, M.; Wente, N.; Paduch, J.-H.; Klocke, D.; Hoedemaker, M.; Krömker,
11 As footnote 9, summary; follow-up after at least 700 days. Of the conser‐
V. (2016): Drying-off single udder quarters of dairy cattle during lactation
vatively treated animals, 2 of 4 — 50 percent — were slaughtered for the
using a casein hydrolysate. Milk Science International – Milchwis‐
same reason.
senschaft 69(5), 23–26. Indications: recurrent mastitis n = 17, high cell count n = 3, insufficient production n = 3, both n = 1, teat lesion n = 1. Study population: 25 quarters from 25 cows (22 German Holstein, 3 Fleckvieh) on ten farms in North Rhine-Westphalia. 2 vit w.V.: Trends · Fakten · Zahlen 2025 (annual report), milk recording chapter, table “Abgänge in Abhängigkeit vom Herdenniveau” (cullings by herd pro‐ duction level), p. 17. Period: 2024/25 recording year, total 503,259 cullings. Study population: the vit region — Lower Saxony, Hesse, Rhine‐ land-Palatinate-Saar, Luxembourg, Berlin-Brandenburg, MecklenburgWestern Pomerania, Saxony, Saxony-Anhalt, Thuringia — all milk-recorded breeds. This is not a Germany-wide statistic. 3 Odorčić, M.; Rasmussen, M. D.; Paulrud, C. O.; Bruckmaier, R. M. (2019): Review: Milking machine settings, teat condition and milking efficiency in dairy cows. Animal 13(S1), s94 – s99. DOI 10.1017/ S1751731119000417. A review without a study population of its own; the values cited summarize results from several individual studies. 4 Pantoja, J. C. F.; Correia, L. B. N.; Rossi, R. S.; Latosinski, G. S. (2020): Association between teat-end hyperkeratosis and mastitis in dairy cows: A systematic review. Journal of Dairy Science 103(2), 1843–1855. DOI 10.3168/jds.2019-16811. Eighteen papers were included (8 prospective cohort studies, 9 cross-sectional studies, 1 hybrid case-control study). The odds ratios cited come from individual included papers, not from a meta-analysis; the review reports no pooled effect estimate. 5 Geishauser, T.; Querengässer, K. (2002): Vorbeuge von Zitzenverletzungen bei Milchkühen – eine Schrifttumsübersicht (preventing teat injuries in dairy cows – a literature review). Der Praktische Tierarzt 83, 997–1005. A literature review with no survey of its own and no quantified risk meas‐ ures. The issue number could not be established beyond doubt from the publisher's index; month of publication November 2002. 6 Böker, A. R.; Merle, R.; Do Duc, P.; Hentzsch, A.; Stock, A.; Reichmann, F.; Bartel, A.; Woudstra, S.; Hoedemaker, M. (2025): Drying-off practices and cell count-based new infection and cure risk over the dry period on 765 German dairy farms. JDS Communications 7(2), 227–232. DOI 10.3168/ jdsc.2025-0782. Study population: 765 farms in northern, eastern and southern Germany; period 2016 to 2019. 7 Rupp, R.; Boichard, D. (1999): Genetic parameters for clinical mastitis, somatic cell score, production, udder type traits, and milking ease in first lactation Holsteins. Journal of Dairy Science 82(10), 2198–2204. DOI 10.3168/jds.S0022-0302(99)75465-2. Study population: 29,284 French Holstein cows in first lactation. 8 vit w.V. (2026): Zuchtwertschätzbeschreibung Milchrind (dairy cattle genetic evaluation documentation), as of August 2026, table 10, p. 23. Study pop‐ ulation: 3,100,189 classified Holstein-Friesian cows in first lactation, data from January 1, 2000. vit lists the traits as udder depth, teat length and front and rear teat placement; the term “RZEuter” common in the trade press does not exist there. 9 Kaiser, M.; Starke, A. (2020): Zitzenverletzungen – retrospektive Datenaus‐ wertung von 116 Deutsch-Holstein-Kühen (teat injuries – retrospective analysis of 116 German Holstein cows). Tierärztliche Praxis Ausgabe G: Großtiere/Nutztiere 48(6), 367–377. DOI 10.1055/a-1274-9011. Study population: patients of the Clinic for Ruminants at the University of Leipzig; period May 2012 to July 2017. 10 As footnote 9, summary. The percentages refer to the number of teats treated, not to the 120 documented injuries.
42
12 Azizi, S.; Rezaei, F.; Saifzadeh, S.; Dalir-Naghadeh, B. (2007): Associations between teat injuries and fistula formation in lactating dairy cows treated with surgery. Journal of the American Veterinary Medical Association 231(11), 1704–1708. DOI 10.2460/javma.231.11.1704. Study population: 106 lactating cows at pasture, Urmia University, Iran — not transferable to German freestall housing. 13 Bleul, U. T.; Schwantag, S. C.; Bachofner, C.; Hässig, M. R.; Kähn, W. K. (2005): Milk flow and udder health in cows after treatment of covered teat injuries via theloresectoscopy: 52 cases (2000–2002). Journal of the American Veterinary Medical Association 226(7), 1119–1123. DOI 10.2460/javma.2005.226.1119. Study population: 52 cows at the Univer‐ sity of Zurich, period 2000 to 2002; 49 evaluable follow-ups. 14 Querengässer, J.; Geishauser, T.; Querengässer, K.; Bruckmaier, R. M.; Fehlings, K. (2002): Investigations on milk flow and milk yield from teats with milk flow disorders. Journal of Dairy Science 85(4), 810–817. DOI 10.3168/jds.S0022-0302(02)74140-4. Study population: 100 hard-milking teats from 97 cows; measured with the Lactocorder before surgery and six months afterward. 15 Klostermann, C. A.; Babkine, M.; Desrochers, A.; Lardé, H.; Nichols, S. (2024): Distal teat amputation for distal papillary canal injuries in lactating dairy cows. Journal of the American Veterinary Medical Associ‐ ation 263(2), 199–207. DOI 10.2460/javma.24.05.0313. Study population: 22 lactating cows, Farm Animal Hospital of the Université de Montréal, Canada; period 2015 to 2021; long-term follow-up for 18 of the 22 animals through the Canadian Dairy Network. 16 Schmenger, A.; Krömker, V. (2020): Characterization, cure rates and associ‐ ated risks of clinical mastitis in Northern Germany. Veterinary Sciences 7(4), 170. DOI 10.3390/vetsci7040170. Study population: 2,883 clinical mastitis cases on twelve farms in northern Germany; period 2014 to 2018. 17 As footnote 16, pathogen-specific bacteriological cure rates. 18 Song, Y.; D'Anvers, L.; Gote, M. J.; Adriaens, I.; Aernouts, B. (2025): Quarterlevel milk yield recovery following clinical mastitis: associations with milk loss, somatic cell count, clinical severity, and pathogens. Agriculture 15(17), 1805. DOI 10.3390/agriculture15171805. Study population: three farms with automatic milking systems in Belgium and the Netherlands; 117 clinical mastitis cases in 96 cows across 104 lactations; period January 2019 to August 2021. Comparison value for non-inflamed quarters: 203 of 299 quarters. 19 Skarbye, A. P.; Krogh, M. A.; Sørensen, J. T. (2018): The effect of individual quarter dry-off in management of subclinical mastitis on udder condition and milk production in organic dairy herds: a randomized field trial. Journal of Dairy Science 101(12), 11186–11198. DOI 10.3168/jds. 2018-14794. Study population: five organic farms in Denmark, 70 cows, randomized controlled. 20 Hamann, J.; Reichmuth, J. (1990): Compensatory milk production within the bovine udder: effects of short-term non-milking of single quarters. Journal of Dairy Research 57(1), 17–22. DOI 10.1017/ S002202990002656X. Study population: eight high-producing cows and eight first-lactation cows, Bundesanstalt für Milchforschung Kiel (the German federal dairy research institute); data collected before 1990. With one quarter milked, daily yield fell to 26 percent; with two quarters to 59 percent; with three quarters to 75 percent. 21 As footnote 19, production loss and compensation potential.
A N I M A L H E A LT H
22 Calculated: the author's own arithmetic based on the additional loss of 4.1
26 Sargeant, J. M.; Leslie, K. E.; Shirley, J. E.; Pulkrabek, B. J.; Lim, G. H. (2001):
kg per day documented in footnote 19 (95 percent confidence interval 3.1
Sensitivity and specificity of somatic cell count and California mastitis
to 5.0 kg), applied over 185 milking days from day 120 to day 305 of
test for identifying intramammary infection in early lactation. Journal of
lactation and valued at a freely chosen milk price of 45 cents per kilo‐
Dairy Science 84(9), 2018–2024. DOI 10.3168/
gram. Neither the day of lactation nor the milk price comes from a source;
jds.S0022-0302(01)74645-0. Study population: 131 cows with 520 quar‐
both are calculation assumptions and should be replaced with the figures
ters from three research herds in the United States and Canada; meas‐
of your own farm.
ured on the third day after calving, CMT threshold greater than zero. The
23 Mišeikienė, R.; Tušas, S.; Matusevičius, P.; Kerzienė, S. (2019): Quarter
values apply to early lactation and do not transfer readily to later stages.
milking parameters by lactation in dairy cows. Mljekarstvo 69(2), 108–
27 Beckmann, A.; Barth, K.; Knappstein, K. (2025): Investigation of quarter-
115. DOI 10.15567/mljekarstvo.2019.0203. Study population: 229 cows
selective dry cow therapy based on bacteriological outcomes on dairy
on milking robots in Lithuania, 30 recording days in 2016. The percent‐
farms. Journal of Dairy Research 92(2), 194–200. DOI 10.1017/
ages refer to one pair of quarters per milking.
S0022029925101234. Study population: 16 commercial German farms,
24 Sitkowska, B.; Siatka, K.; Ghiasi, H.; Piwczyński, D.; Ptak, E. (2025): Estimation of genetic parameters for udder quarters milk yield and milk‐ ing traits in Holstein cattle. Animal 19(11), 101667. DOI 10.1016/j.animal. 2025.101667. Study population: 1,891 first-lactation Polish HolsteinFriesian cows born in 2011 and 2012 on 23 farms with automatic milking systems; 450,607 daily records.
1,126 cows and 1,155 dry periods; period February 2021 to December 2022. 28 As footnote 2, p. 18: productive life and lifetime production of culled cows; 438,376 cullings against a live herd of 1,464,579 cows. 29 Poppe, M.; Mulder, H. A.; Ducro, B. J.; de Jong, G. (2019): Genetic analysis of udder conformation traits derived from automatic milking system
25 Thurmond, M. C. (1990): A method to estimate the somatic cell count of
recording in dairy cows. Journal of Dairy Science 102(2), 1386–1396. DOI
milk from a mastitic quarter using composite somatic cell count. Cana‐
10.3168/jds.2018-14838. Study population: 70 Dutch herds, 12,663 cows
dian Journal of Veterinary Research 54(1), 190–194. No DOI has been
in first lactation.
assigned.
A N I M A L H E A LT H
43
A N I M A L H E A LT H · T E C H N I C A L A R T I C L E
What the hoof goes through every day Walking surfaces, the robot area and standing time — where hoof health is decided, and why feeding is an amplifier and not the sole cause
H E L M U T D E M M E L H U B E R | M A N A G E M E N T C O N S U LTA N T A N D H O L S T E I N B R E E D E R
When hoof lesions start piling up, the first conversa‐
ized, and on a robot farm out of walking distance
tion is about the ration — it is the quickest thing to
and waiting time as well. This article sorts the evid‐
change. The evidence points elsewhere. What loads
ence, names the target values that are actually
the hoof is the floor it stands on and the number of
backed up, and identifies the places where the
hours it stands there. Both come out of barn geo‐
research gives us nothing.
metry, stocking density and how milking is organ‐
Nobody sees two of every three lame cows Start with the figure that frames every discussion about walk‐
No floor can do everything
ing surfaces. A 2025 meta-analysis pulled together twenty-
That concrete is harder on the claw than a soft surface is well
five years of northwest European literature: 53 studies, a
documented, and most clearly so in first-calf heifers. In a
pooled lameness prevalence of 28 percent with a confidence
Swedish trial, heifers standing on slatted concrete rather than
interval of 23 to 33 percent.1 That value applies to the broader
rubber-covered slats after calving had a 3.6-fold higher risk of
lameness definition — for the narrow one the authors report
lameness and a 2.2-fold higher risk of sole hemorrhage and
no estimate at all, because the spread was too wide. Anyone
ulcers. During the rearing phase of the same animals, horn
quoting the figure should supply the definition with it.
wear on the concrete alley was 6.08 millimeters a month
The real finding is somewhere else. In the German PraeRi data
against 2.09 on a deep-bedded pack.5
set, around 85,000 cows on 765 farms were locomotion
Conclude from that that rubber solves the problem and you
scored and the farm managers were asked in parallel for their
have read half the literature. A German doctoral thesis quanti‐
own estimate. Median prevalence as recorded by veterinari‐
fied growth and wear over twelve months in 69 cows: net horn
ans was 23.1 percent in the north, 39.1 percent in the east
growth of 3.4 millimeters a month on rubber against 1.2 on
and 23.2 percent in the south. The farmers estimated 9.5, 9.5
concrete, because wear dropped from 3.5 to 0.3 millimeters.
and 7.1 percent. From that it follows that 45.3 percent of the
Changing the surface produced no reduction in the prevalence
lame animals in the north, 24.0 percent in the east and 30.0
or severity of claw disorders. The opposite mistake is a fringe
percent in the south were perceived as lame at all.
topic here and a headline finding in American data: on one
2
Two of every three lame cows are not perceived as lame in the barn. If you want to know where your hoof health stands, you have to score.
What bears on the claw Biomechanics is the part of hoof health that can be meas‐ ured. A Leipzig research group measured pressure distribu‐ tion on isolated, functionally trimmed hind limbs: on concrete an average of 44.7 newtons per square centimeter with a maximum of 130.3, spread across roughly 33 square centi‐
large farm in the southeastern United States, toe ulcers result‐ ing from thin soles accounted for 20 percent of the lesions recorded and thin soles as a finding in their own right for another 13 percent — more than white line disease.6 With the infectious disorders the ranking reverses. A Norwe‐ gian case-control study found a 2.36-fold higher probability of digital dermatitis for solid alleys than for slatted floors. A second Norwegian paper sums up the trade-off: solid floors are more favorable for most laminitis-associated lesions, slatted floors for the infectious disorders — but not for loco‐ motion.7
meters of loaded area — on the rubber floors tested, 24.9 to
Relieve the sole and you lose wear; get the manure away and
29.7 on average, maximum 71.9 to 87.2, across 48 to 58
you lose walking comfort. The question is which problem the
square centimeters.3 What matters is not only the level but the
herd has right now.
location: peak pressures occurred on the outer claw, plantar and abaxial — exactly where the typical sole ulcer develops. The second mechanism gets overlooked more often. A cow
Standing time is the currency
does not slip on the straight, she slips on the turn, when
A cow's time budget is a zero-sum game: what milking takes
starting off and when braking. A Dutch research group meas‐
is missing from lying. A video analysis of 205 cows in sixteen
ured ground reaction forces and derived the required coeffi‐
freestall barns shows the range in practice. Time out of the
cient of friction from them: walking straight and turning, it
pen for milking ran from half an hour to six hours a day, aver‐
reached about what the floor can just supply; stopping and
aging 2.7 hours, and it had a negative effect on eating and
starting suddenly, it went beyond. A Canadian series of trials
lying time.8 That forced standing acts directly on behavior is
on purpose-built walkways confirms that for starting, a right-
experimentally documented; the path from standing to a fin‐
angled turn and a gutter — and it delivers a finding that too
ished sole ulcer, by contrast, is epidemiologically supported
rarely reaches advisory work: a thin film of slurry increased
but has still not been cleanly reproduced in a trial.
slipping frequency, step count and time taken, and that could not be offset either by more roughness or by more compress‐ ibility.4 A grooved floor cannot rescue a dirty surface.
The most important finding for the German-speaking region does not concern the alley at all. In a cross-sectional study on 103 farms in Germany and Austria with Holstein and Fleck‐ vieh, mean lameness prevalence was 34 percent, with a range from zero to 81 percent. Three stall-related risk factors made
A N I M A L H E A LT H
45
it into the final risk model — mats instead of a deep-bedded pack, obstructed head lunge space, too short a neck rail diag‐ onal — along with lying behavior and body condition. Walking surface variables do not appear there.9 That is a counter‐ weight to an argument too centered on flooring: in that data set the stall mattered more than the alley.
Dimensions and target values — and how much of it is backed up On alley dimensions the evidence looks different from flooring and stalls: many recommendations, few studies. The follow‐ ing values come from the codes of practice in the German-
In the robot area both come together
speaking countries and from the international advisory literat‐
A robot farm has no milking time and no holding pen — and
threshold analysis with lameness as the endpoint.14
ure — useful, but almost none of them derived from a
the cows still stand for a considerable time at the tightest point in the barn. A video analysis of one pen with 59 cows found the animals visited the robot an average of six times a
P L A N N I N G D I M E N S I O N S AT A G L A N C E
day and waited fifteen minutes per visit, 88 minutes per cow
WA L K I N G S U R FA C E S A N D M A N U R E R E M O VA L
per day in total, with a range of 5 to 322 minutes. First-
• Alley in a new building, dehorned animals: at least 2.50 m,
lactation cows waited longer, and cows with long waiting
3.00 m recommended
times lay down less — 9.5 hours against 11.1.10 The study covers one farm and two observation days; it works as an illustration, not as a benchmark.
• Feed alley in a new building: at least 3.50 m, 4.00 m recom‐ mended • Crossovers after 15 to 20 head-to-head freestalls, avoid
The feedback loop is the real point. A cross-sectional study on
dead ends
41 robot farms found that lame cows gave 1.6 kilograms less
• Slat gap 3.5 cm maximum, slat width 8 to 13 cm
milk in 0.3 fewer milkings and were 2.2 times more likely to need fetching more than once within six days.11 The lame cow goes less often on her own, so she is fetched, stands for
• Scrape solid floors at least twice a day R O BOT A RE A
longer in the process — and does not get healthier for it. The robot makes milking time invisible, not standing time. It only spreads it across the whole day.
• Holding area 15 to 20 m² per milking box, no side under 3 m
• Transitions in an AMS barn 2.5 to 3.5 m, that is two to three freestall widths • Feed alley under 430 cm: an independent risk factor, odds ratio 1.9
Where feeding comes into it — and where it does not The clearest available test of the relative weight comes from a Swedish trial that tested flooring type and concentrate level
• Clear space in front of the robot 6.1 m for one, 7.0 to 7.6 m for two side by side • Cows per robot 55 to 60 — other advisory sources give 60 to 80
against each other factorially in heifers: the animals on con‐
• Fetching on average 10 percent of lactating cows a day or
crete with a high concentrate allowance had the highest sole
fewer
hemorrhage scores, and flooring type had a greater influence than concentrate level. The authors named the abrupt switch
F RE E STA L L
• Stall width 0.83 × withers height, lying length 1.1 × diagonal body length
from pasture to barn and the periparturient phase as the most
• Bedding at least 30 cm of deep bedding on concrete, at
significant factors.12 The animals were tied — only partly
least 5 cm compressed on mats
transferable to today's freestall conditions.
• Barn area at least 9 m² per cow including lying area
A second pathway runs through the manure. In a British study,
Of these values, only the feed alley width is derived from
heifers on a wet fermented ration developed more claw horn
an analysis with lameness as the endpoint. The figures
lesions and softer horn than those on a dry ration. The
for robot stocking differ considerably between advisory
authors' explanation was not the rumen but the long periods
sources — anyone planning is choosing between two
standing in liquid slurry. The ration changes the consistency
schools of thought, not between right and wrong.
of the manure, the manure changes the walking surface, the walking surface changes the horn. That fits the sober state of the meta-analyses: of all feeding-related variables, only body
Three gaps belong named. For turning radii, bottlenecks and
condition has so far made it into a dependable pooled estim‐
transitions as quantified risk factors there is no study with an
ate. No ration parameter is among them.
effect estimate — the argument rests indirectly on the friction
13
46
A N I M A L H E A LT H
measurements. On the alley scraper as a disturbance to cow
most frequent individual findings: horn quality, cracks and
traffic there is no dependable primary study. And a direct link
laminitis in 27 percent, white line lesion in 22 percent, sole
between scraper frequency and hoof health is not docu‐ mented, only the two halves of the chain are.
ulcer in 15 percent. T H E WA R N I N G S I G N A L
At one trimming session in August, all four feet of every animal were assessed for the first time: 22 of 22 cows with a lesion, among them 20 white line lesions, 18 of those on a hind claw. Lactations 1 to 7 were affected and days in milk ranged from 40 to 420 — no fresh cow cluster, no age pat‐ tern. T H E R O B OT F I G U R E S
2.6 to 2.8 milkings plus 2.5 to 3.3 refusals per cow per day across a full year — five to six trips to the robot daily, almost half of them without a milking, each one involving walking there, waiting, turning and walking back on the most heavily used stretch of concrete in the barn. THE FEEDING SIDE What a cow walks every day appears in no ration.
Across 366 daily records the fat-to-protein ratio ran between 1.07 and 1.13 by month, and fat content between 3.81 and
Early detection is the biggest lever Two randomized trials by the same British group test the
4.09 percent. No month pointed to chronic rumen acidosis at herd level — that clears the ration in its basic design, but it says nothing about individual groups.
same treatments and reach opposite results; the difference
T H E D O C U M E N TAT I O N T R A P
lies solely in timing. In 167 newly lame cows, 24.4 percent
Fully documented trimming sessions found a lesion in 60
recovered after 35 days with therapeutic trimming alone and 56.1 percent with a block and pain relief together. In cows that
percent of cows, incomplete ones in 14 percent. The differ‐ ence was in the check box, not in the claw.
had already been lame for more than two weeks, the figures
THE ORDER IN WHICH TO WORK THROUGH IT
after 42 days were 15.4, 14.8 and 16.0 percent — no treatment
First the walking surfaces and the robot area — grip, condi‐
effect left.15
tion of the concrete, edges, bottlenecks, turning areas. Second standing times and waiting time at the robot. Third
That makes locomotion scoring the actual intervention. The
the trimming interval and sole thickness. Fourth the concen‐
international guideline recommends a five-point scale, ideally
trate curve at the robot, not because of the starch load but
scored every two weeks, with around 90 percent of cows at score 1 as the target. What hangs on it shows up on the cost
because of the visit frequency. And only after that the ration itself.
side: a bioeconomic model puts the figure at 391.80 euros per cow affected by digital dermatitis per year.16 The larger part of that never appears as an invoice but as milk not harvested, a longer calving interval and early culling — which is why hoof health so rarely shows up in the farm accounts.
Two things can be generalized. A pattern of findings with no lactation-stage signature argues against a transition cause and for a loading cause. And the first complete documenta‐ tion of all four feet produces an apparent deterioration that is in reality a jump in recording.
A case from advisory work
Twenty white line lesions in a single day right across all lacta‐
The following case comes from a recent herd analysis and
tions is a statement about the barn, not about the feed bunk.
shows a herd in which the floor is the cause and the ration plays the supporting role. Farm and animals are anonymized, the figures are unchanged.
Ten tools for the working day The first five tools cost nothing but time and attention. The last five cost money or a rebuild.
R O B OT H E R D, A B O U T 1 2 0 M I L K I N G C O W S , 3 3 K I L O G R A M S D A I LY Y I E L D
T H E PAT T E R N O F F I N D I N G S
Across four years of the farm's own hoof trimming records, 64 percent of the documented cows had a lesion at least once and 34 percent had a glued block at least once. The A N I M A L H E A LT H
47
TOOL 1 — THE COW WALK
TO O L 5 — F O UR RO BOT F IGURE S
GOAL: SEE WHERE THE CLAW IS WORKING
G O A L : M A K E T H E WA L K I N G LO A D V I S I B L E
Walk through the barn once with a cow's eyes. Where does
Milkings per cow per day, refusals per cow per day, cows per
she take short, careful steps? Where does she slip? Where
robot, share of cows fetched. Once refusals approach the
does she turn on the spot? Where does she get crowded?
number of milkings, every cow is walking there five to six
The critical points are known: robot exit, holding area, trans‐
times a day. For fetching, the guide figure is an average of
itions, the water trough area, tight turns. The friction meas‐
ten percent of lactating cows or fewer.
urements say the same thing — on the straight the grip is enough, on the turn and when starting off it is not.
TO O L 2 — SCO RE , D O N OT GUE SS
G O A L : S E E T H E P R O B L E M AT A L L
A five-point locomotion score, every two to four weeks, in the same place, by the same person. Target around 90 percent at score 1. Keep that up for three months and you will know more about your barn than any report can tell you — and you will pick out the animals where treatment still works.
TOOL 3 — DOCUMENT ALL FOUR FEET
G O A L : M A K E S E S S I O N S C O M PA R A B L E
Assess all four feet on every cow, even when three of them say no finding. Only then can sessions be compared, and only then can you check whether a measure has worked. If operating the app in the trimming chute fails because of the gloves, decoupling helps: one spoken sentence per cow into a recorder, transferred afterward at the desk.
T O O L 4 — T H E S TA N D I N G T I M E C LO C K
GOAL: PUT A NUMBER ON THE TIME BUDGET
Write it down on a normal day: when are cows locked up, and for how long? How long does breeding, hoof trimming or the vet round take? How long does the group stand outside while stalls are bedded? Add it all up. More than three hours out‐ side the normal routine means lying or eating time is miss‐ ing. On a robot farm, waiting time at the robot belongs in that total. With no sensor data, spend an hour at the robot one afternoon and count how many animals are waiting and for how long.
And think the feedback loop through: the cow who has to be fetched most often is, more often than not, the lame one.
TOOL 6 — MAKE SOLE THICKNESS A RULE
G O A L : S T O P T H E I N V I S I B L E M I S TA K E
Agree with the hoof trimmer that dorsal wall length is meas‐ ured and not estimated, and that a minimum sole thickness is maintained. Claws trimmed too thin are a lesion that only shows up as lameness weeks later — and then gets blamed on the floor.
TOOL 7 — THE SCRAPER PLAN
GOAL: GET RID OF THE GREASY FILM
Scraping at least twice a day is the minimum standard in the animal welfare guideline; in practice, scraping considerably more often is what works. The point is not cleanliness as such but grip: a thin film of slurry costs secure footing, and neither grooves nor rubber can make that up.
TO O L 8 — RUBBE R WHE RE IT CO UNTS, N OT E VE RY‐ WHERE
G O A L : R E L I E V E T H E LO A D W H E R E I T M AT T E R S
Priority goes to the areas with turning, waiting and crowding: the robot or parlor exit, the holding area, transitions, the feed alley. Covering everything in rubber cuts wear so sharply that the trimming interval has to be adjusted — otherwise you trade one problem for another. With infectious disorders, check the direction: solid floors are the less favorable surface for digital dermatitis. Put rubber down there and manure removal has to be thought through with it.
T O O L 9 — T H E S TA L L B E F O R E T H E A L L E Y
G O A L : TA C K L E T H E D O C U M E N T E D M A I N C A U S E F I R S T
In the German-language risk data, lying comfort mattered more than the walking surface. Check first: neck rail position, head lunge space, brisket board height, amount of bedding,
48
A N I M A L H E A LT H
stall width relative to the largest quarter of the herd — and
practice than the feeding hypothesis, because it points at
the stocking rate. Above one hundred percent stall
things that cannot be changed in a week. Concrete produces
occupancy costs lying time.
almost twice the sole pressure across a markedly smaller
In heifers, neck rail position decides whether they learn to
area, and it does so exactly where the sole ulcer develops.
use the stall at all. If you are bringing first-calf heifers in, that
The friction reserve is enough for walking straight, not for
area should be laid out most generously of all.
turns and stop-and-go. A thin film of slurry costs grip that no groove pattern brings back. And on a robot farm milking time disappears from the daily routine and reappears as waiting
TOOL 10 — PLAN THE TRANSITION PHASE
G O A L : N O WAV E E I G H T W E E K S A F T E R T H E R E B U I L D
time. Feeding is no sideshow in this, but its role is different from what is assumed: where flooring and concentrate were tested directly against each other, flooring weighed more.
Freshly poured or grooved surfaces, a switch from pasture to barn, a new group structure: these are loading phases. Score
For herd analysis that implies an order. First sort the pattern
more frequently during those weeks, do not add driving pres‐
of findings: if white line lesions and sole ulcers dominate, the
sure, and bring hoof trimming forward rather than pushing it back.
issue is loading and horn quality; if digital dermatitis and footrot dominate, it is moisture and hygiene — two jobs
The reason is physiological: horn production adapts to a
whose solutions partly pull against each other. Then determ‐
changed wear rate only with a delay. The weeks in between
ine the window in which the lesions formed, eight to twelve
are the ones in which the sole gets too thin.
weeks back. Then the stall, the walking surfaces and standing times. And only after that the ration. The claw carries the consequences of barn management. It
Conclusion: the claw carries the consequences, with a delay
just carries them with a delay — and that is why the connection is so often missed.
The evidence adds up to a picture that is less comfortable in
SOURCES (SELECTION) 1 Wessels, W., Bokkers, E. A. M., de Boer, I. J. M., Meijer, E., Rodenburg, T. B.,
4 van der Tol, P. P. J., Metz, J. H. M., Noordhuizen-Stassen, E. N., Back, W.,
Hostens, M., Koop, G. (2025): A systematic review and meta-analysis of
Braam, C. R., Weijs, W. A. (2005): Frictional forces required for unres‐
lameness scoring methods and the prevalence of lameness of dairy cows
trained locomotion in dairy cattle. Journal of Dairy Science 88(2), 615–
in Northwest Europe. Journal of Dairy Science 108(9), 10037–10059.
624; nine non-lame cows on non-slip rubber-coated concrete. — Rushen,
Study population: dairy cows in northwest Europe, 53 prevalence studies
J., de Passillé, A. M. (2006): Effects of roughness and compressibility of
over 25 years. The 28 percent applies to the broader lameness definition;
flooring on cow locomotion. Journal of Dairy Science 89(8), 2965–2972;
for the narrow definition the authors report no point estimate because the
16 cows on purpose-built walkways. The authors note that standard tech‐
spread was too wide. The same paper found lower prevalence with
nical measures of flooring properties predict their effect only inad‐
access to pasture, with deep-bedded stalls and on rubber rather than con‐
equately.
crete. 2 Jensen, K. C., Oehm, A. W., Campe, A., Stock, A., Woudstra, S., Feist, M.,
5 Bergsten, C., Telezhenko, E., Ventorp, M. (2015): Influence of soft or hard floors before and after first calving on dairy heifer locomotion, claw and
Müller, K., Hoedemaker, M., Merle, R. (2022): German farmers' awareness
leg health. Animals 5(3), 662–686. Study population: 139 rearing heifers
of lameness in their dairy herds. Frontiers in Veterinary Science 9,
and 118 first-calf heifers on a farm in western Sweden, housing periods
866791. Study population: locomotion scoring of 85,549 cows on 765
2005/06 and 2006/07. The odds ratios come from the period after calving
German farms (84,998 cows on 751 farms analyzed), farm visits Decem‐
(slatted concrete against rubber-covered slats), the wear values from the
ber 2016 to July 2019, PraeRi data set. The authors call the ratio of
rearing phase (concrete alley against deep-bedded pen).
estimated to recorded prevalence the Farmers' Detection Index.
6 Samel, M. (2005): Gummibeschichtete Laufflächen für Milchkühe und deren
3 Oehme, B., Geiger, S. M., Grund, S., Hainke, K., Munzel, J., Mülling, C. K. W.
Einfluss auf Klauenwachstumsparameter und Klauengesundheit im Ver‐
(2018): Effect of different flooring types on pressure distribution under
gleich zu betonierten Laufflächen (rubber-covered walking surfaces for
the bovine claw — an ex vivo study. BMC Veterinary Research 14, 259. Ex
dairy cows and their effect on claw growth parameters and claw health
vivo measurement on twelve isolated hind limbs at around 143 kilograms
compared with concrete). Doctoral thesis, University of Veterinary Medi‐
of applied load; concrete was tested alongside the KARERA, KURA and
cine Hannover; 69 cows, twelve months, monthly measurement at the
profiKURA mats. The loaded area on concrete is given as 32.2 square
dorsal wall of the lateral hind claws. — Sanders, A. H., Shearer, J. K., De
centimeters in the abstract and 33.2 in the results section; the results
Vries, A. (2009): Seasonal incidence of lameness and risk factors associ‐
section is used here.
ated with thin soles, white line disease, ulcers, and sole punctures in dairy cattle. Journal of Dairy Science 92(7), 3165–3174. Study population: one farm with 2,100 cows in the southeastern United States, May 2004 to October 2007; the percentages are shares of the lesions recorded, not of lameness events.
A N I M A L H E A LT H
49
7 Ahlén, L., Hunter Holmøy, I., Nødtvedt, A., Sogstad, Å. M., Fjeldaas, T. (2022):
13 Livesey, C. T., Harrington, T., Johnston, A. M., May, S. A., Metcalf, J. A.
A case-control study regarding factors associated with digital dermatitis
(1998): The effect of diet and housing on the development of sole haem‐
in Norwegian dairy herds. Acta Veterinaria Scandinavica 64, 19; 113 DD-
orrhages, white line haemorrhages and heel erosions in Holstein heifers.
positive against 446 DD-negative herds, odds ratio 2.36 with a confidence
Animal Science 67(1), 9–16. — Oehm, A. W., Knubben-Schweizer, G.,
interval of 1.30 to 4.26. — Fjeldaas, T., Sogstad, Å. M., Østerås, O. (2011):
Rieger, A., Stoll, A., Hartnack, S. (2019): A systematic review and meta-
Locomotion and claw disorders in Norwegian dairy cows housed in
analyses of risk factors associated with lameness in dairy cows. BMC
freestalls with slatted concrete, solid concrete, or solid rubber flooring in
Veterinary Research 15, 346; 53 studies included, 128 risk factors
the alleys. Journal of Dairy Science 94(3), 1243–1255; 66 herds, 2,709
examined, meta-analysis for five of them. Lying surface, stall dimensions
cows, predominantly Norwegian Red.
and bedding could not be pooled because the data were too heterogen‐
8 Gomez, A., Cook, N. B. (2010): Time budgets of lactating dairy cattle in
eous.
commercial freestall herds. Journal of Dairy Science 93(12), 5772–5781.
14 Tierschutzleitlinie für die Milchkuhhaltung (animal welfare guideline for
Study population: 205 lactating cows in 16 freestall barns in Wisconsin,
dairy cattle housing), Lower Saxony Ministry of Food, Agriculture and
USA; time out of the pen was recorded including travel alleys.
Consumer Protection / LAVES, 1st edition May 2007; the alley dimensions
9 Dippel, S., Dolezal, M., Brenninkmeyer, C., Brinkmann, J., March, S., Knierim, U., Winckler, C. (2009): Risk factors for lameness in freestall-housed dairy cows across two breeds, farming systems, and countries. Journal of Dairy Science 92(11), 5476–5486. Study population: 103 conventional and organic farms in Germany and Austria, 3,514 Holstein and Fleckvieh cows scored, housing period 2004/05. Whether walking surface variables were tested and discarded is not apparent from the abstract — all that is documented is that they do not appear in the final model. 10 Solano, L., Halbach, C. E., Bennett, T. B., Cook, N. B. (2022): Milking time behavior of dairy cows in a free-flow automated milking system. JDS Communications 3(6), 426–430. Study population: 40 focus cows from a pen of 59 cows on one robot, one farm in Wisconsin, two observation days in July 2019; the authors themselves describe the work as prelimin‐ ary and call for confirmation across several herds. 11 King, M. T. M., LeBlanc, S. J., Pajor, E. A., DeVries, T. J. (2017): Cow-level associations of lameness, behavior, and milk yield of cows milked in automated systems. Journal of Dairy Science 100(6), 4818–4828. Study population: 41 Canadian robot farms, data collected October 2014 to June 2015, one six-day period per farm, 29 percent of cows clinically lame. The factor of 2.2 applies to the probability of being fetched more than once during those six days. 12 Bergsten, C., Frank, B. (1996): Sole haemorrhages in tied primiparous cows
apply to dehorned animals in new buildings. — Bavarian State Research Center for Agriculture (2017): Automatisches Melken, conference pro‐ ceedings March 2017 (holding area); LfL-Information Automatisierung im Milchviehstall, 1st edition February 2018 (transitions, two to three freestall widths). — Solano, L. (2024): Automatic milking system facilities. Lactanet Canada, Constru+ Dairy Portal, chapter 2, as of February 2024 — an advisory document without primary evidence; the divergent figure of 60 to 80 cows per robot comes from University of Wisconsin – Madison Extension (January 2026). — EFSA Panel on Animal Health and Welfare (2023): Welfare of dairy cows. EFSA Journal 21(5), 7993; stall dimensions table 6, bedding and barn area section 4.3.7.2.2, the 5 cm applies to compressed material. — Westin, R., Vaughan, A., de Passillé, A. M., DeV‐ ries, T. J., Pajor, E. A., Pellerin, D., Siegford, J. M., Witaifi, A., Vasseur, E., Rushen, J. (2016): Cow- and farm-level risk factors for lameness on dairy farms with automated milking systems. Journal of Dairy Science 99(5), 3732–3743; 1,378 cows on 36 farms in Canada and Michigan, data collected June 2010 to November 2012. 15 Thomas, H. J., Miguel-Pacheco, G. G., Bollard, N. J., Archer, S. C., Bell, N. J., Mason, C., Maxwell, O. J. R., Remnant, J. G., Sleeman, P., Whay, H. R., Huxley, J. N. (2015): Evaluation of treatments for claw horn lesions in dairy cows in a randomized controlled trial. Journal of Dairy Science 98(7), 4477–4486; 167 newly lame cows on five farms, recovery 35 days after treatment, only the complete combination was significantly superior to the control. — Thomas, H. J., Remnant, J. G., Bollard, N. J., Burrows, A.,
as an indicator of periparturient laminitis: effects of diet, flooring and
Whay, H. R., Bell, N. J., Mason, C., Huxley, J. N. (2016): Recovery of
season. Acta Veterinaria Scandinavica 37(4), 383–394; 56 and 21 tied
chronically lame dairy cows following treatment for claw horn lesions: a
heifers respectively, concrete against rubber mats, three weeks ante
randomised controlled trial. Veterinary Record 178(5), 116–122; 189
partum to thirteen weeks post partum. The comparison of flooring
cases enrolled on seven farms, 156 of them evaluated after 42 days, 38
against concentrate comes from experiment I.
percent lame on the opposite hind limb at the time of evaluation. 16 Robcis, R., Ferchiou, A., Berrada, M., Ndiaye, Y., Herman, N., Lhermie, G., Raboisson, D. (2023): Cost of lameness in dairy herds: An integrated bioeconomic modeling approach. Journal of Dairy Science 106(4), 2519– 2534. The 391.80 euros apply per cow affected by digital dermatitis per year, not per case; price basis France. On the cost structure: Dolecheck, K., Bewley, J. (2018): Animal board invited review: Dairy cow lameness expenditures, losses and total cost. animal 12(7), 1462–1474.
50
A N I M A L H E A LT H
A N I M A L H E A LT H · P R A C T I C E
Shamonda and the spring that follows What is documented about the new orthobunyavirus in cattle, what appears transferable from the Schmallenberg episode, and what a farm can do before the 2027 calving season
H E L M U T D E M M E L H U B E R | M A N A G E M E N T C O N S U LTA N T A N D H O L S T E I N B R E E D E R
Since June 2026 an infection event has been running
legal situation, the pregnancies, the room for action
through cattle in central Europe that has outpaced
that remains. It rests on publications from the
state laboratories, breed associations and advisory
Friedrich-Loeffler-Institut
services all at once. This article sets out what is
research institute for animal health — from the state
documented about the Shamonda virus, what the
authorities and from the Swiss and French institutes
2011 Schmallenberg episode is good for as an order
as of September 14, 2026, and on the cited literature
of magnitude, and where the evidence remains open.
on the Schmallenberg virus. Every figure taken over
It follows the order in which the questions come up
carries its period and its study population with it.
on the farm: the acute picture, the reporting and
—
Germany's
federal
One pathogen, two introductions The Shamonda virus is an orthobunyavirus of the Simbu serogroup and is transmitted by biting midges, that is by blood-feeding Culicoides. The Schmallenberg virus and the Akabane virus belong to the same serogroup. In the assess‐
Württemberg had been reported to the cattle health service — a report to a health service, not an official case count.8 It spread quickly. In Switzerland the first detection was on July 31, 2026; by August 20 it had reached 22 cantons and Liecht‐ enstein.9 In Bavaria there are now detections from every administrative district.10
ment of the Friedrich-Loeffler-Institut there is no relevant infection risk for humans.1 The pathogen itself is not new: it was first detected in Nigeria in the mid-1960s and after that appeared sporadically until 2026 in western, eastern and southern Africa and in Asia.2 In Japan, six isolates were obtained in 2002 from Culicoides midges and from blood samples of sentinel cattle in Kagoshima and Miyazaki prefec‐ tures; even then the finding was taken as an indication of wider distribution than assumed.3 What is new is its appearance in central Europe. In June 2026, dairy herds in eastern France showed acute fever, diarrhea, apathy and a marked drop in milk production. Untargeted nan‐ opore metagenomics from pooled plasma of sick cows yiel‐
The open question is not in the barn. It is in the pregnancies.
ded complete genomes of an orthobunyavirus of the Simbu serogroup; the L and M segments clustered with the Nigerian Shamonda virus, while the S segment showed a divergent pat‐ tern.4 In early August 2026 the Friedrich-Loeffler-Institut identified the same pathogen type in cattle in southern Ger‐ many. The samples came through the state chemical and veterinary laboratory in Freiburg; the pan-Simbu PCR gave clearly positive signals with Ct values around 20, meaning high viral loads.5 The southern German isolate is designated Shamonda virus/DE/2026.6
The acute picture is impossible to miss The clinical picture in the adult animal is described consist‐ ently: a marked drop in milk production, fever, dull and apathetic animals, sharply reduced feed intake, diarrhea in some cases, and in a proportion of herds mild respiratory signs as well. After a few days the affected animals usually recover markedly.11 The Bavarian animal health service gives an order of magnitude for the milk drop of more than five kilograms per animal.12 From Switzerland, fever above 40
One point matters for context: this is not one event but two.
degrees Celsius over one to two days and a disease course of
On September 1, 2026, the Friedrich-Loeffler-Institut con‐
14 to 21 days are reported.13 At herd level, morbidity in the
firmed a second variant, also related to the Shamonda virus.
Friedrich-Loeffler-Institut survey reached up to 100 percent,
The positive cattle samples came from North Rhine-West‐
with no deaths so far.14
phalia, Lower Saxony, Hesse and Thuringia. To tell them apart, the variants have since been called Shamonda virus Europe 1 (SHAV-EU1) for the one first detected in Switzerland, France and southern Germany, and Shamonda virus Europe 2 (SHAVEU2) for the second. Initial investigations show that all three genome segments of the two variants differ. Whether infec‐ tion with one variant protects against the other is not estab‐ lished. Three orthobunyaviruses of the Simbu serogroup are therefore currently circulating in Germany — the Schmallen‐ berg virus and the two Shamonda variants — and an exchange of genome segments between them is considered not unlikely.7 Genetically, SHAV-EU1 sits close to the Shamonda virus refer‐ ence isolate: 93 percent nucleotide identity in the L and M segments, 97 percent in the S segment. The same investiga‐ tion is the source of the only dependable figure on scale: by the end of July 2026, well over 100 affected farms in Baden-
52
From an affected herd: the manager of a Bavarian dairy farm reports that the event took in the whole herd within two weeks. The drop in milk production was for the most part sud‐ den and, to her, unmistakably different from heat stress. She had heard of different degrees of severity in other herds; in her own the picture was impossible to miss. This account is not a recorded case number, it is a farm manager's description. In its course and its speed it matches the published observa‐ tions. “There was no mistaking that for heat stress.” — manager of an affected Bavarian dairy farm, September 2026 From a second herd: there the event was more severe and above all longer. Numerous immunocompromised animals and cullings from secondary disease are reported. Herd pro‐ duction fell from a good 40 liters to 33 liters per cow per day; after six weeks it was back to 36 liters, still around four liters
A N I M A L H E A LT H
below the starting level. The animals' visiting behavior fell off
lation in weeks, the lag between event and information is
markedly, which brought considerable extra work over the
therefore built into the system. This is no failing of individual
whole period. This too is a farm account and not a recorded
agencies. It is the consequence of vector transmission, no
figure.
duty to report, and a pathogen nobody had on their radar. In
Calculated: in a herd of 100 cows the drop described amounts to around 700 liters a day at its lowest point and still around 400 liters a day six weeks later. The cumulative loss over the six weeks cannot be calculated from this, because the course between the low point and the current level is not known.15
practice it means a farm receives the association's informa‐ tion about cases in a neighboring country at a point when the event is already under way in its own herd. That is exactly how it went in many places in the summer of 2026. What applies regardless: even with no duty to report and no
What the two accounts add: the published figures describe a mild to moderate, temporary course with a clear recovery after a few days and an illness lasting two to three weeks. That captures the average course. It does not describe the tail: milk production that is still not back after six weeks, cullings from secondary disease, and a workload that ties up a herd for weeks. On that tail there are so far no surveys,
statutory control, livestock keepers have general obligations under European animal health law. These include biosecurity measures appropriate to the risk, among them the isolation of sick animals. Animals showing the relevant clinical signs must not be moved.21 Anyone selling animals or taking them to a sale during the acute phase is therefore not operating in a legal vacuum but against an express requirement.
neither of frequency nor of magnitude. Anyone concluding from the overview documents that the economic damage amounts to a few days of reduced milk is underestimating it substantially on some farms. That is no contradiction of the publications. It is the difference between a description of the course and an estimate of the damage, which nobody has yet produced.
The open question is the pregnancies For the acute event in the adult animal the situation has been described. For the pregnancies it has not. The FriedrichLoeffler-Institut puts it cautiously: for the newly introduced virus it is not yet possible to assess whether and to what extent infection of pregnant animals can damage the fetus;
Susceptible species, on current knowledge, are cattle, sheep,
abortions, stillbirths and malformed calves or lambs from
goats, alpacas and horses; in horses, central nervous signs
potentially affected herds should therefore be examined with
have been observed in Europe after infection with SHAV-EU1.
particular care.22 The Bavarian state office goes a step further:
For SHAV-EU2 all positive samples so far have come from
whether infection during pregnancy leads to arthrogryposis-
16
cattle, and the host range has not yet been determined.
17
hydranencephaly syndrome is currently still unclear, but given
Viremia is short. For detecting the pathogen by PCR, serum or
the close relationship to the Schmallenberg virus it is
EDTA blood samples are suitable, and they have to be taken
considered very likely.23
during that short phase. The decisive point is therefore to sample acutely, clinically sick animals — animals with fever, diarrhea and a milk drop, not animals already recovering.18
For the vulnerable phase of pregnancy the Friedrich-LoefflerInstitut gives approximately the fourth to eighth week of gest‐ ation in sheep and approximately day 75 to day 175 of gesta‐ tion in cattle. These figures are expressly framed by analogy
The information arrived after the event
to the Schmallenberg virus and have not yet been determined
The novel Shamonda virus is not a listed animal disease. It is neither notifiable nor subject to statutory control. It follows directly that there is currently no possibility of compensation
experimentally for the Shamonda virus.24 That is not hair-split‐ ting, it is the decisive caveat: what is being used here is a transferred time window, not one measured for this pathogen.
from the Tierseuchenkasse, the state animal disease com‐
Scale that down to a herd affected in July or August 2026 and
pensation fund; for Bavaria that is stated expressly.
But the
it held cows within the assumed vulnerable window that had
same legal position also has a consequence that usually gets
been bred in spring and early summer 2026. Their calvings fall
lost in the discussion: with no duty to report there is no
in the spring of 2027. The worry about those births, currently
mandatory flow of data. There is no official case count,
being voiced on affected farms, is therefore technically well
because there cannot be one. What exists are submissions to
founded and cannot be talked away. But it cannot be
the state laboratories and reports to health services. In
quantified with the data available either.
19
Bavaria a passive monitoring scheme was set up at the state office for this purpose.20 Passive monitoring means the system sees what gets sent in. With a vector-borne pathogen that runs through a naive popu‐ A N I M A L H E A LT H
53
does not supply a forecast for the spring of 2027.
What the Schmallenberg episode gives us — and what it does not The Schmallenberg episode of 2011 and 2012 is the only central European precedent with dependable follow-up. It is a different virus and must not be read as a forecast; but it does supply orders of magnitude against which expectations can be set. On the speed of spread: in one closely sampled cattle herd in the core region, within-herd prevalence reached 100 percent within barely a month during the 2011 vector season. 25
That matches what farms are describing in 2026 for the
Shamonda virus. On the consequences for the offspring: in a follow-up study
Documenting is the only measure that already works today.
on two dairy farms in North Rhine-Westphalia, 71 calves were examined whose dams had been naturally infected with the Schmallenberg virus in the first five months of gestation, cal‐ culated as between day 13 and day 162. One calf showed typ‐ ical malformations and was stillborn, another was born dead with no visible changes. Two cows aborted, with no viral gen‐ ome or antibodies detectable in the fetuses. Nine of the 71 calves carried high specific antibody titers even before colostrum intake, meaning they had been infected in utero, and all nine were born alive and clinically normal. In December 2011, 80.1 percent of the cattle sera examined on those same farms were positive; for spring 2012, a seroprevalence in cattle of around 70 to almost 100 percent is reported for the core region on the German-Dutch-Belgian border.26 At population level the damage rate turned out low. For Dutch dairy herds, around 0.5 percent stillbirths or malformations from fetal Schmallenberg infection is given.
27
The production
side was also unremarkable, unlike 2026: between August 15 and September 19, 2011, milk loss on Dutch dairy farms was 0.26 kilograms per cow per day against the 2009 to 2010 ref‐ erence period; in the subgroup of farms that had reported malformations in newborns during the reporting requirement then in force, it was 0.43 kilograms.28 Caution is needed here. The acute picture with the Shamonda virus is incomparably more severe than what was docu‐ mented in 2011 and 2012 for the Schmallenberg virus — a good five kilograms of milk loss per animal against a good quarter of a kilogram as a herd average. But nothing follows from that for the fetal damage rate, in either direction. How hard a virus hits the adult animal clinically and how terato‐ genic it is are two different properties. The 0.5 percent also comes from a different population, a different period and a different pathogen. It is useful as an indication of the order of magnitude to expect. It is not useful as a number for your own herd in the spring of 2027. The Schmallenberg episode supplies an order of magnitude. It 54
A pause in breeding — what it can do and what it cannot The measure most often named at present is moving the breeding date. The Friedrich-Loeffler-Institut puts it cautiously: in principle an attempt can be made to place the particularly sensitive phases of gestation outside the vector-active sea‐ son. Peak midge activity is usually observed between July and October; depending on the weather the season can run into late November. On the same assessment, conventional vector control can hardly prevent transmission entirely.29 The objection from practice to this measure is valid and should not be brushed aside. A breeding pause works pro‐ spectively. It assumes a farm knows months in advance that something is coming. In the summer of 2026 that was not the case: by the time the recommendation was circulating, the event had already reached the affected regions. For 2026 the measure was moot across much of southern Germany. For 2027 the question looks different. Anyone setting breed‐ ing and calving plans now is planning with lead time and not in hindsight. And anyone farming in a region not yet affected genuinely has the option. The second common line of thinking — that an infection already gone through protects the herd, so a pause is superfluous anyway — is precisely that: an assump‐ tion. For the Shamonda virus, the duration and robustness of immunity after natural infection have not been described. Whether infection with one of the two European variants pro‐ tects against the other was, as of September 9, 2026, not established.30 Since both variants are circulating in Germany and differ in all three genome segments, the question is not academic.31 No vaccine is available; vaccines against orthobunyaviruses can in principle be developed, but that needs sufficient lead time.32 – Has my herd demonstrably been affected — with a PCR result from the acute phase, or only on clinical impression?
A N I M A L H E A LT H
– Which variant was detected, and does my region lie in the overlap area of the two variants? – Which cows were between day 75 and day 175 of gesta‐ tion between July and October 2026, and when do they calve? – Are the breeding records for that group documented well enough for their calvings in spring 2027 to be monitored specifically? – Would moving the breeding season for 2027 be viable for the business — and what would it cost in calving interval and replacement rate?
What to do on the farm now
S H A M O N D A R E C O R D S H E E T — W H AT B E LO N G S O N PA P E R B E F O R E T H E 2 0 2 7 C A LV I N G S E A S O N
ON THE ACUTE EVENT IN THE HERD
• Date of the first abnormal animal and the date on which the event is considered over • Number of clinically sick animals relative to herd size • Daily herd milk volume across the whole period, with a reference week beforehand • The date on which the previous production level was reached again — or a note that it was not • Cullings and secondary disease during and after the event, each with the reason for culling
The room for action is limited, but it is not zero. It lies less in
• Visit, feeding and activity data as far as the herd manage‐
defense than in diagnostics and documentation. Record
ment system provides them, plus the extra labor time
cleanly now what happened in the herd and in the spring of
incurred
2027 you will be able to tell whether a malformed calf belongs
• Results: date of sampling, sample material, result, variant
to the event or not, instead of guessing.
detected
1. Use the acute phase. The pathogen can only be detected during the short viremia. As soon as animals show fever, diarrhea and a milk drop, call the veterinarian and send serum and EDTA blood samples from acutely sick animals to the responsible state laboratory — not from animals already recovering.33
ON THE GROUP WITHIN THE ASSUMED VULNERABLE WINDOW
• Breeding date and day of gestation at the time of the herd event, for each animal • Sire and mating, to rule out a genetic misreading of later malformations • Expected calving date
2. Investigate abortions and malformations consistently. Where an abortion follows clinical signs in the dam, and where the fetus shows malformations of the musculoskeletal system, the whole carcass belongs in the examination. On current knowledge the pathogen is detected as for the Schmallenberg virus, from organ material and above all from brain and spleen.34
O N THE 2027 C A LVIN G SE A SO N
• Every abortion and stillbirth with gesta‐ tion length and findings · • Every malform‐ ation with a description and the examina‐ tion result · • Dystocia rate and calf losses compared with the three previous years
The comparison with previous years is the real point: without a baseline, in the spring of 2027 neither a
3. Reduce midge exposure without kidding yourself. Repel‐ lents, netting at the openings and increased air movement in the barn reduce exposure. They will not achieve a complete break in transmission.35 The measure is risk reduction, not a
cluster nor an all-clear can be substantiated. This list does not replace diagnostics. It makes sure the dia‐ gnostics reach the right animals in the spring of 2027.
barrier. 4. Review purchases and movements. Clinically abnormal animals must not be moved; quite apart from that, buying in
Conclusion: put it in context,
from acutely affected herds during the vector season is an
document it, do not extrapolate
avoidable exposure.36 5. Build the group for spring 2027 now. Pull together in one list every cow and heifer that was between day 75 and day 175 of gestation during the 2026 vector season, and monitor their calvings specifically. That list is the basis for everything that follows, and it can only be built from the breeding records, not from memory.
In the summer of 2026 the Shamonda virus triggered an acute herd event in central Europe that, in speed and in loss of pro‐ duction, is clearly beyond what was documented in 2011 and 2012 for the Schmallenberg virus. No direct deaths are repor‐ ted in the published surveys; from practice, however, there are accounts of cullings from secondary disease and of herds that are still not back at their old production level after six weeks. What is documented is the clinical picture, transmis‐
A N I M A L H E A LT H
55
sion by midges, the presence of two independently introduced
the spring of 2027 needs the baseline from previous years
variants, and the genetic proximity to the Shamonda virus
and the assignment of every affected pregnancy. Both are
known since the 1960s. What is not documented is what hap‐
created now or not at all.
pens to the pregnancies. The assumed vulnerable window is transferred from the Schmallenberg virus, not measured for the Shamonda virus. Whether and how often fetuses are dam‐ aged will become apparent in the 2027 calving season and not before.
And one structural point remains. That the information lagged behind the event is no communication failure by individual agencies, it is the consequence of there being no mandatory data flow for a pathogen that is not listed. As long as surveil‐ lance is purely passive, the next introduction of a vector-borne
For the farm that means three things. First: diagnostics are
pathogen will take the same course. With three orthobunyavir‐
possible during the acute phase and not afterward — the win‐
uses of the Simbu serogroup circulating and the possibility
dow is short and it does not come back. Second: moving
that they exchange genome segments among themselves,
breeding was moot for 2026 in the affected regions, but for
that is not a theoretical worry.37
2027 it is a real decision, and one to be backed with numbers rather than with feel. Third: what counts now is documenta‐ tion. Anyone who wants to demonstrate or rule out a cluster in
What can be demonstrated in the spring of 2027 is decided by the records kept in the autumn of 2026.
SOURCES (SELECTION) 1 Friedrich-Loeffler-Institut (2026): Shamonda-Virus (SHAV). Animal disease
8 Wernike, K., Hoffmann, B., Link, E.K., Rotheneder, S., Eshak, M., Pfaff, F.,
situation, Greifswald-Insel Riems. https://www.fli.de/de/aktuelles/
Höper, D., Beer, M. (2026): It happened again — emergence of a
tierseuchengeschehen/shamonda-virus/ (accessed September 14, 2026).
Shamonda-like orthobunyavirus in Central Europe, 2026. bioRxiv preprint,
Source of: classification as an orthobunyavirus of the Simbu serogroup,
DOI 10.64898/2026.08.06.743243. Not peer reviewed. Source of: nucle‐
transmission by biting midges, assessment of the infection risk for
otide identity to the Shamonda virus reference isolate of 93 percent in the
humans.
L and M segments and 97 percent in the S segment; well over 100
2 Bayerisches Landesamt für Gesundheit und Lebensmittelsicherheit (Bav‐ arian State Office for Health and Food Safety) (2026): Shamonda-Virus (SHAV). Animal health, document updated September 2, 2026. Section
affected farms in Baden-Württemberg reported to the cattle health service by the end of July 2026. 9 Institut für Virologie und Immunologie (Institute of Virology and Immuno‐
“Vorkommen und Übertragung” (occurrence and transmission): first
logy) (2026): Neues Orthobunyavirus der Simbu-Serogruppe bei Rindern
detection in Nigeria in the mid-1960s, thereafter sporadic until 2026 in
entdeckt (new orthobunyavirus of the Simbu serogroup detected in
western, eastern and southern Africa and in Asia.
cattle). Mittelhäusern and Bern, as of September 9, 2026. Source of: first
3 Yanase, T., Maeda, K., Kato, T. et al. (2005): The resurgence of Shamonda virus, an African Simbu group virus of the genus Orthobunyavirus, in Japan. Archives of Virology 150(2), 361–369. DOI 10.1007/s00705-0040419-3. Study population and period: six isolates from Culicoides midges and blood samples of sentinel cattle, Kagoshima and Miyazaki prefectures, Japan, 2002. 4 Kelleci, M., Fusade-Boyer, M., Chrétien, D. et al. (2026): Detection of a novel Shamonda Orthobunyavirus in dairy cattle, France, June 2026. Eurosur‐ veillance 31(33), 2600689. DOI 10.2807/1560-7917.ES. 2026.31.33.2600689. Abstract: clinical signs, nanopore metagenomics from pooled plasma, clustering of the L and M segments with the Nigerian Shamonda virus, divergent pattern in the S segment. 5 Friedrich-Loeffler-Institut (2026): FLI weist neues Orthobunyavirus der Simbu-Serogruppe („Shamonda-like”) bei Rindern in Deutschland nach (FLI detects a new orthobunyavirus of the Simbu serogroup in cattle in Germany). Press release, August 3, 2026. Source of: sample route via the state chemical and veterinary laboratory in Freiburg, pan-Simbu PCR with Ct values around 20. 6 As footnote 1: isolate designation Shamonda virus/DE/2026 for the southern German isolate. 7 Friedrich-Loeffler-Institut (2026): FLI bestätigt weiteres Shamonda-Virusverwandtes Orthobunyavirus in Deutschland (FLI confirms a further Shamonda-related orthobunyavirus in Germany). Press release, Septem‐ ber 1, 2026. Source of: the designations SHAV-EU1 and SHAV-EU2, origin of the positive cattle samples in North Rhine-Westphalia, Lower Saxony, Hesse and Thuringia, differences in all three genome segments, unre‐
detection in Switzerland on July 31, 2026; 22 affected cantons plus Liechtenstein by August 20, 2026. 10 As footnote 2, section “Bekämpfung und Monitoring” (control and monitor‐ ing): detections from every Bavarian administrative district. 11 Landkreis Aschaffenburg (2026): Information über das neuartige Shamonda-Virus (SHAV) (information on the novel Shamonda virus). As of September 2, 2026. Source of: the list of clinical signs in cattle and the note on marked recovery after a few days. 12 Tiergesundheitsdienst Bayern e.V. (Bavarian Animal Health Service) (2026): Neues zum Shamonda-Virus. As of September 2, 2026. Source of: milk drop of more than five kilograms per animal; affected federal states Baden-Württemberg, Bavaria, Rhineland-Palatinate and Lower Saxony; dia‐ gnostic cascade of Simbu PCR followed by Schmallenberg-specific PCR. 13 As footnote 9: fever above 40 degrees Celsius over one to two days, dis‐ ease course of 14 to 21 days. Study population: affected cattle herds in Switzerland, summer 2026. 14 As footnote 8: morbidity at herd level of up to 100 percent with no deaths. Study population: affected herds in Baden-Württemberg, Switzerland and France, summer 2026. 15 Calculated: herd-level daily volumes from the farm's own figures — around 40 liters per cow per day before the event, 33 liters at the low point, 36 liters after six weeks — for a herd of 100 cows. Basis: anonymized account from a dairy farm, September 2026. The cumulative loss over the six weeks is not calculated, because the course between the low point and the current level is not known.
solved cross-protection, three circulating orthobunyaviruses of the Simbu serogroup and the possibility of reassortment.
56
A N I M A L H E A LT H
16 Friedrich-Loeffler-Institut (2026): Steckbrief Shamonda-Virus (SHAV)
27 Veldhuis, A.M., van Dijken, S.C., van Wuijckhuise, L., Witteveen, G., van
(Shamonda virus profile). As of September 3, 2026. Source of: susceptible
Schaik, G. (2013): Schmallenberg virus in Dutch dairy herds: Potential risk
species cattle, sheep, goats, alpacas and horses; central nervous signs in
factors for high within-herd seroprevalence and malformations in calves,
horses infected with SHAV-EU1 in Europe.
and its impact on productivity. Veterinary Microbiology. Source of the
17 As footnote 7: all samples so far positive for SHAV-EU2 come from cattle; the host range of this variant has not yet been determined. 18 As footnote 2, section “Diagnostik” (diagnostics): short viremic phase, serum and EDTA blood samples, sampling of acutely clinically sick animals as the precondition for detecting the pathogen. 19 As footnote 11: SHAV as a non-listed animal disease that is neither notifi‐ able nor subject to statutory control, and the consequence that no com‐ pensation can be paid by the Bavarian Tierseuchenkasse (animal disease compensation fund). 20 As footnote 2, section “Bekämpfung und Monitoring”: passive monitoring at the Bavarian State Office for Health and Food Safety. 21 As footnote 11: general obligations of livestock keepers under European animal health law, including risk-appropriate biosecurity measures, isolation of sick animals and a movement ban for animals showing the relevant clinical signs. 22 As footnote 1: the assessment that for the newly introduced virus it is not yet possible to judge whether and to what extent infection of pregnant animals can damage the fetus, together with the call to examine abor‐ tions, stillbirths and malformed calves or lambs with particular care. 23 As footnote 2, section “Krankheitsbild” (clinical picture): it is unclear whether infection during pregnancy leads to arthrogryposis-hydranen‐ cephaly syndrome, while this is assessed as very likely given the close relationship to the Schmallenberg virus. 24 Friedrich-Loeffler-Institut (2026): Fragen und Antworten zum ShamondaVirus (questions and answers on the Shamonda virus, FAQ). As of September 9, 2026. Source of: vulnerable phase of gestation approxim‐ ately the fourth to eighth week in sheep and approximately day 75 to day 175 in cattle, in each case by analogy to the Schmallenberg virus and not yet conclusively determined experimentally for the Shamonda virus. 25 Wernike, K., Silaghi, C., Nieder, M., Pfeffer, M., Beer, M. (2014): Dynamics of Schmallenberg virus infection within a cattle herd in Germany, 2011. Epi‐ demiology and Infection 142(7), 1501–1504. DOI 10.1017/ S0950268813002525. Study population and period: one cattle herd in the core region of the Schmallenberg episode, observed May 2011 to January 2012; within-herd prevalence of 100 percent within barely a month. A different pathogen from the one discussed here, cited only as an order of magnitude. 26 Wernike, K., Holsteg, M., Schirrmeier, H., Hoffmann, B., Beer, M. (2014): Natural Infection of Pregnant Cows with Schmallenberg Virus — A FollowUp Study. PLoS ONE 9(5), e98223. DOI 10.1371/journal.pone.0098223. Study population and period: two dairy farms in North Rhine-Westphalia, births between January and June 2012; 71 calves evaluated; calculated time of maternal infection between day 13 and day 162 of gestation; one
figure of around 0.5 percent stillbirths or malformations from fetal Schmallenberg infection at population level; study population Dutch dairy herds, period 2011/2012. Cited via footnote 25, because volume and page numbers could not be verified against the original. 28 Veldhuis, A.M.B., Santman-Berends, I.M.G.A., Gethmann, J.M., Mars, M.H., van Wuyckhuise, L., Vellema, P., Holsteg, M., Höreth-Böntgen, D., Conraths, F.J., van Schaik, G. (2014): Schmallenberg virus epidemic: impact on milk production, reproductive performance and mortality in dairy cattle in the Netherlands and Kleve district, Germany. Preventive Veterinary Medicine 116(4), 412–422. DOI 10.1016/j.prevetmed.2014.04.015. Milk loss of 0.26 kilograms per cow per day between August 15 and September 19, 2011 against the 2009 to 2010 reference period; 0.43 kilograms in the subgroup of farms that had reported malformations in newborns during the reporting requirement then in force. Study population: Dutch dairy farms. A different pathogen from the one discussed here. 29 As footnote 24: the note that in principle an attempt can be made to place particularly sensitive phases of gestation outside the vector-active season; peak midge activity usually between July and October, the season running into late November depending on the weather; complete preven‐ tion of transmission by conventional vector control hardly achievable. 30 As footnote 24: the statement that it is currently not established whether infection with one variant confers sufficient protection against the other. As of September 9, 2026. 31 As footnote 7: differences between the two variants in all three genome segments and overlap of their distribution areas in individual federal states. 32 As footnote 5: the statement that vaccines against orthobunyaviruses can in principle be developed, but that this requires sufficient lead time. 33 As footnote 2, section “Bekämpfung und Monitoring”: submission of serum and EDTA blood samples during the acute phase of illness to the responsible state laboratory. 34 As footnote 2, sections “Diagnostik” and “Bekämpfung und Monitoring”: examination of the whole carcass where an abortion follows clinical signs in the dam and where there are malformations of the musculoskeletal system; pathogen detection as for the Schmallenberg virus from organ material, above all brain and spleen. 35 As footnote 24: the assessment that complete prevention of transmission by conventional vector control is hardly achievable and that reducing contact with blood-feeding insects can only lower the risk during the vector-active period. 36 As footnote 11: movement ban for animals showing the relevant clinical signs. 37 As footnote 7: three orthobunyaviruses of the Simbu serogroup currently
malformed stillborn calf, one stillborn with no visible changes, two
circulating in Germany and the assessment that an exchange of genome
abortions with no pathogen detected in the fetus; nine of 71 calves sero‐
segments between them is not unlikely.
positive precolostrally, all born alive and clinically normal; 80.1 percent positive cattle sera in December 2011; seroprevalence in cattle of around 70 to almost 100 percent reported there for spring 2012 in the core region on the German-Dutch-Belgian border. A different pathogen from the one discussed here.
A N I M A L H E A LT H
57
MARKET & MARKETING · TECHNICAL ARTICLE
Understanding elite auctions What makes an elite auction sound in economic terms – and why the highest bidder often pays too much
H E L M U T D E M M E L H U B E R | M A N A G E M E N T C O N S U LTA N T A N D H O L S T E I N B R E E D E R
Elite auctions are seen as a shop window for genet‐
mercial self-interest – and why the most important
ics. In economic terms they are something more pre‐
buying decision is not made in the ring but before it.
cise: a mechanism for finding a price under uncer‐
This article brings auction economics, behavioral
tainty. Understand that and you can see why record
research and consulting practice together into one
prices are rarely the market value, why a complete
clear picture, with two DairyTalk checklists to take
catalog is not generosity but the seller's own com‐
away.
Starting point: more than a knockdown The new elite auction season is beginning. For weeks, cata‐
the embryos under a contract. This is where it gets genuinely interesting, because elite genetics are predominantly a common-value good.
logs get studied, animals get inspected and budgets get
The price never tells the whole story – it only reveals the
planned. For many breeders, elite auctions are the high points
second-highest bidder's willingness to pay.
of the year – places where genetics, emotion and the market meet. They set price references, shape the reputation of cow families and sire lines, and influence breeding decisions far
KEY POINT
beyond the day of the sale.
elite genetics rarely have a private value; they usually
It is precisely where high prices and high expectations come together that a sober look at the mechanics pays off. A record
have a common, uncertain future value – and that changes everything.
knockdown is no seal of quality, and the highest price is not automatically an animal's market value. Over the past months I have analyzed numerous German elite auctions, worked through price patterns and gone into market psychology, price formation and buyer behavior. The result can be stated up front: understand the economic logic of an auction and you buy better – ignore it and you pay for it.
The winner's curse: why the highest bidder often pays too much When the true value of an animal is similar for everyone but unknown, every bidder estimates it with an error. Some over‐ estimate it, some underestimate it. Who wins the auction? Systematically, the bidder whose estimate deviates furthest
Anyone who wants to understand elite auctions has to look at more than the knockdown. He has to understand the mechanism behind it.
upward. The knockdown therefore goes not to the person with the best assessment but to the person with the most optim‐ istic one. This phenomenon is known as the winner's curse – first described by Capen, Clapp and Campbell (1971) for oil leases and later classified by Thaler (1988) as a systematic bias. For elite auctions that means the spectacular record price
KEY POINT
an auction is not a shop window, it is a procedure for finding a price under uncertainty.
often marks not the market value but the estimate of the most optimistic – or the most emotional – bidder. That is no reproach to individual buyers, it is a structural property of the procedure. The most effective protection against it is uncom‐ fortable but simple: do not bid the resale value you are hoping for, bid the sober value to you – and deliberately shade your
What an auction does in economic terms: price discovery
own bid downward, particularly when many others are bidding too.
An elite auction in its usual ascending form is a price discov‐ ery procedure: the price rises until only one bidder is left. The knockdown therefore sits roughly one increment above the willingness to pay of the second-highest bidder. The price does not measure what the animal “is worth,” it measures
The person who wins in the ring has often not judged the value best – he has overestimated it most.
what the last-but-one interested party was still prepared to pay. That is an important distinction, because it explains why two almost identical animals can fetch very different prices – depending solely on who happens to be in the room.
KEY POINT
the more uncertain the value and the greater the
Economists distinguish two basic types of value. Under
competition, the more consistently a rational bidder has
private value, each bidder values the animal for his own use: a
to shade his bid.
dairy farmer works out what the cow will do in his barn. Under common value, by contrast, the value depends on a future quantity that is similar for everyone but unknown – the future demand for a bull dam's genetics, say, or the market value of MARKET & MARKETING
59
auction lives on. The same goes for clear roles: organizer,
Why transparency raises the proceeds – and does not only benefit the buyer Here lies perhaps the most important insight, because it is the counterintuitive one. A complete, honest catalog is usually understood as fairness toward the buyer. In economic terms it is far more: it is in the seller's immediate interest. Milgrom and Weber (1982) showed with what is known as the linkage
auctioneer and marketer should act transparently and name conflicts of interest openly.
Reputation is an auction house's real capital asset – built over years, thrown away in an afternoon.
principle that a seller who credibly commits to disclosing all available information achieves higher proceeds on average. The mechanism is this. Bidders who fear the winner's curse
KEY POINT
build a safety discount into their bids – they bid more cau‐
trust does not come from spectacular animals, it comes
tiously because they price in uncertainty. The more depend‐
from decisions that can be followed – time after time.
able information the seller discloses, the smaller that uncer‐ tainty becomes and with it the discount. Bidders bid more confidently and higher. A complete catalog – national and international breeding values, traceable performance data, unambiguous identification, transparent embryo and stud
The psychology of the ring: anchors, mood, escalation
contracts, current photographs – therefore does not lower
Even well-informed buyers do not decide purely rationally.
prices, it stabilizes and raises them. Selective advertising, by
Behavioral research knows three forces that act particularly
contrast, breeds mistrust and with it exactly the caution that
strongly in the auction ring. First the anchoring effect: Tversky
harms the seller.
and Kahneman (1974) showed that once a number has been
Transparency is no act of nobility by the organizer – it is the cheapest way there is of turning trust into proceeds.
named – the opening bid, an estimate, an earlier record – it shifts the assessment that follows, even when it is factually irrelevant. Ariely, Loewenstein and Prelec (2003) went further and demonstrated that even arbitrary starting values
KEY POINT
measurably shape willingness to pay.
an honest catalog lowers the bidders' uncertainty – and
Second, auction fever. Ku, Malhotra and Murnighan (2005)
lowering uncertainty raises the bids.
described how rivalry, time pressure and the social stage of the ring produce a competitive arousal that drives bidders past their own limit. Third, escalation of commitment: having
Selection, information and trust: the game gets repeated
bid once, a person does not want to stand there as the loser
Elite means not only high genetics but a selection that can be
the calculation. And all three can be defused with a single
followed. Buyers and consignors should be able to under‐
tool: a binding price limit set before the auction.
stand why an animal was accepted, on what criteria the selec‐ tion was made, and how regional and outside consignors are treated. In economic terms this is a question of repeated
and puts in another bid to “rescue” the first. All three forces have the same effect – they detach the buying decision from
Emotion belongs in an auction – it only becomes dangerous when it replaces your own calculation.
games: an auction is not a one-off event, it is part of a series. Give the impression once that information is being released selectively or too late and you pay for it next time with more cautious bidders.
KEY POINT
the ring is built to move limits – which is why the limit has to be fixed beforehand.
That is why a fair information policy is central to being taken seriously. New information does not belong in the ring for the first time. Short-notice updates are sometimes unavoidable, but essential information has to reach all buyers early enough
The buyer: strategy beats mood
for them to weigh it in peace. Information that only comes out
What a buyer should watch for follows directly from the mech‐
as the animal is called in has formally been disclosed but is
anics. First he has to know what kind of buyer he is: a dairy
practically worthless – and it damages the trust the next
farmer, a breeder, a program buyer or an investor will value the
60
MARKET & MARKETING
same animal completely differently, because their value arises differently – for one privately, out of what she does in the barn, for the other in common, out of the future genetics
KEY POINT
market. The biggest mistake is buying an animal on someone
value a contract as what it is: an option on an uncertain
else's motives. Bid, as a dairy farmer, against an investor's
return, not certain income.
resale dream and you have bought yourself straight into the winner's curse. The single most effective measure is therefore the limit set in advance – not as rough guidance but as a self-binding com‐ mitment. It is set at home, before the auctioneer calls the animal in, and it is kept. The best self-test for it is a single question: would I buy this animal at the same price if there were no auction today? If the answer is no, the price is a product of the ring and not of the value. The surroundings belong in the assessment too: who is in the room, which buyer groups are represented, and whether bidding is more rational or more emotional often influences the knockdown more than the genetics do. Before the knockdown comes the preparation.
The most important buying decision is not made in the ring, it is made at home – in your own calculation.
Credibility as an auction's capital The economic effect of all these principles cannot be read off a single knockdown. It shows in the overall picture of an auction across the years: in the number of returning buyers, in the stability of prices, in the willingness of good consignors to
KEY POINT
market their best animals here in particular. An auction that goes for short-term records and sacrifices transparency or
do not buy the loudest animal. Buy the animal that fits
fairness for them wins an afternoon and loses a reputation.
your strategy.
An auction that protects trust builds capital that pays out afresh every season.
Valuing contracts properly: option value, not hope
That closes the circle back to economics: with elite auctions, integrity is not a moral extra, it is the condition on which the price discovery procedure works reliably at all. Buyers have to
Embryo and stud contracts can raise an animal's value con‐
trust the price formation, and sellers have to be able to trust
siderably – but they do not replace it. In economic terms a
that they will be marketed under fair conditions. Where that
contract is an option: a claim on a future, uncertain return. Its
double trust is missing, the auction becomes a lottery – and
value depends on how realistic the underlying assumptions
lotteries attract the wrong bidders in the long run.
are, what risks exist, and whether there is actually demand. A contract for embryos with no market for them has no value, however impressive it reads on paper. The test is therefore whether your own calculation rests on
In the long run it is not the loudest auction that wins, it is the most credible one.
dependable quantities or on assumptions and hopes. Count a contract into your price limit as certain income when it is in truth an uncertain option and you systematically overestimate the animal's value – another way into the winner's curse. A contract can raise the value – but only if there is real
KEY POINT
credibility is not a soft value – it is the precondition for prices meaning anything at all.
demand behind it.
MARKET & MARKETING
61
Conclusion: from
8. Fair competitive conditions
the knockdown to understanding
Every buyer has the same chance, every seller is treated by
Elite auctions are an indispensable part of modern cattle
criteria that can be followed.
breeding: they bring breeders together, create attention, encourage innovation and set impulses for the whole industry. That is exactly why they deserve the highest professionalism – and an audience that understands their mechanics. You do not recognize a sound elite auction by individual record prices, you recognize it by transparency, fair information and traceable price formation coming together.
9. Credibility instead of chasing records Not every top price is a success. What counts is long-term trust in the market. 10. Respect for buyers and consignors A sound elite auction sees itself as a partnership with
For buyers all of this condenses into one simple principle:
breeders, buyers and the whole industry.
know the logic of the procedure and you will not let the ring take the calculation out of your hands. The two checklists that follow sum the article up for practical use – meant for printing out or for looking up on a phone, right in the middle of an auc‐ tion.
10 marks of a sound elite auction 1. A transparent sale catalog All relevant information – breeding values, performance data, health status and contracts – is published in full and in good time.
The highest price is one opinion, not a market value.
2. A selection of animals that can be followed The criteria for acceptance into the sale are clear and compre‐ hensible to consignors and buyers alike.
1. Why do I want to buy this animal?
3. The same information for every buyer Essential
updates
are
communicated
10 questions before the first bid
For my own herd, for breeding, for a program, or as an invest‐ early
and
not
announced for the first time in the ring. 4. Clearly separated roles Organizer, auctioneer and marketer act transparently and pro‐ fessionally. Conflicts of interest are communicated openly.
ment? 2. Does the animal really fit my breeding strategy? Or am I being carried along by the mood? 3. Have I gone through the catalog in full? Breeding values, performance data, pedigree, health traits and
5. Price formation in line with the market The auction produces traceable prices that can serve as a reference for the market.
contracts. 4. Is the price being called still economically defensible? Not only today – but in two or five years as well.
6. Professional organization A punctual schedule, good presentation of the animals, clear information and a structured sale process.
5. What really makes this animal special? Scarcity, the cow family, the genetics – or just the attention she is getting right now?
7. Emotion in proportion Atmosphere and excitement are part of it – they should sup‐ port rational buying decisions, not replace them.
62
6. Are there comparable alternatives? The more easily an animal can be replaced, the more strictly
MARKET & MARKETING
the price limit should hold. 7. Is the contract on offer genuinely worth something?
The DairyTalk rule of thumb
Or does my calculation rest on assumptions and hopes?
The best purchase is not the most spectacular one – it is the one you can still explain with conviction the next morning.
8. Have I set my personal price limit in advance? And am I prepared to hold to that limit? 9. How is the auction environment influencing my decision? Mood, competition and momentum can influence the knockdown more than the genetics do.
Not every expensive animal is worth the price. But every good deal begins with a clear decision – not with a spontaneous bid.
10. Would I buy this animal at the same price without an auction? If the answer is no, that is often the clearest warning signal
KEY POINT
there is.
in the long run the value of an elite auction comes not from its highest prices but from its highest credibility.
SOURCES (SELECTION) Vickrey, W. (1961): Counterspeculation, Auctions, and Competitive Sealed Tenders. The Journal of Finance 16(1). Capen, E. C.; Clapp, R. V.; Campbell, W. M. (1971): Competitive Bidding in HighRisk Situations. Journal of Petroleum Technology 23(6). Milgrom, P. R.; Weber, R. J. (1982): A Theory of Auctions and Competitive Bidding. Econometrica 50(5). Tversky, A.; Kahneman, D. (1974): Judgment under Uncertainty: Heuristics and Biases. Science 185(4157).
Thaler, R. H. (1988): Anomalies: The Winner's Curse. Journal of Economic Perspectives 2(1). Ariely, D.; Loewenstein, G.; Prelec, D. (2003): “Coherent Arbitrariness”: Stable Demand Curves Without Stable Preferences. The Quarterly Journal of Economics 118(1). Ku, G.; Malhotra, D.; Murnighan, J. K. (2005): Towards a competitive arousal model of decision-making: A study of auction fever. Organizational Behavior and Human Decision Processes 96(2). Practical basis: experience from the author's consulting practice.
MARKET & MARKETING
63
MARKET & MARKETING · PRACTICE
Four buyers, four pricing logics Who bids at the 2026 Holstein elite auctions, what gets paid for, what goes unsold – and how to cap a bid
H E L M U T D E M M E L H U B E R | M A N A G E M E N T C O N S U LTA N T A N D H O L S T E I N B R E E D E R
Four buyers sit in the same room looking at the
pay in ratios rather than in euro amounts, and lays
same animal and are prepared to pay four com‐
out a procedure for setting your own limit before the
pletely different prices for her. So if you want to
day of the sale. The typology comes from consulting
explain a knockdown, you do not need to read the
practice. The orders of magnitude have been
catalog, you need to know who is bidding. This art‐
checked against the published results of German
icle describes the four buyer types that carry the
auctions and are marked as dated examples, not as
Holstein auction market, sets out their willingness to
a market forecast.
Who bids at Holstein elite auctions, what gets paid for, and
Calculated: the published results of the 2026 season give the
how to set your own limit before the ring sets it for you
following ladder. It is the author's own ratio calculation based on the auction figures documented in the footnotes, not a
Two markets, one ring There is not one auction market for Holsteins, there are two,
surveyed market value.4 0.5 × an embryo at the average of an elite catalog.
and they share a ring. One trades use value: animals that are
1.0 × the freshly calved heifer at the regular breeding stock
meant to give milk, in a barn whose accounts hang on the
sale – the unit everything else is measured against.
milk price. The other trades options: animals that are meant to become something – a line, a route to market, a trait that is scarce. The two markets respond to different signals. That is why auction averages are so hard to read and why two bid‐ ders can value the same catalog completely differently. The use market follows the milk price, and it does so with no appreciable delay. When the payout falls, willingness to pay for a fresh heifer falls, because the same liter has to pay for the purchase. That is not sentiment, it is arithmetic, and it can
1.7 × the same kind of animal, but bought at the elite auction. The premium is the price of pedigree, catalog and selection. 2 to 4 × the most expensive fresh animals at an elite auction. This is where what can be achieved with type and cow family ends. around 4 × the genomic young female at the average of the elite catalog.
be traced through every price drop – most recently between
10 to 13 × the top lots at an elite auction. This rung no longer
the summer of 2025 and the summer of 2026, when the Ger‐
shares a scale with the ones below it.
man producer price gave up around a quarter and fresh heifers at the regular breeding stock sales were valued correspondingly defensively.1
The ladder says nothing about the absolute level. It says something about the gaps, and the gaps are the real informa‐ tion: between the commercial buyer and the program buyer
The strategy market does not follow it. Anyone buying an
there is not a premium, there is an order of magnitude. See
animal to make embryos, daughters or a market position out
both side by side in one catalog and value them on the same
of her is not calculating with this year's milk price but with the
scale and you will inevitably get it wrong – in one direction or
availability of comparable genetics over the coming years.
the other.
Both stand side by side in the same auction, which is why an overall average can look stable while everything underneath it shifts. In January 2026 the overall average at a Westphalian elite auction was 7,195 euros, almost exactly the previous year's figure.2 What had changed was the composition: the most expensive calf gained, the middle of the genomic offer‐ ing gave up around a fifth, and the fresh heifers did not move at all.3
Two caveats belong with it. The ladder is calculated from one season and is not a multi-year average. Whether the gaps stay constant over longer periods is not documented for the Ger‐ man auction market, because there is no public time series for it. And it shifts as soon as a trait loses its scarcity: what costs ten times as much today because it is rare costs three times as much once it is widespread. The ladder is a yardstick, not a constant.
The practical conclusion: an average price is worthless for your own decision until it is clear which of the two markets it came from. And the question of what an animal is worth has
The commercial buyer
no answer without the question of who is supposed to buy
He is the largest block of buyers and the one least noticed.
her. The ring trades two different goods. Only one of them is milk.
His question is whether the animal fits his barn economically, and it is answered the moment he knows when she will have paid for herself. He is buying milk, peace of mind and a return he can calculate.
A measure that holds up across the years
He is looking for healthy, trouble-free animals with solid pro‐
Euro amounts date quickly, because they move with the milk
duction and no extremes in any direction; animals that slot
price, the feed year and the mood. What lasts longer is the
into the herd without special treatment and get along with the
ratio between the segments. Take the freshly calved heifer at
milking system he has. Bred animals are often preferable to
the regular breeding stock sale as the unit and the rest of the
him over fresh ones, because he can manage the calving on
market can be measured against her – and that ladder stays
his own farm and does not buy the risk of the first weeks
readable even when all the rungs shift up or down together.
along with her.
MARKET & MARKETING
65
He does not pay for brands, contracts, prefixes or promises
beforehand. Anyone bidding in this role needs a walk-away
about the future. An index that tells him nothing about the
limit more urgently than anyone else.
next two lactations does not move him. On the selling side that is regularly read as a lack of interest in breeding. It is the opposite: it is a very precise idea of which breeding actually
Emotion brings the last twenty percent – and it only brings them if a second bidder comes along.
arrives in his barn. His limit sits where the premium over the regular breeding stock market is no longer covered by something that arrives in the barn. That is the best-documented willingness to pay of all four, because it becomes publicly visible several times a month – and it currently sits at about twice the unit when he buys at an elite auction.5 Above that mark he only buys with a second reason, and that reason is usually a breeding one. His typical mistake is the freshly calved young cow who looks good in the ring. She brings the full milk price, the full running costs and the loss of flexibility into the calculation immedi‐ ately, and in a weak milk year she almost never covers her
The catalog decides less than the room does.
price. Anyone buying in that category should value defensively – not out of caution, but because that is what the arithmetic supports.
The program and AI stud buyer He is not buying an animal, he is buying an option. His ques‐
The breeder with an eye and a standard He wants an animal that gives him pleasure and that people notice. His question is not whether she pays but whether she belongs with him. That is not a frivolous category – it is simply a different one, and it regularly gets confused with the first, including by the buyers themselves. He is looking for type, a known cow family, a prefix with a history, presence and command of the ring. He is buying an animal he can show in two years' time, or whose name he can start a line of his own with. The catalog text counts for more with him than with anyone else – not the index section but the
tion is what this animal does for him strategically: for a line, for an embryo program, for a route to market, for a position in the market. He is the buyer who explains the top knockdowns, and he is the only one whose calculation reaches beyond the milk price. He is looking for scarcity in a particular characteristic – polled, red factor, a combination of traits that is rare in the market. He is looking for a female who can be used, because embryos, daughters and a brand can be built from her. And he is looking for a clear profile: not “good at everything” but “very good at this.” That the highest knockdowns of a season all go to young females, and mostly to ones carrying polled, red
pedigree.
factor or both, is no accident but precisely this logic.6
He does not pay for bare index figures, abstract contract
He does not pay for average, for replaceable genetics or for
structures and anonymous animals. A good average animal with no story leaves him cold, even when all the numbers are right. Conversely, he pays for a story only when he can find it again in the animal: show without type gets nowhere with him, and so does type without a stage. His limit sits at two to four times the unit, and it is surprisingly firm. That shows most reliably in the top fresh animals, which at elite auctions hardly ever get past that mark – not even with full ring presence and the best presentation.6 Emotion
ambiguity. That is the hardest limit in the whole market: an animal you can get again somewhere else within a foresee‐ able time is not worth a premium to him, however good she is. He is not buying quality, he is buying unavailability. Contracts play a particular role for him, and it regularly gets misunderstood. Embryo commitments and stud agreements act as a floor, not as a driver: they secure the price on the downside and prevent collapses, but they do not set off jumps. A high contract sum with no visible scarcity is read as
carries the price, then, but it does not carry it indefinitely.
a marketing figure and treated accordingly. That is an assess‐
His typical mistake is the second bidder. An emotional bid
individual lots are not disclosed in auction reports and can be
needs an opponent to justify itself, and that is exactly what
neither proved nor disproved from published figures.7
makes it expensive: two buyers who want the same animal for the same reason drive a price neither of them had calculated 66
ment from consulting practice – contract structures behind
His typical mistake is the young animal whose genomics he MARKET & MARKETING
takes for a result. The genomic breeding value of a young
would one have to be built first? The second case costs more
animal is an estimate with limited reliability that shifts with
than the bid looks like.
every additional piece of information.8 Bid on a young animal and you are buying a probability. In this segment that is not an objection but a quantity in the calculation – but it belongs in the price, not in the hope.
Scalability How many offspring can be produced in what time, and who takes them? Without a route to market, scalability is a number with nothing behind it. Low risk What happens if she does not settle, does not flush
The investor The fourth type looks at an animal as an asset position. His question is whether a market position can be built from her, and his variables are rarity, international leverage, timing and an exit. He is the only one of the four for whom the breeding question comes second to the financial one. He is looking for extreme rarity, several serious interested parties in the same window, and demand that does not first have to be created. Sentimental arguments and barn logic do not reach him. On the upside his willingness to pay is not capped, as long as the calculation works out through resale or marketing. Here the evidence is thinnest. Whether this type actually plays a distinct role at German elite auctions cannot be read off the published reports. The buyers of the top lots are named there
or does not hold? The price contains that answer, whether it is spoken aloud or not. Timing Is there a factual reason why the decision has to be made today? If not, it will be made too expensively. Behind all of it is a common mechanism. An animal does not become expensive because she is better, she becomes expensive because she takes decisions off the buyer's hands. She answers a question he has to answer anyway – which line, what share of polled, which route to market – and she answers it faster and more reliably than he could himself. That is the difference between the fourth and the tenth rung of the price ladder: not the quality, but the number of questions still open afterward. What gets paid for is not quality. What gets paid for is the number of questions an animal answers.
as breeding farms, at home and in neighboring countries.6 Whether program logic or investment logic sits behind them, no report says. Anyone drawing that line is drawing it from knowledge of the people involved – and should say so. For your own auction day it still matters. A bidder whose cal‐ culation does not end in a barn has no limit you can work out. Bid against him and you either win too expensively or you lose – and the second of those is the better outcome.
What all four reward Different as the four calculations are, six characteristics can
Before the bid: five checks The practical consequence is unspectacular: the work hap‐ pens before the day of the sale. No limit can be formed in the ring; there it can only be kept or exceeded. The following sequence is the version that has proved itself in advisory work; it holds whichever of the four roles you turn up in.
F I V E C H E C K S B E F O R E T H E D AY O F T H E S A L E A GE N E TICS A N D D E P TH O F USE
be named across the segments that move the price upward. They act additively, and not evenly but with an increasing swing: an animal meeting three of them is not twice as expensive as one meeting one and a half. The list is derived
• Is the genomic evaluation confirmed, or is this an animal bought on hope? · • Is the profile lopsided — milk high and fitness weak, for instance?
• Is the logic of use clear — what exactly is supposed to happen with this animal?
from observed bidding behavior and not calculated from a
• Has replaceability been checked? If she is replaceable, a
price analysis.
price cap is essential.
Scarcity How many comparable animals are obtainable in the next twelve months? If the answer is “several,” the price is capped, however good the animal is. Clarity What does the animal stand for, in one sentence? Any‐ one who needs three sentences is selling a bundle of possibilities and not a profile.
B CO NTRACTS A N D RE TURN S
• Are the embryo and stud contracts real‐ istic — not just high? · • Are the returns achievable in time, not merely possible on paper? · • Is the contract counted as a floor and not as upside? · • Does the con‐ tract fit the location and the organization it is made with?
C G E T T H E C AT E G O RY O F A N I M A L R I G H T
• Value heifer calves, yearling heifers and young cows
Strategy Can the animal be hung into an existing program, or
MARKET & MARKETING
separately, not within one price range.
67
• For fresh animals, price in the current milk price and the running costs.
• interchangeable PP animals with no strategic role • emotion beating logic – and you can feel it yourself
• Name the loss of flexibility that comes with calving.
In a weak milk year that means valuing freshly calved
Y E L LO W – O N LY W ITH D ISCIP L IN E
young cows defensively. D THE M A RKE T E N VIRO N ME NT
E YO UR O WN ROLE
• Have you recognized the type of venue — more rational or more emotional? · • Realistically, how wide is the circle of bidders for this particular lot? · • Who is in the room? That matters more on the evening than the catalog does. • Am I here as a commercial buyer, as a breeder or as a program buyer? · • Does the animal fit my farm — or the applause? · • Is there a hard walk-away limit, in writing, before the first bid?
Hesitate on any of these points and you do not bid. The hesitation is the information.
G RE E N – B UYA BL E
• a rare trait present, but not genuinely scarce in the market · • a good show cow with no international pull · • good genom‐ ics, but plenty of alternatives · • a con‐ tract in place, the return uncertain · Buy only if the market is not pulling that even‐ ing. • a clear depth of use · • hard to replace or rare · • contract below market value · • the price stays calm · • no pressure to act on your side
The traffic light does not replace market knowledge. It pre‐ vents the three mistakes that come up most often in advisory work: buying because everyone says it will go dear; moving a limit while the bidding is running; and switching roles in the middle of the auction.
From consulting practice: a farm with 180 cows wanted to take two fresh heifers home from an elite auction and had set itself a limit of 5,000 euros per animal beforehand. Both of the animals it wanted went at 5,800 and 6,200 euros; the farm stuck to its limit and drove home empty. Six weeks later it bought four heifers of comparable pedigree at a regular breeding stock sale for 10,900 euros in total, that is 2,725 euros each. Measured against the goal — milk in its own barn — that was the better decision; measured against the catalog it was the duller one. It could only make that decision because the limit was fixed before the day of the sale and not formed while the bidding was going on.7 The checks come down to a few questions that can be answered the evening before and no longer in the ring: – Which of the four roles am I taking on for this lot? – How many comparable animals are obtainable in the next twelve months? – What exactly is supposed to happen with this animal in the next three years? – How much money is lost if that plan does not work out? – At what price do I walk away – and who on the farm knows that figure besides me?
Conclusion: documented, calculated, open What is documented is that the segments of an auction cata‐ log move independently of one another. A stable overall aver‐ age can conceal a marked shift underneath it — in one docu‐ mented case the middle of the genomic offering fell by around a fifth while fresh heifers stayed unchanged and the most expensive calf gained. It is also documented that the highest knockdowns go to young females and there preferen‐ tially to rare combinations of traits. Calculated, not measured, is the price ladder. It is a ratio calculation based on published sale prices from one season. Auction reports are not market statistics: they describe the animals that stood in the ring on one evening and the circle of bidders who were present. The ladder works as a yardstick for your own bearings. As a forecast it does not. Two things remain open. Whether the gaps between the rungs are stable over several years cannot be decided without a public time series — and none exists for the German auction market. And whether program logic or investment logic sits behind the top knockdowns is not apparent from any auction report. Both are questions that can be answered with market knowledge but not with data — and should be labeled accord‐
THE TRAFFIC LIGHT BEFORE THE BID
RED – NO BIDDING HERE
For the day of the sale itself that changes little. The decision
• freshly calved young cows well above what use value
is not made in the ring, it is made at the kitchen table before‐
supports, with no program behind them
hand. And it is made better when it is settled in advance
• contract sum above market value, but no scarcity • “it will go dear, because everyone says so”
68
ingly.
which of the four roles you are taking on that evening. A bidder does not buy the animal standing in front of him, he
MARKET & MARKETING
buys the decisions he will not have to make afterward.
SOURCES (SELECTION) 1 Agrarmarkt Informations-Gesellschaft mbH (AMI), cited in top agrar of April
5 Rinder Union West eG (2026): June breeding stock sale in Hamm, auction
3, 2026, “Milchpreis 2025: Hoch eingestiegen, deutlich nachgelassen”:
report on the sale of June 2, 2026, and breeding stock sale in Hamm,
2025 annual average for conventional milk in Germany 52.24 cents per
auction report on the sale of September 1, 2026. June: just under 140
kilogram at 4.0 percent fat and 3.4 percent protein including deferred
animals, of which 123 freshly calved heifers at an average sale price of
payments, high of 53.51 cents in August 2025, low of 43.45 cents in
2,504 euros; top heifer price 4,200 euros (a Mo Red PP daughter).
December 2025 (secondary citation). For July 2026, agrarheute reports
September: 250 animals sold; heifers and cows 2,580 euros on average,
39.40 euros per 100 kilograms in its milk market data. Comparing a
yearling heifers 838 euros, breeding calves 463 euros; top heifer price
monthly figure with an annual average should be read as an order of
3,500 euros, most expensive herd bull 3,600 euros for a polled DAY PP
magnitude, not as an exact measure.
son. Study population: regular breeding stock sales, not elite auctions.
2 Rinder Union West eG (2026): HighlightSALE 2026 – Ein ereignisreicher
6 MASTERRIND GmbH (2026): MASTERRIND EXCLUSIVE – Die Auktion in Ver‐
Abend zum Jahresbeginn. Auction report on the sale of January 9, 2026,
den 2026. Auction report on the sale of February 25, 2026. 62 calves, bred
RUW-Arena Hamm. Overall average 7,195 euros; genomic heifers and
and fresh animals at an average of 7,698 euros; 14 embryos at an average
calves 9,880 euros on average; fresh heifers 4,422 euros on average; most
of 1,350 euros; clearance rate 100 percent. Top lots: WEH Sainz Barbara P
expensive calf ZFZ Malawi Red P (a Sainz P RDC daughter) 27,500 euros;
RC 34,000 euros (buyer within the MASTERRIND breeding region), ZB
most expensive heifer Inside (a Showtime daughter) 5,500 euros. Study
Race Lana Del Rey Red PP 28,000 euros (buyer in the Netherlands), ZHW
population: catalog animals at one elite auction, not a market statistic.
Major Tom Batida 25,000 euros (a breeding farm from Lower Saxony) –
The report does not give the total number of lots.
all young females; most expensive fresh cow Engelkes Ella 9,500 euros.
3 Rinder Union West eG (2025): HighlightSALE 2025 – Volles Haus in der RUW-
7 Practical basis: observations and analyses from the author's consulting
Arena. Auction report on the sale of January 10, 2025. Overall average
practice. The amounts given are figures from the farm and are not docu‐
7,305 euros; calves 12,410 euros on average; fresh heifers 4,440 euros on
mented in any publicly accessible source. Farm, personal and animal
average; most expensive calf Easypeasy (a Real Syn daughter) 24,500
names are anonymized.
euros. The category label differs from that of the following year; whether the category “calves” is defined identically to “genomic heifers and calves” is not apparent from the reports. The direction of the change does not depend on that, its exact size does. 4 Calculated: the author's own ratio calculation based on the sale prices
8 Meuwissen, T. H. E.; Hayes, B. J.; Goddard, M. E. (2001): Prediction of total genetic value using genome-wide dense marker maps. Genetics 157(4), 1819–1829. Also VanRaden, P. M. (2008): Efficient methods to compute genomic predictions. Journal of Dairy Science 91(11), 4414–4423. DOI 10.3168/jds.2007-0980. And Hayes, B. J.; Bowman, P. J.; Chamberlain, A.
documented in footnotes 2, 3, 5 and 6. The unit is the mean of the two
J.; Goddard, M. E. (2009): Invited review: Genomic selection in dairy cattle:
documented average prices for freshly calved heifers at the regular breed‐
Progress and challenges. Journal of Dairy Science 92(2), 433–443. DOI
ing stock sales (2,504 and 2,580 euros, rounded to 2,540 euros). That
10.3168/jds.2008-1646. These papers establish the methodology and its
gives: embryo at the average 0.5; fresh heifer at the elite auction 1.7; most
limits of reliability; they contain no statements about auction prices.
expensive fresh animals 2.2 to 3.7; genomic young female at the average 3.9; top lots 9.8 to 13.4. The calculation rests on one season and is not a multi-year average.
MARKET & MARKETING
69
V I E W P O I NT · TA K I N G S TO C K
Cattle breeding 2040 From breed association to genetic infrastructure platform – a picture of the future for German cattle breeding, between preservation and renewal
H E L M U T D E M M E L H U B E R | M A N A G E M E N T C O N S U LTA N T A N D H O L S T E I N B R E E D E R
When people think about cattle breeding in 2040, the
pletely? The answer shifts the focus – away from the
usual question falls short. It is generally: will there
organization and toward the infrastructure. This art‐
still be regional breed associations then? The more
icle first acknowledges what the structures that grew
important question is a different one: what structure
up here have achieved, then names their structural
does German cattle breeding need once genetics,
limits, and sets two future scenarios against each
data, reproduction, climate requirements, animal
other. It is meant as a basis for discussion, not as a
welfare and international markets merge com‐
finished blueprint.
1. What the existing system has achieved A serious debate about the future does not begin with criti‐ cism, it begins with acknowledgment. The German breeding system is neither an accident nor a backlog of unmade reforms – it is a success model grown over decades that has set international standards. Anyone who wants to develop it further has to understand first why it worked. Organized German cattle breeding has produced a quality of data, a reliability of parentage and a methodological depend‐ ability that the rest of the world envies. Performance record‐ ing through the LKV structures — the regional milk recording
Anyone breeding for 2040 is already working differently.
organizations — the methodologically first-rate genetic evalu‐ ation by vit in Verden, the cooperative anchoring of breeders' say in decisions, and the regional roots of the associations are not relics. They are the basis on which genomic selection in Germany works reliably at all. Genomic evaluation shows this particularly clearly: its accur‐ acy stands or falls with the size and quality of the reference population. That reference population exists only because data were collected in a standardized, monitored and collect‐ ive way over decades. What is sometimes felt today to be cumbersome is in truth the precondition for the innovations the system supposedly fails to produce.
2. Why the logic that grew up here runs into limits Acknowledgment does not mean standing still. The same sys‐ tem that worked optimally under conditions of scarce data and regional organization runs into structural limits under new conditions. That is no reproach – it is the normal aging of successful structures. Today's model is cut for a world in which the decisive data came from milk recording, type classification and pedigree, in which breeding was organized regionally, and in which mem‐ bership of an association was the natural way into the breed‐
T H E A C H I E V E M E N T S T H AT H AV E T O B E P R E S E R V E D
• Herdbook quality and parentage reliability at an
ing world. All three of those preconditions are now changing fundamentally.
internationally high level
By 2040 the data that matter for breeding will largely no
• Methodologically independent, scientifically grounded
longer come from classical performance recording but from
genetic evaluation (vit)
sensors, milking robots, health monitoring, hoof trimming sys‐
• Comprehensive, neutral performance recording (the LKV structures) • Cooperative decision-making and long-term responsibility for the population
tems, feeding technology, fertility sensors, methane measure‐ ment, genomic profiles, embryo data and the economic fig‐ ures of the business. The central resource will then no longer be the herdbook alone – it will be the entire data space of an animal across her life.
• A reference population that makes genomic selection dependable in the first place • Breeder culture, junior breeder work and regional identity
THREE SHIFTS PUTTING THE SYSTEM UNDER PRES‐ SURE
1 . F R O M F E W D ATA S O U R C E S T O M A N Y
• Performance recording was once the main source of data. KEY POINT
anyone who wants to reform German cattle breeding
In future it will be one of many – and no longer automatically the one the association controls.
has to acknowledge first that its greatest strength —
2 . F R O M R E G I O N A L T O G LO B A L G E N E T I C S
reliable, collectively collected data — is exactly the
• Embryos, semen and breeding values circulate internation‐
resource every future builds on.
ally. Regional responsibilities fit a genetics that has gone global less and less well.
VIEWPOINT
71
3. FROM MEMBERSHIP TO MARKET ACCESS
threshold in practice. Anyone wanting to run a recognized
• Younger farm managers expect data access, open inter‐
breeding program needs an organization, access to data,
faces and a free choice of service provider – not access by
qualified staff, a sufficient population and official approval.
way of belonging to an association.
Legally, market access is open – practically, it is demanding. This is exactly where it is decided whether animal breeding law mainly secures quality or whether it additionally protects existing structures from competition. The decisive insight: the
KEY POINT
the limits of today's system lie not in a lack of competence but in the fact that it was built for a data world that no longer exists in that form.
lever for modernization lies not in breaking with the law but in how the law is shaped. The Tierzuchtgesetz already provides for responsibilities that would make non-discriminatory access and the passing on of data possible. The core legal question is therefore not: do we need rules? It
3. The legal framework: protection with a threshold Every debate about structure in animal breeding takes place inside a clear legal framework. The EU Animal Breeding Regu‐
is: are the rules shaped so that new players, new programs and international cooperation genuinely remain possible?
KEY POINT
lation (Regulation 2016/1012) governs, across Europe, the
good animal breeding law secures quality without
recognition of breed societies and breeding operations, the
cementing the status quo. Modernization does not
approval of breeding programs, the keeping of breeding books
begin with new legislation, it begins with making
and intra-Community trade in purebred breeding animals and
consistent use of the openness the existing law already
their germinal products. In Germany that framework is made
allows.
concrete by the Tierzuchtgesetz, the German Animal Breeding Act, which in particular sets out responsibilities for recogni‐ tion, approval of programs and passing on data. That regulation serves an important function: it secures qual‐ ity, transparency and dependability. Without recognized pro‐ cedures, pedigree certificates, zootechnical certificates and herdbooks would quickly lose credibility. In that sense the legal framework is not an obstacle but a foundation. At the same time, every logic of recognition creates a
4. The target picture: an open breeding and data infrastructure Out of these shifts comes a target picture that is deliberately framed in fundamental terms. This is not about founding another association, it is about creating a shared infrastruc‐ ture – a kind of common foundation on which different play‐ ers can work. Four levels can be distinguished.
Level
Function
Level 1 — Open data infra‐ structure
Standardized, quality-assured, data-protection-compliant consolidation of all breeding-relevant data – from pedigree and genomics through health and fertility to feed efficiency, methane and economic lifetime performance.
Level 2 — Independent evaluation
Functional separation of data holding, genetic evaluation, breeding program, marketing and insemination, to minimize conflicts of interest and secure trust in the evaluation.
Level 3 — Competition between programs
On a shared, verified data basis, several transparent breeding programs compete (efficiency, fitness, grazing, climate, animal welfare, type, organic) instead of one single breeding goal.
Level 4 — The breeder as data owner
The farm keeps control over its data, can see transparently how they are used, and shares in the value created from them.
The decisive conceptual step lies in functional separation. Today one organization frequently combines several roles: it holds data, estimates breeding values, runs a breeding pro‐ gram, markets genetics and advises farms at the same time. Each of those roles is legitimate in itself. Bundled together, however, they create potential conflicts of interest – when the same organization determines which genetics count as valu‐
72
able and sells those genetics at the same time, for instance. An infrastructure platform would not abolish these functions, it would decouple them. Data holding, evaluation, programs, marketing and advice would all remain – but as distinguish‐ able, transparently governed functions rather than as a fused whole. That would be a cultural break with the logic that grew
VIEWPOINT
up here. But it would also be the precondition for securing
nature, it is a series of decisions. To structure the debate, two
trust in a data-driven breeding world over the long run.
idealized scenarios can be set against each other. Reality will presumably be a mixture – but the poles make the choice of direction visible.
KEY POINT
the problem is not the functions of today's system, it is
Scenario A carries today's logic forward: the organization
their bundling in one pair of hands. Unbundling creates
remains the center, structures develop incrementally, what
trust – and in the data economy trust is the hardest
has proved itself is preserved. Scenario B shifts the center
currency there is.
from the organization to the infrastructure: the platform carries the shared functions, several programs compete on it, and the breeder becomes the owner of his data.
5. Two scenarios compared How German cattle breeding develops by 2040 is not a law of
Dimension
Scenario A: carrying on
Scenario B: infrastructure platform
Guiding principle
Organization at the center
Data infrastructure at the center
Data holding
Spread across organizational silos
Standardized, shared data space
Genetic evaluation
Established, close to the organization
Organized as functionally independent
Breeding programs
One per organization
Several on a shared data basis
Role of the breeder
Member and data supplier
Data owner and strategy client
Market access for new players
High barriers in practice
Non-discriminatory access
Pace of innovation
Stable, largely incremental
Higher, competition-driven
Main risk
Falling behind on innovation, members leaving
Complexity, governance effort
Main opportunity
Dependability, continuity
Connectivity, resilience
The comparison makes clear that neither scenario is free of risk. Carrying on (A) offers dependability and continuity – but it carries the risk that innovation increasingly comes from outside and that younger, data-minded farms in particular turn away. The platform (B) offers connectivity and resilience – but it demands considerable governance effort and carries the risk that complexity makes implementation harder, or that the hard-won quality of the data suffers during the transition. A serious weighing-up does not conclude that A is bad and B is good. It concludes that the choice of direction has to be made deliberately – and should not fall to the status quo by default through a decision never taken.
KEY POINT
the most dangerous option is neither of the two scenarios, it is sliding into Scenario A through a
The sample taken from the calf decides two generations.
6. The role of the breed associations in the platform model
decision not taken – while others build the platform
A common misunderstanding in this debate is that an infra‐
logic anyway.
structure platform would make the existing associations superfluous. The opposite is the case. In an unbundled sys‐ tem, specialized, capable organizations become more import‐ ant – just in more clearly defined roles. Three roles are
VIEWPOINT
73
conceivable, and they can be combined.
into breeding values. Internationally there are already markers along that road. ICAR
T H R E E W O R K A B L E R O L E S F O R A S S O C I AT I O N S I N
has developed guidelines for recording sustainability traits
2040
such as feed intake, feed efficiency and methane. In North
Role A — Regional breeder community
America, health traits and — with Feed Saved — a trait for feed
• Representing members' interests, junior breeder work, shows, farm tours, breeder culture and regional identity. This
efficiency have already been built into official genetic evalu‐ ations; the national data base there is managed by CDCB. Ger‐
function cannot be replaced – it carries the social foundation
many would not have to copy those approaches – but it
of breeding.
should adapt them more boldly than it has so far. An open
Role B — Advisory and service house
data infrastructure would be exactly the instrument that accelerates such an adaptation.
• Support with mating, interpreting data, embryo strategy, selecting animals and marketing. In a data-rich world the need for qualified translation of data into decisions grows.
TRAIT DIMENSIONS OF THE COW OF 2040
Role C — Specialized program provider
Established dimensions (remain central):
• Running a clearly defined breeding program with a distin‐
• Milk production and components, fertility, type, productive
guishable genetic direction – not “we do everything” but “we
life
stand for this strategy.”
Growing dimensions (gaining weight): • Health and robustness, hoof and udder health
What is up for discussion in the platform model is something else: the combination of regional responsibility for everything,
• Feed efficiency and use of resources
a historical claim on members, and de facto control over data
• Methane emissions per kilogram of usable food
and market. Not because that construction is improper – but
• Suitability for different housing systems (robot, grazing,
because under the new conditions it brakes innovation more
low-input)
than it carries it. Associations that move early toward clearly defined roles will stand stronger in the new system, not
• Suitability in terms of labor, and breeding routes that are ethically defensible
weaker.
KEY POINT
KEY POINT
the platform model does not weaken the associations –
the cow of 2040 will not be measured against a single
it forces them to concentrate on what makes them
index but against how well she fits a society that
irreplaceable.
demands efficiency, health and responsibility all at once.
7. The question of substance: what are we breeding for in 2040?
8. Governance: the conditions of credibility
The structural question is inseparable from a question of sub‐
A shared data infrastructure only holds up if its governance is
stance. A platform that only did the same thing more effi‐
right from the start. It must be neither a private monopoly nor
ciently would not be worth the effort. The real opportunity is
a government apparatus. The most workable model is a
that an open data infrastructure makes new breeding goals
cooperatively controlled, legally secured trusteeship that
dependably measurable in the first place.
brings different players in: breeders, the existing associations,
Milk production, components, type and fertility remain import‐ ant. But they are no longer enough to describe the demands dairy production has to meet. Society is asking for fewer
AI organizations, the chambers of agriculture, vit, the LKV structures, the scientific community, selected technology partners and independent oversight bodies.
emissions, more animal welfare, less use of antibiotics, higher
What matters is not the trusteeship alone but that clear prin‐
resource efficiency and transparent food production. Those
ciples are binding. Seven principles form the core.
demands can only be addressed through breeding if the cor‐ responding data are collected, standardized and translated
74
VIEWPOINT
SEVEN GOVERNANCE PRINCIPLES
W H AT H A S T O S TAY
1. Data belong in principle to the farms that generate them.
• Herdbook quality and parentage reliability
2. Use takes place only with transparent, revocable consent.
• Neutral performance recording and independent genetic
3. Genetic evaluation is organized and supervised as functionally independent. 4. Algorithms and evaluation methods must be documented in a way that can be followed. 5. New providers get non-discriminatory access to the infra‐
evaluation • Cooperative decision-making and responsibility for the pop‐ ulation • Breeder culture, junior breeder work, shows, regional iden‐ tity
structure. 6. Genetic diversity is monitored systematically and actively safeguarded.
W H AT S H O U L D B E O V E R C O M E
7. Animal welfare and sustainability traits are at the core of
• A regional logic of vested rights that forces global genetics
the system, not decoration.
into local boundaries • The mixing of neutral evaluation and selling interest in one pair of hands
These principles are not an end in themselves. They are the condition for breeders entrusting their most valuable data to a shared infrastructure. Without credible governance any plat‐
• Data silos from which only individual organizations draw benefit
form stays theoretical – with it, it becomes the anchor of trust
• The single breeding goal – there is no longer one cow for
for a whole industry.
every farm • Decision structures in which questions about the future disappear into committees
KEY POINT
the technology of a breeding platform is the smaller problem. The real challenge is governance that breeders
The future is not “everything private” against “everything asso‐
will voluntarily entrust their data to.
ciation.” That opposition leads nowhere. A workable future combines four elements: an open infrastructure, fair competi‐ tion between programs, strong breeder rights, and a clear, col‐ lectively carried responsibility for the population and for the animal.
KEY POINT
the reform will not succeed through demolition, nor through preservation at any price, but through an intelligent distinction between what carries and what brakes. The future is not technology. The future is the next animal.
9. Continuity and break: an honest balance sheet
10. The political core – and the real question In the end the structural question in cattle breeding is a political one. Put sharply: does Germany in 2040 want to
Radical development does not mean discarding everything
administer a protected association-based breeding system –
that exists. It means distinguishing deliberately between what
or shape an open infrastructure for genetic innovation?
has to be preserved and what has to be overcome. An honest
Animal breeding law has to secure quality. But it must not
balance sheet names both.
lead to structures that grew up here automatically acquiring a right to the future merely because they were successful his‐ torically.
VIEWPOINT
75
That question will not be decided in a single resolution but in
which organization survived. It will be whether German cattle
many smaller points of the switch: in how recognition proced‐
breeding understood in time that its future lies not in protect‐
ures are shaped, in the question of data access, in the willing‐
ing old structures but in the intelligent reordering of data,
ness of established organizations to unbundle functions, and
genetics, responsibility and competition – on the foundation
in whether the industry shapes the platform logic itself or has
of exactly the data quality the old system so creditably built.
it shaped for it from outside.
Did we grasp in time that the strength of the existing system — its data — only becomes a future if we open it up instead of
From breed association to breeding platform. From member to data owner. From one breeding goal for all to a diversity of genetic strategies. From a protective wall to an open quality infrastructure.
administering it?
When we look back in 2040, the decisive question will not be
SOURCES (SELECTION) Regulation (EU) 2016/1012 of the European Parliament and of the Council on zootechnical and genealogical conditions (Animal Breeding Regulation). Official Journal of the EU L 171. Tierzuchtgesetz (TierZG): the German Animal Breeding Act. Federal Ministry of Food and Agriculture. Regulation (EU) 2023/2854 (Data Act): harmonised rules on fair access to and use of data. ICAR (2022): Guidelines for the recording of feed intake, feed efficiency and methane traits. International Committee for Animal Recording, Rome.
CDCB – Council on Dairy Cattle Breeding (2023): Feed Saved and health trait evaluations – methodology. Bowie, MD. vit Verden (2024): Zuchtwertschätzung Rind – explanatory notes and methods (German dairy genetic evaluation). Vereinigte Informationssysteme Tier‐ haltung. Cole, J. B. & VanRaden, P. M. (2018): Symposium review: Possibilities in an age of genomics. Journal of Dairy Science. OECD/FAO (2023): Agricultural Outlook 2023–2032 – Dairy Sector. Practical basis: experience from the author's consulting practice and the DairyTalk analyses.
76
VIEWPOINT
DA I RY TA L K P O D C A S T
Technical knowledge for your ears. Why it is sometimes worth simply listening to a technical article.
DairyTalk PODCAST
Breeding. Genetics. Management.
Read or listen? For me that was never really an either-or
So when we talk about genomic selection, it is not only about
question. From the start, what I wanted with DairyTalk was to
new breeding values. It is about how we use genomics
create one more way of engaging with cattle breeding, the
sensibly and where its limits may lie.
dairy business and the future of our industry. Not everyone still has the time and the quiet in the evening to read a long technical article. In the car, in the tractor, at milking, on the way to work or out for a walk, it looks different.
When we talk about Holstein breeding, it is not only about the next top sire. It is about function, production, type, longevity, genetic diversity – and again and again about the question of which cow we actually want to breed for the future.
DairyTalk is not meant to be a news channel that simply reports what has happened somewhere. What interests me is usually the question behind it:
DairyTalk S p o tify · A p p le Po dc asts · A mazo n Music
LISTEN NOW
BETTER BREEDING STARTS WITH BETTER DECISIONS.
DairyTalk Breeding. Genetics. Management.
www.dairytalk.info/home-en