
Clinical Governance Directorate of the British Orthodontic Society



Clinical Governance Directorate of the British Orthodontic Society
I would like to take this opportunity to thank Madeleine Storey, the new Editor of the Clinical Effectiveness Bulletin for taking on this important role. Madeleine and her team have put together an excellent edition of the bulletin including audits linking periodontal assessment and dental development, the patient perspective on intra oral scanning as an alternative to dental impressions, referral to treatment times for dentoalveolar surgery, environmental sustainability, breakages and coding.
It has never been more important that we take the opportunity to share our audits and efforts to improve the efficiency and effectiveness of care. It is a privilege to be able to review and refine our own practice, decide what we feel might be improved in relation to national guidelines or local agreements, take action to effect change and then be trusted to measure the effect of our efforts.
The NHS has often been criticised for rewarding change rather than being patient enough to reward improvements. Too often we see changes that seem to be a “great idea” that prove less impressive in the cold light of implementation.
It is only by patient analysis of outcomes and open collaboration with others that the real value of change can be judged. The British Orthodontic Society is very proud of our new editorial team and of every contribution made to the success of the bulletin. I know the bulletin is in the best hands and will go on improving our service and our clinical outcomes. Our patients deserve nothing less.

Stephen Chadwick Director, Clinical Governance British Orthodontic Society
The British Orthodontic Society Clinical Effectivness Bulletin is an official bi-annual publication of the British Orthodontic Society Clinical Governance Directorate. The primary focus of articles in the Bulletin is the reporting of the quality of orthodontic care and ways to improve it via both clinical audit and effectiveness. The British Orthodontic Society Clinical Effectiveness Bulletin welcomes submissions reporting both these aspects of clinical governance. Clinical audits (in particular multi-cycle audits) and service evaluations would be considered for publication.
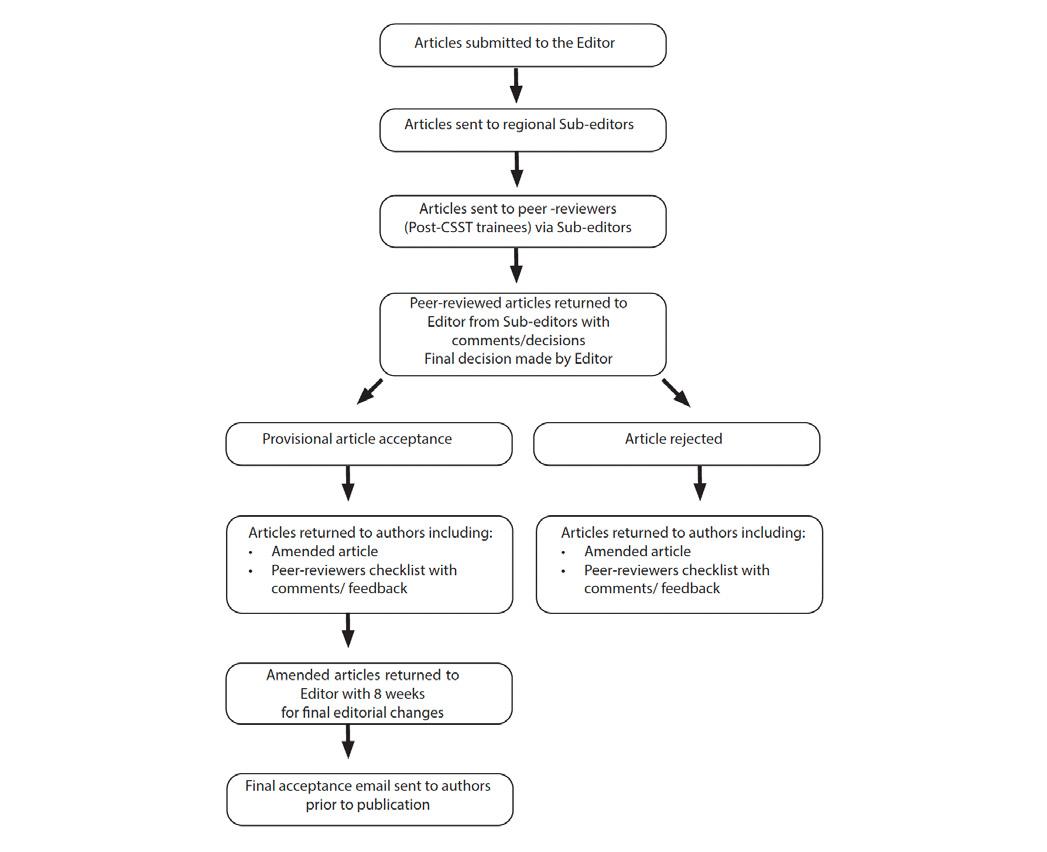
All submitted articles undergo peer-review. Acceptance of articles will be based on the recommendations of the reviewers with the final decision made by the Editor. In addition, submissions will be judged against the following criteria:
1. Does this article add anything new to the existing literature?
2. Does the subject content reflect any relevant national topics?
3. Have the authors implemented a change in clinical practice and assessed the effects? i.e. reaudits
As I reflect on my recent transition into the role of Editor for the Clinical Effectiveness Bulletin, I would like to take this opportunity to express my sincere gratitude to Robert Smyth. His support and expertise have been invaluable and hugely appreciated, making this transition much smoother than I could have anticipated. Robert has been instrumental in the development of a searchable digital archive of past CEB articles, which can now be accessed via the Society’s website - https://bos.org.uk/professionalsmembers/members-area/bos-publications/ clinical-effectiveness-bulletins/
This new archive is a game-changer for our members, removing the need to sift through PDF versions of past issues on the BOS website to find a particular article or even to explore past content for inspiration. The digital archive allows for easy searching by author, year or topic, making it significantly easier to access articles, whether for clinical practice or academic inquiry. You can find the archive in the Member’s Area of the BOS website under Publications -> CEB, or under Clinical Governance -> Audit. We will ensure that this database is updated annually, so it remains current with the latest published issues.
I would like to extend my thanks to Sarah Germaine, who finished her term as Northern SubEditor in January. Sarah has been a tremendous asset, and we are grateful for her hard work and dedication to the Bulletin. We are also pleased to welcome Majid Salas, who has taken up the role of Northern Sub-Editor.
Since the last edition report (Autumn 2025) there has been 1 incident reported to the Society through our confidential reporting system.
A skeletal miniscrew was placed in the mandible for posterior protraction in the lower 1st premolar region. On insertion the miniscrew fractured with separation of 3mm remaining in-situ in the mandible. An oral surgery review advised
I would also like to encourage all post-CCSTs to reach out to their Regional Sub-Editors if they are interested in getting involved as peer reviewers for future issues. Your contributions are always appreciated and vital to maintaining the high standards of the Bulletin.
This issue presents a diverse range of high-quality articles, and I would like to extend my thanks to the contributors and peer reviewers for their time and efforts in bringing this issue to fruition. Special thanks go to Dr. Stephen Chadwick, Mr. Chris Baker and the rest of their team for their support in producing this issue of the Bulletin.
I hope you enjoy reading this issue as much as we have enjoyed compiling it, and that you find inspiration in the articles to inform your practice and research.
Thank you again for your continued support, and we look forward to your contributions in the future.
Madeleine Storey Editor, BOS Clinical Effectiveness Bulletin
monitoring with surgical exploration and removal if obstructive to tooth movement or pathology occurs. Service review included recommendations of a second miniscrew system with larger diameter miniscrews
Farooq Ahmed
Adverse Incidents Officer
British Orthodontic Society
Thanks to all the reviewers that were active in the Clinical Effectiveness Bulletin in 2025. We are extremely grateful for their help and collaboration. If anyone would like to be added to the reviewer list going forward, please contact the Sub-Editor for your region.
Ailish Williams
Rebecca Litt
Amardeep Dhadwal
Jill O’Driscoll
Sasha Brannen
Minnie Lyons Coleman
Claudy Henein
Joseph Bell
Nathan Nagar
Trishna Patel
South East - Elizabeth Crawford
North - Majid Salas
Scotland and Northern Ireland - Colin Ritchie
To contact your Regional Sub-Editor, please email clinicaleffectiveness@bos.org.uk and these will be forwarded to the relevant Sub-Editor.
Age of Permanent Maxillary Canine Palpation and Basic Periodontal Examination: A 3-cycle audit.
D Williams, J Watt
Implementation of a Virtual Joint Orthodontic-Paediatric Clinic: A Multi-centre Quality Improvement Project
W Timmis, R Bannister, L Brown, J Rae
Improving Orthodontic Efficiency: A Two Cycle Retrospective Service Evaluation of UK Hospital-based Treatment Duration
S Alwan, E McLaughlin, E Woodhead, S Misra
Evaluation of Patient Satisfaction with Conventional Impression Taking and Intraoral Scanning: A Two-Cycle Quality Improvement Project
E Johnson, F Ahmed, F Motamedi
An audit analysing the Referral to Treatment (RTT) waiting times for orthodontic patients requiring dentoalveolar surgery at Milton Keynes University Hospital
M Suleman, S Tsang
A Two-Cycle, Regional Audit assessing orthodontic clinician awareness of environmental sustainability in dental practice
H Hook, T Frawley
A Two-Cycle Audit on the Management of Broken/Lost Fixed Orthodontic Appliances in an Orthodontic Hospital Department
R Daggar, H Quach, A Keshtgar
The financial impact of Orthodontic Coding Accuracy: A Two-Cycle Audit Using 2023 V3 Guidance
N Pilbro, M Poole, A Ahmad
A Service Evaluation on the Duration of Combined Orthodontic-Orthognathic Surgery Treatment at Kingston Hospitalawaiting amendments
H Marchant, F Naini
A Quality improvement project to shorten waiting times and enhance the patient journey for orthodontic-oral surgery MDT patients
L Seager, K Bhogal, A Razzik, A Patel, F Lourenco, J Gale
The implementation of digital coding in the Orthodontic Department: a two-cycle retrospective audit
H Overton-Smith, T Jones
David Williams (DCT) and John Watt (ST), Eastman Dental Hospital, King’s College Hospital, London & Royal Surrey Hospital, Guilford, UK
Background/Rationale Early palpation for, and surveillance of maxillary permanent canine position is vital in identifying potential impactions and ensuring timely interceptive measures. Guidance from the Royal College of Surgeons (RCS) recommends clinical palpation from age 8, to determine the presence and position of maxillary canines1. Late identification of ectopic maxillary canines may result in root resorption of maxillary incisors and necessitate complex multidisciplinary management in secondary care. Furthermore, the British Society of Periodontology (BSP) advises routine Simplified Basic Periodontal Examinations (sBPE) from age 7 to assess periodontal health early2. Maintaining excellent periodontal condition is essential for overall oral health, and especially necessary for patients undergoing, or preparing for orthodontic treatment. This audit aims to assess compliance with these guidelines within primary care and identify areas for improvement in both clinical practice and documentation. This is particularly important in the location where this audit was completed, the rural Southwest of England, an area recognised as one of the most severe ‘dental deserts’ in the country3. With a stretched NHS dental workforce there is a possibility that patients may not be monitored or lost to follow-up, hence criticality of accurate and early diagnosis.
Aims and Objectives
This audit aims to assess the age at which maxillary permanent canines are first being palpated for in primary care; it also aims to determine the age at which initial sBPEs are being completed for paediatric patients, and their frequency.
The objective of this audit is to inform primary care dentists about the importance of early maxillary canine position and periodontal assessment and to improve respective monitoring and documentation.
Standards/guidelines/evidence base
The gold standards for this audit include:
100% documentation of patients aged between 8 and 11 years of age having their maxillary canines palpated.
100% documentation of patients aged between 8 and 15 years of age having a sBPE carried out at their most recent examination.
Sample and data source
The first cycle comprised of 203 patients attending for recall examination between 1st January 2025 and 1st March 2025. The second cycle consisted
of 191 patients attending between 1st April 2025 and 1st June 2025. The third cycle consisted of 175 patients attending between 1st July 2025 and 1st August 2025. Seven months were chosen to provide an adequate sample size, representative of the practice’s patient population. Overall, 569 patients were included in the audit.
Data was accessed from the practice computer records and included patients from all five of the practice’s general dental practitioners (GDPs). Exclusion criteria included any patients under 8 years old, emergency attendees, patients over 11 years old for maxillary canine palpation and over 15 years old for sBPE, for ease of data collection.
Audit type
Criterion based, retrospective clinical audit.
Methodology
The patient data was accessed through the practice’s electronic record-keeping software (EXACT). The audit consisted of three cycles. The first cycle involved a retrospective assessment of patient records from the beginning of the new year. The second and third cycles were conducted prospectively, following discussion and change implementation.
The data collected included patient age, whether documentation of maxillary canine palpation was present in the records, and age of first palpation recording, evidence of sBPE completion at most recent examination and age of first sBPE recording. For patients aged 8 to 11 years old, it was checked whether canine palpation was recorded at their most recent examination. Data was manually recorded and entered into a structured spreadsheet using Microsoft Excel.
Following first cycle completion, an information sheet was created and distributed to all practice GDPs. This sheet explained the importance of timely canine palpation and periodontal assessment and discussed clinical guidelines and the findings from the first audit cycle. Opportunity was given to discuss the document with the audit lead. Recommendation was made for prompts in note templates encouraging documentation of canine palpation and sBPE. After a one-month implementation period, the second cycle was undertaken with identical methodology as the first. A slightly smaller data set was obtained during the second cycle, owing to bank holidays and clinician leave. After second cycle completion, an updated information sheet was produced and distributed to the GDPs, summarising cycle results, and highlighting areas of improvement and those needing development. Posters were created for clinical areas to reinforce guidelines and local teaching, and as visual prompts for documentation. Local teaching was provided to GDPs about the results of the audit to raise awareness on the subject. An implementation period of 1 month was set, after which the third cycle data was collected.
There was improvement in the rate of both maxillary canine palpation (in patients aged between 8 and 11 years old) and in sBPE at most recent examination (Table 1).
Patients with a completed sBPE at latest recall increased from 40% (n=81) in the first cycle to 78% (n=148) in the second cycle, and 84% (n=147) in the third cycle.
Data indicated that maxillary canine palpation occurred most frequently at age 11 (42%, n=16), in the first cycle, at age 10 (31%, n=29) in the second cycle, and at age 11 (29%, n=28) in the third cycle. Completion of sBPEs at latest recall examination was noted most frequently in patients aged 15 (22%, n=18) in the first cycle, at aged 13 (15%, n=13) in the second cycle, and again at age 15 in the third cycle (14%, n=25). Both canine palpation and sBPE occurred most infrequently in younger patients; sBPE at age 9 (6%, n=5) in the first cycle, at age 8 (9%, n=13) in the second cycle and at age 8 (5%, n=9) in the third cycle, with canine palpation at age 8 (11%, n=4) in the first cycle, and again at age 8 in both the second cycle (15%, n=14), and third cycle (13%, n=12).
Mean age in the first cycle for first canine palpation assessment was 10 years, and 7 months old and 12 years, and 2 months old for sBPE. Improvement was seen in the second cycle, with mean first canine palpation assessment at 10 years, and 1 month old, and first sBPE completed at 11 years, and 7 months old.
A further improvement was seen in the third cycle, with mean first canine palpation assessment at 10 years, and 0 months old, and first sBPE completion at 11 years, and 5 months old.
The results of this audit highlight that the gold standards for assessment and documentation of maxillary canine palpation and sBPE are not currently being met. Nonetheless, there was encouraging and significant improvement between cycles with improvement in notation of both canine palpation and sBPE at latest recall examination, with evidence of sustained clinical behaviour in the third cycle.
Maxillary canine palpation at latest examination increased from 38% (n=38) in the first cycle to 82% (n=93) in the second cycle, and 86% (n=82) in the third cycle. The proportion of patients within each respective age group (8-11 years) with maxillary canine palpation at most recent recall was also improved, with first cycle completion at 22% (n=4), 29% (n=7), 44% (n=11), and 47% (n=16) at ages 8, 9, 10, and 11 years old respectively, compared to second cycle completion at 67% (n=14), 76% (n=22), 85% (n=29), and 93% (n=28), and third cycle completion at 71% (n=12), 82% (n=18), 89% (n=24), 97% (n=28). (Figure 1).
Discussion of first cycle results with practice GDPs highlighted a feeling that canine palpation was being carried out, but was perhaps not always documented in the patient’s records. The information sheets reinforced the need for early surveillance and notation both for improved patient outcomes, and from a medico-legal perspective for the clinician.
A retrospective audit conducted at TW13 Dental Practice in 2018 reported comparable challenges in sBPE usage and documentation in paediatric populations4. The audit found 40% of patients aged 7–17 had no sBPEs recorded. Of those who did, 10% did not have the findings included in their clinical management. Several records were missing sBPE scores despite documentation stating the examination was completed. These findings echo early patterns identified in the first cycle of this audit and reinforce the importance of consistent, guideline-led documentation.
Whilst third cycle results suggest an initially positive and sustained impact from clinician template updates and awareness efforts, further intervention is needed to achieve greater compliance with the proposed standards. Possible barriers to full compliance include less familiarity with paediatric specific guidance, individual clinician experience and opinion, as well as variable documentation.
1. Teaching session to be provided to practice GDPs discussing audit results, importance and guidelines within the next 6 months.
2. Re-audit in 12 months.
David Williams (Project lead, audit and protocol design, data collection)
John Watt (Data analysis, audit editor)
1. Royal College of Surgeons of England. Management of the palatally ectopic maxillary canine [Internet]. London: Royal College of Surgeons of England; 2022 [cited 2024 Sep 1]. Available from: https://www.rcseng.ac.uk/-/media/files/ rcs/fds/guidelines/2management-of-the-palatally-ectopicmaxillary-canine--revised-with-edits-25-jan-2023.pdf
2. British Society of Periodontology. Executive summary: simplified basic periodontal examination (BPE) for the under 18s [Internet]. London: BSP; 2021 [cited 2024 Sep 1]. Available from: https://www.bsperio.org.uk/assets/downloads/Executive_Summary_Simplified_BPE_for_the_Under_18s__BSP_BSPD_updated_2021_FINAL_PDF_version_130721.pdf
3. Westgarth D. Dental deserts: The exception or the rule? BDJ In Practice. 2024;37:126–7.
4. PR132: An audit to assess periodontal screening methods and management in children aged 7–17 years old. J Clin Periodontol. 2018;45(S19):164–5. doi:10.1111/ jcpe.133_12915
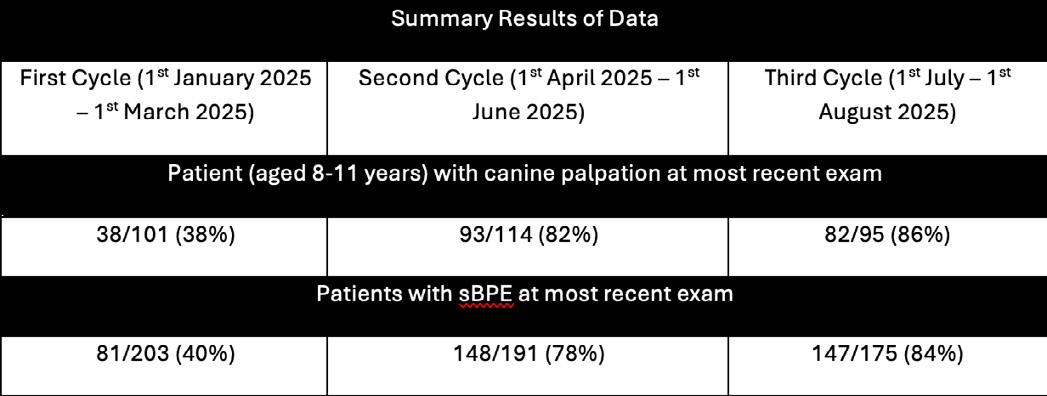
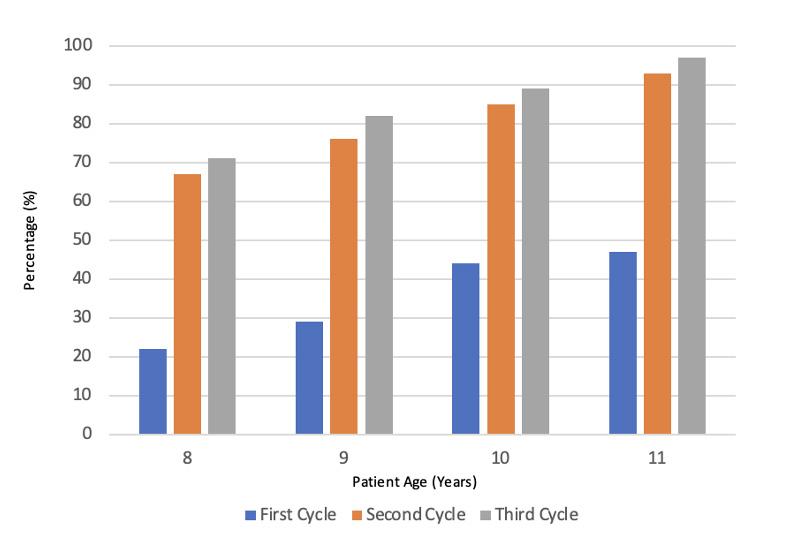
Figure 1 - Percentage of Age Group (8-11) with maxillary canine palpation at most recent examination
William Timmis (DCT), Rose Bannister (Specialist Orthodontist), Lucy Brown (Consultant Orthodontist), Jennifer Rae (Consultant Orthodontist), Harrogate and District NHS Foundation Trust Community Dental Service, Harrogate, UK
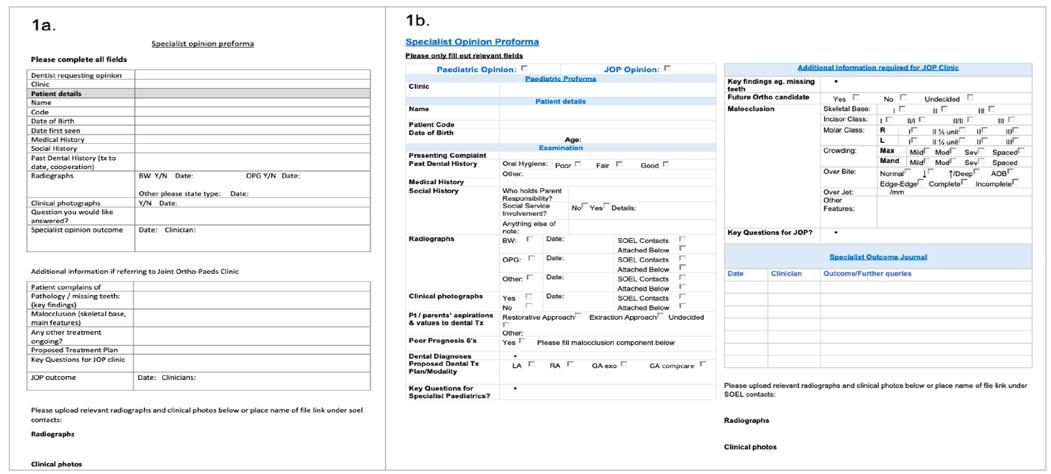
Background/Rationale Joint Orthodontic-Paediatric (JOP) Clinics provide a multidisciplinary approach to complex cases requiring both specialist orthodontic and paediatric input. A combined clinic helps to reduce treatment planning appointments, improving patient care and clinical efficiency1. Harrogate NHS Foundation Trust (HDFT) Community Dental Service (CDS) introduced a monthly virtual JOP Clinic in April 2023 to support its 12 clinics across North Yorkshire. The virtual nature of the JOP Clinic reduces the necessity for patients to travel into secondary care and minimizes HDFT’s carbon footprint. Efficient and effective JOP decision-making is necessary to maximise the number of patients seen on each clinic, reduce patient travel and provide a valuable use of resources. Senior Dental Officers (SDO) working across the 12 sites refer patients to the JOP clinic; these referrals are triaged before a Consultant Paediatric Dentist and Consultant Orthodontist meet virtually. Incomplete referral forms are rejected as the information provided is insufficient for treatment planning (Figure 1a.). Re-referral can be made once all required information is collected, which results in a prolonged patient journey. Incomplete referrals also have an economic and cost implication2. A standard operating procedure for JOP referrals could increase JOP clinic productivity3. The Quality Improvement project (QIP) was approved by HDFT Improvement and Transformation Team to assess and improve JOP proforma completion and enhance the quality of referrals to the virtual clinic.
Aims and Objectives
The aim of the QIP was to evaluate and seek to improve the efficiency and effectiveness of the novel virtual JOP clinic. The objectives were to improve the quality of referrals, increase number of patients discussed on each JOP clinic and quantify the reduction in patient travel distance and associated carbon footprint.
Standards/guidelines/evidence base
There is no defined standard in the literature for quality of referrals to JOP clinics. Therefore, the standard was set locally that 90% of questions within the JOP proforma should be completed for each patient referred to the JOP clinic. This is in line with other audits investigating the quality of referrals to a JOP clinic and specialist orthodontic services3-4.
Sample and data source
Data was accessed via the electronic patient management system (Software of Excellence, SOE) Initial recording of baseline data occurred retrospectively between 01/04/2023 - 1/10/2023 (n=51). Continuous quantitative data for cycle 1 between 1/12/23 – 1/5/24 (n=39) and cycle 2 between 1/6/24 – 1/7/24 (n=19) was collected
prospectively on a weekly basis. All JOP referrals discussed during these timeframes were included for data collection and analysis.
Audit type
Two cycle multi-centre QIP with retrospective and prospective data collection.
Methodology
A QIP team was established which included a dental core trainee (DCT), a Specialist and Consultant in Paediatric Dentistry and an Orthodontic Consultant. The DCT accessed baseline data via retrospective collection of JOP proformas stored within the electronic patient record. The inclusion criteria involved all patients who were given an appointment to the JOP clinic.
Following approval from the HDFT Improvement and Transformation Team, two complete plan, do, study, act (PDSA) cycles were undertaken. Anonymous stakeholder questionnaires were distributed to SDOs and the Specialist JOP clinicians to assess staff opinion on the current JOP proforma and tailor recommendations to CDS requirements. PDSA cycle 1 and 2 data was accessed prospectively by the DCT on a weekly basis to assess the effect of implemented recommendations. Prevented
patient travel distance was calculated from patient home addresses to the nearest secondary care facility (York Hospital, Harrogate District Hospital or Scarborough General Hospital). All data was recorded on a Microsoft Excel spreadsheet. Findings
The results including baseline data, PDSA cycle 1 and PDSA cycle 2 were plotted monthly on a runchart designed in Microsoft Excel.
Cycle 1
Plan: Distribution of anonymous staff surveys to gain feedback on the JOP proforma. Staff teaching to increase awareness of JOP proforma targets and the positive effect that completed proformas have on the JOP clinic productivity. Compliance with targets will help improve the quality of JOP referrals and shall be demonstrated in run-charts.
Do: Review of anonymous staff feedback and generation of a refined JOP proforma with more specific components to help standardise referrals (Figure 1b). Staff teaching with the refined JOP proforma to help improve its completion.
Study: JOP proforma completion increased from a mean of 49% (baseline) to 85% (Figure 2.). The median number of patients discussed on each JOP
clinic increased from 8 (baseline) to 10 (Figure 3). Median prevented patient travel increased from 279km per JOP clinic (baseline) to 377km per JOP clinic.
Act: Tailored feedback was given to SDOs not complying with targets.
Cycle 2:
Plan: Redistribution of anonymous staff surveys and review of staff feedback. Provision of SDO teaching and case-based discussions using the refined JOP proforma.
Do: Further refinement of the JOP proforma to include a standardised social history component.
Study: As demonstrated in Figure 2, there was a positive shift in proforma completion with the final 3 consecutive data points reaching the 90% target. JOP proforma completion increased to a mean of 97%. The median number of patients discussed on each JOP clinic was 10 and median prevented patient travel was 320km per JOP clinic.
Act: The results were distributed to SDOs and it was agreed to adopt the refined proforma permanently. The refined proforma was presented at a regional DCT study days to help other units improve the quality of JOP referrals.
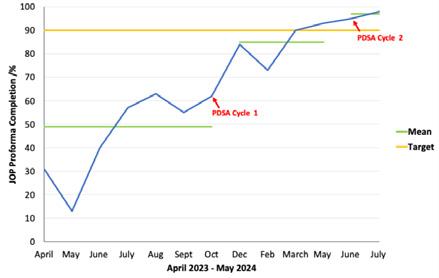
Proforma completion improved significantly from 49% (baseline) to 97% (Cycle 2), exceeding the 90% target. The 90% target was achieved during the last month of PDSA cycle 1, a second PDSA cycle was undertaken to ensure compliance with standards were maintained. Staff teaching and provision of tailored, individual feedback helped to provide clarity to SDOs referring to virtual JOP clinic. It also helped to ensure understanding of what information was expected within the JOP proforma. Anonymous staff questionnaires highlighted that 100% of SDOs felt the new JOP proforma was easy to complete and provided rapid access to Specialist input. SDO’s reported that clickable checkboxes supported faster completion of the more detailed proforma and JOP outcomes were easy to understand and returned in an appropriate timeframe. Additionally, 100% of JOP Consultants reported that the new proforma contained all necessary information for treatment planning. The refined proforma streamlined the referral process and ensured simplicity for SDOs. This was also reflected in the surveys completed by JOP Consultants, which highlighted the improved quality of JOP referrals, enhanced JOP clinic productivity and enabled more patients to be discussed on each clinic. Management of poor prognosis first permanent molars was the most common reason to seek a JOP opinion (27%). The refined proforma incorporated aspects from Royal College of Surgeons of England Guidelines on the management of poor prognosis molars including the patient and parents’ aspirations & values to dental treatment5. This allowed treatment planning to be more easily tailored to the best interest of the patients.
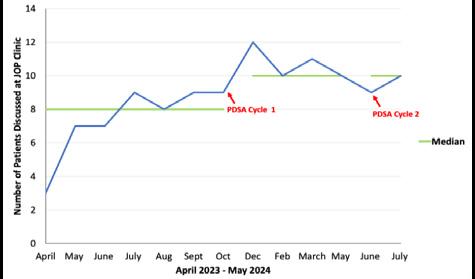
Patient travel is the largest carbon-intensive activity in dental services across England, accounting for 33.4% of carbon-intensive activity6. Baseline data demonstrated that collectively 1955km of patient travel was prevented, equivalent to a median of 279km per JOP clinic. The refined proforma was reported to improve decision making efficiency, so more patients could be discussed on each JOP clinic and reduce the need for patient travel into clinic. This resulted in a more cost-effective use of resources compared to similar services7 and reduced the CDS’ carbon footprint. PDSA Cycles 1 & 2 collectively prevented 2151km of patient travel, equivalent to a median of 359km per JOP clinic. This ultimately aids the NHS Carbon Footprint Plus scheme to deliver a ‘Net Zero’ National Health Service by 20458. The slight reduction in the number of patients discussed on the JOP clinic after December 2023 was most likely due to the employment of a new Paediatric Consultant who was unfamiliar with the proforma pathway.
This QIP provides a comprehensive assessment of the entirety of patients discussed on the virtual JOP clinical since its establishment. Whilst the relatively small sample size impacts the reliability of the results, this study offers tangible recommendations to help improve proforma completion and ensure efficient and effective JOP decision making. To better understand the efficacy of the JOP pathway process, further investigations should involve questionnaires to assess patient reported outcomes regarding a virtual JOP clinic compared to a faceto-face setting. Further consideration is needed regarding the wider impact of a more detailed proforma. Although staff found it easy to complete, its effect on SDO workflow was not formally assessed. The structured format may streamline
referrals and reduce follow-up queries, but it may also increase administrative burden. Future evaluations should assess the proforma’s impact on overall service efficiency, including staff workload and administrative demands.
Recommendations
1. Annual staff training with case-based JOP discussions to ensure SDOs are aware of the JOP proforma targets
2. Investigation into patient reported outcome experiences of the JOP clinic being held virtually
3. Repeat PDSA Cycle in 6 months to ensure compliance with standards and to analyse the impact of the refined proforma on overall service efficiency, including staff workload and administrative burden.
William Timmis (Project lead, data collection, analysis, manuscript drafting)
Rose Bannister (Project supervision and approval of manuscript)
Lucy Brown (Project supervision and approval of manuscript)
Jennifer Rae (Project supervision and approval of manuscript)
References
1. Parvizi F, John R, Crawford P Attack N. Multidisciplinary care – how should we manage the complex orthodontic/paediatric dentistry case? Part 1. Orthodontic Update. 2012; 5(2): 3847
2. Watt J and Lee T. A two cycle audit assessing orthodontic rejection rates and quality of rejected referrals to Musgrove Park Hospital and Yeovil District Hospital in Somerset. British Orthodontic Society Clinical Effectiveness Bulletin. 2023; 51: 23-26
3. Aruche-A-Noor H, Brown L, Dhaliwal HK. A 2 cycle audit of the quality of referrals to the joint orthodontic-paediatric clinic at Leeds Dental Institute. British Orthodontic Society Clinical Effectiveness Bulletin. 2022; 49: 46-49
4. Thompson R and Fox N. An audit to assess the quality of referrals to five primary care specialist orthodontic practitioners in Teesside and South Durham. British Orthodontic Society Clinical Effectiveness Bulletin. 2015; 35: 11-12
5. Royal College of Surgeons of England. A guideline for the extraction of first permanent molars in children. 2023. Available at https://www.rcseng. ac.uk/-/media/fds/guidance-for-the-extractionof-first-permanent-molars-in-children.pdf (accessed 10/6/24).
6. Royal College of Surgeons of England. Clinical guidelines for environmental sustainability in dentistry. 2023. Available from: https://www. rcseng.ac.uk/-/media/fds/clinical-guidelinesfor-environmental-sustainability-in-dentistryversion-110.pdf (accessed 10/6/24).
7. Mathi M, Kandiah T and Cedro M. A Service Evaluation of the Joint Orthodontic-Paediatric Clinic at a District General Hospital. British Orthodontic Society Clinical Effectiveness Bulletin. 2021; 47: 41-44
8. NHS England. Delivering a ‘Net Zero’ National Health Service. 2020. Available from: www. england.nhs.uk/greenernhs/publication/ delivering-a-net-zero-national-health-service/ (accessed 2/3/25).
Sally Alwan (DWSi Orthodontics), Eleanor McLaughlin (JDFCT), Ella Woodhead (JDFCT) and Sangeeta Misra (Consultant Orthodontist), Hull University Teaching Hospital, Hull, UK.
Background/Rationale
Orthodontic treatment duration is influenced by a range of clinical and operational factors, and collaboration among different specialties is often necessary for successful treatment completion. This service evaluation focused on understanding how multidisciplinary team (MDT) involvement and continuity of consultant-led care affect overall treatment timelines. The motivation for this project stems from increasing orthodontic waiting lists across the UK, where approximately 200,000 patients undergo treatment annually.1 Recent evidence highlights growing delays in service delivery,2 prompting a need to assess contributing factors. At Hull University Teaching Hospitals NHS Trust, the annual service agreement allocates 12,000 orthodontic appointments, yet only 8,000 were completed in 2023–2024 — a 33% shortfall, underscoring the urgency of this evaluation.
The aim of this project was to examine factors affecting orthodontic treatment duration, focusing on multidisciplinary team (MDT) involvement and consultant continuity. The objectives were to determine average treatment time and appointment numbers, evaluate the impact of other specialties such as restorative, orthognathic, paediatric and surgical services, and analyse how consultant consistency or transfers influences overall timelines.
Standards/guidelines/evidence base
As a service evaluation, no predefined clinical standards were used, but literature highlights why treatment duration is a key marker of quality and efficiency. Complexity, such as impacted canines, extractions, or surgery, patient compliance and continuity of care all influence treatment length.3 4 Longer treatment increases risks of enamel demineralisation, caries, periodontal problems and root resorption and reduces patient satisfaction.5 6 National commissioning guidance advocates a pathway-based approach with MDT input to streamline care and support efficient, high-quality treatment.7 This service evaluation aimed to identify areas where treatment could be streamlined, reduce unnecessary prolongation, and enhance departmental efficiency, ultimately improving patient outcomes.
The sample consisted of patients treated within the Orthodontic Department who had completed their treatment and were debonded between 2019 and 2024. A total of two cycles were conducted.
Cycle 1 data retrieval was completed between December 2023 and March 2024. Patients were selected from a list of patients on a patient initiated follow up (PIFU) or under retainer review as, prior to April 2024, the department did not hold a comprehensive list of debond data.
Cycle 2 data retrieval was completed between January 2025 and March 2025. Patients were selected from a comprehensive list of debonds which had occurred after April 2024.
Data was obtained through a retrospective review of paper-based clinical notes, manually collected by Joint Dental Foundation Core Trainees (JDFCTs). The findings were recorded in an Excel spreadsheet for analysis. In order to ensure that data was not duplicated between cycles, while inputting data into the excel spreadsheet, the JDFCTs manually checked using the search function and patient identifier number.
Photographic records were reviewed where necessary to confirm missing IOTN scores. Despite challenges such as illegible handwriting, missing documentation, and delays in retrieving archived notes, the sample provided a representative overview of treatment pathways and durations across the department.
Audit type
Retrospective criterion-based service evaluation focused on treatment duration and influencing factors, benchmarked against internal service expectations and national guidance on MDT collaboration. Two cycles were carried out to assess consistency and changes over time.
Methodology
This Service Evaluation was conducted through a retrospective review of paper-based clinical notes for patients treated within the Orthodontic Department who had completed their treatment and were debonded between 2019 and 2024. Data collection was manually carried out by JDFCTs, with all findings systematically recorded in an Excel spreadsheet for analysis. To avoid duplication of patients the JDFCTs manually used the patient identifier within the spreadsheet.
Patients treated within the Orthodontic Department whose treatment was completed and debonded between 2019 and 2024.
Exclusion Criteria
Patients with ongoing or incomplete treatment are excluded, as well as those diagnosed with cleft lip and palate (CLP) or complex syndromic conditions such as Craniofacial syndromes.
Data collected for each patient included the total duration of treatment in months (measured from initial assessment to debond), the number and frequency of orthodontic appointments, the initial IOTN score and a description of the malocclusion. MDT involvement, early debond or extended treatment and documented reasons were noted.
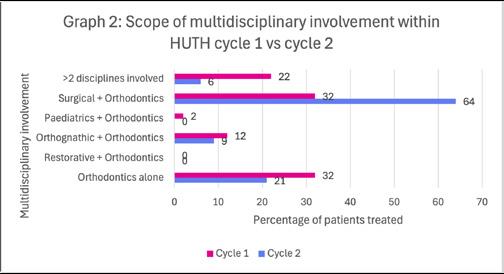
Across both cycles, a total of 58 patient records were reviewed. In Cycle 1, the average treatment duration was 65 months, with patients attending an average of 33 appointments. The appointment interval was 2.18 months, slightly above the expected 2 month standard. Notably, patients managed solely by orthodontists had shorter treatment durations (58 months) compared to those with input from two or more specialties (74 months), highlighting the impact of MDT complexity (Graphs 1 and 2).
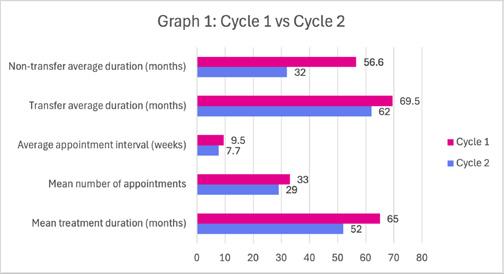
Consultant continuity emerged as a significant factor. Patients treated by a single consultant had an average treatment time of 56 months, whereas those transferred between two or three consultants experienced extended durations of 64 and 86 months, respectively. The most common IOTN classification was 5i (impacted teeth), accounting for 34% of cases. As case severity increased according to IOTN, average treatment duration also tended to rise.
In Cycle 2, targeted interventions were introduced, most notably the ‘next visit’ stamp (Figure 1), which was applied in 84% of records by cycle 2. This prompted supervisors to provide prescriptions for the following visit, ensuring orthodontic therapists could work productively on unsupervised days and maintain treatment progress at every appointment. These changes significantly improved efficiency: average treatment duration decreased from previous levels to 52 months, the number of appointments dropped to 29, and
appointment intervals extended to 7.7 weeks, indicating better scheduling and reduced patient burden. Consultant continuity also showed marked improvements. Patients managed by a single consultant completed treatment in 32 months on average, while those under multiple consultants saw a reduction to 62 months, highlighting the positive impact of consistent clinical oversight.
The service evaluation identified key patterns and operational challenges impacting orthodontic treatment efficiency. Consultant continuity emerged as a critical factor. Patients managed by a single consultant experienced shorter treatment durations due to consistent planning and reduced delays, whereas transfers between consultants often disrupted progression and extended timelines.
MDT involvement, while essential for complex cases, was associated with longer treatment times. Patients requiring input from multiple specialties faced coordination delays and fragmented planning, which contributed to extended treatment duration.
Documentation quality presented a significant barrier to accurate data collection. Issues included illegible handwriting, missing sections, absent IOTN scores requiring photographic review and inconsistent note-keeping. These shortcomings not only affected data collection but also highlighted broader challenges in clinical governance and record management. The study period also overlapped with the COVID-19 pandemic, which is likely to have influenced treatment timelines.
Targeted interventions introduced in Cycle 2, notably the use of clinical stamps for next-visit planning and early debond documentation, proved effective. Their consistent application improved record quality, facilitated delegation to orthodontic therapists and correlated with enhanced appointment efficiency and reduced treatment times.
Finally, the evaluation underscored the importance of case selection and service capacity. Prioritising high-need patients based on IOTN scores and developing the service through the implementation of nurse-led record-taking
enabled better resource management and helped reduce waiting times, supporting improved patient flow and overall service delivery.
1. Establish regular joint orthodontic-surgical clinics to streamline MDT workflows, reduce inter-specialty delays and improve coordination for complex cases.
2. Continue to standardise documentation practices by promoting consistent use of clinical stamps (e.g. “next visit prescription”, “early debond”) and improve legibility and completeness of clinical notes.
3. Integrate digital tools such as intraoral scanners and electronic patient records to support efficient case planning, reduce manual errors and enhance data accessibility.
4. Expand clinical capacity by exploring extended duties for nurses and therapists, including record-taking, appliance checks and delegated reviews, supported by appropriate training and governance.
5. Implement a live debond tracking database to monitor treatment completion rates, identify trends and support real-time service evaluation and planning.
6. Introduce structured patient feedback systems (e.g. surveys, follow-up calls) to capture insights on patient experience and inform service improvements.
7. Enhance consultant continuity through improved rota planning and handover protocols, ensuring smoother transitions and minimising treatment disruption.
Strengthen case selection criteria to prioritise high-need patients and optimise resource allocation
We would like to extend our sincere thanks to the entire audit team for their dedication and meticulous data collection throughout this project. Special appreciation goes to Hull and East Yorkshire Teaching Hospitals for their support and collaboration. We are also grateful to the administrative staff who assisted with the retrieval
of patient records, often under challenging circumstances. Finally, heartfelt thanks to all members of the Orthodontic Department for their kind support and commitment to implementing the audit recommendations with enthusiasm and professionalism.
Project involvement
Sally Alwan (Project lead, design, presentation)
Eleanor McLaughlin (Data collection, presentation)
Ella Woodhead (Data collection, presentation)
Sangeeta Misra (Supervisor)
References
1. British Orthodontic Society. BOS statement: Claims about orthodontics [Internet]. 2018 [cited 2024 Jun 20]. Available from: https://bos.org. uk/statements/bos-statement-claims-aboutorthodontics/
2. Patel A. Is there a growing need for private orthodontic treatment in the UK? BDJ In Pract. 2023;36(15)
3. Mavreas D, Athanasiou A. Factors affecting the duration of orthodontic treatment: a systematic review. Eur J Orthod. 2008;30(4):386–395.
4. Aktas B, Celebi F, Bicakci A. The effect of orthodontist change on treatment duration and outcomes. Am J Orthod Dentofacial Orthop. 2022;161(1):380.e1–380.e6.
5. Talic, N. 2011. Adverse effects of orthodontic treatment: a clinical perspective. Saudi Dental journal. 23(2), pp.55-59
6. Masood Y, Masood M, Zainul NNB, Araby NBAA, Hussain SF, Newton T. Impact of malocclusion on oral health-related quality of life in young people. Health Qual Life Outcomes. 2013;11(25):1–6.
7. National Health Service. Guides for commissioning dental specialities –Orthodontics [Internet]. London: NHS; 2015 [cited 2024 Mar 23]. Available from: https:// www.england.nhs.uk/commissioning/wpcontent/uploads/sites/12/2015/09/guid-commsorthodontics.pdf
Ellen Johnson (ST), Farooq Ahmed (Consultant Orthodontist), Farnaz Motamedi (Consultant Orthodontist), Northwick Park Hospital, UK
Background/Rationale This two-cycle project aimed to evaluate patient satisfaction with conventional impression taking versus intraoral scanning in orthodontics. Traditional alginate impressions, while longestablished, are often associated with discomfort, gag reflexes and taste aversion1. In contrast, digital intraoral scanning offers a modern alternative with potential benefits in patient comfort, efficiency and accuracy2. As digital technologies are increasingly adopted within orthodontic practice, it is important to assess their impact on patient experience, particularly during the early stages of implementation. Local evaluation of patient satisfaction allows the department to establish baseline performance, identify improvement areas, and ensure that new technologies meet expected standards of care.
The aim was to assess patient satisfaction with intraoral scanning at NPH and compare patient preference between intraoral scanning and conventional impression-taking. Patient-reported experiences were evaluated across domains including comfort, perceived duration, gag reflex, taste, jaw discomfort and overall satisfaction. A further aim was to identify areas for local service improvement to enhance patient experience and support quality improvement.
Standards/evidence base
Patient satisfaction standards were based on locally agreed measures within the orthodontic service. Questionnaires 1 and 2 were adapted from previously validated questionnaires 3, 4, 5, 6. While the gold-standard benchmark for patient satisfaction in dental services is 100%7 a lower threshold was agreed locally due to the recent introduction of intraoral scanning within the department. This pragmatic adjustment accounted for the expected learning curve associated with new digital technology, as operator experience has been shown to influence scanning outcomes and patient satisfaction8. An overall satisfaction target of ≥85% was therefore selected as the standard.
The inclusion criteria were patients undergoing intraoral scanning for orthodontic purposes, with no age restrictions. Patients were excluded if they had craniofacial deformities, behavioural disabilities, or absence of conventional impression-taking for comparison. The sample came from orthodontic patients attending outpatient appointments at NPH. Cycle 1 was conducted over four weeks, from 8 January to 8 February 2025, and included seven patients. Cycle 2 was carried out over two weeks, from 27 October to 9 November 2025, and included eleven eligible patients. The same questionnaires were used to ensure comparability between cycles.
A five-page patient questionnaire was piloted within the department. Feedback from colleagues identified areas for refinement regarding the length and the risk of respondent fatigue. Consequently, it was streamlined to three pages by including a single visual analogue scale (VAS) at the top, rather than one for each question. Following this, the questionnaire was administered to eligible patients and can be seen in Figure 1.
The first page collected demographic data including age and gender. Clinical information was also recorded, including the stage of orthodontic treatment. Additionally, participants were asked whether they had previously undergone an intraoral scan or a conventional impression. Questionnaire 1 was on the second page and used a VAS from 0-10 to assess eight domains related to intraoral scanning. The final page consisted of Questionnaire 2 explored preference between the two techniques using nine domains. Data was collected during routine clinical sessions. All intraoral scans were performed using the iTero Element™ 2 imaging system, while conventional impressions were taken using alginate material. Responses were anonymised and recorded in Microsoft Excel.
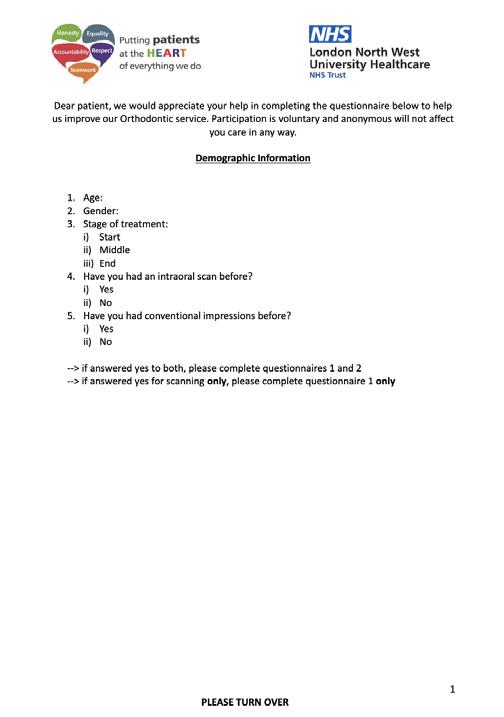
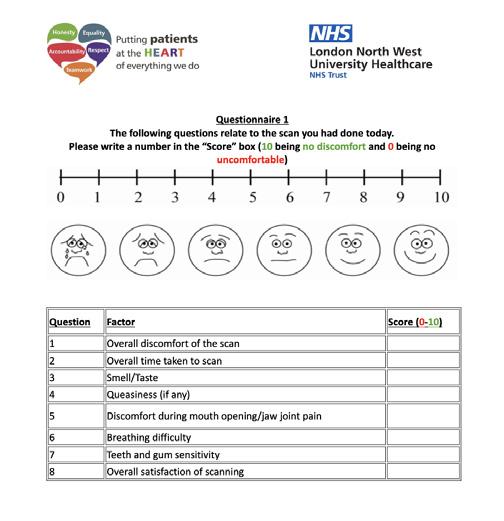
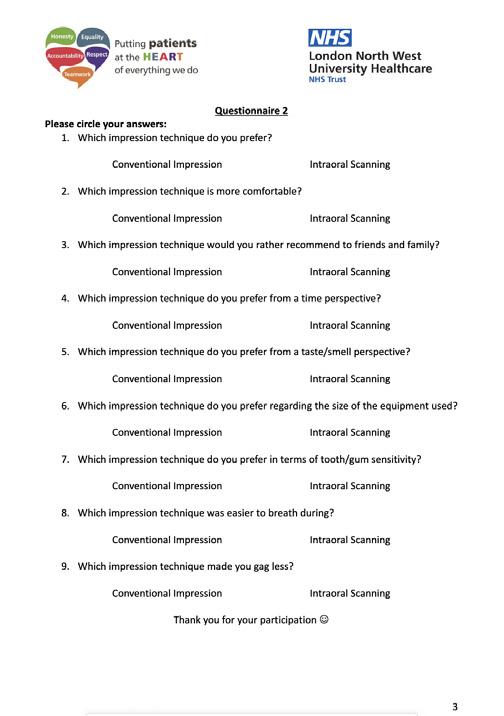
Across both cycles, 18 patients participated with similar age ranges (11–29 years and 9–30 years, respectively). Cycle 1 included four females and three males; Cycle 2 had eight females and three males. Most patients were at the start of treatment (Cycle 1: 4; Cycle 2: 10). Prior experience with conventional impressions was reported by three and four patients in Cycle 1 and 2. No patients had experience in Cycle 1 and only one patient in Cycle 2 had previously undergone intraoral scanning.
In Questionnaire 1, Cycle 1 fell below the agreed standard of 85% with an overall patient satisfaction of intraoral scanning score of 79%. Following this, training in the use of the intraoral scanner was delivered to staff. This consisted of a lunchtime demonstration explaining technique improvement, IT basics and use of the 3 in 1 during scanning. This was summarised over email to ensure all clinicians had the information. To improve time taken, a concise ‘cheat sheet’ was created, laminated, and attached to the scanner to provide step-by-step login instructions and troubleshooting guidance, thereby reducing ITrelated delays and improving utilisation.
Following interventions, Questionnaire 1 results in Cycle 2 demonstrated improvement across all domains, except discomfort during scanning, which reduced by 2% on average but a smaller range was observed suggesting less variability and greater consistency. Queasiness improved from 56% to 92% and overall satisfaction with intraoral scanning increased from 79% to 89% which was above the agreed standard (Figure 2).
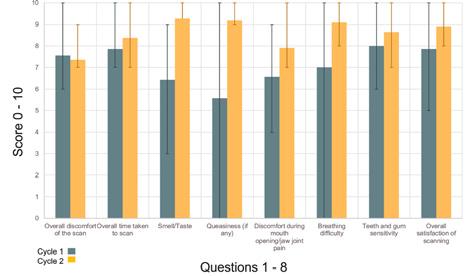
Figure 2. Cycle 1 vs Cycle 2: Patient satisfaction of intraoral scanning average scores with their ranges.
Questionnaire 2 assessed patient preference between the two methods. For analysis, conventional impressions were assigned a score of 0 and intraoral scanning a score of 1. Mean scores were calculated, rounding to one decimal, and are presented in Figure 3. Cycle 2 confirmed the findings from Cycle 1, demonstrating consistently high patient satisfaction and preference. Although there was a slight reduction in overall preference for intraoral scanning (100% to 90%), this and all domains remained in favour of intraoral scanning.
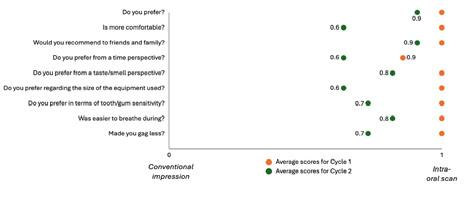
Figure 3. Patient preference of conventional impressions vs intraoral scanning.
Patient preferences are important for service improvement and recent systematic reviews show that most orthodontic patients prefer intraoral scanning over conventional impressions, consistent with the findings of this evaluation8. Patient preference for intraoral scanning remained high in both cycles (100% and 90%; Figure 3), although earlier studies reported lower preference rates of approximately 51%9. This may reflect increasing patient familiarity with digital workflows, which are perceived as modern and comfortable4.
Improved comfort with intraoral scanning has been attributed to the absence of impression material, the ability to pause procedures and increased patient engagement. Comfort related to perceived duration remains a more variable domain with published studies reporting mixed findings. Although some describe intraoral scanning as quicker, others note more negative perceptions of time10. This variability was reflected in this evaluation, where time taken scored 78% in Cycle 1. However, with further training, patient satisfaction did improve to 84% in Cycle 2 (Figure 2). This is reflected in the literature that operator
experience can affect patient outcomes8. Thus, staff training is an important aspect to achieving high standards of care.
Although the literature consistently highlights reduced queasiness and breathing difficulty with intraoral scanning3, 6, these domains were initially rated least favourably in Cycle 1 scoring just 56% and 70% (Figure 2). Other low scoring domains were discomfort related to joint pain or prolonged mouth opening. Factors such as limited opening, dental crowding and bulky equipment can increase discomfort during scanning4. However, it should be noted that following targeted staff training, marked improvement was observed across all these domains (Figure 2).
Initially, age, prior experience, and treatment stage did not appear to influence patient-reported outcomes, although the small sample size limited detention of subtle effects. Cycle 1 included seven patients, increasing to eleven in Cycle 2 following targeted recruitment during a highvolume period of new trainees starting. Despite this, data collection in Cycle 2 was shortened to two weeks due to staffing constraints. This reduced timeframe is a limitation of this project and extending to four weeks may have yielded a larger sample. Age ranges were similar across cycles which included a mix of male and female participants, and most patients were at the start of treatment. Prior experience with conventional impressions was reported by three patients in Cycle 1 and four in Cycle 2, while only one patient in Cycle 2 had previously undergone intraoral scanning. A further limitation relates to the potential for recall bias. Patients were asked to compare their experience of an intraoral scan performed immediately prior to questionnaire completion with a conventional impression that may have been undertaken weeks or months earlier. This time gap is likely to affect the accuracy and reliability of patient recollection, potentially leading to overemphasis of the most recent experience and reduced confidence in direct comparative responses. This confounding factor should be considered when interpreting the findings.
Future quality improvement projects (QIP) should consider longer data collection periods and multi-centre recruitment to improve sample size and generalisability. Performing both impression techniques within the same appointment may also reduce recall bias.
Recommendations
1. Intraoral scanning is the preferred impression technique for patient comfort and should be adopted into routine practice.
2. Continue training on intraoral scanner handling to enhance patient experience, delivered through tutorials supported by a concise ‘cheat sheet’ summary circulated to staff and attached to the scanner.
3. Repeat QIP, with longer time periods and larger samples.
Project involvement
Ellen Johnson (Project lead)
Farooq Ahmed (Supervisor)
Farnaz Motamedi (Supervisor)
References
1. Rosted P, Bundgaard M, Fiske J, Pedersen AM. The use of acupuncture in controlling the gag reflex in patients requiring an upper alginate impression: an audit. British dental journal. 2006 Dec;201(11):721-5.
2. Hwang HH, Chou CW, Chen YJ, Yao CC. An overview of digital intraoral scanners: past, present and future-from an orthodontic perspective. Taiwanese Journal of Orthodontics. 2018;30(3):3.
3. Mangano A, Beretta M, Luongo G, Mangano C, Mangano F. Conventional vs digital impressions: acceptability, treatment comfort and stress among young orthodontic patients. The open dentistry journal. 2018 Jan 31;12:118.
4. Christopoulou I, Kaklamanos EG, Makrygiannakis MA, Bitsanis I, Tsolakis AI. Patient-reported experiences and preferences with intraoral scanners: a systematic review. European Journal of Orthodontics. 2022 Jan 1;44(1):56-65.
5. Joda T, Brägger U. Patient‐centered outcomes comparing digital and conventional implant impression procedures: a randomized crossover trial. Clinical Oral Implants Research. 2016 Dec;27(12):e185-9.
6. Yuzbasioglu E, Kurt H, Turunc R, Bilir H. Comparison of digital and conventional impression techniques: evaluation of patients’ perception, treatment comfort, effectiveness and clinical outcomes. BMC oral health. 2014 Jan 30;14(1):10.
7. The Royal College of Surgeons of England. Faculty of Dental Surgery. Methodologies for clinical audit in dentistry. 2000. Available at: https://www.rcseng.ac.uk/libraryand-publications/rcs-publications/docs/ methodologies-for-clinical-audit-in-dentistry/ (accessed 14 January 2026).
8. Limones A, Morton D, Sallorenzo A, Lin WS, Sadid-Zadeh R, Phasuk K, Revilla-León M, Gómez-Polo M. Impact of operator experience on intraoral digital scanning: A systematic review, meta-analysis, and meta-regression. Report of the Committee on Research in Fixed Prosthodontics of the American Academy of Fixed Prosthodontics. The Journal of Prosthetic Dentistry. 2025 Oct 14.
9. Burhardt L, Livas C, Kerdijk W, van der Meer WJ, Ren Y. Treatment comfort, time perception, and preference for conventional and digital impression techniques: A comparative study in young patients. American Journal of Orthodontics and Dentofacial Orthopedics. 2016 Aug 1;150(2):261-7.
10. Sailer I, Mühlemann S, Fehmer V, Hämmerle CH, Benic GI. Randomized controlled clinical trial of digital and conventional workflows for the fabrication of zirconia-ceramic fixed partial dentures. Part I: Time efficiency of complete-arch digital scans versus conventional impressions. The Journal of prosthetic dentistry. 2019 Jan 1;121(1):69-75.
Maliha Suleman (ST) and Stacey Tsang (Consultant Orthodontist), Milton Keynes
University Hospital, Milton Keynes, UK
Background/Rationale Patients requiring orthodontic and surgical interventions need joint input from Orthodontic and Oral and Maxillo-Facial (OMFS) departments. Effective interdisciplinary collaboration is essential to deliver timely and coordinated care. However, delays between referrals, assessments and treatment can risk patient harm; including root resorption, subsequent loss of the adjacent teeth1, cystic change of unerupted teeth2, infra-occlusion of submerging teeth3 and repeated radiation exposure. Furthermore, inefficiencies and delays can result in duplicated review appointments, patient dissatisfaction, litigation, and complaints4 which adds an additional burden on clinical services.
At MKUH, patients referred to the orthodontic department are first seen on New Patient Assessment (NPA) clinics. If appropriate, an internal referral is made to the OMFS department, the patient is then assessed and, if required, listed for treatment.
This audit was initiated to evaluate the RTT pathway for orthodontic patients who require dentoalveolar surgery and to identify organisational and patient-level adverse outcomes. Findings will inform process improvements, resource allocation, and potential pathway restructuring.
Aims and Objectives
The primary aim was to determine the average RTT waiting times for orthodontic patients requiring dentoalveolar surgery at MKUH and assess compliance with national and local standards. Secondary objectives were to determine any clinical or organisational consequences of delays within the joint care pathway.
Standards/guidelines/evidence base
Standard 1: NHS Constitution Standard: 92% of patients start treatment within 18 weeks of referral (elective non-urgent care)5.
Standard 2: Local Trust Standard: 100% of patients should begin treatment within 65 weeks of referral to Orthodontic and OMFS departments. This was the target as of 1st January 2022. The Trust standard is reducing constantly with the current RTT target being (52 weeks).
Sample and data source
All patients referred internally by the Orthodontic department to the OMFS department between 1st January 2022 and 31st December 2023 were identified retrospectively by the Trust Information Governance team using clinical codes.
The inclusion criteria encompassed those requiring dentoalveolar surgery (e.g., surgical removal of supernumeraries/impactions, exposure of unerupted teeth, complex extractions). Orthognathic surgery cases were excluded as they have a different pathway.
A total of 133 patients were identified - following exclusions, 76 patients were audited.
Retrospective, criterion-based clinical audit. Methodology
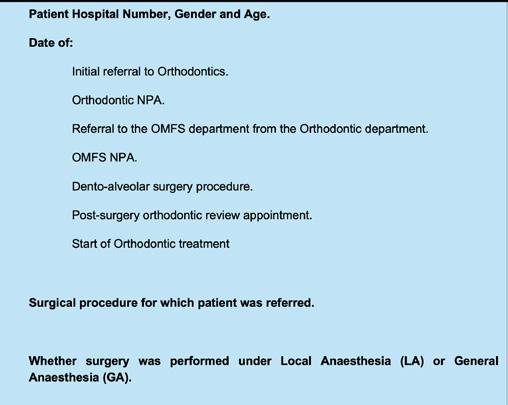
A retrospective review of clinical records was conducted. Data was collated in MS Excel and analyzed using descriptive statistics. Data points collected have been listed in Figure 1.
RTT waiting times were calculated in weeks using appointments dates. For orthodontic patients, the fitting of an orthodontic appliance was deemed as the point of starting treatment. Periods where orthodontic patients were put on review for dental development did not contribute to the total RTT waiting time as this period is referred to as ‘active monitoring’ and the RTT clock is temporarily paused as treatment delay is intentional and due to patient factors.
76 patients were analysed, 52.6% female; 47.4% male; mean age 12.9 years; range 8.1–17.7. Overall, 82% (n=62) patients had dentoalveolar surgery performed under GA and 18% (n=14) patients had treatment under LA. The most common intervention was surgical exposure of impacted teeth, accounting for 25% of cases (n=20), followed closely by surgical removal of impacted canines at 23% (n=18). Infraoccluded teeth (n=12) and routine premolar extractions (n=12) each made up 14% of the cases while supernumerary tooth removal was required in 13% (n=11) of patients. Finally, permanent molar extractions comprised the smallest proportion at 11% (n=9).
Table 1 illustrates the average waiting times (weeks) for patients at each stage of the joint care pathway. A wide range of 0-68.3 weeks was noted between the Orthodontic referral to OMFS NPA due to the occasional same day assessment of patients by OMFS when clinic slots were available; this is no longer routine practice.
Table 2 illustrates the overall and individual department RTT waiting times at MKUH and compliance with the national and local RTT waiting time standards. Both standards 1 and 2 were not met by the Orthodontic and OMFS departments. Only 12.5% and 68.5% of orthodontic patients met the 18-week and 65-week RTT targets, respectively. For patients referred from Orthodontics to OMFS, compliance was lower, at 11.8% and 46.1%, respectively.
During the audit period, 95 patients were reviewed
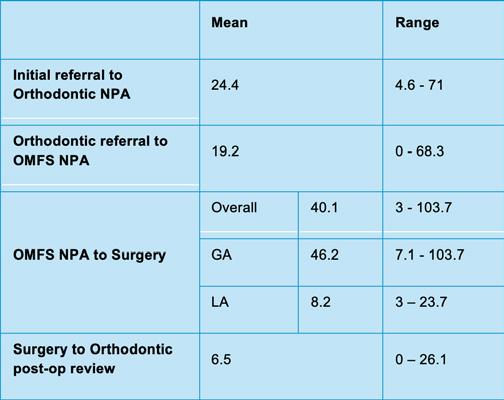
1: Average waiting times (weeks) between stages of the joint care pathway
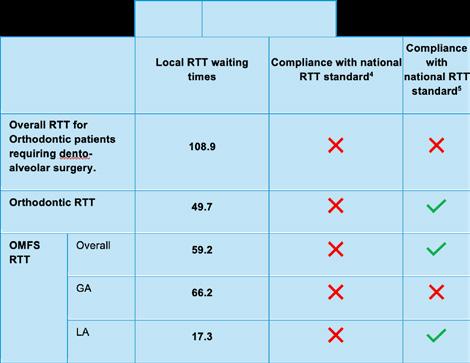
Table 2: Overall and individual department RTT waiting times (weeks)
by Orthodontics whilst remaining on the OMFS waiting list. This was to ensure that the patient was on the OMFS pathway and to check for any clinical changes. These review appointments accounted for a total of 31.7 hours of clinic time. Additionally, radiographs were repeated for 35 patients to ensure in-date records prior to surgery. There were occasions where Orthodontics updated the radiographs with an intraoral radiograph followed by OMFS undertaking an OPG prior to surgery. There were five patients potentially lost-to-follow-up. It was identified later that three of these patients had sought treatment elsewhere and two patients had multiple failure to attend appointments after which they were discharged in line with the Trust policy. Furthermore, two patients referred to Orthodontics on 20/03/2023 and 09/11/2023 were still on the GA waiting list at the time of review. It is also worth noting that eight patients did not require surgery
because the impacted or unerupted teeth erupted spontaneously during the waiting period.
There was no documented evidence of adverse clinical outcomes such as resorption of healthy teeth, cystic transformation of unerupted teeth, or persistent infra-occlusion of submerging teeth. While clinical records suggest no harm resulting from treatment delays, it is important to acknowledge that such changes may go undetected during routine assessments or may not always be accurately documented, even if they have occurred.
The findings of this audit demonstrated noncompliance with the national RTT waiting time of 18-weeks for non-elective treatment by both the Orthodontic and OMFS departments for patients requiring joint care. The adjusted local RTT waiting time standard of 65-weeks was met individually by each department. However, given this is almost 3.5 times the national RTT waiting time and patients requiring joint care are having to wait an average of 2 years (108.9 weeks) from initial referral to Orthodontics before commencing orthodontic treatment, shortcomings still exist in the current pathway. The most significant contributor to the delays in patient care seems to be the average 66.2 week wait between OMFS NPA and surgery under GA. This bottleneck is mainly due to limited theatre capacity and staffing shortages in the OMFS department.
Occasionally, prolonged RTT wait times may lead to a favorable outcome by avoiding unnecessary surgical procedures, particularly when a dental anomaly resolves spontaneously; for example, the natural eruption of an impacted tooth or exfoliation of an infraoccluded tooth. However, based on the findings of this audit, the likelihood of this is low at around 1.1% (8 out of 76 patients). This audit shows that prolonged RTT wait times result in several adverse patient and organisational outcomes. Although not supported by this audit’s findings, the clinical risks of root resorption, cystic transformation and tooth migration that results in harm to the patient are well documented in literature1,2,3,6. Additionally, this audit showed that almost half (46%) of patients required repeat radiographs due to records becoming out of date by the time of surgery. This is in direct contradiction of IRMER
guidance aimed at limiting patient exposure to ionizing radiation7. On an organisational level, delays in treatment increase the risk of patients being lost-to-follow-up and patient dissatisfaction which may result in formal complaints. Lastly, the need for regular orthodontic reviews while patients await their surgery is poor use of orthodontic clinical resources, which could be better used to reduce the 24.4 week (≈6 months) wait to be seen on new patient clinics. In conclusion, the risks associated with treatment delays for patients requiring joint care must be addressed as a matter of priority by the relevant departments.
Based on the findings of this audit the following recommendations have been made:
1. Presentation of audit findings at local monthly audit meeting.
2. Introduction of joint Orthodontics-OMFS clinics to fast-track patients onto the surgical waiting lists. These are for patients with high risk or existing evidence of root resorption or other pathology with prioritisation of such patients for short notice cancellation clinic/theatre slots.
3. Creation of business case to increase the number of theatre slots available for surgical procedures and increase in staffing for OMFS department.
4. Where appropriate, preference to be given to treatment under LA over GA.
5. To limit the number of orthodontic reviews whilst waiting for surgery, the following can be considered:
• Reviews to be booked pre-emptively at 9-12m after referral to OMFS rather than 6 months.
• Consideration for post-surgery orthodontic follow-up appointments to be made at the time of surgery booking ideally within two weeks through the utilisation of orthodontic emergency/casualty slots where appropriate.
• Consideration of patient initiated follow up appointments.
6. Patients that were identified as potential lostto-follow-ups to be flagged for investigation by management
7. Patients that were identified to still be on waiting list to be reviewed by patient pathway coordinators to expedite treatment
8. Repeat audit in 2 years’ time after implementing these recommendations.
Project involvement
Maliha Suleman (Project lead, design, data collection, analysis, manuscript drafting)
Stacey Tsang (Supervisor, design, approval of manuscript)
Sangeeta Misra (Supervisor)
References
1. Walker L, Enciso R, Mah J. Three-dimensional localisation of maxillary canines with conebeam computed tomography. American Journal of Orthodontics and Dentofacial Orthopaedics 2005; 128:418-423
2. Mourshed F. A roentgenographic study of dentigerous cysts I. Incidence in a population sample. Oral surgery, Oral medicine Oral pathology 1964; 18:47-53
3. Mitchell, L. An Introduction to Orthodontics, Oxford University Press, 2019.
4. Reader TW, Gillespie A, Roberts J. Patient complaints in healthcare systems: a systematic review and coding taxonomy. BMJ Quality & Safety. 2014 Aug;23(8):678–689. doi:10.1136/ bmjqs-2013-002437. PMID: 24876289; PMCID: PMC4112446
5. The NHS Constitution. Maximum waiting times, Guidance for commissioners. Available from: https://www.england.nhs.uk/statistics/ wp-content/uploads/sites/2/2013/12/Maximum-Waiting-Times-guidance-revisedNovember-2013.pdf
6. Schuurs, A.H.B. (2012) Pathology of the hard dental tissues. Chichester, West Sussex, UK: WileyBlackwell. Available at: http://www.dawsonera. com/depp/reader/protected/external/ AbstractView/S9781444315332 (Accessed: June 18, 2025).
7. The Ionising Radiation (Medical Exposure) Regulations 2017. SI 2017 No. 1322. Came into force 6 Feb 2018. Available from: https://www. legislation.gov.uk/uksi/2017/1322 (Accessed 18 Jun 2025).
Hannah Hook (ST) and Tom Frawley (Consultant Orthodontist), Queens Medical Centre, Nottingham and Charles Clifford Dental Hospital, Sheffield, UK
Background/Rationale Sustainability in healthcare is essential for reducing the sector’s environmental impact while enhancing patient care and staff wellbeing. Healthcare accounts for approximately 4.4% of global greenhouse gas emissions,1 with the NHS contributing around 4% of the UK’s total carbon footprint.2 NHS England’s Greener NHS programme aims to achieve net-zero emissions by 2045, with a focus on areas including travel, procurement, materials, energy use and waste management.2 Dentistry can support these targets through sustainable approaches such as eco-friendly procurement, lean service delivery, and prevention-focused care without compromising clinical quality.
The GDC’s Orthodontic Specialty Training Curriculum requires trainees to recognise and work within the wider healthcare system, including understanding resource management, avoiding waste, and consideration of sustainability in service design and delivery.3 Although environmental sustainability is not explicitly stated within the GDC’s Safe Practitioner Framework for orthodontic therapists, the framework emphasises professionalism, engagement with evolving healthcare priorities, and effective team working.4 As environmental sustainability is a national NHS priority,2 awareness of sustainability principles is relevant to contemporary orthodontic practice across the entire team.
Following recent staff turnover within orthodontic services across Trent and South Yorkshire regions, a regional audit was conducted to assess orthodontic clinician awareness and understanding of sustainability. The audit aimed to identify gaps in awareness and support the development of more sustainable practices within orthodontic departments.
Aims and Objectives
To assess orthodontic clinician awareness and understanding of environmental sustainability in dental practice.
Objectives
To measure baseline awareness of environmental sustainability among orthodontic clinicians in the Trent and South Yorkshire region using a structured questionnaire. To identify key gaps in awareness relevant to sustainable dental practice. To reassess awareness following an educational intervention through a second audit cycle.
Standards/guidelines/evidence base
In the absence of published standards for environmental sustainability awareness in dental practice, a locally defined benchmark was agreed. Consensus on this benchmark was reached following a meeting of consultant staff within the department, with the aim of representing a minimum acceptable level of baseline awareness rather than specialist
knowledge. A pass score of 55% (8/15) was selected, as this reflected achievement of just over half of the assessed content. This was considered appropriate given the limited formal sustainability education currently available to many clinicians and the lack of knowledge in this area among staff, as identified through informal conversations at regional level.
A 15-item questionnaire was developed specifically for this audit. Content was informed by published literature on environmental sustainability in dentistry, including environmental impact, sustainability education, and barriers to sustainable practice.5–8 These sources were used to identify key themes relevant to dental practice and create single-bestanswer questions. An initial pool of 50 questions was generated from the literature by the author (HH). These were then reviewed with the orthodontic clinical audit lead, and 15 questions were selected based on relevance to routine dental practice and breadth of topic coverage. The questionnaire was piloted locally to ensure clarity and relevance prior to use.
As no validated tool currently exists to assess sustainability awareness in dentistry, this questionnaire was used to establish a baseline and support targeted educational intervention.
Sample and data source
The target population consisted of orthodontic clinicians (Consultants, Specialists, Specialty Trainees ST1-5, and Orthodontic Therapists) working within the South Yorkshire and Trent region. Eligible participants were orthodontic clinicians currently employed in the region at the time of data collection. Exclusion criteria included non-orthodontic dental staff, clinicians not actively working within the region and incomplete questionnaire responses.
Convenience sampling was used, with all 45 eligible orthodontic clinicians invited to participate in both audit cycles. Twenty-eight responses were received in Cycle 1 and again in Cycle 2. As the questionnaire responses were anonymised, it was not possible to determine whether the same clinicians completed the questionnaire on both occasions. The re-audit was therefore designed to assess changes in awareness at a service-level rather than individuallevel change.
Audit type
Two-cycle, prospective, criterion-based, knowledgebased audit.
Methodology
A 15-item, single-best-answer questionnaire was delivered electronically using Google Forms (Appendix A). The questionnaire was distributed to 45 orthodontic clinicians across the Trent and South Yorkshire region via email links and QR codes.
In both Cycle 1 and Cycle 2, 28 responses were received. Responses were anonymised; therefore, it was not possible to confirm whether the same clinicians completed the questionnaire in both cycles. Data were analysed using descriptive statistics, with mean scores calculated for each cycle.
Cycle 1 commenced in January 2024. Findings were presented at local and regional orthodontic governance meetings between June and November 2024. A targeted educational intervention was delivered by the author (HH) to the orthodontic clinicians, consisting of a 20-minute PowerPoint presentation covering key environmental
sustainability topics aligned with questionnaire content.
Cycle 2 was completed in November 2024 using the same questionnaire to allow service-level comparison. Use of the same questionnaire may have introduced recall bias; however, anonymised data collection, the interval between cycles, and delivery of topic-based education rather than item-specific feedback support interpretation of findings at a service-level, rather than individual knowledge recall.
In Cycle 1, 28 responses were received. The mean score was 50% (7.5/15) (Figure 1), with individual scores ranging from 4/15 to 11/15. Overall, 54% of participants (15/28) achieved the predetermined benchmark of ≥ 55% (Figure 2); therefore, the audit standard of 100% compliance was not met.
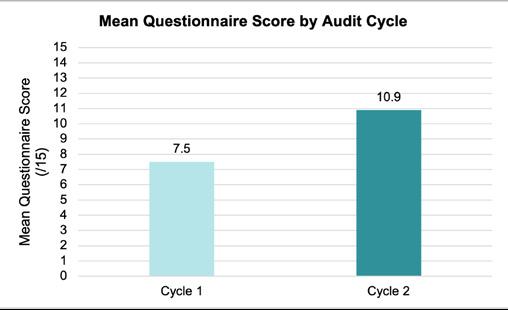
by audit cycle.
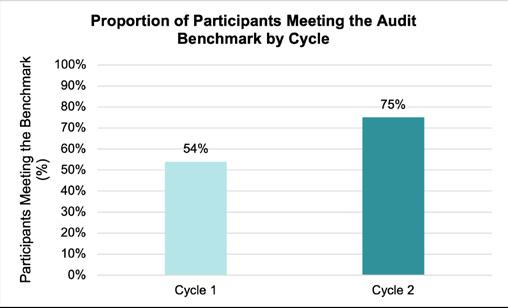
Figure 2. Proportion of participants meeting the audit benchmark by cycle.
Question-level analysis demonstrated variation across topic areas (Figure 3). The lowest-performing question in Cycle 1 was Question 3 (Appendix A), assessing understanding of hotspot products, with 18% correct responses (5/28). In contrast, Question
14, relating to lean service delivery, achieved the highest score, with 93% correct responses (25/28). These findings informed the development of targeted educational input.
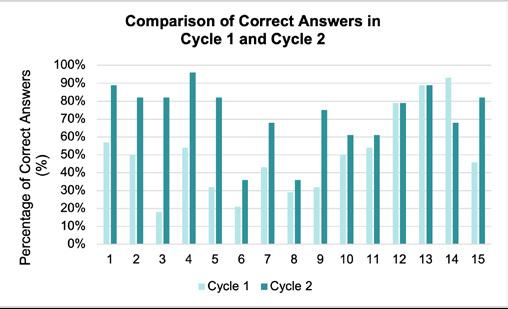
Figure 3. Comparison of the percentage of correctly answered questions between Cycle 1 and Cycle 2.
In Cycle 2, 28 responses were again received. The mean score increased to 72% (10.9/15) (Figure 1), with individual scores ranging from 2/15 to 15/15. Benchmark attainment increased to 75% of participants (21/28) (Figure 2); however, the audit standard was still not met.
Variation by question persisted in Cycle 2 (Figure 3). Question 6, assessing awareness of the carbon footprint associated with water usage in oral healthcare, had the lowest correct response rate with 36% (10/28). The highest-performing question was Question 4, relating to the environmental impact of oral health products, with 96% correct responses (27/28).
Overall, improvements in both mean score and benchmark attainment indicate increased servicelevel awareness following targeted educational intervention.
This is the first knowledge-based audit, to the authors’ knowledge, assessing orthodontic clinician awareness of environmental sustainability in dental practice. Cycle 1 identified notable gaps in baseline awareness, consistent with published literature reporting limited sustainability knowledge among dental professionals. 8–10
Fewer than half of participants met the benchmark in Cycle 1, reflecting the lack of structured sustainability education reported in dental training.9,10 Following targeted education, benchmark attainment increased to 75% in Cycle 2, aligning with evidence that focused
educational interventions can improve sustainability awareness.6,10 Despite this improvement, the audit standard of 100% compliance was not achieved, indicating the need for ongoing education.
Some questions required familiarity with specific sustainability data, which may have limited performance among clinicians without prior exposure. This reflects wider challenges in sustainability education and supports the need for structured, longitudinal teaching approaches.6,10
Although 45 clinicians were invited to participate in both cycles, only 28 responses were received on each occasion. As participation was anonymised, findings are interpreted at a service-level rather than as individual knowledge gain.
The same questionnaire was used in both audit cycles, which introduces the potential for recall bias, as participants may have recognised questions from Cycle 1. However, responses were collected anonymously, and participants were not provided with the correct answers following completion of the first cycle. Instead, relevant information was delivered through a structured educational intervention between cycles, rather than direct feedback on individual questionnaire items.
Overall, the audit demonstrates improved awareness following targeted education while reinforcing the need for continued, structured sustainability training within orthodontic services. These findings are consistent with the wider literature, which emphasises the importance of embedding environmental sustainability within dental education and professional development.6,8–10
1. Education and training: Implement structured, modular sustainability teaching embedded within local orthodontic training programmes, supported by regular educational updates.
2. Re-audit: Undertake a re-audit within 12 months following further training to enable timely assessment of sustained improvement.
3. Service-level changes: Implement agreed measures to reduce environmental impact, including:
• Virtual, nurse-led 3/12-month retainer review clinics;
• Coordinated appointments for siblings;
• Reduction of unscheduled visits due to broken appliances, supported by a separate audit of appliance breakages;
• Same-day retainer provision following debonding to minimise repeated travel.
Project involvement
Hannah Hook (Project lead, project design, data collection, data analysis, manuscript production)
Tom Frawley (Project supervisor, project design, manuscript revision)
References
1. OECD. Decarbonising Health Systems Across OECD Countries [Internet]. Paris: OECD Publishing; 2025 [cited 2026 Jan 7]. (OECD Health Policy Studies). Available from: https://www.oecd.org/ en/publications/decarbonising-health-systemsacross-oecd-countries_5ac2b24b-en/full-report/ overview_570a6f11.html
2. NHS England. Delivering a ‘Net Zero’ National Health Service [Internet]. London: NHS England; 2022 [cited 2024 Feb 20]. Available from: https:// www.england.nhs.uk/greenernhs/wp-content/ uploads/sites/51/2022/07/B1728-delivering-a-netzero-nhs-july-2022.pdf
3. General Dental Council. Orthodontics Specialty Training Curriculum [Internet]. London: General Dental Council; 2024 [cited 2024 Feb 20]. Available from: https://www.gdc-uk.org/docs/default-source/ education-and-cpd/dental-specialty-training/ specialty-curricula/orthodontics-specialty-trainingcurriculum-2024_a.pdf
4. General Dental Council. The Safe Practitioner: A framework of behaviours and outcomes for dental professional education: Orthodontic Therapist [Internet]. London: General Dental Council; 2023 [cited 2026 Jan 5]. Available from: https://www. gdc-uk.org/docs/default-source/education-andcpd/dental-specialty-training/safe-practitionerorthodontic-therapist.pdf
5. Wilson G, Shah S, Pugh H. What impact is dentistry having on the environment and how can dentistry lead the way? Fac Dent J. 2020;11:110–3.
6. Duane B, Dixon J, Ambibola G, Aldana C, Couglan J, Henao D, et al. Embedding environmental sustainability within the modern dental curriculum: exploring current practice and developing a shared understanding. Eur J Dent Educ. 2021;25(3):541–9.
7. Batsford H, Shah S, Wilson GJ. A changing climate and the dental profession. Br Dent J. 2022;232(9):603–6.
8. Martin N, Sheppard M, Gorasia G, Arora P, Cooper M, Mulligan S. Awareness and barriers to sustainability in dentistry: a scoping review. J Dent. 2021;112:103735.
9. Joury E, Lee J, Parchure A, Mortimer F, Park S, Pine C, et al. Exploring environmental sustainability in UK and US dental curricula and related barriers and enablers: a cross-sectional survey in two dental schools. Br Dent J. 2021;230(9):605–10.
10. Dixon J, Field J, Gibson E, Martin N. Curriculum content for environmental sustainability in dentistry. J Dent. 2024;147:105021.
Appendices
Appendix A. 15-item environmental sustainability questionnaire with correct answers highlighted
1. If the healthcare industry was a country, what effect would it have on greenhouse gas emissions?5
b. It has a negligible impact on emissions
c. It is the largest contributor to emissions
d. It ranks second after the energy industry in emissions
e. It is the fifth largest contributor to emissions
2. Why is dentistry, as currently delivered, not environmentally sustainable?6
a. Lack of technological advancements
b. Disinterest among dental care professionals
c. Disproportionate environmental footprint in certain aspects
d. Government regulations
3. A “hotspot” product is a product with a higherthan-expected environmental impact. Which of the following is considered to be a “hotspot” product?6
a. Dental floss
b. Toothpaste
c. X-ray machines
d. Surface disinfectant
4. From an oral health perspective, which of these is considered to be a significant contributor to the global environmental footprint?6
a. Dental chairs
b. Toothbrushes
c. X-ray machines
d. Amalgam
5. Accounting for approximately 64.5%, which of the following is responsible for creating the largest amount of carbon emissions in NHS dentistry?7
a. Procurement and supply
b. Energy
c. Waste
d. Travel
6. How much of the overall carbon footprint is directly attributed to water use in the provision of oral healthcare?8
a. <0.1%
b. 0.8%
c. 7.7%
d. 8%
7. In the UK (2013–14), what was the percentage of greenhouse gas emissions from NHS dental services in England compared to the overall carbon footprint of the NHS?8
a. 1%
b. 3%
c. 7%
d. 10%
8. What percentage of the carbon footprint of primary dental care is attributed to the energy use of buildings?8
a. 7.6%
b. 15%
c. 24%
d. 51%
9. Of the following, which contributes the highest proportion to the carbon footprint of dental services?5
a. Composite restoration
b. Amalgam restoration
c. Scale and polish
d. Examination
10. How is the concept of sustainable procurement proposed to impact on the dental profession positively?7
a. Increase operational waste
b. Minimise transportation waste
c. Encourage the use of eco-friendly products
d. Enhance competition amongst manufactures
11. What is the primary focus of the NHS long-term plan in relation to sustainability?5
a. Enhancing resource efficiency
b. Minimising single-use products
c. Broadening production capabilities
d. Overlooking ecological considerations
12. What makes implementing reuse, reduce, and recycle policies difficult in dental practice?8
a. Lack of awareness
b. High risk of contamination and the complex nature of the waste
c. Insufficient funding
d. Limited storage space
13. What is ‘green procurement’ in the context of dentistry?8
a. Procurement of goods and services with a reduced impact on the environment
b. Traditional procurement practices without considering environmental factors
c. Procurement focused on financial gains only
d. Procurement exclusively from sustainable sources
14. What is the Lean service delivery approach?6
a. Longer appointment times
b. Increased frequency of dental appointments
c. Optimising recall and patient appointment times
d. Reduced appointment times
15. Which of these has been identified as the single most important factor to improve sustainability in dentistry?6
a. Dental materials
b. Prevention of oral and dental disease
c. Plastics regulation
d. Green energy adoption
Rishi Daggar (DCT), Henry Quach (ST) and Asma Keshtgar (Consultant Orthodontist), St George’s University Hospitals NHS Foundation Trust, London, UK
Background/Rationale Fixed orthodontic appliance treatment generally involves using small components such as brackets, bands and wires, which can occasionally become loose or dislodged. The prevalence of orthodontic appliance breakage varies in the literature; one retrospective audit reported 32%1 of orthodontic patients had bracket failure and a qualitative cross-sectional study found 23.3%2 of patients experienced fixed orthodontic appliance breakages. These breakages pose potential risks of ingestion or aspiration, which may lead to gastrointestinal injury, airway obstruction or patient distress. While most cases are uneventful, unrecognised or poorly managed incidents can cause complications.3, 4
The British Orthodontic Society (BOS) has issued guidelines for the ‘management of aspirated or ingested foreign bodies in orthodontic practice’5. The recommendations emphasise recognising common signs and symptoms of aspiration and ingestion, asking appropriate questions, thorough documentation and following referral pathways. This audit was initiated due to observed variability in clinical documentation.
The aim of this audit was to evaluate the management of broken or lost fixed orthodontic appliances within the Orthodontic Department at St George’s Hospital in relation to the national BOS advice sheet. Including documentation of component accountability, assessment for aspiration or ingestion symptoms and provision of safety advice if required.
Standards/guidelines/evidence base
100% of patients presenting with broken or lost fixed orthodontic appliances should be managed in accordance with the BOS advice sheet (2022) on the management of aspirated and ingested foreign bodies. The measurable standards from the BOS guidance include:
• Documentation of component type and accountability
• Assessment of aspiration or ingestion symptoms
• Provision of safety advice or appropriate referral if indicated.
Sample and data source
The sample included patients attending the Orthodontic Department at St George’s University Hospitals NHS Foundation Trust with broken or lost fixed orthodontic appliances. In the first cycle, electronic patient records (Cerner Powerchart) were
retrospectively reviewed over a two-month period for patients attending from 1st April to 31st May 2024, while the second cycle assessed prospectively from 1st April to 31st May 2025. Consecutive sampling was used to ensure all eligible electronic patient records across all clinician grades were captured.
The exclusion criteria where data was omitted included patients wearing removable appliances, emergency visits without appliance breakage and planned appliance removal as part of treatment completion.
Two-cycle audit with retrospective first cycle and prospective second cycle.
Both audit cycles assessed fixed orthodontic appliance breakages over a two-month period, including emergency orthodontic appointments as well as routine fixed adjustment appointments using consistent inclusion and exclusion criteria. All clinician grades (StR, Post-CCST, Consultant) were included to capture a comprehensive overview of departmental practice.
A structured data collection proforma was designed and piloted by the authors to ensure reliability and consistency. Key variables recorded included patient age and gender, clinician grade, component affected, mechanism of breakage, whether the affected
component was accounted for, documentation of checks for symptoms of aspiration or ingestion where components were missing and whether onward referral was required. The data was anonymised and analysed using Microsoft Excel.
Findings
A total of 100 patients (48% male and 52% female) were included in the first cycle, with a mean age of 17.6 years (age range 10- 41 years).
There were 151 broken components with the majority being brackets and tubes (79%, n=120), followed by wires (8%, n=13) and modules (3%, n = 5) (Table 1). Documentation of how the component was broken was present in 25% of the 100 patients. Eating was the most common documented cause at 44% (n=11).
Overall, 34% (n = 34) of records documented components being accounted for, 14% (n = 14) unaccounted for and 52% (n = 52) had no record (Chart 1). Appropriate aspiration/ ingestion advice was noted at 14.3% (2 out of 14 unaccounted cases).
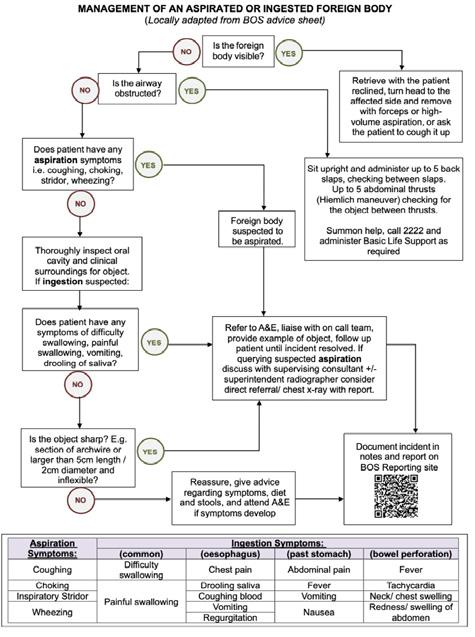
The results of the first cycle audit were shared with the orthodontic team and tailored teaching on management of broken braces based on the BOS advice sheet was provided at a clinical governance meeting. A locally adapted flowchart on Management of aspirated and ingested Foreign Bodies was created (Figure 1) with input from the orthodontic clinicians using the BOS advice sheet (2022) and displayed in each orthodontic bay as a laminated A4 poster.
A total of 118 patients (57% male and 43% female) were included in the second cycle, with a mean age of 16.9 years (age range 9- 46 years).
In the second cycle, a total of 163 broken or lost components were recorded, with the majority being brackets and tubes (75%, n = 123), followed by modules (8%, n = 14) and orthodontic wires (6%, n = 10) (Table 1). Documentation was present in 39% of cases of the 118 patients as to how the component was broken or lost; eating was again the most common documented cause at 39% (n=18).
For the documented accountability of broken or lost components, 73.7% (n = 87) were documented as accounted for, 7.6% (n = 9) were unaccounted for and 18.6% (n = 22) did not include documentation (Chart 1). Appropriate aspiration/ ingestion advice was noted at 44.4% (4 out of 9 unaccounted cases).
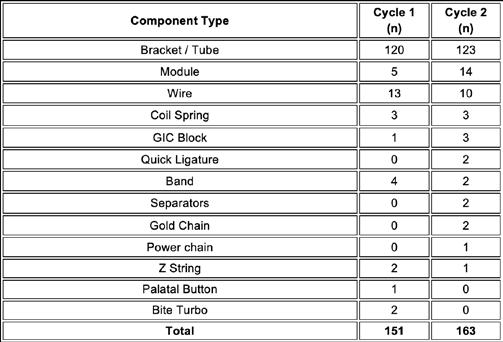
Table 1. Types of Orthodontic Components Involved in Cycle 1 and Cycle 2.
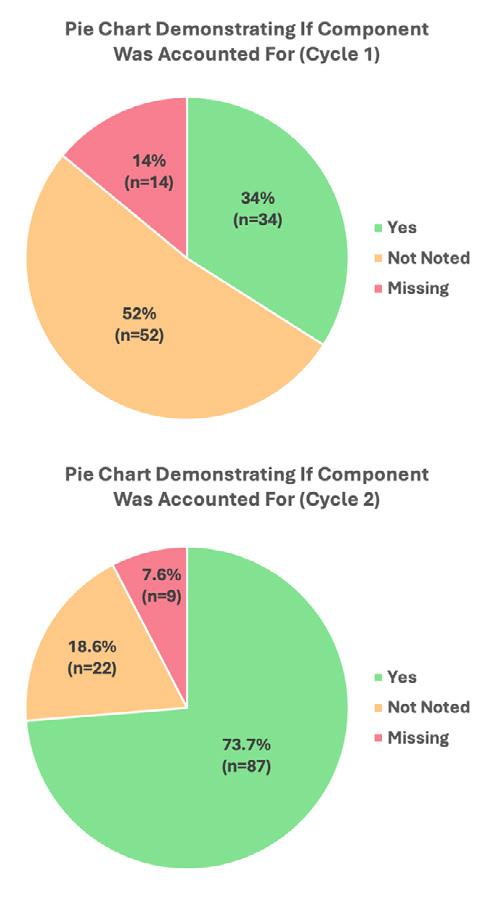
Analysis of data from both audit cycles demonstrated clear improvement in the documentation and management of broken or lost orthodontic appliances following targeted teaching and implementation of a locally adapted management flowchart (Figure 1). The most notable improvement was the documentation quality, with compliance increasing from 48% to 81.4%, regarding whether appliance components were accounted or unaccounted for and confirmation that patient safety checks had been completed. Additionally, documented specific aspiration/ ingestion advice delivered to patients with unaccounted components was found to have increased from 14.3% to 44.4%. Residual shortcomings remain clinically significant
as unaccounted components may result in delayed identification of aspiration or ingestion, potentially leading to respiratory compromise, gastrointestinal injury or avoidable emergency attendance.
A key theme identified was the positive impact of structured education and visual prompts. Departmental teaching and visible clinic displays effectively reinforced safe practice and improved clinician awareness of aspiration and ingestion risks better guiding the conversations had when assessing signs and symptoms. Comparison with other studies has demonstrated that audit training with post–cycle 1 interventions, like those implemented here, can statistically significantly improve documentation behaviour. ⁶
The introduction of the department-specific flowchart standardised the response process, supporting consistent documentation and management across the department through multimodal reinforcement. Evidence shows that decision-support tools such as visual flowcharts can increase adherence to clinical guidelines and improve quality of care.7
Despite these gains, some areas for improvement remain. Documentation around the mode of breakage and consistent recording of red flag symptom checks was variable, suggesting that while overall awareness increased, translation into comprehensive written records was incomplete. Variability in clinicians’ documentation styles also contributed to inconsistencies, highlighting the need for further consideration of standardised recording templates.
Another limitation identified was the inability to verify undocumented verbal safety discussions, which may have resulted in underestimation of compliance. Nevertheless, the findings strongly suggest that structured teaching interventions coupled with practical decision-support tools can meaningfully enhance adherence to clinical governance standards.
To sustain progress, the flowchart should be periodically reviewed to ensure alignment with any updates to existing guidance. A third audit cycle within 12–18 months is recommended to confirm long-term adherence, identify any regression and assess the enduring impact of measures.
1. Promote clear and consistent documentation practices by ensuring clinicians routinely record the history of the breakage, accountability of the component and any assessment and advice for aspiration or ingestion risks. This supports patient safety.
2. Implement visual and practical clinical support tools, such as a locally adapted flowchart displayed in the clinical area to provide immediate guidance on recognising red flag symptoms, when and where to escalate locally and appropriate local referral pathways. This helps optimise management across different clinician grades.
3. Consider introducing a structured proforma or ‘smart phrase’ for broken appliances to improve record-keeping and reduce variability between clinicians. A standardised layout can enhance clarity and importantly prompt safety discussions and documentation to improve performance against the set standard.
4. A re-audit is recommended within 12-18 months to confirm sustained improvement of management of broken/lost fixed orthodontic appliances and assess long-term adherence in documentation.
Special thanks are also extended to the Orthodontic Department at St George’s Hospital for facilitating the implementation of changes, supporting data collection, and co-ordinating departmental governance meetings.
Project involvement
Rishi Daggar (Project lead, design, data collection, analysis, manuscript drafting)
Henry Quach (Methodology, data interpretation, manuscript approval)
Asma Keshtgar (Supervisor, recommendations, action planning, manuscript approval)
1. Kafle D, Mishra RK, Hasan MR, Saito T. A Retrospective Clinical Audit of Bracket Failure among Patients Undergoing Orthodontic Therapy. International Journal of Dentistry. 2020 Dec 15
2. Naveda R, Seminario MP, Janson G, Garib D. Concerns of orthodontic patients during the COVID-19 quarantine period. Dental Press Journal of Orthodontics. 2022;27(1)
3. Karamani I, Makrygiannakis M, Bitsanis I, Tsolakis A. Ingestion of orthodontic appliances: A literature review. journal of orthodontic science. 2022;11(1):20.
4. Manouchehri S, Haddad AR, Shakib K. Traumatic Iatrogenic Complications Associated with Orthodontic Treatments: A Systematic Review. Orthodontic Update. 2021 Jan 2;14(1):36–42.
5. British Orthodontic Society (BOS) (2022). Management of inhaled and swallowed foreign bodies in orthodontic practice: Advice Sheet. London: British Orthodontic Society.
6. Chong JA, Chew JKY, Ravindranath S, Pau A. Clinical audit teaching in record-keeping for dental undergraduates at International Medical University, Kuala Lumpur, Malaysia. Journal of dental education [Internet]. 2014 Feb;78(2):206–12.
7. Kawamoto K, Houlihan CA, Balas EA, Lobach DF. Improving clinical practice using clinical decision support systems: a systematic review of trials. BMJ. 2005;330(7494):765.
Nicky Pilbro (Lead Dental Nurse), Megan Poole (Orthodontic Therapist) and Amreen Ahmad (Consultant Orthodontist), Eastbourne District General Hospital, UK
Background/Rationale
NHS clinical coding is used to record the diagnosis and procedures performed. Each of these have their own given codes within a classification system (ICD-10 & OPCS-4). Every OPCS4 procedure code and ICD-10 diagnosis code is mapped to an HRG root. (Healthcare Resource Group)1 HRGs rank procedures using a ‘hierarchy’ based on cost data.2 They produce a tariff which determines how much we are paid by NHS Commissioners. Data captured from clinical coding is also used to aid the planning of resources within an Integrated Care System (ICS). Therefore, it is of high importance to ensure that it is recorded accurately for data governance and financial purposes.
Within Orthodontic departments across NHS England, it was found that there were vast differences in clinical coding. This was highlighted in ‘Getting it right first time’ (GIRFT) guidance on Hospital Dentistry report in September 2021.3 The British Orthodontic Society Consultant Group (BOS COG) and the Royal College of Surgeons (RCS) worked together to produce ‘Activity coding in orthodontics: information for secondary care trust’ guidance. This audit will be the first one using Version 3 guidance.4
Aims and Objectives
The aim of our audit was to implement ‘Version 3’ of the orthodontic activity coding and to ensure compliance with coding recorded against the clinical notes. This is to highlight the loss of income due to inaccuracies. Our objectives were to cross reference our data that was captured against our clinical notes and to set an acceptance rate of compliance. Also to support the clinical staff that were recording the coding. By delivering training and awareness to both clinicians and nurses.
Standards/guidelines/evidence base
Previous similar audits, published in the BOS Clinical Effectiveness Bulletin, had set a standard of 90% of compliance with activity coding. All used Version 2 codes prior to 2023:
• Orthodontic clinical coding: A two-cycle regional audit (May 2023)5 achieved 8-86% compliance.
• A Retrospective service evaluation of activity coding in the orthodontic department utilising the Consultant Orthodontist Group’s ‘Activity Coding in Orthodontics’ guidance (December 2023)6 achieved 88% compliance.
• Getting It Right First Time (GIRFT): A two-cycle clinical coding service evaluation (November
2024)7 did not review compliance but rather implementing the guidance, updating their outcome forms to include clinical coding with the definitions of the procedures.
• Accuracy of activity coding in orthodontics: A 2-cycle audit (May 2025)8 achieved 84% compliance using version 3.
In line with these previous audits and service evaluations, a standard of 90% compliance was set. A higher standard may be desirable by finance teams however previous work has highlighted the multiple opportunities for error (man or machine).
Sample and data source
Data was supplied from the contract income team for a period of 1 month at two separate time points: One month prior to implementation of the new coding, training and awareness (October 2024) and then one month post implementation (May 2025). This data was compared to our procedural information which was recorded in the electronic clinical records.
Inclusion criteria: Follow up appointments.
Exclusion criteria: New/1st appointments. Specialist nurse appointments.
Audit type
A two- cycle retrospective audit.
Data was collected at two time points - prior and post implementation of the new coding, training and awareness. This included updated clinical outcoming forms and guides displayed in clinical areas. The guide was created by our Orthodontic Therapist (Figure 1).
All data was entered into a Microsoft Excel spreadsheet with multiple formulae developed to assist with analysis and to present totals. The information included in the spreadsheet was:
• The date of the attendance
• Code of treatment claimed compared to actual treatment carried out
• The monetary value of code claimed compared to the actual treatment carried out. The comparison was only completed for incorrect amounts.
Our Orthodontic Therapist completed cycle 1 (prior implementation) and the project lead completed cycle 2 (post implementation). It is noted that potential variability may occur as different individuals were involved. Explicit rules were observed, as reviewed against hierarchy form to determine which would be the primary code.
Due to multiple codes being applied per procedure in practice, a hierarchy value needed to be established. As such, remuneration will be for the highest hierarchy value item, not necessarily the highest monetary item. This was considered where reviewing the recorded code against the clinical notes.
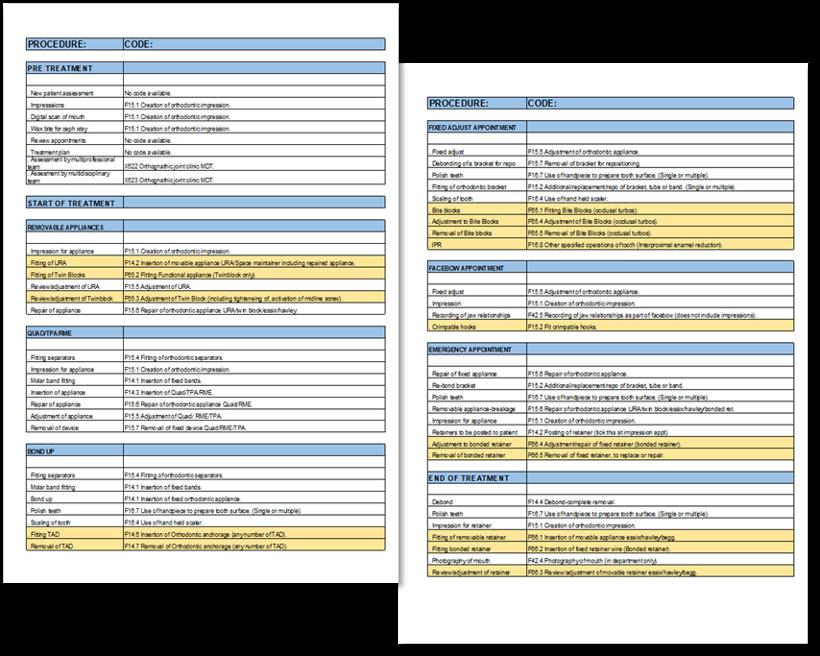
277 patient contacts were recorded for October 2024. It was found that 67% of claims were correctly coded prior to the implementation of the GIRFT guidance. This led to a financial loss of £6,966 when compared to the new coding tariffs (Figure 2).
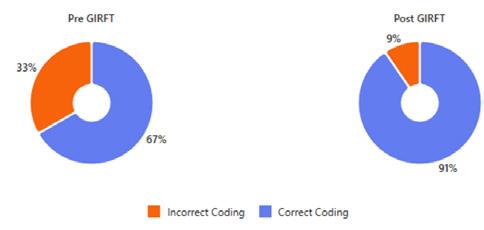
Figure 2. Percentage compliance chart for pre and post implementation using V3 guidance.
This compares favourably with the results from previous, similar audits who reported the following compliance:
• Liverpool University Dental Hospital: 0%5
• Cumberland Infirmary: 76%6
• St George’s Hospital: 61%8
258 patient contacts were recorded for May 2025. It was found that 91% of claims were correctly coded following the implementation of the guidance. This represented a significant improvement of 24% and met our 90% standard and a financial loss of £437 (a 93% decrease from the pre-implementation data) (Table 1). This is an achievement which had not been met by our peers. It may be argued that this was possible due to the use of version 3 of activity coding. However, it could be attributable to the multiple prong approach of education, resources and reinforcement.
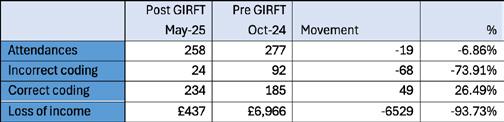
Table 1. Percentage compliance chart for pre and post implementation using V3 guidance.
Activity codes are now truly embedded in the department with updates to the PAS system, clinical outcomes and staff awareness. Implementation and
raised awareness of our activity coding has improved and is in line with the national guidance.
Feedback from the clinical and nursing staff who complete the activity coding have reported that the guide that was provided in their clinical areas has assisted with completing their outcomes. It breaks it down to each procedure we complete, which is simpler to follow than reviewing the whole list on the outcome form. This is something similar that is used in Northwick Park7 and St George’s Hospital8 where they provided their department a ‘departmental orthodontic coding proforma’ which is laid out in logical sections and displayed in each dental unit.
In addition, staff felt it was useful to have an understanding of the difference in tariffs, especially for ‘Adjustment of orthodontic device (adjustment of fixed/Quad/RME/URA) (F155)’ which was £136.92 and ‘Fitting of orthodontic bracket (additional fitting/ replacement/reposition of bracket, tube or band) (F152)’ which was £167.80. A surplus difference of £30.88, which makes a big difference if you are repositioning a bracket within your adjustment of the fixed appliance (Tariff correct as of Jan 2025). Each tariff cost will be slightly different for each Trust as they are adjusted for patient complexity and other reasons9.
This piece of work has also supported a cost improvement programme for our division with increased income of £4,500 per month being observed since April 2025. This will deliver £54,000 over a year period. All other similar audits have looked at the compliance, but this audit is the first to look at the real measured income gain.
This has been discussed and presented regionally with KSS, and other units highlighted that they have advanced IT systems such as Epic10 where the clinician needs to record the procedure codes prior to signing off their clinical notes. This may be useful but only if you have the financial resources to obtain such systems. This does not, however, replace the need to review and validate your own captured data to ensure that you are being correctly remunerated.
1. Presenting the financial impact at local and regional audit meetings and nationally on the GIRFT website.
2. Other specialties that use OPCS codes could do similar reviews of their own data to review
compliance and improve data collection and income for their Trusts.
3. All orthodontic units nationally should ensure they use the V3 2023 BOS RCS codes.
4. Reaudit yearly to review compliance levels.
Acknowledgements (If applicable) Many thanks to the clinical and nursing team at ESHT for their support in completing this project. Also Contract Income manager, Clinical Coding and Transformation team at ESHT for their time in assisting, explaining and supplying the information. Thanks to Amreen Ahmad for highlighting the issue and the service manager for their support.
Project involvement
Nicky Pilbro (Project lead, data collection, data analysis, manuscript drafting)
Megan Poole (Data collection, data analysis)
Amreen Ahmad (Supervisor, manuscript approval)
References
1. HRG design concepts [Internet]. NHS England Digital. Available from: https://digital.nhs.uk/ services/national-casemix-office/the-why-whatand-how-of-casemix/the-casemix-companion/hrgdesign-concept
2. Grašič K, Mason AR, Street A. Paying for the quantity and quality of hospital care: the foundations and evolution of payment policy in England. Health Economics Review [Internet]. 2015 Jun 12 [cited 2019 Sep 2];5(1). Available from: https://www.ncbi. nlm.nih.gov/pmc/articles/PMC4468579/
3. Jones E, Fds O, Orth M, Msc R. Hospital Dentistry. GIRFT Programme. National Specialty Report. February 2021. GIRFT is delivered in partnership with the Royal National Orthopaedic Hospital NHS Trust, NHS England and NHS Improvement 2 [Internet]. Available from: https://gettingitrightfirsttime. co.uk/wp-content/uploads/2021/09/ HospitalDentistryReport-Sept21j-1.pdf
4. Activity Coding in Orthodontics Information for Secondary Care Trusts [Internet]. 2023 [cited 2025 Aug 21]. Available from: https://bos.org.uk/ wp-content/uploads/2023/06/Activity-Coding-inOrthodontics-2023.pdf
5. Turner S, Harrison J, Hosni S. Orthodontic clinical coding: A two-cycle regional audit. Clinical Effectiveness Bulletin. May 2023
6. Nagar N, Chan SY, Germain S. A Retrospective service evaluation of activity coding in the orthodontic department utilising the Consultant Orthodontist Group’s ‘Activity Coding in Orthodontics’ guidance. - Clinical Effectiveness Bulletin. December 2023.
7. Johnson E, Motamedi-Azari F, Crow V. Getting It Right First Time (GIRFT): A two-cycle clinical coding service evaluation. - Clinical Effectiveness Bulletin. November 2024.
8. Quach H, Radla S, Davenport-Jones L. Accuracy of activity coding in orthodontics: A 2-cycle audit. Clinical Effectiveness Bulletin. May 2025.
9. England N. NHS England» 2025/26 NHS Payment Scheme – Annex D: Prices and cost adjustments [Internet]. England.nhs.uk. 2025 [cited 2025 Aug 26]. Available from: https://www.england.nhs.uk/ long-read/25-26-nhsps-annex-d-prices-and-costadjustments/
10. Epic [Internet]. Guy’s and St Thomas’ NHS Foundation Trust. Available from: https://www. guysandstthomas.nhs.uk/epic
Hannah Marchant (DCT) and Farhad B. Naini (Consultant Orthodontist), Kingston Hospital NHS Foundation Trust, UK
Background/Rationale Combined orthodontic and orthognathic surgical treatment is recommended for patients with severe skeletal or pronounced dento-alveolar discrepancies that cannot be corrected by orthodontics alone. Successful treatment relies on coordinated interdisciplinary teamwork. Traditionally, the majority of the orthodontic treatment is carried out before surgery, to align, level, and decompensate the arches1. Post-surgical orthodontics then involves refinement of the occlusion.
This treatment is lengthy and involved and requires multiple hospital visits. Patients sometimes describe ‘putting their lives on hold’, e.g. delaying important life events such as starting university, or getting married - until their treatment is complete. As part of informed patient consent to treatment, it is important that we can quote an average treatment duration that is accurate, specific to the presenting malocclusion/dentofacial discrepancy, and specific to the department. Similar audits have been undertaken in centres across the UK, providing relevant benchmarks against which local unit performance, such as that at Kingston Hospital, can be meaningfully compared2-5.
Aims and Objectives
The aim of this service evaluation was to investigate the duration of combined orthodonticorthognathic treatment at Kingston Hospital, and thus to determine whether the average duration of treatment quoted to patients during the consent process was correct.
The secondary aims were (1) to establish those patient, malocclusion/surgery, and clinician factors which appear to influence the duration of treatment, and (2) to evaluate the impact of the COVID-19 pandemic on our service.
Standards/guidelines/evidence base
There are no set national guidelines as to what constitutes a gold standard for treatment duration. We are routinely quoting an estimated 24-36 month treatment duration during our consenting process, as per the BOS orthognathic treatment patient information leaflet6.
Therefore, the standard for this audit was set as: 100% of patients should complete orthodonticorthognathic treatment within 36 months (3 years) as stated during the consent process.
Sample and data source
Data was collected retrospectively from electronic patient records (CRS) for 47 new patients who
were accepted for joint orthodontic-orthognathic treatment at Kingston Hospital (a district general hospital), and who had the entirety of their treatment carried out between April 2016 and April 2025.
Orthodontic treatment was carried out by a variety of registrars and five consultant orthodontists. Surgery was carried out by two consultant maxillofacial surgeons (only one surgeon in post at a time).
Audit type
Service evaluation
Methodology
Approval was granted from the Clinical Audit Team. Data was collected retrospectively via the electronic patient records for the 47 patients who had orthodontic-orthognathic treatment completed between April 2016 and April 2025. The data was anonymised and analysed on an MS Excel® spreadsheet, which included the following criteria:
Gender;
Age at the start of treatment; Malocclusion;
Whether the case was extraction/non extraction; Previous orthodontic intervention; Surgical procedure performed;
Grade of treating clinician;
Dates of: (1) Bond-up (2) Joint clinic at which the surgeon and orthodontist decided that the patient was ready for surgery (3) Surgery (4) Debond.
The duration of the three stages of treatment (presurgical orthodontics; waiting time from final joint clinic to surgery; post-surgical orthodontics) was recorded, as well as total treatment duration.
For simplicity, any patient who was undergoing treatment during the period of the UK coronavirus lockdowns (i.e. March 2020 to March 2021) has been defined as having their treatment ‘significantly impacted by the COVID-19 pandemic’7
There were 25 females and 22 males in this patient cohort, with an average age at start of treatment of 21.3 years. One patient had a Class I malocclusion (anterior open bite of 6mm), 10 were Class II division I, one was Class II division 2, and 35 were Class III. Five patients had single jaw (mandibular) surgery only; the remaining 42 had bimaxillary surgery. 27 patients had their treatments significantly impacted by the COVID-19 lockdowns.
The average (mean) treatment duration for patients impacted by the COVID-19 pandemic was 45.7 months (range 19.4-63.1 months) (Figure 1). The non-pandemic cohort recorded a shorter average treatment duration of 33.9 months (range 24.6-47.2 months) – marginally surpassing the set standard of 36 months. However, even in the non-pandemic cohort, only 65% of patients (n=20) completed treatment within 36 months, indicating that the standard was not being met for a substantial proportion of patients.
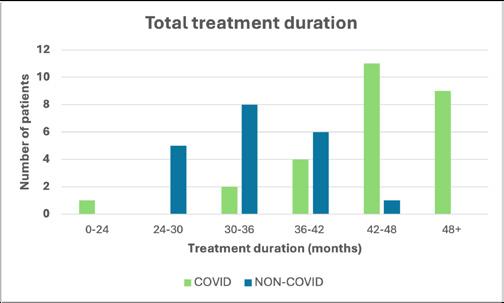
Figure 1: A graph comparing the total duration of treatment between the Covid and non-Covid groups
The pre-surgical orthodontic phase was, by far, the longest phase for both the pandemic and non-pandemic cohorts – 30.5 months and 20.3 months respectively (Figure 2). The waiting time for surgery was similar for both the pandemic and non-pandemic cohorts – 6.3 months and 5.4 months respectively. This was also the case for the post-surgical orthodontic phase – 6.5 months for the pandemic cohort and 6.1 months for the nonpandemic cohort.
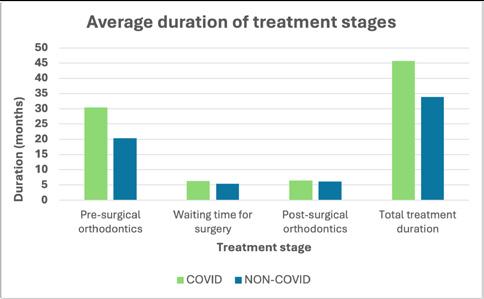
Figure 2: A graph comparing the average duration of treatment stages between the Covid and non-Covid groups
Three factors were found to have a significant impact on length of treatment. It should be noted that, for relevance to our current clinical situation, the following figures have been drawn from the nonpandemic cohort (n=20). Treatment duration for Class III malocclusions was shorter than for Class II (29.5 months vs 33.8). Decreased treatment times were associated with previous orthodontic intervention (29.6 months vs 34.1 months for those who had not had previous conventional orthodontics), and treatment being carried out by a consultant rather than registrars (27.0 months vs 34.2). There was insufficient data to draw meaningful conclusions about the impact of single jaw vs double jaw surgery, or extraction vs non-extraction cases on overall treatment duration.
Average (mean) treatment duration for the nonCovid cohort was 33.9 months, compared to 45.7 months for the Covid cohort. This is revealing of the significant disruption the COVID-19 pandemic caused to joint orthodontic-orthognathic treatment pathways. Despite the average treatment length falling comfortably within the 36-month timeframe
quoted during the consent process, the range of treatment durations was considerable, such that only 65% of the non-Covid patient cohort, and just 11% of the Covid cohort completed treatment within 36 months. This suggests that the gold standard was not being met; patients may not be receiving accurate information about the likely duration of their treatment, and thus the consent process for treatment may not be rigorous.
The average treatment time from bond up to surgery was 25.7 months for the non-Covid cohort. This is significantly lower than the UK average of 30 months, as reported in the National BOS Orthognathic Audit8
The longest treatment stage was, by far, the presurgical orthodontics – averaging 20.3 months for the non-Covid cohort. This again was lower than figures quoted by Dunbar et al and Al-Koky et al (24.5 months and 23.0 months respectively), but longer than the 17 months quoted by Furness et al., in similar studies3-5.
Interestingly, the waiting time for surgery and the duration of the post-surgical orthodontic phase were similar for those affected and unaffected by
the pandemic. However, further analysis suggests that post-pandemic surgical waiting times were influenced by surgery cancellations resulting from resident doctor strikes, as well as a two-month period during which orthognathic procedures were suspended due to a changeover in the maxillofacial surgeon position. Wemyss et al highlighted the high level of emotional distress that delays and cancellations can have on those patients waiting for orthognathic surgery, particularly as pre-surgical dental decompensation may exaggerate facial disharmony and malocclusion9.
One factor that may have lengthened treatment duration was that a significant proportion of the pre-and post-surgical orthodontics was carried out by registrars, rather than consultants. Understandably, registrars will be less experienced in the management of orthognathic cases; furthermore, there may be multiple unavoidable transfers of operator as trainees rotate through their training.
A comparison of our results alongside similar studies has been included in Table 12-5
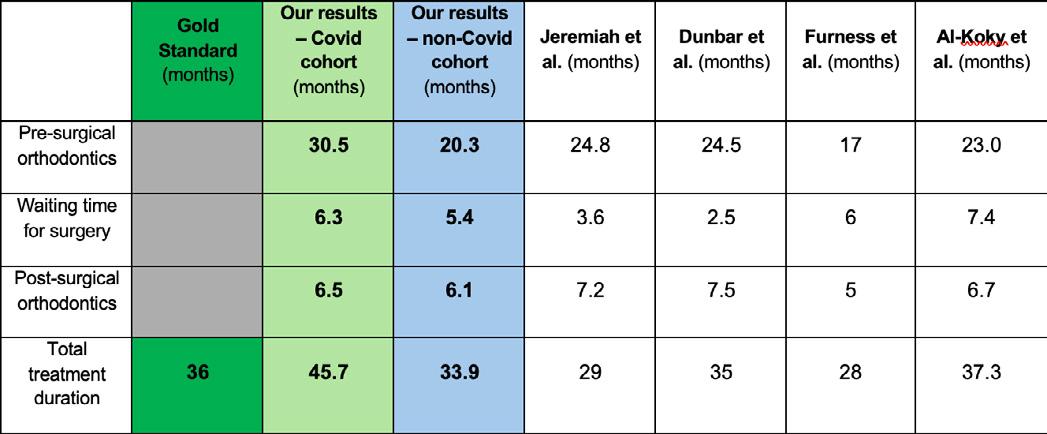
Table 1: A table comparing Kingston Hospital results to other studies, and to the gold standard.
1. Informing patients of the considerable variability of treatment durations for combined orthodontic and orthognathic treatment. When consenting patients, advising a likely treatment duration of 2.5-3.5 years (30-42 months), and emphasising the length of the pre-surgical phase.
2. Increasing the frequency of (a) joint orthodontic/maxillofacial surgery clinics (b) elective orthognathic surgery lists. Improving communication between the orthodontic and surgical teams to reduce surgical wait time, and introducing a system to flag outliers where waiting times for surgery are prolonged.
3. Continue to collect data to improve the accuracy of our estimate for treatment duration, and further explore the impact of patient, malocclusion/surgery, and clinician factors
Project involvement
Hannah Marchant (Project lead, project design, data collection and analysis, presentation)
Farhad B. Naini (Supervisor, approval and editing of manuscript)
1. Akram, S., Shah, N., Ahmad, S. Patient information –is it ever enough? A prospective audit of information provision for orthognathic treatment at the Queen Victoria Hospital (QVH), East Grinstead. British Journal of Oral and Maxillofacial Surgery. 2021; 59(8).
2. Jeremiah, H., Cousley, R., Newton, T., Abela, S. Treatment time and occlusal outcoem of orthognathic therapy in the East of England region. Journal of Orthodontics. 2012; 39(3).
3. Dunbar, A., McIntyre, G.T., Laverick, S. Orthodontic treatment and orthognathic surgery – do we predict the length of treatment accurately? British Orthodontic Society Clinical Effectiveness Bulletin. 2013.
4. Furness, C., Bellis, H., Ellis, P. et al. An audit of orthognathic treatment. British Orthodontic Society Clinical Effectiveness Bulletin. 2016; 36.
5. Al-Koky, R., Fowler, P., House, K. An investigation of treatment duration of each of the various stages of combined orthodontic/orthognathic care at the Bristol Dental Hospital. British Orthodontic Society Clinical Effectiveness Bulletin. 2022; 48.
6. British Orthodontic Society. Orthognathic treatment patient information leaflet [Internet]. 2024 [cited 20 Dec 2025]. Available from: https://bos.org.uk/ wp-content/uploads/2024/01/British-OrthodonticSociety-Orthognathic2024.pdf
7. Institute for Government analysis. Timeline of UK coronavirus lockdowns, March 2020 to March 2021 [Internet]. 2022 [cited 22 Dec 2025]. Available from: https://www.instituteforgovernment.org.uk/sites/ default/files/timeline-lockdown-web.pdf
8. Ireland, A. J., Atack, N. E., Cunningham, S. J., House, K. A., Cobourne, M. T., Hunt, N. P., et al. National BOS Orthognathic Audit 2017-2018. Journal of Orthodontics. 2019; 46(4).
9. Wemyss, C., Benington, P., Chung, L., El-Angbawi, A., Ayoub, A. Impact of the COVID-19 pandemic on orthognathic patients: What have we learned? British Journal of Oral and Maxillofacial Surgery. 2022; 60.
Leonie Seager (Consultant), Khaled Bhogal (Consultant), Arif Razzik (Speciality Doctor), Anish Patel (Consultant), Fiona Lourenco (DCT) and Jenna Gale (Dental Nurse), Shrewsbury & Telford Hospital, UK
Background/Rationale Patients at Shrewsbury and Telford Hospital Trust (SaTH) were identified as waiting an average of two years for their oral surgery following referral from the orthodontist, with it often taking 12 months for the patients to receive an initial assessment by the oral surgeon. These waiting times needed to be significantly reduced to prevent possible patient harm and to ensure that orthodontic treatment can be commenced in a timely manner.
The previous pathway of referring patients for an oral surgery procedure often led to duplication and rework, with the same information usually being given to the patient by both the Orthodontist and Oral and Maxillofacial Surgery (OMFS) team. Concerns that the time-lapse between referral and surgical treatment could affect the plan was also leading to increased rework for clinicians, cancelled patient appointments and surgery and re-attendances for patients.
A clinically-led Quality Improvement (QI) project to address these long waiting times and inefficiencies in the care pathway for patients requiring combined orthodontic and oral surgery management was therefore undertaken at the Royal Shrewsbury Hospital with several improvement ideas being tested using the PDSA (Plan, Do, Study, Act) model for improvement.
Aims and Objectives
To reduce the time between orthodontic referral and oral surgery assessment to 3 months by August 2025.
To improve the consistency and format of patient information being provided to patients who require oral surgery by April 25 through the development of a patient information leaflet and QR-linked video. There should be >95% acceptability from patients who have watched the video.
To test a new virtual assessment clinic and provide assurance regarding its clinical safety by August 2025.
Standards/guidelines/evidence base
Getting It Right First Time. Hospital Dentistry, GIRFT Programme National Specialty Report. Feb 20211
Sample and data source
Patient questionnaire of 17 pre-operative and 20 post-operative orthodontic patients seen at Royal Shrewsbury Hospital.
Audit of waiting times of all known orthodontic patients referred for oral surgery between 2019 and January 2026.
Retrospective case notes audit of patients completing the Virtual pathway between April 2024 and August 2025.
Audit type
Quality Improvement project (QIP).
Methodology
A meeting was held between clinicians and management to discuss the waiting list in early 2024. It was decided to implement a joint orthodontic-oral surgery clinic every 4 weeks at Royal Shrewsbury Hospital to improve consistency of treatment planning and prevent rework for more complex patients. This joint clinic would be managed by a Dental Nurse to improve clinical ownership and test for improved attendance on the clinic, necessary for financial viability. It was also decided to test the idea of a virtual assessment clinic for clinically simpler patients (Figure 1: Flowchart of proposed joint clinic and virtual pathway).
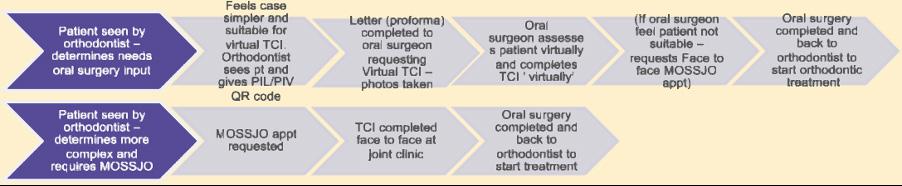
To support the implementation of the virtual clinic, a dedicated patient information leaflet and QRlinked video was produced (Figure 2: Expose and Bond video QR code). The video and leaflet were approved by governance and patient experience teams. Following approval, the video and leaflet were evaluated by patients to ensure acceptability. 17 pre-operative and 20 post-operative patients were asked to watch the video in surgery and then complete a questionnaire based on similar published work1.
The redesigned pathway has delivered measurable improvements in waiting times, patient experience and productivity. An audit of the first 68 patients completing the new pathway showed that the average wait had reduced to 39 weeks for face-toface joint clinic assessment (a 25% improvement) whilst the average wait reduced to 43 weeks for virtual clinic assessment (a 17% improvement). However, many of the patients evaluated had been inherited from the old pathway backlog, meaning that true waiting time reduction is even greater for newly referred patients. Waiting time data to December 2025 (Figure 3: Average Time referral to TCI SPC chart) shows sustained improvement, with the most recent patients referred into the redesigned pathway experiencing the greatest benefit.
A retrospective audit of patients completing the virtual clinic pathway was also completed, with team members being asked to raise concerns in real-time if any issues with the virtual pathway became apparent.
A prospective service evaluation was also kept of patients waiting times from initial referral to completion of the oral surgery assessment. A total of 68 patients dated to August 2025 were included, with data added to the SPC chart up to December 2025 to assess improvement sustainability (Figure 3: Average Time referral to assessment SPC chart).
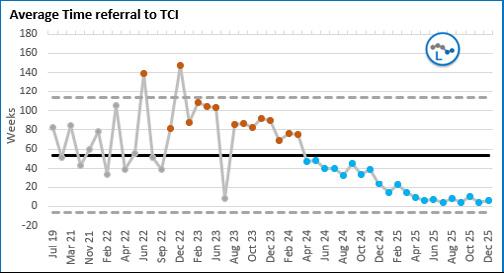
The shift to virtual assessment clinics increased throughput from 8 to 12 patients per session and has enabled the team to clear a waiting list backlog by assessing more patients in the same clinical time. This clinic has also reduced unnecessary travel and attendances for patients linking to one of the key strategies in the NHS sustainability plan. An audit of the first 20 virtual pathway completers also confirmed zero reported safety concerns with 100% of patients having completed appropriate consent and 95% of patients having appropriate letters on the system.
The patient evaluation of the patient information leaflet and QR-linked video strongly indicate that the video is acceptable to patients with 97–100% of patients finding the video to be helpful and clear and advising that they would recommend it to
other patients. Patient acceptability of the video was deemed critical to the safe functioning of the virtual pathway, and the evaluation confirmed that this standard had been met.
The nurse-led pre-call system has delivered a 98% attendance on the joint clinic to December 2025 with 100% of the patients having been appropriately selected for the clinic. This is a significant improvement compared to attendance rates of other joint clinics which are managed by a central, non-clinical bookings team. This improvement has enabled full use of clinical time and supports the cost-effective delivery of multidisciplinary care.
The new pathway design has clearly contributed towards a successful and sustained improvement in the amount of time patients are waiting before receiving their oral surgery assessment. Evaluation of the virtual pathway and patient information video has also ensured that patient information is acceptable, helping to assure clinicians regarding the safety of the virtual pathway.
The re-designed pathway will be adopted as it has eliminated the historic two-stage separate assessment process for complex patients, removing repetitive appointments and reducing changes in treatment decisions caused by long days and the inability to treatment plan in real time with MDT partners. The virtual clinic has also streamlined the process, reducing the number of face-to-face appointments required, whilst increasing clinical capacity. Ultimately this has also enabled the clearing of a significant historic backlog of patients waiting for assessments.
The patient information leaflet and QR-linked video will be adopted with the SMART aim achieved. However, to further improve communication and assurances between the clinical teams and patients, a standardised oral surgery request proforma and virtual clinic letter template has also since been adopted. It is recommended that both joint and virtually assessed patients are given the patient information leaflet and QR-linked video and this has also been shared with the pre-op team who will be checking that this information has been received and understood by the patient prior to surgery.
Ongoing governance oversight through the application of continuous service evaluation and QI methodology will ensure that this adopted pathway remains responsive. Sustainability will be further strengthened through the recruitment of a consultant oral surgeon in the department, supporting future capacity planning and the continuation of an efficient care pathway.
Many thanks to the SaTH Improvements Hub team for their support with implementing this Quality Improvement project.
Project involvement
Leonie Seager (Project lead, project design, data collection and analysis, manuscript drafting and submission)
Khaled Bhogal (Project design)
Arif Razzik (Project design)
Anish Patel (Project design)
Jenna Gale (Data collection)
Fiona Lourenco (project design, patient information leaflet and QR-linked video creation, data analysis)
1. Jones E. Hospital Dentistry: GIRFT Programme National Specialty Report [Internet) London: Getting It Right First Time; 2021 Feb [cited 2026 Mar 13] Available from: https://gettingitrightfirsttime. co.uk/wp-content/uploads/2021/02/ HospitalDentistryReport-Mar21i.pdf
2. Bharmal RV, Parker K, Caldwell S, Chia M, Gillgrass T, Jones G, et al. A Multicentre audit to assess the effectiveness of the British Orthodontic Society ‘Hold that Smile’ retainer videos. J Orthod. 2020 Vol 47(1)72-77
Helena Overton-Smith (DCT) and Timothy Jones (Consultant Orthodontist), Bristol Dental Hospital and University Hospitals Bristol and Weston NHS Foundation Trust, UK
Background/Rationale
The Orthodontic Department at Bristol Dental Hospital (BDH) provides orthodontic treatment for patients with complex needs1. Many outpatient clinics are offered including New Patient, Joint, and Treatment Clinics. Each outpatient requires a record of a clinical outcome (OPSC-4 code2).
It is important that patients are provided with an outpatient activity code and the correct activity code (following ‘Getting it Right First Time’ Outpatient Activity Coding in Orthodontics guidelines3) so that there is an accurate, documented reflection of the services delivered. Accurate documentation is vital for securing trust income and effective service planning.
The Department of Health and Social Care prioritised digital transformation of the NHS and emphasised the importance of digitisation including improving services and transforming performance4. With digital services, patient care can be enhanced through improved clinical effectiveness and efficiency, allowing BDH to better understand past services and optimise future services. Before April 2025, paper forms with a list of outpatient activity codes were given to clinicians at BDH to complete at the end of patient appointments. This information would then be inputted into the computer system by the receptionist. Digital outcomes were introduced to BDH on 1st April 2025 to enable codes to be submitted and recorded digitally. This audit was designed to assess the impact of digital services on outpatient activity coding.
Aims and Objectives
Aims: To assess whether Orthodontic Patients seen by the Orthodontic Department at Bristol Dental Hospital are receiving the correct outpatient activity coding and explore opportunities for digital services to improve patient care.
Objectives: To assess whether orthodontic patients are receiving the correct outpatient activity coding following the implementation of digital coding. To evaluate whether clinicians are providing patients with the correct outpatient activity codes following the implementation of digital coding.
Standards/guidelines/evidence base
A local standard was agreed that 90% of appointments should have an outpatient activity code, when applicable, and 90% of appointments should have the correct outpatient activity code. This was determined from previous audits regarding orthodontic outpatient activity coding5,6. The guidelines that were used were ‘Outpatient activity coding in Orthodontics’ (June 2023) developed by ‘Getting it Right First Time’ (GIRFT), British Orthodontic Society (BOS) and Royal College of Surgeons of England (RCS England).
Sample and data source
Data was collected retrospectively from a total of 160 orthodontic outpatient appointments at BDH, comprising of 80 appointments between September 2024 and March 2025 for Cycle 1 and 80 appointments in April 2025 to Aug 2025 for Cycle 2. Inclusion criteria consisted of treatment or new patient assessment appointments on the BDH Orthodontic Department that were conducted by a consultant or an orthodontic specialty registrar. Data was collected from patient paper notes and provided by the Business Intelligence Team, to determine what treatment was carried out during their appointment and the codes given by the clinician respectively.
Audit type
Two-cycle retrospective audit.
Methodology
During cycle 1, paper forms were used to document the outpatient activity coding. Cycle 2 was carried out after digital outcomes were introduced on 1st April 2025. Patients’ treatment and appointment details were collected from patient paper notes, and this was documented onto a data collection tool
using Microsoft Excel® (Microsoft Corporation, USA) software. The Business Intelligence Team analysed which outcome codes were given for each patient’s outpatient appointment. Any appointments without codes were noted. Data was analysed by comparing codes advised by the GIRFT guidance with the given codes and a comparison was made between cycle 1 and 2.
Before digital outcomes, (cycle 1) 61% of appointments were being provided with an outpatient activity code. Following digital outcomes (cycle 2), 91% of appointments were being provided with an outpatient activity code. This demonstrates an improvement of 30% and achieves the 90% standard in cycle 2 (Figure 1).
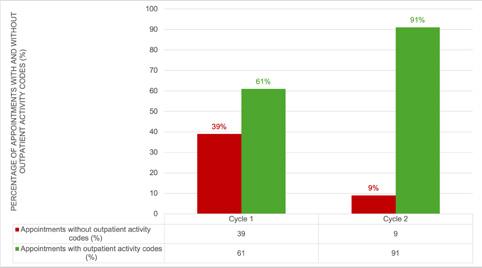
Figure 1: Bar chart showing percentage of appointments with codes and with no codes
In cycle 1, 38% of appointments were being provided with the correct outpatient activity codes following ‘Getting it Right First Time’ Outpatient Activity Coding in Orthodontics guidelines3. In cycle 2, 62% of appointments were being provided with the correct outpatient activity codes (Figure 2).
The findings from this audit establish that digital services have had a positive impact on outpatient activity coding documentation and supports the movement towards digitisation within the NHS. Introducing digital services reduces errors as codes are sent directly to the Business Intelligence Team rather than being passed by paper through multiple hands and removes the process of inputting the appointment’s outcome onto the system by the receptionist. Paper outcome forms can be discarded or misplaced leading to further factors that negatively affect coding documentation.
Despite an improvement of 24% in the accuracy of coding between cycles 1 and 2, the 90% standard was not achieved in either cycle.
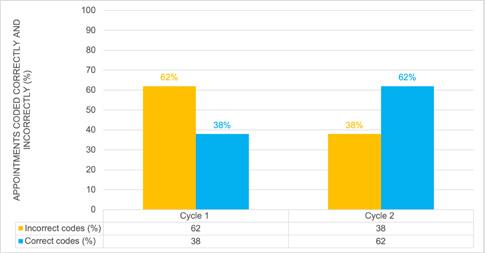
Figure 2: Bar chart showing percentage of correct and incorrect codes
Further data analysis revealed, on exclusion of patient appointments that did not have a code, that the most common reason for incorrect coding initially was missing a code for re-bonding or re-positioning a bracket during treatment (either F15.7 or F15.6), this accounted for 41% of incorrect codes in cycle 1 and reduced to 3% of incorrect codes in cycle 2. Missing a further code, in addition to what was given for that appointment, occurred in 34% of incorrect coding in cycle 1 and 23% in cycle 2. Missing codes included F14, X62.1, F42.4, F16.7, F15.7, F15.4, F66.3 and F15.2. For cycle 1, not using adjustment of orthodontic appliance code (F15.5) for a review and incorrect use of insertion of orthodontic appliance (F14.3) occurred in 10% of the incorrect coding in both cases. For cycle 2, 57% of the wrong codes were from incorrect use of the adjustment of intra oral appliance code (F67.3) for a fixed appliance adjustment. The correct code would have been the adjustment of orthodontic appliance code (F15.5).
Cycle 1 data analysis revealed that there was a need for improvement to meet the standards. It was identified that the department was becoming digitised. Therefore, as part of the action plan to meet the standards, there would need to be the introduction of a digital coding system. This system was implemented along with some guidance on using the new system. The GIRFT document3 and BOS guidance7 were also circulated to all clinicians.
Following cycle 2, it was established that digital outcomes have improved the representation of services. The findings highlight the importance of digital services as a standardised and more effective documentation practice. The standard had been met for patients that were given a code when applicable. However, the standard of 90% correct outcomes hadn’t been met, therefore, there’s still a lack of representation of services being provided. To improve clinicians coding correctly, clinician education was recommended and the reasons for incorrect coding were investigated.
A departmental presentation was delivered following cycle 2, regarding outcome coding. The barriers to providing the correct coding were discussed and included the inconvenient order of the coding on the digital system and, if using multiple codes in an appointment, the codes would be challenging to find as they may not be close together. Additionally, there was confusion between insertion of orthodontic appliance (F14.3) and insertion of fixed orthodontic appliance (F14.1).
Overall, transformation to digital services delivered a positive impact on outpatient activity coding. There was a significant improvement to the number of patients appointments which were receiving coding and therefore an improvement in the representation of services provided at BDH. Additionally, there was an improvement seen with clinicians coding correctly, however, further work is required to increase correct coding to meet the standard. A reaudit would be recommended following a teaching session at a Departmental Audit Meeting to see the impact of education on coding correctly. The GIRFT document has also been printed and placed in each bay for easy reference when coding each patient appointment. Digital services provide a time efficient and standardised way of documenting codes. To improve digital coding in clinics in the future, the use of automation and grouping codes together for certain treatments could be developed.
Recommendations
Investigate ways to implement further digital services such as automation of coding for appointments with known codes: For example, multidisciplinary clinics would have an automated code of assessment by multidisciplinary team code (X62.3) input into the digital system, therefore, reducing clinician workload and improving correct coding.
Investigate ways to conveniently order the coding on the system and group coding together for certain treatments: For example, grouping removal of orthodontic appliance, polishing teeth, photography and impressions (F14.4, F16.7, F42.4 and F15.1) for treatment which involves debond at the end of active treatment. This may improve clinicians coding correctly and time efficiency.
Re-audit following teaching presentation at the Audit Departmental Meeting in 6 months.
Project involvement
Helena Overton-Smith (Project lead, data collection, manuscript drafting)
Timothy Jones (Project supervisor, manuscript approval)
References
1. University Hospitals Bristol NHS Foundation Trust. Orthodontics – University of Bristol Dental Hospital. Bristol: UHBW NHS Trust; [Accessed 23 Aug 2025]. Available from: https://www.uhbristol.nhs.uk/ patients-and-visitors/your-hospitals/university-ofbristol-dental-hospital/what-we-do/orthodontics/
2. NHS England. OPCS-4.10 National Clinical Coding Standards 2024. Leeds; NHS England; 2024. Available from: https://classbrowser.nhs.uk/ref_books/OPCS4.10_NCCS-2024.pdf
3. Getting It Right First Time (GIRFT) Coding Team; Orthodontic Dentistry GIRFT Coding Working Group. Outpatient activity coding in Orthodontics: Information for secondary care trusts. Version 3.0. London: NHS England; 2023 [Accessed 23 Aug 2025]. Available from: https://gettingitrightfirsttime.co.uk/ wp-content/uploads/2023/06/Outpatient-activitycoding-in-Orthodontics.pdf
4. Health and Social Care Committee. Digital transformation in the NHS: Eighth Report of Session 2022–23. London: House of Commons; 2023 [Accessed 23 Aug 2025]. Available from: https:// publications.parliament.uk/pa/cm5803/cmselect/ cmhealth/223/report.html
5. Turner S, Harrison J, Hosni S. Orthodontic clinical coding: A two-cycle regional audit. BOS Clinical Effectiveness Bulletin. 2023; 50: 17-19.
6. Quach H, Radia S, Davenport-Jones L. Accuracy of activity coding in orthodontics: A 2-cycle audit. BOS Clinical Effectiveness Bulletin. 2025; 54: 21-24
7. British Orthodontic Society. Activity coding in orthodontics: information for secondary care trusts. Version 3.0. London: British Orthodontic Society; 2023 [Accessed 23 Aug 2025]. Available from: https://bos. org.uk/wp-content/uploads/2023/06/Activity-Codingin-Orthodontics-2023.pdf