
713
YOY
PRIOR MONTH
Inventory
1,462 -6.7% YOY
PRIOR MONTH
635 -1.2% YOY
PRIOR MONTH
727
PRIOR MONTH
20
$910K
July brought a seasonal slowdown to Fairfield County’s single-family market, with activity easing from the fast pace of the spring selling season. New listings declined 21.6% from June to 713 homes, a typical midsummer trend, while remaining 5.3% below July 2025. Active inventory also edged lower to 1,462 homes, down 6.7% YoY and 6.9% from the prior month.
Buyer activity moderated as expected, with pending sales totaling 635 transactions, down 1.2% YoY and 13.3% from June. Closed sales followed a similar pattern, slipping 4.3% from the prior month and 1.5% YoY to 727 transactions. Despite fewer transactions, pricing remained resilient.
The median sale price reached a new record high of $910K, increasing 4.3% YoY and 1.5% from June, highlighting continued demand for well-priced homes. Homes averaged 20 days on market, up from June but still reflecting a competitive market by historical standards with just 2.8 months supply of inventory at the close of the period.
SELECT MARKETS | PAGE 3
+13.2% YOY -7.7% PRIOR MONTH
+16.1% YOY -1% PRIOR MONTH
+27% YOY
+16.4% PRIOR MONTH
YOY
PRIOR MONTH
26 +62.5% YOY
PRIOR MONTH
$465K
+8.1% YOY +4.6% PRIOR MONTH
Fairfield County’s condo and townhouse market remained active through July, although seasonal trends led to a modest slowdown in overall activity. New listings declined 7.7% from June to 300 units but remained 13.2% higher than July 2025, continuing to provide buyers with more options than a year ago. Active inventory climbed to 585 homes, up 16.1% YoY despite a slight 1% decline from the prior month.
Buyer demand remained healthy heading into the latter part of summer. Pending sales increased 27% YoY and 16.4% from June to 249 transactions, while closed sales edged up 2.2% from the prior month to 229 homes, though they finished 6.9% below last year’s pace.
Pricing continued to strengthen, with the median sale price reaching a record $465K, up 8.1% YoY and 4.6% from June. Homes averaged 26 days on market, reflecting a more measured pace than earlier this year while continuing to demonstrate the overall stability of Fairfield County’s condominium market.
50
-13.8% YOY -30.6% PRIOR MONTH
-34.7% YOY -15.3% PRIOR MONTH
72 0% YOY +26.5% PRIOR MONTH
12 -57.9% YOY +14.3% PRIOR MONTH
74
+27.6% YOY +2.8% PRIOR MONTH
Median Price
$3.6M
+2.5% YOY -5.5% PRIOR MONTH
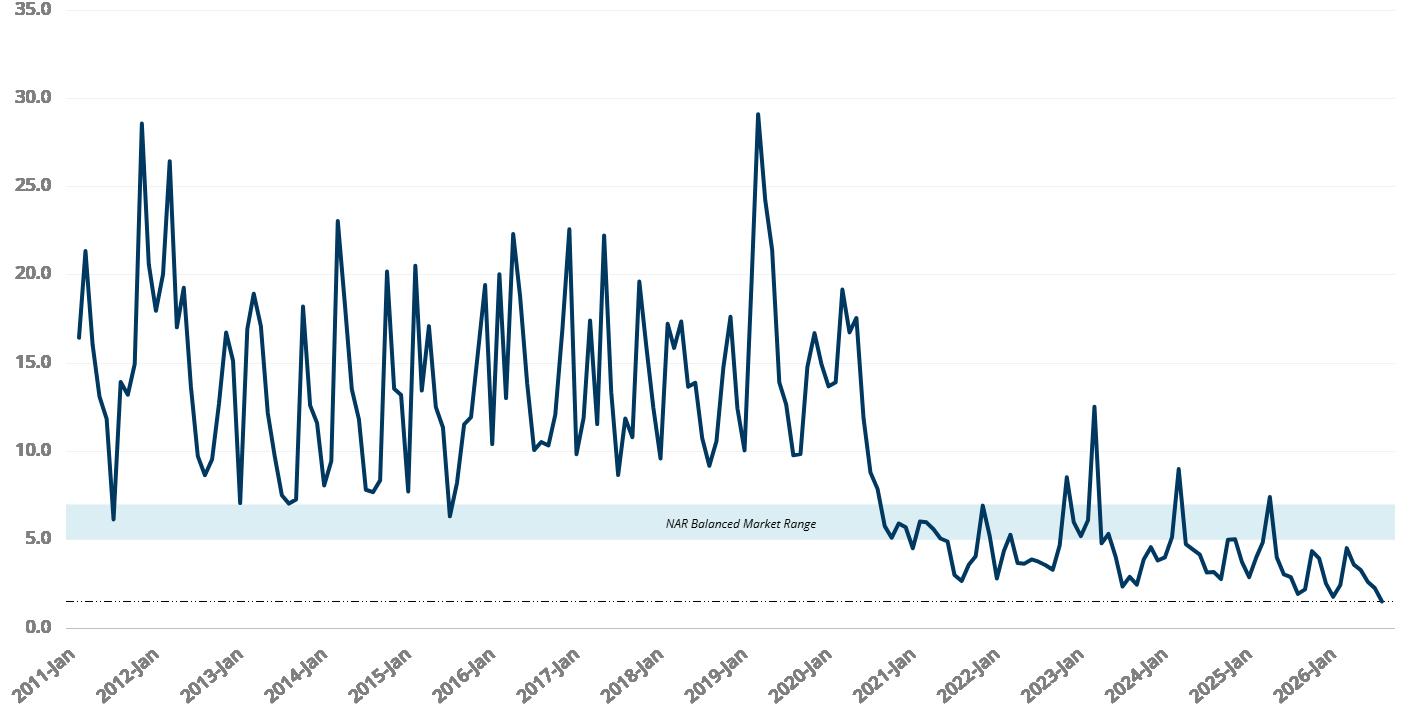
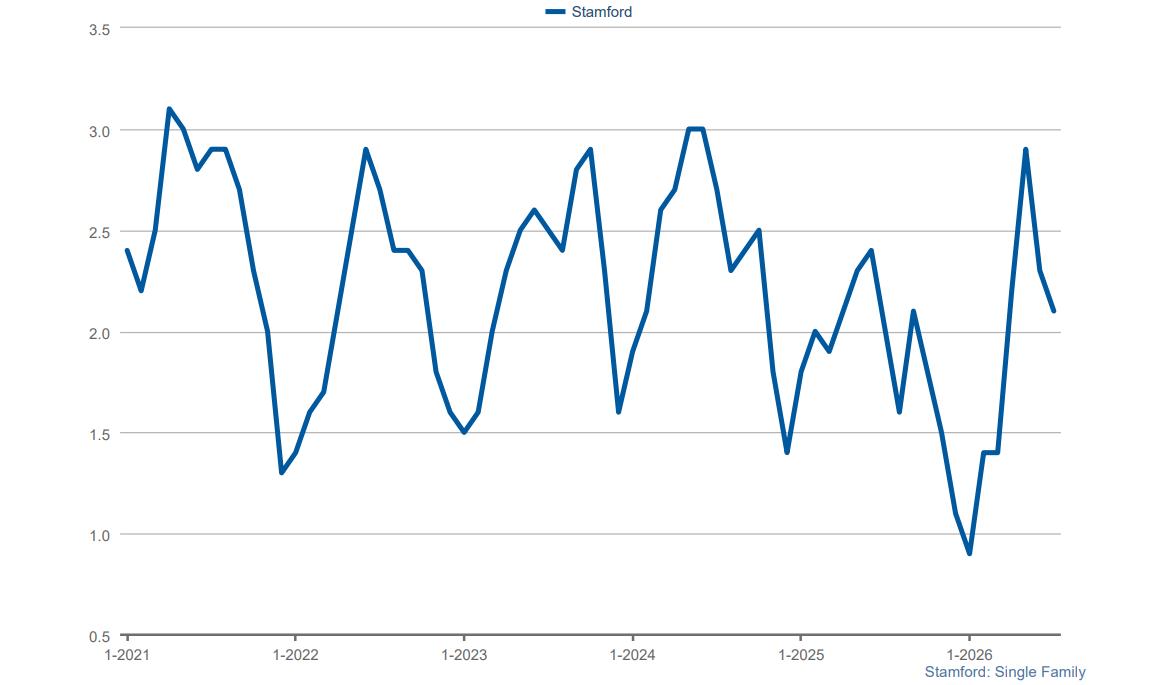
Greenwich’s single family market remained exceptionally competitive in July as inventory fell to its lowest level on record. New listings declined 13.8% YoY to 50 homes, while active inventory dropped 34.7% from last year to just 111 homes. Buyer demand remained healthy, with pending sales matching last year’s pace at 72 transactions and closed sales jumping 27.6% YoY to 74 homes. Although the median sale price moderated from June’s record high, it remained 2.5% above last year at $3.6M. With just 1.5 months of inventory, the lowest level ever recorded, Greenwich’s market continues to face an acute shortage of available homes, creating exceptional conditions for sellers.
JULY 2026 MONTHS SUPPLY OF INVENTORY
1.5 -22.3% YOY
Closed Sales 63
Median Price
$915K
$482K
Closed Sales
35
YOY
PRIOR MONTH
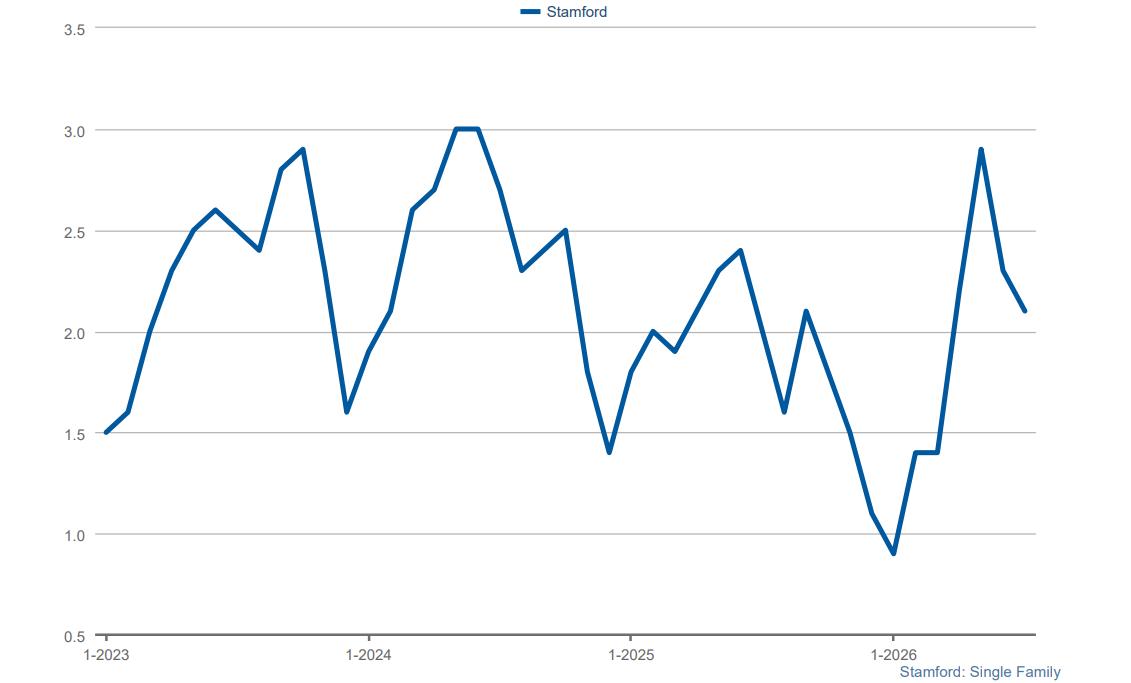
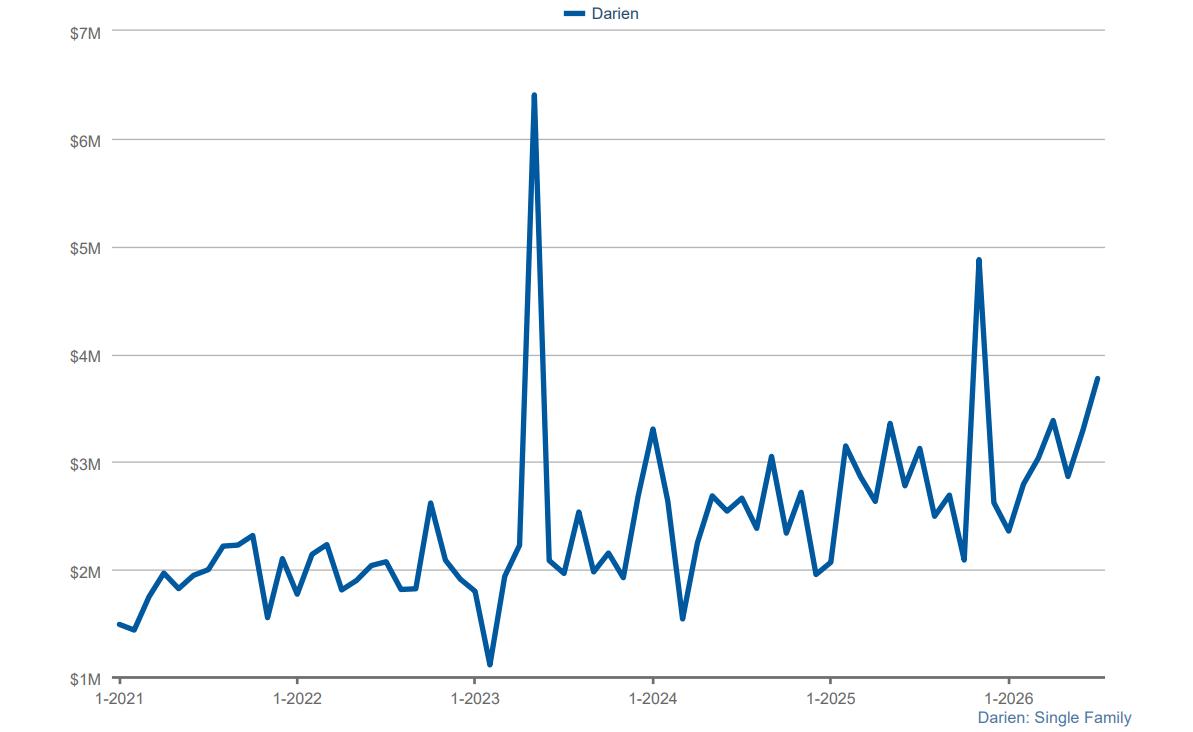
Darien’s single-family market remained exceptionally competitive in July as inventory tightened further to just 26 homes, down 3.7% YoY and 16.1% from June. New listings totaled 14 homes, matching last year’s pace but falling 44% from the prior month. Buyer activity slowed seasonally, with pending sales declining to 16 transactions and closed sales totaling 35 homes. Despite fewer transactions, the median sale price remained strong at $3.15M, up 16.7% YoY, while homes averaged just 13 days on market. With only 1.5 months of inventory, Darien continues to be one of Fairfield County’s most competitive seller’s markets.
PRIOR MONTH
Median Price
$3.15M
YOY
PRIOR MONTH
SALE PRICE SINGLE FAMILY HOMES
JULY 2026 MONTHS SUPPLY OF INVENTORY
1.5 +7.1% YOY
Condo+Coop Highlights Closed Sales 59
$860K
24 +33.3% YOY -25% PRIOR MONTH
Inventory
39 -18.8% YOY -11.4% PRIOR MONTH
23
YOY
PRIOR MONTH
13
YOY
PRIOR MONTH
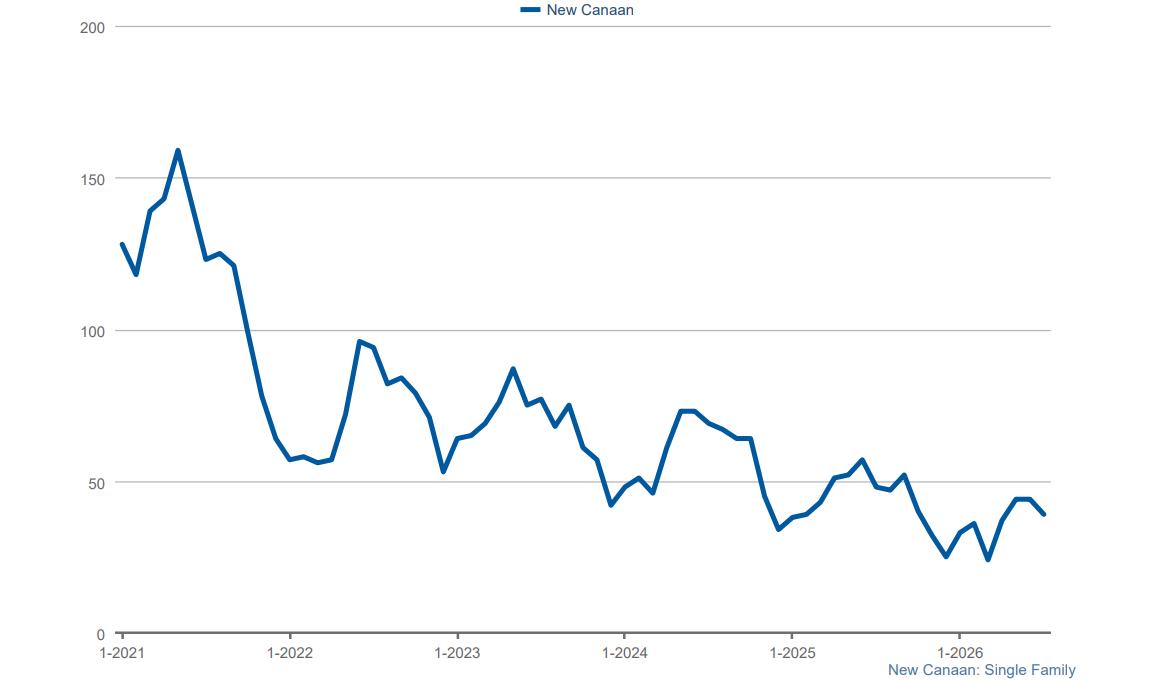
An increase in new listings did little to ease New Canaan’s inventory shortage in July. New listings rose 33.3% YoY to 24 homes, but active inventory declined 18.8% from last year to just 39 homes as fresh inventory was quickly absorbed. Pending sales increased 15% YoY, while closed sales climbed 8.7%, reflecting continued buyer confidence despite the seasonal slowdown. Although the median sale price moderated from June’s elevated level, it remained 2.3% higher than a year ago at $2.6M. Homes averaged just 13 days on market, underscoring continued demand for well-priced properties. With just 2.1 months of inventory, competition for desirable homes remains strong.
Closed Sales
25
YOY
PRIOR MONTH
Median Price
$2.6M
YOY
PRIOR MONTH
JULY 2026 AVERAGE SALE PRICE
$2.8M -16.3% YOY
23
YOY
YOY
YOY
19
YOY
47
YOY
PRIOR MONTH
Median Price
$2.65M
YOY
MONTH
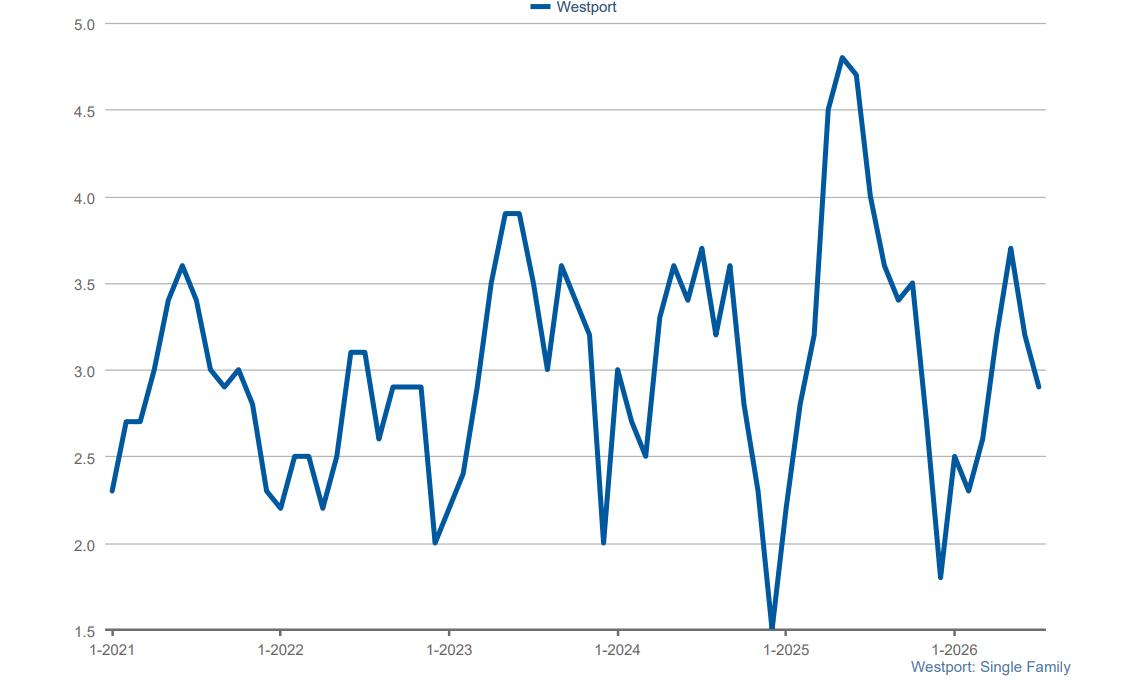
Strong pricing and a surge in closed sales highlighted Westport’s single-family market in July. New listings declined to 26 homes, down 16.1% YoY, while active inventory continued to tighten, falling 25.5% from last year to 76 homes. Pending sales eased to 23 transactions as fewer homes came to market, while closed sales jumped 38.2% YoY to 47 transactions. The median sale price climbed to $2.65M, up an impressive 27.6% YoY, as homes continued to sell in an average of just 19 days. Months of supply declined 27.5% YoY to just 2.9 months, reinforcing favorable conditions for sellers.
MONTHS SUPPLY OF INVENTORY SINGLE FAMILY HOMES
JULY 2026 AVERAGE SALE PRICE
$2.98M +10.6% YOY
16
YOY
PRIOR MONTH
Inventory
40
YOY
PRIOR MONTH
14
YOY
PRIOR MONTH
18
YOY -10% PRIOR MONTH
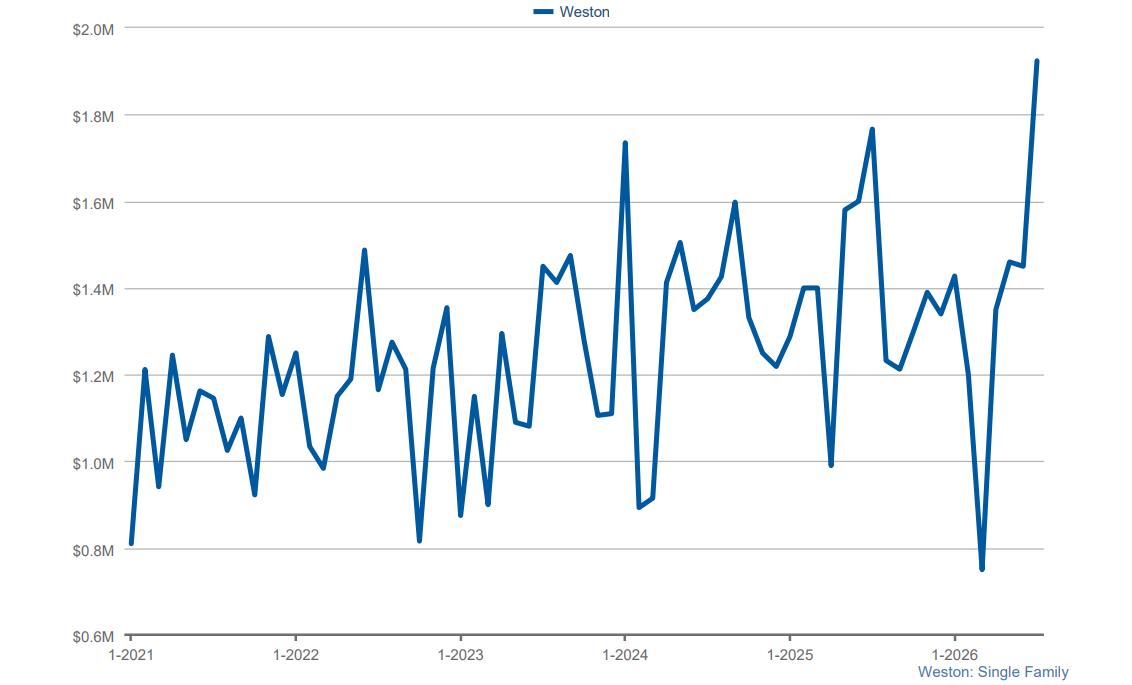
Buyer demand gained momentum in Weston during July, pointing to continued confidence in the market despite fewer new listings. New listings declined 5.9% YoY to 16 homes, while active inventory remained relatively stable at 40 homes, down just 2.4% from last year. Pending sales jumped an impressive 55.6% YoY, signaling renewed buyer activity, although closed sales declined to 12 transactions. The median sale price rebounded to $1.92M, up 8.9% YoY and 32.7% from June. Homes averaged 18 days on market, reflecting continued demand for wellpriced properties. With 3.7 months of inventory at month-end, Weston remained balanced but continued to favor sellers.
Closed Sales
12
YOY
PRIOR MONTH
Median Price
$1.92M
YOY
PRIOR MONTH
JULY 2026 AVERAGE SALE PRICE
$1.82M +4.6% YOY
YOY
PRIOR MONTH
Inventory 41
YOY
PRIOR MONTH
YOY
PRIOR MONTH
PRIOR MONTH Closed Sales
YOY
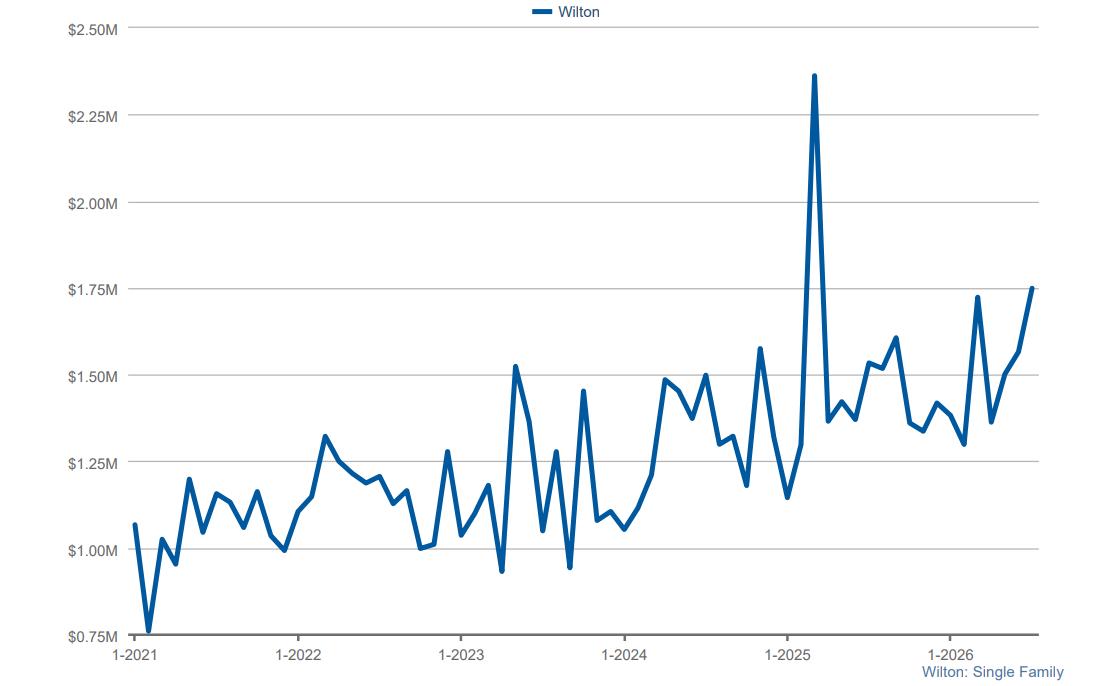
Wilton’s single-family market continued to gain momentum in July, with buyer activity and home values both improving from a year ago. New listings increased 4.5% YoY to 23 homes, while active inventory declined 14.6% to 41 homes. Pending sales rose 8% YoY, and closed sales increased 14.7%, reflecting steady buyer demand despite fewer homes coming to market than in June. The median sale price climbed to $1.65M, up 16% YoY, while the average sale price increased 14% YoY to $1.75M. Homes averaged just 16 days on market, and with only 2.3 months of inventory, Wilton remained a competitive market where demand continued to outpace supply.
39
YOY 0% PRIOR MONTH
Median Price
$1.65M
YOY
PRIOR MONTH
AVERAGE SALE PRICE SINGLE FAMILY HOMES
JULY 2026 MONTHS SUPPLY OF INVENTORY
2.3 -17.9% YOY
JULY 2026 AVERAGE SALE PRICE
$1.75M +14% YOY
$1.18M
$788K
YOY
YOY
PRIOR MONTH
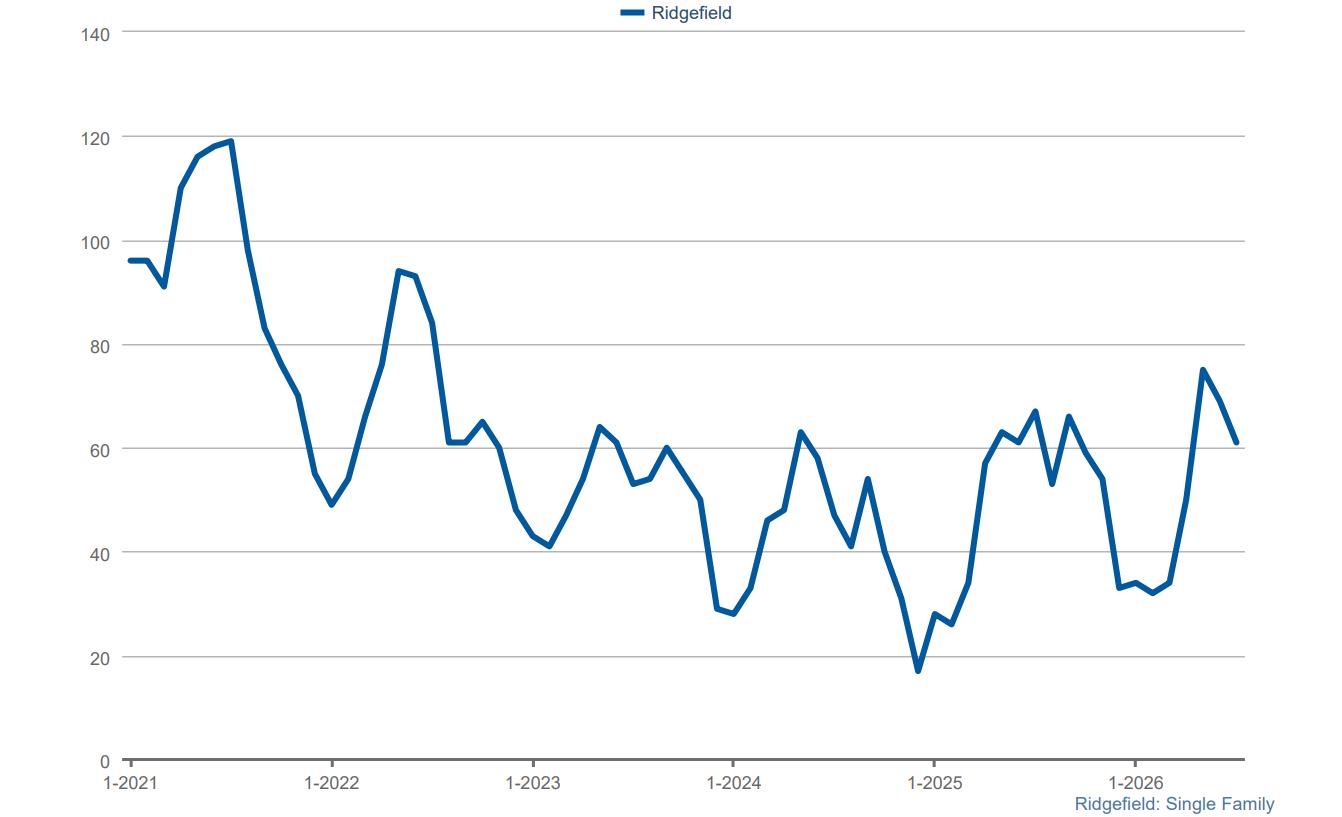
Buyer demand accelerated in Ridgefield during July, setting the stage for continued market activity heading into late summer. New listings increased 14.3% YoY to 40 homes, while active inventory declined 9% from last year to 61 homes. Pending sales surged 57.1% YoY to 33 transactions, reflecting strong buyer confidence despite the seasonal slowdown. Closed sales finished 33.3% above year’s pace, while the median sale price climbed an impressive 30.7% YoY to $1.42M, highlighting continued strength in home values. Homes averaged 19 days on market, and with approximately 2.9 months of inventory, Ridgefield remained a competitive market for well-priced homes.
Closed Sales
32
YOY
PRIOR MONTH
Median Price
$1.42M
YOY
JULY 2026 AVERAGE SALE PRICE
$1.53M +37.8% YOY
8
YOY
YOY
PRIOR MONTH
11
YOY
17
YOY
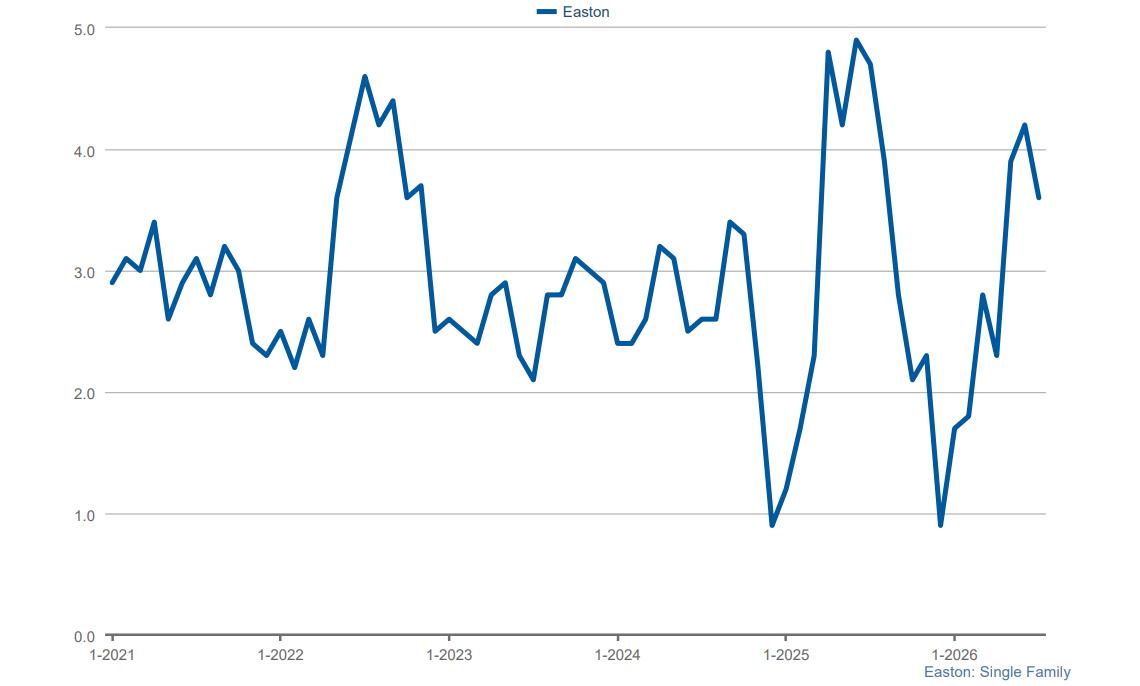
Easton’s single-family market remained selective in July, with limited new inventory continuing to shape buyer activity. New listings declined 46.2% YoY to just seven homes, while active inventory fell 18.8% from last year to 26 homes. Pending sales totaled eight transactions, down 20% YoY, but closed sales increased an impressive 57.1% to 11 homes. The median sale price climbed to $1.1M, up 21.5% YoY, while homes averaged 17 days on market. With 3.6 months of inventory, down 23.4% from a year ago, Easton continued to offer a more balanced market than many neighboring towns while still favoring sellers.
$1.1M
MONTHS SUPPLY OF INVENTORY SINGLE FAMILY HOMES
JULY 2026 MONTHS SUPPLY OF INVENTORY
3.6 -23.4% YOY
Median Price
$510K
$300K
8
YOY
PRIOR MONTH
Inventory 30
YOY -11.8% PRIOR MONTH
10
YOY
PRIOR MONTH
28
YOY
PRIOR MONTH
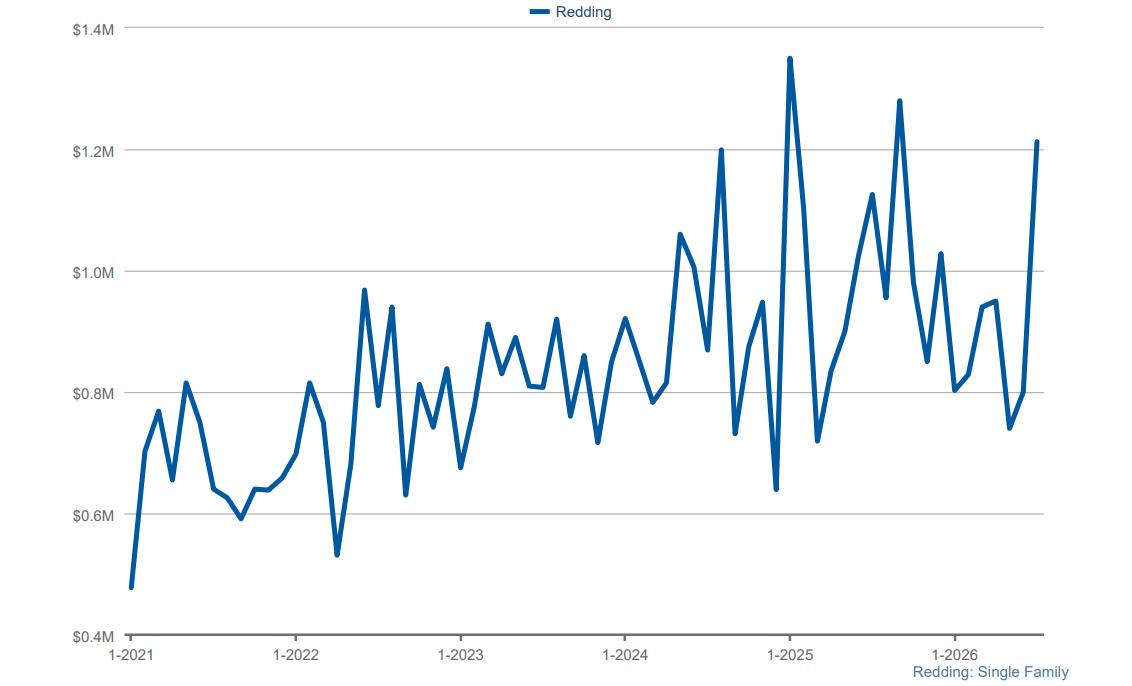
Redding’s single-family market saw a notable increase in closed sales during July, reflecting contracts signed earlier in the season. New listings totaled just 8 homes, down 20% YoY and 33.3% from June, while active inventory was also down 11.8% from June and 31.8% below last year’s level at 30 homes. Pending sales eased to 10 transactions following June’s surge, while closed sales jumped 128.6% from the prior month to 16 homes. The median sale price climbed to $1.2M, up 7.7% YoY and an impressive 51.6% from June, while homes averaged 28 days on market. With 3.4 months of inventory, Redding remained a seller’s market.
16
YOY
PRIOR MONTH
Median Price
$1.2M
YOY
MONTH
JULY 2026 MONTHS SUPPY OF INVENTORY
3.4 -29.2%