Greenfield’s Bicycle Network
A Path to Safer Connectivity







Bike drawings contributed by the people of Greenfield.
Brian Burke, Grace Morton, and Bennett Zimmerman
The Conway School Winter 2026
Prepared for the City of Greenfield, MA
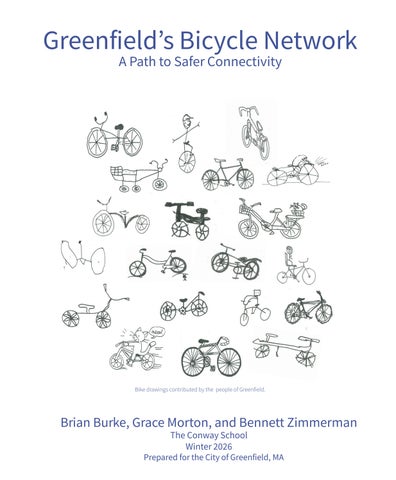
Bike drawings contributed by the people of Greenfield.
Brian Burke, Grace Morton, and Bennett Zimmerman
The Conway School Winter 2026
Prepared for the City of Greenfield, MA
Prepared for the City of Greenfield
Winter 2026
Grace Morton | Brian Burke | Bennett Zimmerman

We must acknowledge that we are standing on, and benefiting from land that has been seized, expropriated, and taken from Indigenous people, often through deceit, falsified deeds, and violence. For thousands of years this has been Pocumtuck land. This is still the homelands of the Pocumtuck, they are still here, their voices are still here in the air we breathe. These are still the homelands of the Pocumtuck, Norwottock, Woronoco, Agawam, Nipmuck, Abenaki. These Native peoples and their descendants are still living among us. They have not gone. Every time we gather here we must acknowledge and respect that fact.
But any land acknowledgement should also contain an acknowledgement of the land.
We have been taught by Indigenous elders that to draw our minds together at the beginning of any gathering we should remember to be grateful and thankful for all that we have been given:
We give thanks to the sun every morning
We give thanks to the four directions
To all living creatures, they are our kinfolk and teachers
To the woodlands and rivers that sustain us:
the Pocomegon (Green River),
the Pocumpetuk (Deerfield River)
the Roanasiatok (Fall River)
the Paguag (Millers River)
the mighty, long river Quonektakut
We give thanks to the hills and plains who are a part of us as we are of them
To the last 7 generations and the next 7 generations
To our ancestors who have guided us and who are here with us now
We do not have to ask for anything. All this has been given to us.
Acknowledgement and expressing our thankfulness are the first steps in a long process of self-education. We must listen to Native voices who can remind us and teach us how to live in balance and reciprocity. We are all in this together. What will we do with what we have been given?
This text is from the Nolumbeka Project, a 501(c) (3) non-profit organization dedicated to the preservation of the history of Native Americans/American Indians of New England through educational programs, art, history, music, heritage seed preservation and cultural events. The organization is located in Greenfield, MA.
We would like to thank the City of Greenfield, especially Amy Cahillane and Ella Wise, for providing helpful guidance and feedback throughout the process of developing this report. Thank you to the members of the Greenfield community who were active participants in the development of the recommendations in this report.
Thank you to our sponsor, Greenfield Savings Bank, for their generous support in making this project possible.
The City of Greenfield is exploring options to create a network of safe and comfortable bike routes for cyclists throughout the city. The City’s Department of Planning and Development asked the Conway School to study the city’s existing bike infrastructure, analyze the physical conditions of the roadways, and survey the community to understand where it would be most impactful to create bike routes and add cycling infrastructure.
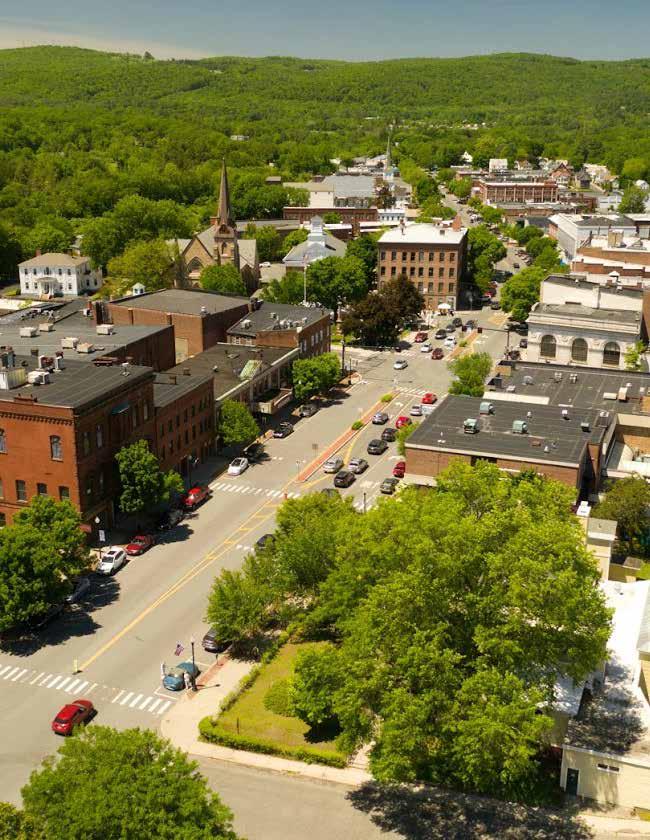
Today, 15% of Greenfield households do not have access to a vehicle, so it is critical to ensure that the city is walkable, bikeable, and connected to public transportation. The city is centered around an “urban core” where there are dense commercial and urban residential zones, as well as many of the schools, city services, and recreation destinations. This urban core is primarily flat and the streets are in a gridded form—two conditions that support comfortable biking. There is limited existing biking infrastructure, with few streets having painted bike lanes and shared lane markings for cyclists. Along the Green River on the east side of town is a 1.4 mile long shared use path, offering an off-street cycling opportunity. Both the on-street and off-street infrastructure is segmented and disconnected; the city lacks a continuous network for cyclists.
To ensure that the proposed solutions were community-informed, the Conway team distributed an online survey and held an in-person community meeting for the residents of Greenfield and the neighboring towns.
Feedback from the community was collected to identify the residents’ primary destinations, current biking routes, and safety concern areas. These findings were compared with infrastructure projects proposed in previous planning documents from the city, including the 2017 Complete Streets Prioritization Plan. Combined, these sources provided an outline of the community’s priorities in terms of ideal routes and priority infrastructure enhancement projects.
The team additionally conducted spatial analyses of the city to analyze the impact of a potential bike route.
A custom physical conditions model was developed to quantify the slope, road width, speed limit, and traffic volume on any given street. The model output described the safety and comfortability of a route based on physical conditions today, and highlighted areas for potential infrastructure improvements. Social criteria were then overlaid on the bike route to understand the impact and access provided to the community. Finally, a feasibility review is suggested to explore considerations that may impact bikeability and infrastructure options, including right-of-way space and use, street parking, and existing traffic calming measures.
This information informed the creation of a proposed network of bike routes throughout the city, consisting of ten network segments and categorized into transportation routes and recreational routes. This network includes two major projects currently in the planning process by MassDOT and the City of Greenfield, providing solutions for Route 2A and Main Street. Suggested network segments within the urban core focus on providing primary access to north-south through streets and east-west wayfinding routes that connect to schools, the hospital, and Main Street. Existing infrastructure on two major throughways, Silver Street and Federal Street, was identified as undersized and recommendations include enhancing the infrastructure on those streets to increase safety for cyclists. On the western reaches of town, a route is included to access Greenfield Community College, and on the eastern part of town, access to Rocky Mountain Park is prioritized. Two streets leading out of the urban core, Leyden Road and Turners Falls Road, were identified as priority areas for infrastructure as both were highlighted by the community as conflict areas today. Focusing on larger economic development opportunities, multiple extensions to the Greenway shared use path were identified to expand the recreational cycling network. Northern connections would allow for access to the path from the urban core and affordable housing neighborhoods. A southern connection recommendation includes partnering with Deerfield to connect to the historic Deerfield neighborhoods.
While the focus of this project was on the overall cycling network throughout Greenfield, other considerations were also discussed with the community and researched, including mountain biking trails, bike racks and repair stations, safety education opportunities, creating a community biking committee, and the future of electric bikes.
Conversations with the community and the City’s Planning Board confirm that a safe and easily navigable biking network throughout Greenfield would be greatly beneficial for the residents of the city and the surrounding towns. Increased infrastructure could improve a cyclist’s experience and encourage more people to bike around Greenfield. The proposed network aims to provide safe and comfortable access to critical destinations around town while also creating opportunities for recreation for all ages.
The City of Greenfield reached out to the Conway School with an interest in working with students to create a comprehensive bike plan for the city. Staff from the Planning and Economic Development Departments were seeking a better understanding of the existing biking infrastructure available to cyclists today, including onroad bike lanes, off-road bike paths, bike racks, repair facilities, and wayfinding signage. They were interested in hearing from the community to better understand the current challenges with biking around Greenfield, typical destinations of the residents, and ideas for future infrastructure enhancements. The City of Greenfield asked the Conway team to utilize this information and GIS spatial analysis to propose an informed network of bike routes throughout the city along with a list of suggested infrastructure and safety enhancements.
:
↳ Identify a connected network of bike routes throughout the city that were safe and comfortable for any type of cyclist
↳ Outline areas for infrastructure enhancements that would increase safety and connectivity throughout the city
↳ Ensure that the routes and proposed infrastructure enhancements were informed by the community
In 2017, the City of Greenfield wrote a Complete Streets Prioritization Plan (CSPP) to apply for MassDOT grant funding made available for bike and pedestrian infrastructure improvements. Through community meetings and physical conditions analysis, the city identified over 100 potential projects for infrastructure enhancement, including 33 bike-related projects. Although few of these projects progressed to a feasibility study and implementation, the CSPP provides a jumping off point for the Conway team. This comprehensive bike plan has been informed by the work completed previously by the city and the community and proceeds with further analysis and recommendations.
Existing standards for bicycle network design informed the analysis approach and solution design for this project. Many cities have successfully used these guides to design bike-friendly communities based on the following principles.


Safety: The frequency and severity of crashes are minimized and conflicts with vehicles are limited
Comfort: Conditions do not deter cycling due to stress, anxiety, or safety concerns
Connectivity: All destinations can be accessed using the bicycle network and there are no gaps or missing links
Directness: Distances and trip times are minimized
Cohesion: Distances between parallel and intersecting bike routes are minimized
Attractiveness: Routes direct bicycles through lively or scenic areas
Unbroken Flow: Stops, such as long waits at traffic lights, are limited and street lighting is consistent
Bike Infrastructure encourages cycling and makes it a safer form of transportation. Bike infrastructure includes networks of separated bike trails or designated on-street lanes, carefully designed intersections, city bikeshare programs, and access to secure bike parking, especially near public transportation.
Slow is safe: Reduced traffic speeds result in fewer collisions between vehicles and cyclists with better outcomes. Safest roads are 25 MPH or under.
Separation is safe: Where possible, a buffer between bikes and auto traffic is ideal. It is statistically safer and the public’s perception of safety increases willingness to ride.
Comfortability is a function of the perceived safety of a cycling route. High comfort routes are deemed accessible to the broadest segment of riders. Examples of comfortable routes:
↳ Separated or protected bicycle infrastructure
↳ Dedicated off-road bike paths
↳ Scenic or intuitive routes
↳ Low speed neighborhood streets
Additional considerations include slope, lighting, pavement condition, separation from traffic, etc.
A connected, seamless bike network provides multiple ways for people to get where they want to go and a safe, comfortable experience for people of all ages and abilities. In order to meet the needs of everyone, a connected bike network should be, by definition, low-stress and high-comfort. Such a network can include a variety of facilities, from a protected bike lane or a quiet neighborhood street to a separated shared-use path.
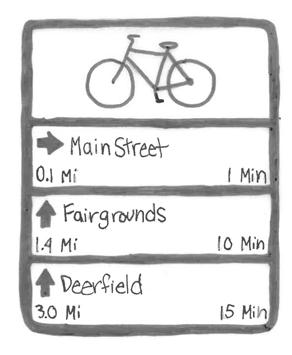
Signs and/or pavement markings that support route-specific decision making and overall orientation within a city for cyclists, pedestrians, and drivers. Clear, consistent, and easy-to-follow wayfinding helps people navigate unfamiliar places along new routes. There are four primary types of wayfinding signage:
↳ Confirmation Signs: indicate to people on bikes that they are on a designated bikeway and make motorists aware of the bike route (include bikeway name and, optionally, destination).
↳ Decision-Making Signs: mark the junction of two or more bikeways, and to inform people on bikes of the designated bike route to access key destinations (include destinations and arrows).
↳ Road Markings: typically used to help reinforce routes and directional signage. They provide route confirmation and can help bikers navigate unfamiliar or unintuitive routes.
↳ Street Name Signs: Street name signs can indicate to both riders and drivers that the cross street is a bikeway (includes the street name and a bicycle symbol or other bikeway brand, either as part of the street name sign or as a supplement).
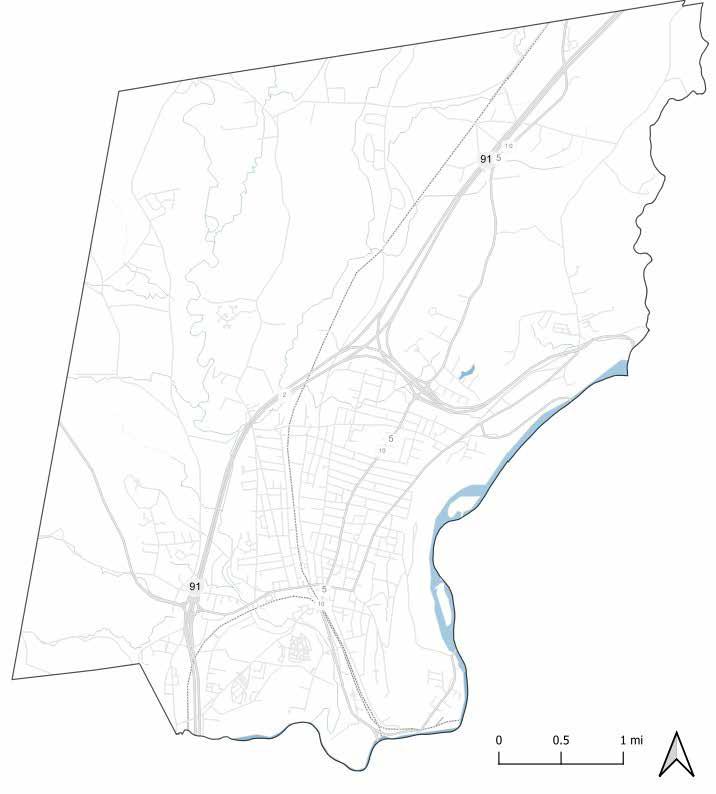
The city is centrally established around what is referred to as the urban core, a densely developed area containing the city’s primary commercial activity and high-density urban residential districts. This central gridded street system is contained within the highway network formed by I-91 and Route 2 and contains a majority of the residents’ primary recreation destinations and services. Outside of this urban core are low density suburban and rural residential zones that occupy a majority of the city’s land area.
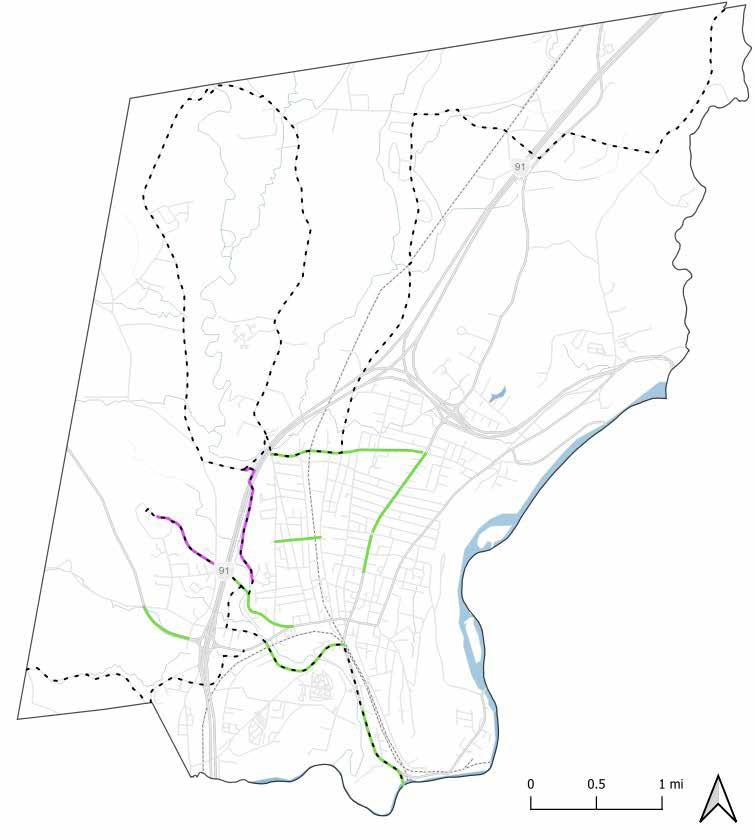
The City of Greenfield has limited existing infrastructure for cyclists on the roadways and few offroad multi-use paths. A handful of roads, highlighted in green, have either a painted bike lane or a shareduse “sharrow” painted on the street to alert drivers to the possibility of a cyclist sharing the road. During winter conditions, it was observed that these facilities were frequently obstructed and obscured by snow. There are also short sections of shared-used paths for pedestrians and non-motorized uses that are paved and completely separate from the roadways, noted in purple on the map. These paths are not consistently maintained or plowed in the winter.
Both types of infrastructure are available in fragments throughout the city, providing temporary solutions and guidance along a route that abruptly ends, leading cyclists into more dangerous roadways without alternative options. The pieces of existing infrastructure are primarily within the urban core, with limited solutions providing access to the northern or southern portions of the town. There is no complete designated north-south or east-west cycling route through the urban core today.
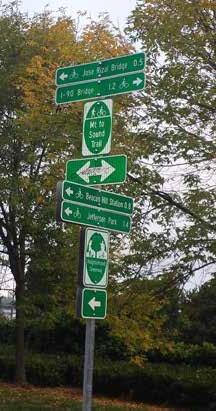
The primary wayfinding infrastructure throughout the city is for routes that are part of the Franklin County Bikeway which is a county-wide regional bicycle network. The routes are marked with wayfinding
signs intended to identify preferred routes for cycling throughout the county. In Greenfield, these routes require the cyclist to ride primarily within the flow of traffic, but a portion of a route does utilize the existing off-road Riverside Greenway. These routes may not be suitable for novice or less experienced cyclists due to steep sections as well as the lack of continuous separated cycling infrastructure.
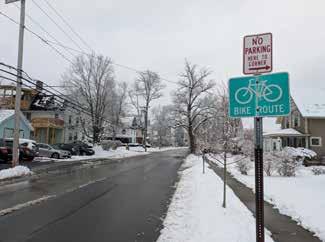
By Brian Burke

When reviewing the bicycle-related incidents from 2020-2025 throughout the city, it becomes clear that the existing infrastructure is not effective in keeping cyclists safe while biking on high-traffic streets. Silver Street, running east-west in the northern part of the urban core, has a painted bike lane, but is documented as a highincident area. Also, Federal Street is the primary north-south cycling route today, but as it accounts for 29% of all incidents in this five year period, the painted bike lane within the roadway is not sufficient for creating safe biking conditions.
Roadways located outside of the urban core have not recorded any bicycle-related incidents within the past five years. Based on this data, these corridors may represent lower priority locations for immediate bicycle infrastructure improvements, as current conditions do not indicate a significant history of bicycle-related safety concerns. It is also possible that cyclists avoid these routes as they do not think they are safe based on current conditions.
Vision Zero is a road safety strategy with the goal of eliminating all traffic fatalities and severe injuries, while increasing safe and equitable mobility for everyone. Originating in Sweden in 1997, Vision Zero states that crashes are the result of system failures that can be addressed through policy and design. The principles of Vision Zero can be applied to communities of all sizes to ensure safer outcomes. In the ten years since adopting a Vision Zero plan, New York City has seen a 31% reduction in traffic fatalities, with 2025 having the lowest number of deaths in the city’s recorded history.
Key Principles:
Safety is more important than speed or convenience. Focus on designing safer roads, lowering speeds, and increasing education.
Humans make mistakes. Roads should be designed so these mistakes don’t result in death or serious injury. Policy makers, engineers, and road users all play a role in ensuring safe outcomes.
Safe system design:
↳ Redesign intersections and crosswalks with traffic-calming measures
↳ Expand bike and pedestrian infrastructure
↳ Use data to identify and address high-risk areas
↳ Enforce traffic laws (e.g., speed cameras, crosswalk ticketing)
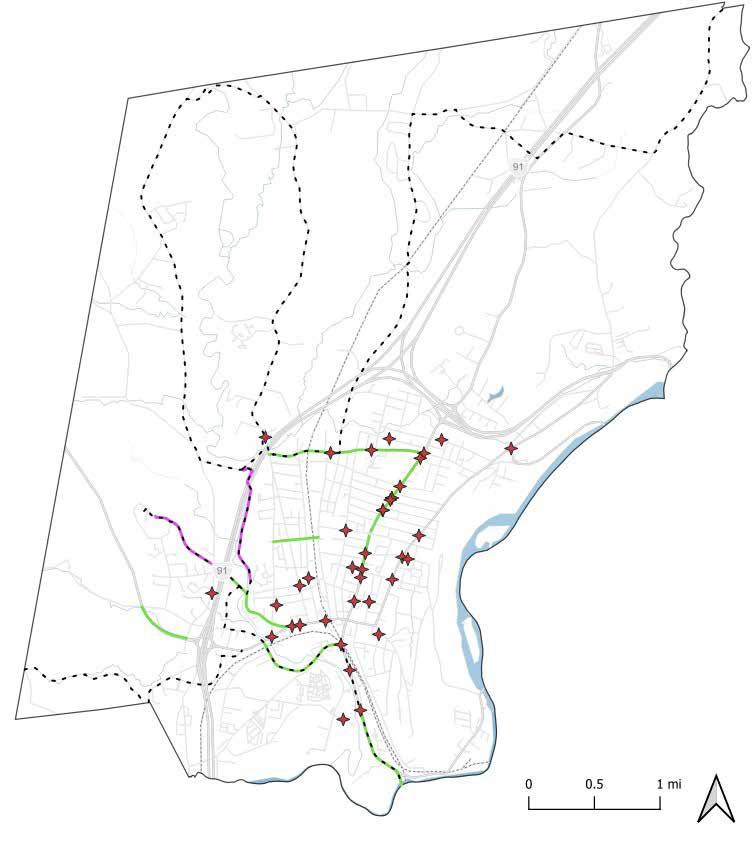
Bike-Related Incident Locations (over Existing Bike-Related Infrastructure by Type)
From 2020-2025, there were 41 vehicular incidents involving a cyclist that were reported to MassDOT.
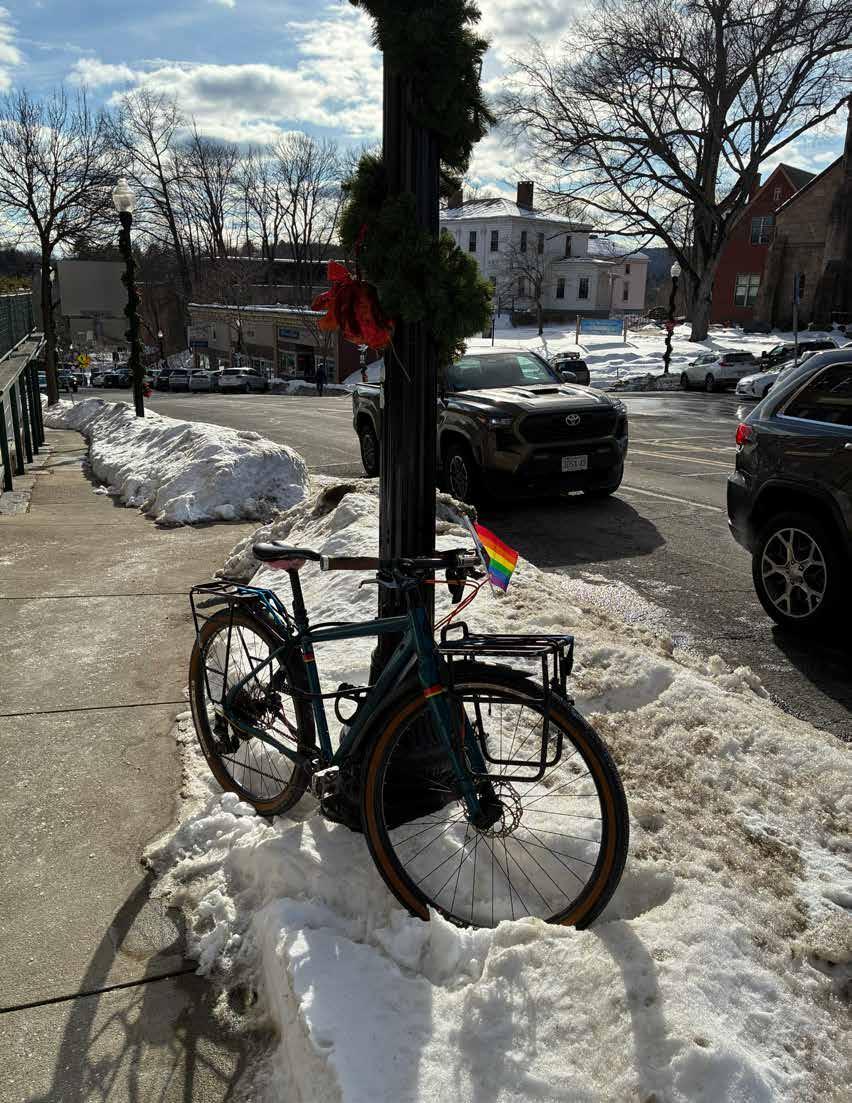
Greenfield has a population of approximately 17,500 residents. Census data from the last fifteen years indicates that the city’s population has remained relatively stable, with projection trends suggesting a slight annual decline. In response, the City has identified attracting and retaining families in the community as a priority, with strategies focused on increasing the availability of affordable housing and improving neighborhood connectivity and accessibility.
The City has also identified reducing greenhouse gas emissions as a key objective. The Sustainable Greenfield Master Plan emphasizes the importance of strengthening connections between the John W. Olver Transit Center, the sidewalk network, and bicycle infrastructure. By improving multimodal connectivity, the plan notes that Greenfield can reduce traffic congestion, fuel consumption, and vehicle emissions while improving safety, equity, and long-term transportation system sustainability.
To support these goals, an analysis was completed to better understand the community of Greenfield—who its residents are, where they live and travel, and the primary barriers they face in accessing safe and convenient cycling. This analysis (shared in the following section) integrates demographics, land use, and other existing conditions to identify gaps in infrastructure, equity challenges, and patterns of mobility.


Greenfield contains several zoning designations that collectively form the framework guiding land use throughout the city. The municipality is bisected by the major transportation corridors of Interstate 91 (I-91) and Massachusetts Route 2, which function as primary physical and transportation boundaries that divide the city into two broad geographic areas: an urban core and surrounding rural zones.
The urban core is generally defined as the area contained south of the highway network formed by I-91 and Route 2. This area accommodates the majority of the city’s commercial activity and higher-density residential districts and contains a majority of Greenfield’s population. The close proximity of high-density residential areas to commercial districts presents an opportunity to strengthen bicycle connectivity between residential streets and nearby commercial destinations.
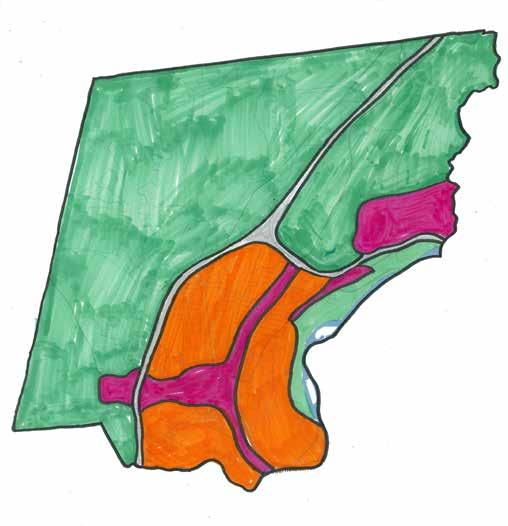
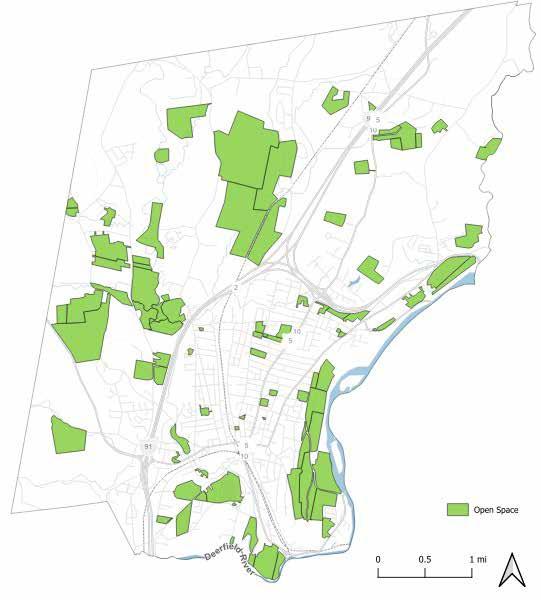
The City contains more than 500 acres of parkland, including 14 municipal parks and 6 school playgrounds located within approximately 1.5 miles of the center of the urban core. Within the urban core, the majority of publicly accessible green space is concentrated in the southeastern portion of the area, resulting in an uneven spatial distribution of parks and open space resources.
West of Interstate 91, much of the open space in the more rural portions of the community consists of farmland protected under the Massachusetts Agricultural Preservation Restriction Program. These Agricultural Preservation Restriction (APR) lands are permanently restricted from non-agricultural development and are maintained for farming and related agricultural uses. Although these are not necessarily destinations to bike to, they contribute to the scenic beauty that cyclists may appreciate. Documented Open Space Locations
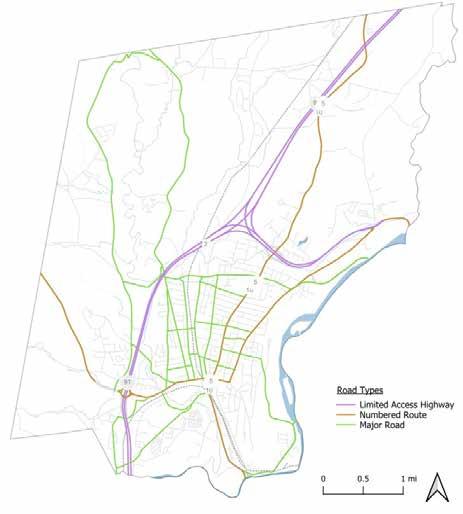
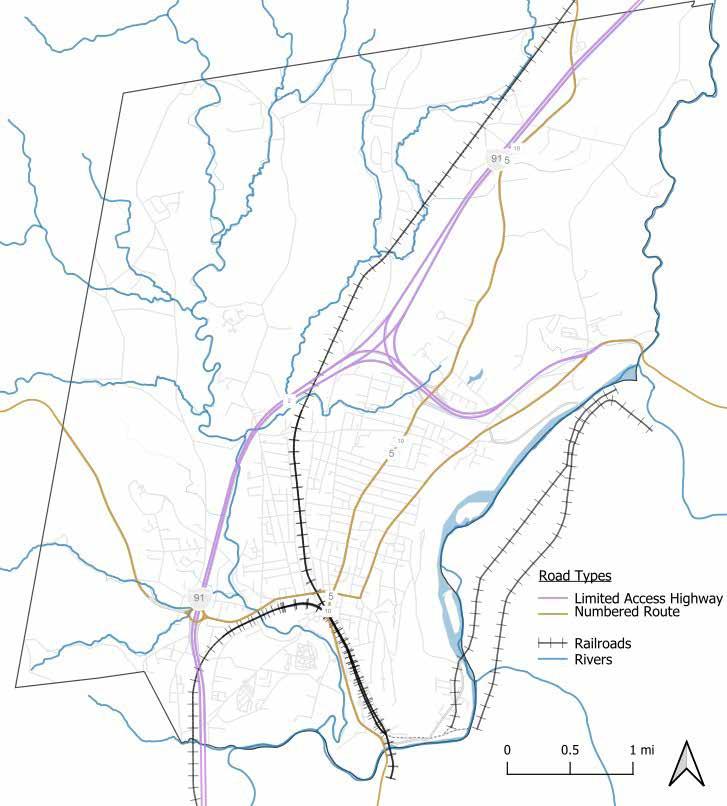
The City of Greenfield’s roadway network consists of a hierarchy of highways, numbered routes, major roads, and minor local roads that structure both local and regional travel. Major corridors carry higher traffic volumes and vehicle speeds, which can present challenges for cyclists and may require dedicated bicycle infrastructure to improve safety and comfort. In contrast, many local residential streets have lower traffic volumes and speeds and may provide opportunities for lower-stress bicycle routes. Major facilities such as Interstate 91 and Massachusetts Route 2, along with large intersections, can also create barriers that limit connectivity between neighborhoods, highlighting the need for improved crossings and bicycle accommodations along key corridors.
Within the urban core, Greenfield benefits from a largely gridded street network. This pattern provides multiple route options for cyclists, allowing riders to select parallel streets with lower traffic volumes and calmer conditions. Grid networks also support walkability and multi modal transportation by enabling bicycle routes to connect more easily with sidewalks, transit stops, parks, schools, and commercial areas. Major Roads and Highways by Type
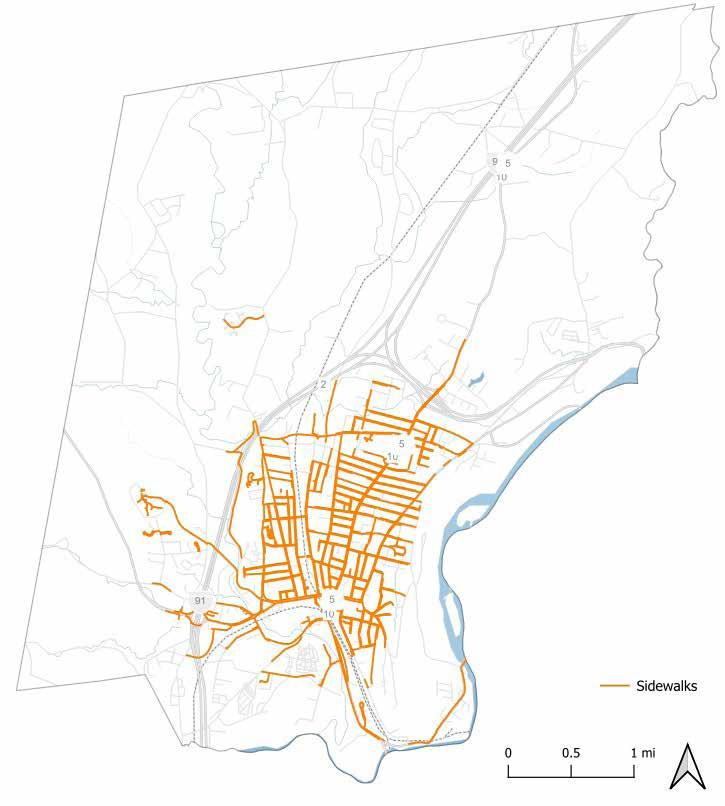
The City of Greenfield has a 78 mile network of sidewalks that is frequently maintained. The city has replaced roughly 10% of total sidewalk mileage since 2018, including 4,000 feet in 2025 alone. Within the urban core, the network is largely continuous and provides broad pedestrian coverage without significantly isolating individual neighborhoods or sections of the city. In contrast, sidewalk infrastructure is limited in the more rural areas located beyond the major highway corridors.
In some locations, sidewalks may also accommodate bicycle travel where permitted. In areas not zoned for commercial use, cycling on sidewalks is generally allowed, providing an additional option for cyclists where on-road bicycle infrastructure may be limited.
Assumed and Community-Identified Primary Destinations


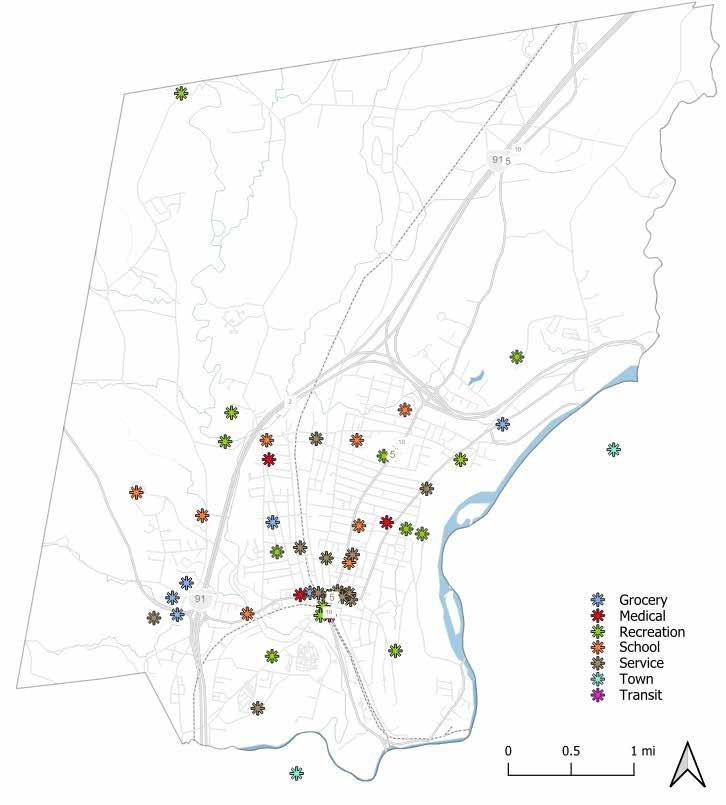
The City of Greenfield contains a number of public facilities and community services that serve as key destinations for residents and regional neighbors. These include six public schools, the John W. Olver Transit Center, the Greenfield Public Library, Baystate Franklin Medical Center, and a plethora of local recreational green spaces. In addition to providing essential services, these locations play an important role in shaping travel patterns throughout the city.
According to the Greenfield Open Space and Recreation Plan (OSRP 2021), healthcare and educational services represent the largest employment sectors in the city, accounting for approximately 30% of total employment. As a result, these institutions are important considerations when evaluating transportation and bicycle connectivity.
Community input gathered during the Conway students’ community bicycle planning meeting on February 17th, 2026 helped confirm these locations as primary destinations for residents traveling by bicycle. Participants also identified additional civic, recreational, and commercial destinations they would like to access by bike, helping to inform priorities for improving connectivity and expanding the city’s bicycle network. A majority of these primary destinations are conveniently located within the urban core in close proximity to each other, so there is great opportunity to reduce vehicular traffic downtown if cycling activity increases.
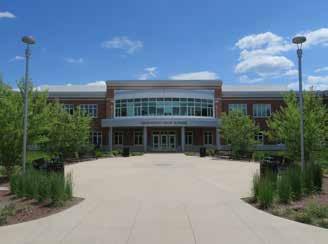
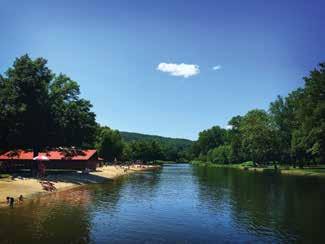
Movement throughout the City of Greenfield is influenced by several significant physical and transportation features. Interstate 91 and Massachusetts Route 2 bisect the community, creating a major division between the urban core and the surrounding rural areas. These corridors provide important regional vehicular connectivity but can present challenges for pedestrian and bicycle travel between areas of the city, particularly where crossing opportunities are limited.
Within the urban core, several heavily trafficked arterial roads further divide neighborhoods, which can limit connectivity for non-motorized users and contribute to localized barriers to movement. An active rail corridor also runs through the center of the city. In the downtown area, the southern portion of the rail line is located below ground, allowing for street crossings above. North of downtown, the rail line is at grade, which results in fewer crossing opportunities and can create additional barriers for east–west travel.
Greenfield is located at the confluence of the Connecticut River and Green River, as well as the Green River and Deerfield River. While these waterways are defining natural features of the region, they also present physical constraints that limit direct connections to nearby communities such as Turners Falls and Deerfield. Crossing these rivers typically requires major bridge infrastructure, which can present cost and feasibility challenges for expanding transportation connectivity.
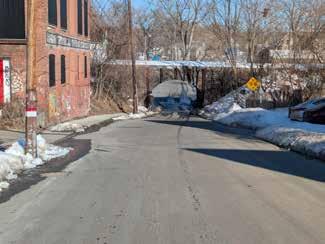
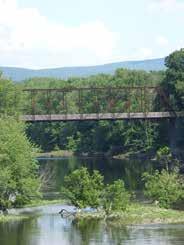
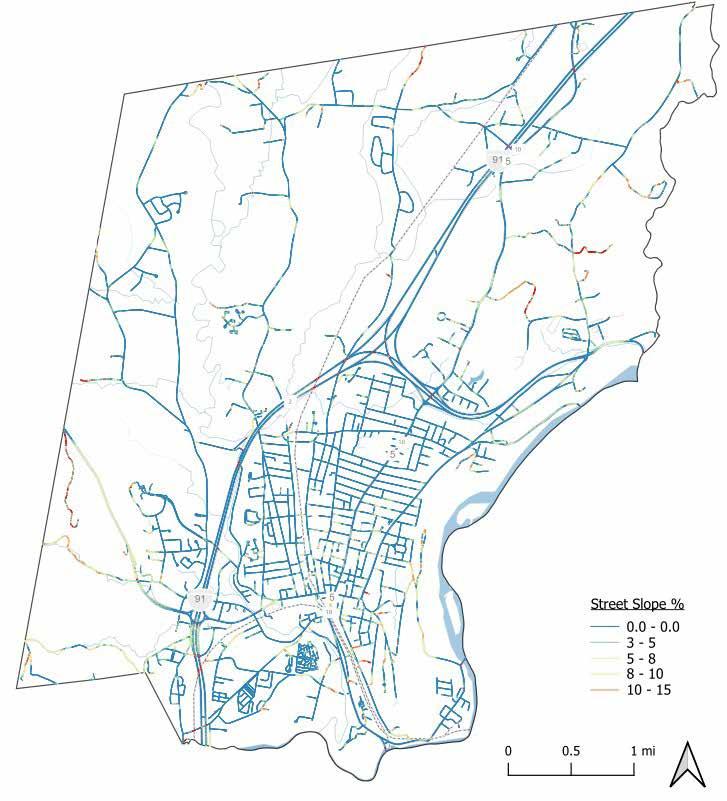
Streets Categorized by Slope %
* Overpasses, underpasses, and ends of roads will show as >15% slope due to data inconsistencies.
By analyzing the grade changes along roadways in ten-foot segments, the slope of a street can be mapped. This shows that streets throughout the city are quite flat. Most of the roadways within the urban core are less than 3% slope, with few short segments around 3-8% slope. Moving outside of the urban core, steeper slopes are seen on the east side of the city when entering Rocky Mountain Park. Connecting roads to the northeast and southwest corners of the city also have steeper and steadier slopes.
When assessing slope for cycling comfortability, the grade of the slope and the length of the slope are important factors. While flat roads are ideal, short steep slopes can be acceptable by a general cyclist given that there is space to speed up before climbing up and to slow down after a descent. Extended sections of a moderate (3-4%) slope can become challenging depending on the distance of the continuous slope. 5-6% slope would require a climb, and above 6% can become strenuous.
The slopes throughout the urban core of Greenfield are, for the most part, easily bikeable, with a few short areas of a steeper slope to navigate. Many routes leading out of the urban core require portions of longer climbs with a few steeper sections. Proposed bike routes should avoid steep areas where possible.
The American Public Health Association defines Environmental Justice as the principle that all people and communities have the right to live and thrive in safe, healthy environments, with equal environmental protections and meaningful participation in decisions that affect them. Ensuring that these historically underserved communities are included in conversations about bicycle planning in the city is essential to creating equitable and accessible mobility options for all residents.
About 20% of Greenfield’s residents live within designated Environmental Justice (EJ) block groups. These EJ areas are primarily located within the city’s urban core, generally bounded by Interstate 91 and Route 2. Environmental Justice designation in these areas is based on two primary criteria. The first includes block groups where the median household income is at or below 65% of the statewide median income (shown in purple on the map). The second includes block groups that meet the same income threshold and also have a minority population that is greater than or equal to 40% (shown in green on the map).
It is also notable that three of Greenfield’s four affordable housing neighborhoods are located within Environmental Justice block groups. Seeing that the highest concentration of affordable housing is within the urban core shows an area of priority and opportunity when considering future bicycle infrastructure investment.

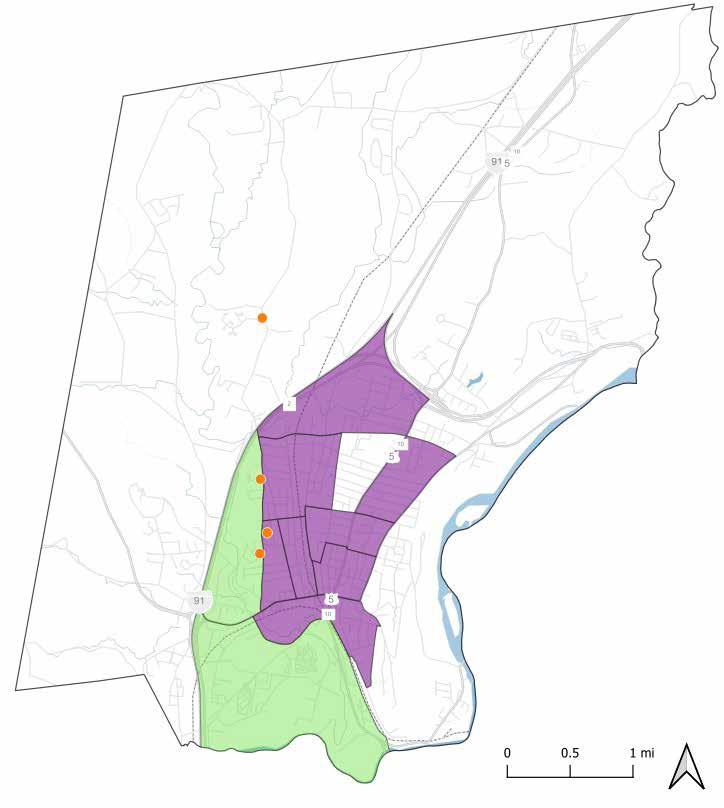
Environmental Justice Blocks by Type
Greenfield has a population of approximately 17,500 residents, with the majority living within the city’s urban core. Located largely within the boundaries formed by Interstate 91 and Route 2, the urban core contains approximately 46% of the city’s total population.
In contrast, areas outside these major transportation corridors are more rural in character and have lower population densities, with residents distributed across a larger land area. While nearly half of Greenfield’s population resides in the urban core, this area represents only about 8% of the city’s total land area.
This concentration of residents highlights the importance of prioritizing transportation connectivity within the urban core. Targeted improvements to pedestrian and bicycle infrastructure in this area have the potential to serve a large portion of the city’s population.
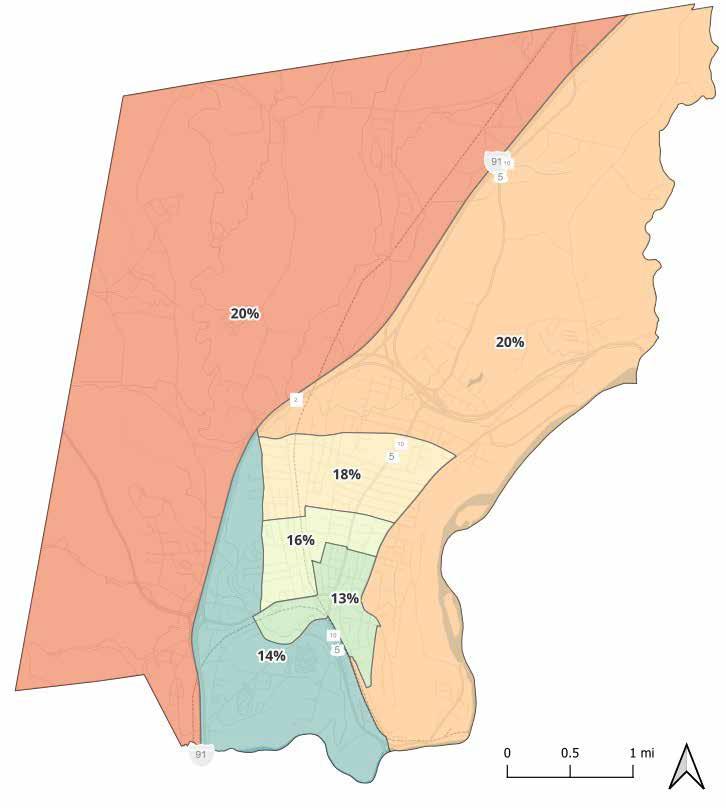
% of Population Within Each Census Tract
The City of Greenfield is served by a modern transit hub and an established regional bus network. The John W. Olver Transit Center is located just south of Main Street in the downtown area and serves as the primary public transportation facility for the region. The center is a modern, energy-efficient facility designed as a net-zero building and also houses the Franklin Regional Council of Governments (FRCOG) offices.
The transit center provides access to a county wide network of fixed, fare-free bus routes as well as regional passenger rail service. Both bus and rail services accommodate bicycles, allowing riders to integrate cycling with regional transit travel. However, many bus routes operate hourly which is inconvenient for daily commuting within the city. Expanding bicycle infrastructure could better serve the community with a flexible alternative for daily commutes.
While Greenfield currently does not have a bike share program, several other municipalities in the region, such as Amherst and Northampton, have implemented similar systems, suggesting that such a program could be a feasible addition in the future.
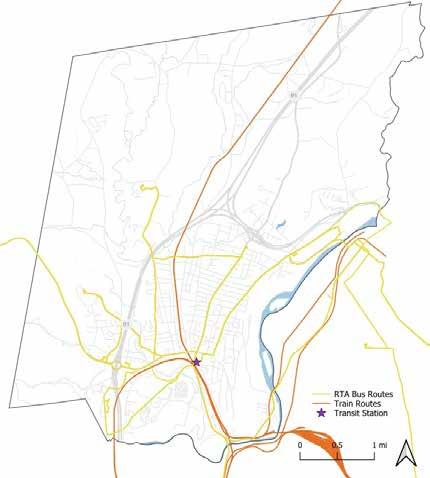
Despite the presence of a robust transit network, less than 1% of Greenfield residents currently commute using public transportation, compared to a statewide average of approximately 7%. Improving bicycle connectivity between residential neighborhoods and downtown could help increase access to the transit center and encourage greater use of regional transit services. Strengthening these connections would support multi modal travel and expand transportation options for residents traveling within Greenfield and throughout the surrounding region.
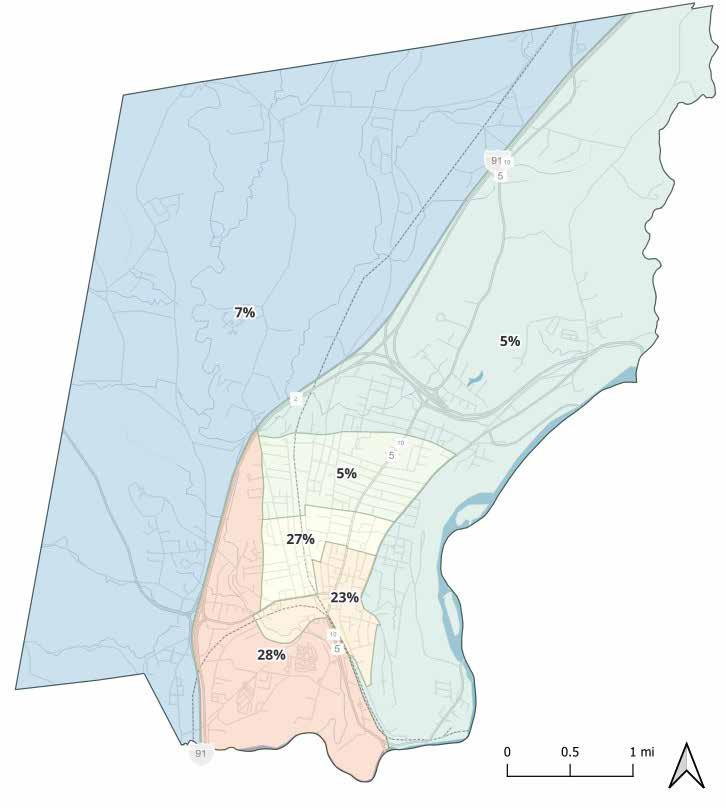
% of All Households That Do Not Have Access to a Vehicle Within Each Census Tract
The City of Greenfield has identified a notable share of households that do not have access to a vehicle. Approximately 15% of households in the city—roughly 1,200 households—do not have access to a car. A similar rate is observed in the nearby community of Turners Falls. This figure is higher than the Massachusetts county average, which is approximately 10%.
Households without vehicle access are most heavily concentrated within Greenfield’s urban core. In this section of the city, 18% of all households do not have access to a vehicle (which makes up 58% of the total households without a vehicle). This concentration highlights the importance of maintaining and improving transportation options that do not rely on vehicles.
The affordable housing development at Leyden Woods has also been identified as an area of concern regarding vehicle access. The site is physically separated from the city’s urban core by major highways, which can limit connectivity to key services and destinations.
Given these conditions, many residents rely on alternative forms of transportation. Improving bicycle infrastructure and strengthening connections to public transportation hubs and primary destinations will be important steps toward supporting mobility for residents without reliable access to a vehicle.
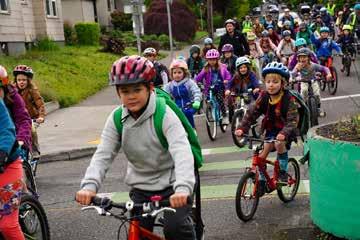
School-aged children represent another population that may rely on getting around without a car, particularly for daily travel to and from school. The Franklin Regional Council of Governments Regional Transportation Plan highlights the Massachusetts Safe Routes to School Program, a statewide initiative that supports communities and schools in improving conditions for walking and cycling. Through this program, participating schools can receive assistance to enhance bicycle and pedestrian infrastructure within approximately two miles of the school, helping to create safer and more accessible routes for students.
To gain a better understanding of cycling in Greenfield, data and feedback were collected directly from the community. Methods of information gathering included a public meeting facilitated by the Conway team as well as an online survey accessed via a QR code on a printed flyer that was distributed throughout the city. Through this process, participants shared insight into their current cycling habits, such as primary destinations, preferred routes, and streets avoided.
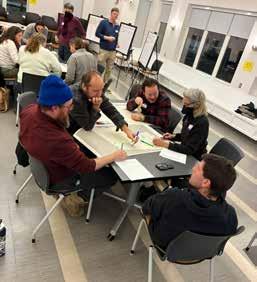
On February 17, 2026, Conway students held a public meeting at the Jon Zon Community Center in Greenfield. The objective of the meeting was to identify the community’s priority routes, primary destinations, and any existing safety concerns. Eighteen participants were in attendance to discuss potential enhancements to the local cycling infrastructure. Upon arrival at the meeting, participants were invited to vote on a series of questions designed to evaluate the group’s broad preferences. From this exercise, it was noted that participants expressed a strong interest in increased safety and connectivity, with dedicated bike lanes to the downtown area.
For the 90-minute meeting, attendees were divided into small groups for a series of breakout activities based around three questions key to the project:
1. What are your likes and dislikes around cycling in Greenfield?
2. What are your primary destinations and your preferred cycling routes?
3. Where are your safety concern areas and priority infrastructure improvement locations?
After the prompt of each question, participants were asked to write down their answers individually before discussing in a small group. A large map of Greenfield was placed on each table so responses could be recorded graphically as well. The Conway team rotated between groups, facilitating conversation and ensuring all participants had a chance to speak. One note taker at each table was tasked with recording their group’s feedback. Following the small group discussions, each note taker shared their group’s top responses with the room, prompting a wider discussion.
The Conway team collected maps and notes at the end of the session. Information related to physical locations was later plotted on GIS layers, creating maps that depict the preferred cycling routes as well as areas of conflict (see “Social Inputs Overlay” maps on page 49). These community-generated maps will help guide the process of creating a comprehensive cycling network for Greenfield. While the data gathered was informative, the team acknowledges the limitations of a small and primarily adult focus group.
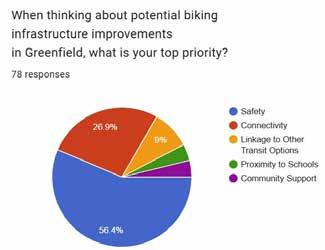
What are your TOP TWO priorities when it comes to bike infrastructure enhancements?
↳ Safety (13)
↳ Connectivity (13)
↳ Linkage to Other Transit Options (3)
↳ Connections/Proximity to Schools (4)
What TWO facility enhancements would be most beneficial for you?
↳ Dedicated bike lanes downtown (12)
↳ Enhanced connectivity across neighborhoods (6)
↳ Bike repair facilities (0)
↳ Bike racks (4)
↳ Wayfinding signage (0)
↳ Connectivity to other towns (5)
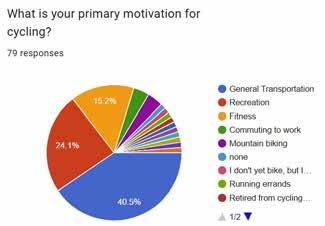
What is your primary motivation for cycling?
↳ General Transportation (10)
↳ Recreation (4)
↳ Fitness (1)
↳ Commuting (2)
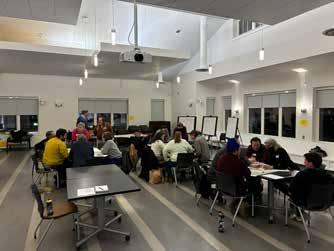
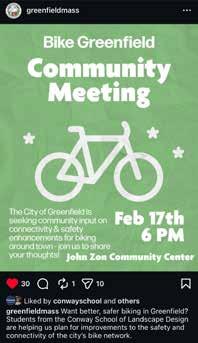
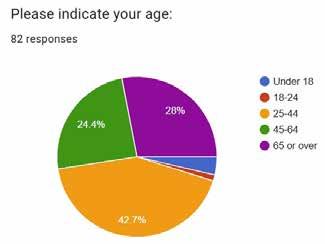
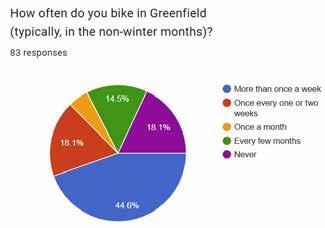
In conjunction with the community meeting, an online survey was created to collect additional input. A flyer for the survey was widely distributed throughout town at locations such as the library, transit center, Greenfield Community College, and local coffee shops. Links to the survey were shared on social media by the City of Greenfield and the Conway School. As of April 2026, the survey had 85 respondents.
Results indicate that a majority of respondents currently feel unsafe riding a bike in Greenfield. Eighty percent stated they would bike more frequently with enhancements to the city’s bike infrastructure. While most of the survey questions were multiple choice, respondents were also given the opportunity to elaborate on their answers in open-ended prompts, such as “Are there particular streets you wish were more enjoyable to bike on? Or particular locations you wish were easier to travel between on bike? Much like with the feedback from the community meeting, these specific responses serve as useful data points for refining the scope of the project.
To ensure that community input was an ongoing part of the analysis, Conway students conducted informal engagement sessions on the streets of Greenfield. Interviews were held with the owners of three local bike shops as well as several community members observed riding bikes in town. Their insights were noted and serve to inform recommendations. The quotations below highlight a few themes: more bike infrastructure is desired by the community, safety is a concern, and engaging with the youth could help support a cycling culture.
“If you want young families to move to town, you need to make it safe & easy for kids to get around town.”
“... anywhere you bike in Greenfield you need to have a plan to avoid spots with no safe way to navigate and get through safely.”
“Not a complete streets mindset (by the drivers).”
“You don’t get adults biking if they didn’t bike as kids.”
“More bike infrastructure and more folks biking makes it better for all of us!”
“I put my bike on my car just to drive somewhere else to do it, which feels stupid”
Strava is the world’s top fitness tracking app, with 180 million users worldwide and 50 million users in the U.S. Every week, hundreds of Greenfield residents use Strava to record their walks, runs, and bike rides. Strava’s user-generated activity heatmap identifies routes most frequently used over time, and is an emerging tool that can be used to identify established cycling patterns. This publicly-shared data objectively identifies popular routes, streets of low use, and unseen “habit trails.”
After limiting results to cycling activity only, Strava’s heatmap of Greenfield indicates high activity in the business areas on Main, High, and Federal. Silver Street is a high-use east to west cycling route across town.
Centrally-located Davis Street, running north to south between Silver and Main, shows a rate of use higher than nearby streets. A high activity route is not necessarily the safest or most comfortable to ride. Further analysis is required to understand why these routes are popular.
The Strava heatmap is also useful for identifying neighborhood patterns of use, such as shortcuts and trail connectors, which do not appear on traditional maps. These overlooked segments may provide meaningful links in a future cycling infrastructure network. While the broad patterns show a reliance on Greenfield’s gridlike road network, smaller details may be useful in locating potential efficiencies. One popular shortcut follows the eastern edge of Beacon Field between Beacon Street and Sanderson Street. This off-road segment extends south on a trail between Maple Street and Spring Terrace. In total, the unofficial route is a half mile long, and serves as an alternate route to High Street.
Other heatmap patterns point to network deficiencies. Data shows cyclists and pedestrians crossing the train tracks at Cleveland Street. A private driveway through an apartment complex south of Arch Street is frequently used to connect Conway Street to Wells Street. Providing safe, intuitive alternatives may lead to increased use of the bike network.
While Strava’s data layer provides insight into how roads are used by cyclists, it’s important to note that Strava users make up a small percentage of the local cycling community. The riding habits of children riding to school and lower-income residents are unlikely to be represented by the heatmap.
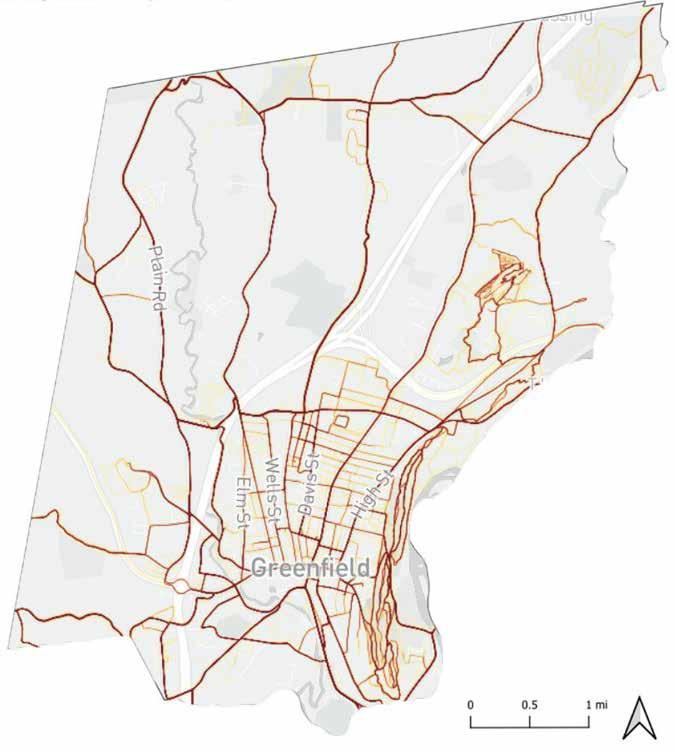
Documented Strava usage of “All Cycle Sports.”
Darker lines are more frequented routes. Data accessed on 3/26/26. Time period of Strava data is unknown.
The previous work of many organizations and individuals has informed this project. As Greenfield aims to create a comprehensive cycling network that meets the diverse needs of the public, an examination of previous work ensures past plans get renewed attention.
In 2017, the City of Greenfield created the Complete Streets Prioritization Plan (CSPP) to apply for MassDOT grant funding made available for bike and pedestrian infrastructure improvements. The CSPP-identified projects were initially proposed in community forums over a six-month period in 2016. From a list of more than 100 suggested projects, 33 were related to bike infrastructure. Potential projects were then scored on their alignment with six goals:
↳ Safety: Project provides a significant safety improvement for all users.
↳ Connectivity: Project improves connections to existing sidewalks, trails, bike lanes, residential neighborhoods, and downtown.
↳ Transit Linkage: Project provides a link to transit centers or bus stops.
↳ Impact to Vehicular and Freight Operations: Project does not seriously limit roadway access for vehicles and trucks.
↳ Proximity to Schools: Project lies within one quarter mile of a school.
↳ Community Support: Project is supported at a public forum.
From this evaluation process, 15 priority projects were identified as being highly likely to receive grant funding. Ten of these proposed projects were bike infrastructure enhancements. As of March 2026, four of these projects have been completed (see “Complete Streets Prioritized Project List” in Appendix).
Greenfield updated its Open Space and Recreation Plan (OSRP) in 2021. Among the recommendations was the prioritization of safer roads and sidewalks for cyclists and pedestrians. The OSRP recommends creating bike routes that connect to parks and open space areas, and cites the need for trail connections between neighborhoods and natural areas. Supplementary recommendations include improved wayfinding signs and adding secure bike racks at parks and trailheads.
The most recent Regional Transportation Plan (RTP) cites the need to establish transportation infrastructure that reduces greenhouse gas emissions, with a focus on opportunities for everyday cycling. The plan highlights the importance of considering cyclists of all ages, with a focus on identifying safe routes to schools. The RTP proposes several bikeway projects specific to Greenfield, including an off-road path south of the Cheapside Bridge and the Meade Street Bike Path, which would convert a city-owned dirt road to a future link in the riverfront path network. The plan calls for research into off-road alternatives to Turners Falls Road as a bike connection between Greenfield and Turners Falls.
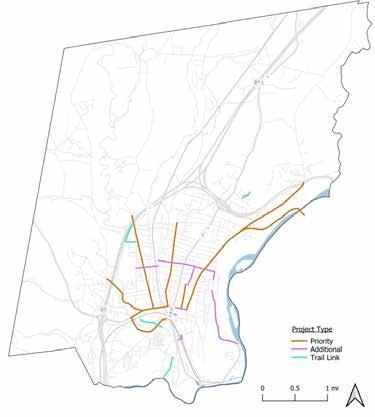


After reviewing the existing bike infrastructure conditions in the city, in addition to hearing from the community, it is clear that infrastructure within Greenfield does not accommodate safe cycling. The lack of bike infrastructure throughout the city and to neighboring towns has made it difficult for cyclists to navigate the city safely. Increased infrastructure and clear bike routes that prioritize cyclists can help in increasing the safety and comfortability for cyclists throughout the city and may help encourage the use of bikes by all age groups.
In order to identify the best routes for a cycling network around the city, the Conway team developed a review process that encompasses the data sets from the analysis. This process analyzes a bike route for safety and comfortability for cyclists based on the current physical conditions on the road, incorporates social overlays to understand community impact of the route, and concludes with a suggested process for conducting a feasibility review of the route. The output from this process is an analysis of routes (“informed routes”) as well as areas identified for infrastructure improvement projects. While this project’s scope concludes there, this output can be used by the city to inform further concept development to understand which infrastructure solutions are best suited for the identified routes (see “Concept Development” on page 53).
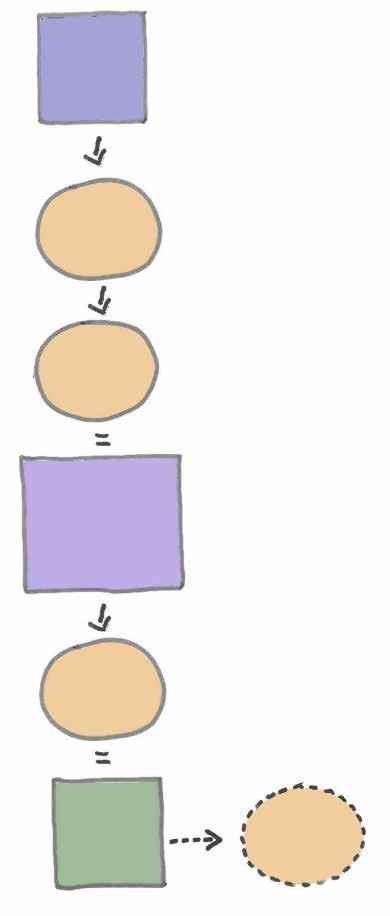
The goal of the physical conditions model is to evaluate street conditions to quantify safety and comfortability of biking on a particular route.
Across the world, different models have been developed to evaluate the cycling conditions of shared roadway environments. The Conway team reviewed the following prominent precedents to understand their applicability to the project.
↳ Bike Level of Service (BLOS): A formula that evaluates a cyclist’s perceived safety and comfort on a roadway, resulting in a score from A to F (A=best, F=worst). Key inputs include vehicle traffic volume, speed, percentage of heavy vehicles, pavement condition, and lane/shoulder width. This is a widely accepted model.
↳ Levels of Traffic Stress (LTS): A set of criteria in which road segments, intersection approaches, and intersection crossings can be classified into four levels of traffic stress (LTS), 1 being lowest stress and 4 being the highest. LTS 2 is considered the level of stress most cyclists will tolerate. For a cycling network to attract a broader population, a critical attribute is low-stress connectivity. LTS evaluates routes between people’s origins and destinations that do not require cyclists to exceed their tolerance for traffic stress or require a substantial level of detour.
Note: These models assume that cycling will occur in the roadway, not on an off-road bike path.
After reviewing existing model precedents, the team chose to proceed with a custom model that is better suited to the goals of the project and incorporates datasets that are available through the Massachusetts Department of Transportation (MassDOT) and MassGIS. This model includes:
↳ Slope: The steepness and length of a slope can significantly impact the bikeability of a roadway. Other models did not incorporate the slope of a roadway into their analysis, but slope is critical to the comfortability and feasibility of a route for any cyclist.
↳ Speed Limit: Without access to prevailing speed data, the model relies on the posted speed limits of a road. The understanding here is the slower the traffic, the safer it is for a cyclist to be in the roadway.
↳ Surface Road Width: Typically, the narrower the road, the less safe it would be for cyclists as they are forced to move with vehicular traffic, but multiple other factors play into the impact of road width. The model ties the road width to the speed limit with the understanding that any sized road with a slow speed limit is safer than one with a high speed limit.
↳ Traffic Count: Collected as Annual Average Daily Vehicles (AADV), this traffic count represents how busy and frequently used a roadway is by vehicles. Lower traffic counts on a road makes it safer and more comfortable for a cyclist to be in the roadway.
With these four inputs, scores for a roadway are calculated using existing conditions data and summed to receive a total score between zero and three. The lower the resulting score, the safer and more comfortable it is to bike on that road as it is today. A resulting low score helps in identifying roadways that could be ideal bike route options without requiring significant infrastructure enhancements, while high score roadways are to be avoided by cyclists or improved with infrastructure (e.g., off-road bike path).
When applying the custom physical conditions model to the entire city, interesting patterns emerge. Looking at the resulting scores as a heatmap, it becomes clear that the low speed/low volume residential roads throughout the urban core have low model scores, suggesting that they have safer cycling conditions today. The high speed/high volume roads primarily utilized by vehicles are highlighted as less safe under current conditions. This model helps inform both the recommended network of cycling routes and highlights areas either to avoid or to make significant infrastructure improvements to for cyclists if deemed critical to the network.
Road Width x
Speed Limit
ft: 1
<=25 MPH: 0
26-35 MPH: 0.5
>35 MPH: 1
0
Traffic Count (AADV)
Summed Score: 0-3
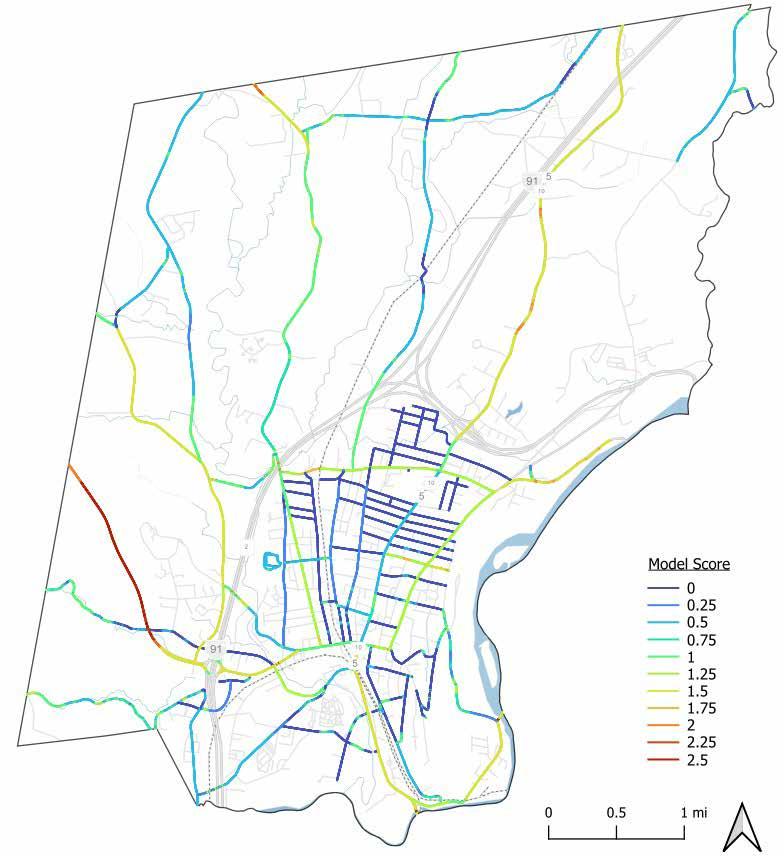
Physical Conditions Model Output
*Criteria applied to ten-foot road segments
After quantifying the physical conditions of a route, the analysis continues with applying two rounds of “social overlays” to better understand the community impact of any given route.
The Conway team identified three primary social datasets to overlay onto the physical conditions model (see “Social Conditions” analysis starting on page 26). These utilize 2020 census data:
↳ Population Density: Identifying which routes serve a high portion of the population.
↳ Environmental Justice Populations: Identifying which routes serve the EJ communities with the understanding that EJ populations have been subjected to historic underinvestment and could benefit from alternate transportation solutions.
↳ Households Vehicle Access: Identifying which routes serve the households that do not have access to a vehicle. These communities must rely on other forms of transportation, so bike routes that serve these populations would be most beneficial.
Community feedback has been mapped to ensure that the proposed bike routes lead to where people actually want to go. This mapping effort resulted in three primary overlays:
↳ Primary Destinations: The community provided a list of frequently visited sites, including schools, grocery stores, service locations, medical facilities, recreation destinations, neighboring towns, and the transit center. (see map on page 20)
↳ Priority Routes: The community meeting yielded maps of the primary routes residents use to get around town, especially when on a bike. This helps in understanding the current habits and preferred routes based on road conditions.
↳ Identified Projects: The survey asked residents, “are there particular streets you wish were more enjoyable to bike on?” and results were mapped as identified projects. These results were combined with all projects identified in previous plans (e.g., Complete Streets 2017). This layer thus shows which infrastructure enhancement projects have been identified and prioritized by the community.
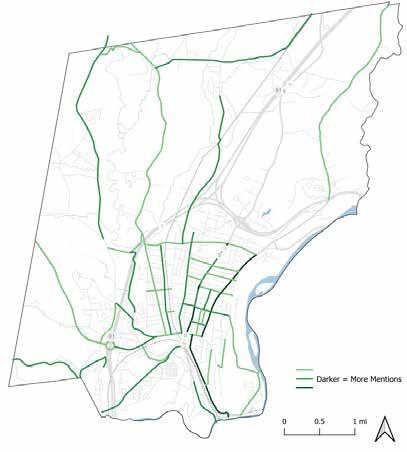
Community-Identified Priority Routes
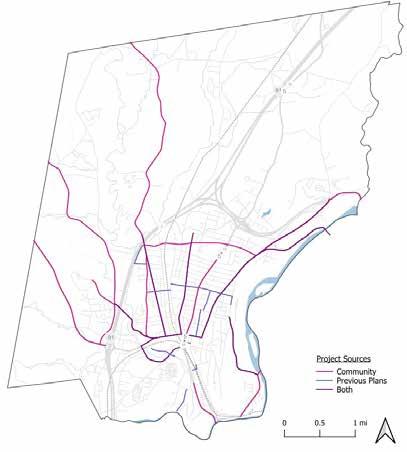
Identified Projects by Source
After scoring the existing physical conditions of a potential bike route and overlaying the various social inputs, the output is threefold:
↳ Safety & Comfortability of Existing Conditions: Analysis of the known physical conditions of a street today quantifies the experience of cycling on that road. Roads with a low score are perceived to have easier bikeability.
↳ Improvement Opportunities: Roads that result in a high score from the physical conditions model highlight areas where significant infrastructure improvements may be needed to increase bikeability. Community-identified projects areas can be used to confirm model-identified opportunity areas.
↳ Community Impact: With the goal of serving ideally all of the community, but prioritizing the communities that could benefit from bike infrastructure the most, the three social conditions overlays help in highlighting the potential positive impact of a bike route. Overlaying routes with the community’s primary destinations confirms whether or not the route leads to where residents are trying to go.
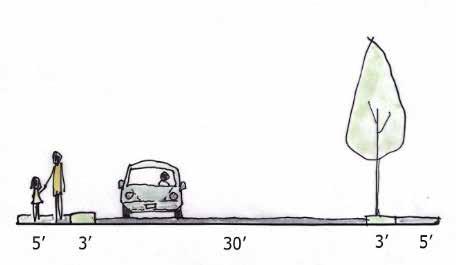
Right of Way Components (Feasibility Review Consideration)
To further assess bike routes for potential infrastructure enhancements, feasibility checks are necessary to understand what solutions are possible and realistic for a street. As different checks apply to different roads, these are not built into a repeatable tool, but instead reviewed as considerations prior to proceeding with concept development. Possible checks include:
↳ Surface Road Width Use: How many travel lanes are there? Is there parking on either side of the road (and how critical is it to preserve existing parking)? Current use of the surface width is needed to understand impact to cyclists in the roadway.
↳ Right of Way: What space is available for added infrastructure? How is the space used now? This helps identify if there is space for added infrastructure on the street as well as what may be impacted (like street trees) if the ROW space was utilized for infrastructure projects.
◊ Street Right of Way (ROW): A strip of land owned or controlled by a municipality, county, or state, dedicated for public infrastructure such as roads, sidewalks, bicycle lanes, and utilities. It can extend beyond the paved road surface to include areas for drainage, landscaping, and future improvements.
↳ Land ownership: Are there adjacent parcels of land that may be utilized for infrastructure enhancements? There may be opportunities to identify city and non-city-owned parcels that could be utilized to create linkages in bike infrastructure.
↳ Professional input: Any limitations known by the city or county governments that are not identified in the physical conditions model?
↳ Pavement schedule: Is any part of the route on a street that is to be repaved in the near future? Ideally, streetscape improvements are coordinated.
↳ Stormwater system impact: Would infrastructure development impact the stormwater system (e.g., limit or block stormwater drains)? Or, if there are planned streetscape renovations, could bike infrastructure enhancements be paired with stormwater management upgrades? Ideally, any infrastructure enhancements would limit impact to and work in tandem with stormwater infrastructure.
↳ Traffic Calming Measures: Is there physical infrastructure to slow vehicular traffic (stop lights/signs, speed bumps, street narrowing, etc.)? Slower is safer, but some traffic calming measures may also impede the smoothness of a bike route.
↳ Climate Considerations: Is there a concern of excessive heat within the roadway? Is the area prone to flooding? Existing climate concerns may limit or dictate infrastructure requirements.
All resulting recommendations for infrastructure enhancements will need to proceed into a professional concept development process. The physical conditions analysis in tandem with the feasibility review suggests which infrastructure solutions may be possible in any location along a bike route. Different levels of intervention are required in different scenarios to make a route safe for cyclists.
↳ Low Intervention: on low traffic, low speed streets (those with a low Physical Conditions Model score), limited infrastructure is required to increase the safety of cyclists within the roadway. Simple painted roadway markings and wayfinding signage may be sufficient for both the cyclists and vehicle drivers to share the roadway safely.
↳ Medium Intervention: as traffic speed and volume increases (those with a mid-range Physical Conditions Model score), higher visibility infrastructure is required to separate cyclists from the vehicular traffic and to identify their presence to drivers, like painted bike lanes and green-accented street markings.
↳ High Intervention: On high-speed, high-volume roadways (those with a high Physical Conditions Model score), safe cycling typically requires further physical separation from vehicular traffic, like buffered bike lanes or shared use paths. This may also include infrastructure that identifies cyclist-first routes, prioritizing cyclists over vehicles in the roadway.
The following pages outline infrastructure types across this intervention spectrum.
Shared use paths, also called trails, multi-use paths, or bike paths, are off-road infrastructure that are physically separated from motorized vehicle traffic and designed for use by people of all ages and abilities.
Types of shared use paths include:
↳ Rail trails, which are built on abandoned rail beds
↳ Rails with trails, which run adjacent to active rail lines
↳ Sidepaths, which run adjacent to roadways
↳ Other types including linear parks, canal towpaths, waterfront trails, and paths along utility corridors
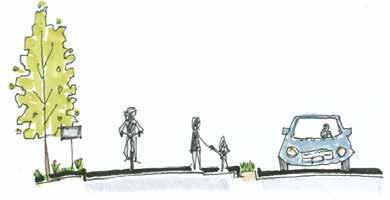
Striped bike lanes are defined as a portion of the roadway that has been designated by striping, signage, and pavement markings for the preferential or exclusive use of cyclists.
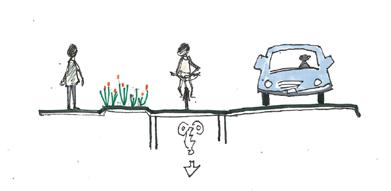
Protected bike lanes are physically separated from vehicular traffic and distinct from the sidewalk. They provide space that is intended to be exclusively or primarily used for bicycles and are separated from vehicle travel lanes, parking lanes, and sidewalks. Protected bike lanes may be one-way or two-way, and may be at street level, at sidewalk level, or at an intermediate level. Protected bike lanes are also known as cycle tracks, separated bikeways, and on-street bike paths.
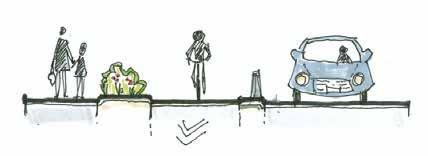
Buffered bike lanes are conventional bicycle lanes paired with a designated buffer space utilizing striping or bollards separating the bicycle lane from the adjacent vehicle travel lane and/or parking lane.
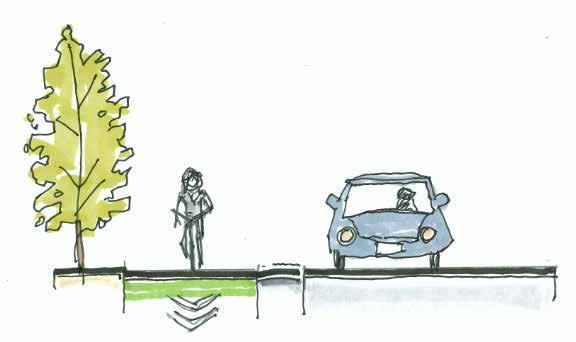
Shared Lane Markings: (“sharrows”) road markings used to indicate a shared lane environment for bicycles and vehicles. Shared lane markings are often used when road widths are too narrow for other bike infrastructure.
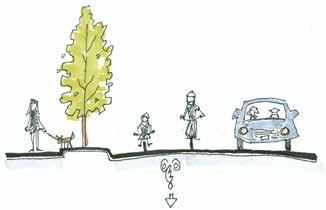
Shared Lane Markings
Bike Lane Extension Markings: Also known as crossbikes, these markings indicate a bike lane is crossing an intersecting street. The road striping assists bikes in navigating the crossing while informing drivers of the potential for cyclists to be in the roadway.
Wayfinding/Signage: Wayfinding is an important component of effective bicycle infrastructure because it helps cyclists navigate the network safely and efficiently. Clear signage, pavement markings, and maps can guide riders to key destinations such as downtown areas, schools, parks, and transit facilities while also identifying preferred bicycle routes. Effective wayfinding improves accessibility for both new and experienced riders, increases confidence in the bicycle network, and helps create a more connected and user-friendly transportation system.
Bike Boxes: A bike box is a designated area at the head of a traffic lane at a signalized intersection that provides cyclists with a safe and visible way to get ahead of queuing traffic during the red signal phase. These areas help in increasing visibility of cyclists, help reduce signal delay for cyclists, and provides priority for cyclists at signalized crossings of major streets.
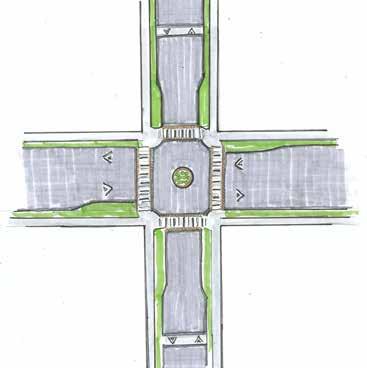
Bike Boulevards: Sometimes called neighborhood greenways. These low-speed, low-volume routes are designated and designed to give bicycle travel priority. People tend to ride near the middle of the street on bike boulevards, and they are best suited for streets with less than 3,000 vehicles per day and speed limits below 25 MPH. Bike boulevards should allow two-way bike travel, and Intersections can be enhanced using a range of design treatments tailored to existing conditions and desired outcomes.
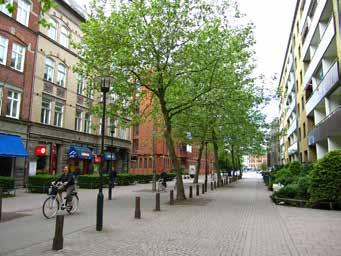
Translated as “living street,” a woonerf utilizes traffic calming devices and reduced speed limits to slow down cars and safely share street space with pedestrians and cyclists without the need for separation between cars and pedestrians. In the Netherlands, motorized traffic within woonerf zones is limited to walking speed.
Portsmouth, NH has made great progress as a bike-friendly community in the past decade. Since drafting their Complete Streets Plan in 2017, the city of 21,000 residents has gone on to implement a number of policies resulting in meaningful improvements to the local bike infrastructure network. The city has added more than 8 miles of on-road bike infrastructure, including a bike boulevard on Lincoln Street. An annual assessment of bike lanes by the transportation department ensures they are maintained and repainted as needed. Portsmouth established a quick-build program, allowing the city to make trial changes to street layouts. The program enables the city to act on recommendations and gather community feedback before major infrastructure changes. For their efforts, the city currently holds a Bronze rating by the League of American Cyclists. Multiple plans have been written to enable the continued network development, including:
↳ Bicycle and Pedestrian Plan
↳ Complete Streets Design Guidelines
↳ Bicycle Friendly Community Policy
↳ Safe Routes to School Action Plan
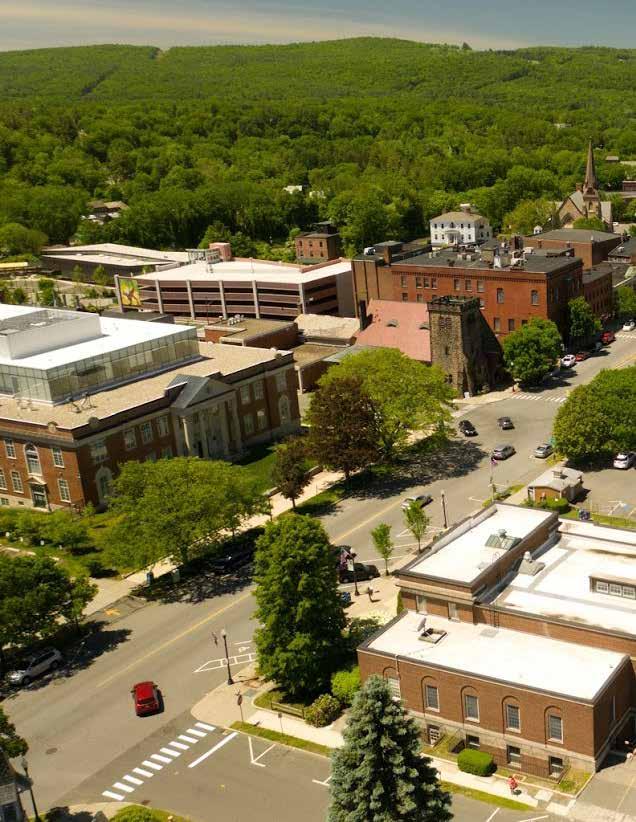
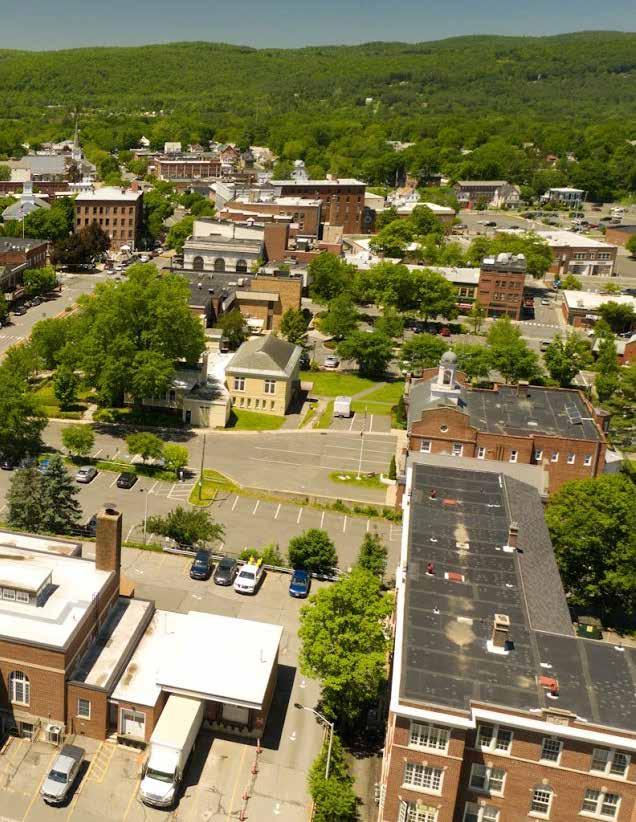
As Greenfield looks to the future, the City has identified the need to establish a network of safe, comfortable, and intuitive bike routes. These routes are designed with the user experience in mind, connecting residential neighborhoods with key destinations such as schools, parks, and shopping areas.
Bike infrastructure can be applied in various forms, including on-road painted bike lanes, shared-use paths that accommodate both cyclists and pedestrians, and road-separated cycle tracks. The choice of infrastructure type depends on physical conditions, such as traffic volume, vehicle speed, and available space.
The recommended routes are informed by a combination of research, analysis, and community feedback. This final recommendation identifies ten network segments, which if implemented will:
1. Establish a comprehensive on-street bike network
2. Improve the safety and comfortability of existing bike infrastructure
3. Expand access to the shared-use path system
Network segment recommendations fall into two categories: general transportation routes and recreational routes. Transportation routes focus on providing continuous bike routes throughout the urban core to the residents’ primary destinations with suggested on-street infrastructure and wayfinding solutions.
The recreational routes would require higher investment, off-street infrastructure solutions to extend the Greenway shared use path and could provide economic development opportunities by becoming recreational destinations.
The redesign of Main Street and the Route 2A rotary are key components to improving bike and pedestrian safety in Greenfield. Both projects are currently in the design phase, with bike facilities incorporated into the plans. As such, they are outside the scope of this report.
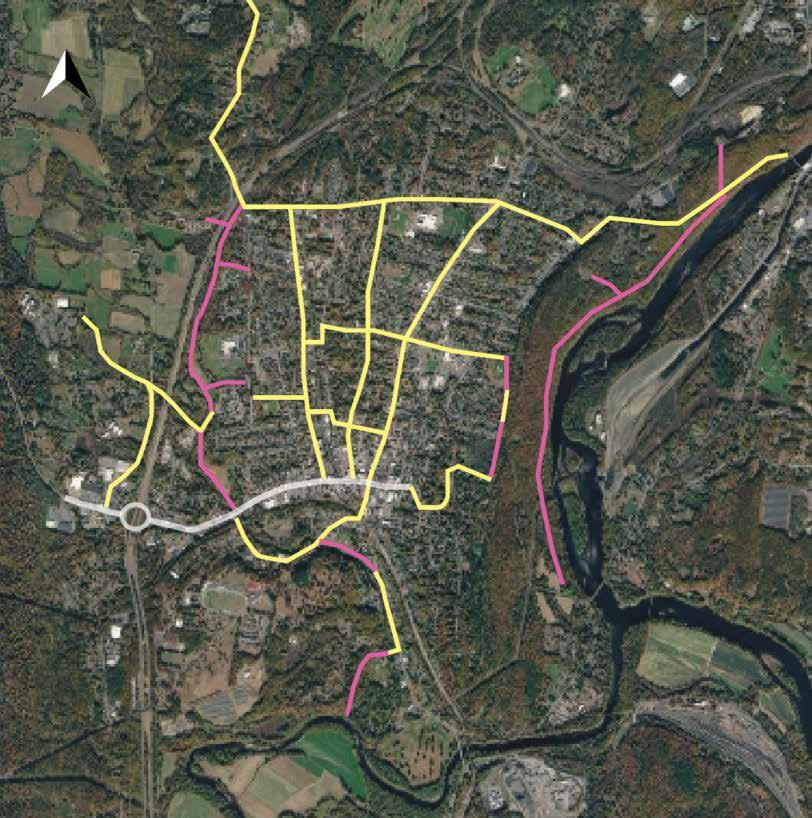
The recommended network creates connectivity throughout the urban core and to primary destinations outside of the core. Labels align with segment details in the following pages.
Today, Federal Street is the primary north-south route in the urban core that includes any infrastructure for cyclists. The northern extent of Federal Street, from Silver Street to Pierce Street, has painted on-road bike lanes on both sides of the road. The intersections on that road extent do not include any bike boxes or other cycling infrastructure.
With Federal Street (Route 5/10) being a primary vehicular corridor through the city and the location for key destinations including the Middle School and Federal Street Elementary School, the current partial on-road painted bike lane is not sufficient for the traffic volume or speed seen on the road. In order to make this a safer route for cyclists to use, more intensive infrastructure solutions are required. The traffic volume and speed requires a buffered or wholly separated solution for cyclists to utilize this route as a safe option. Along with a bike lane, intersection enhancements are needed at the Federal and Pierce Street intersection as well as the Federal and Garfield Street intersection. In line with the east-west suggested routes, these two intersections will be critical in the biking network and require safer infrastructure for cyclists to cross Federal safely. By creating safer conditions for cyclists, Federal Street could become a critical “Safe Routes to School” connecting route for school-aged children.
↳ Physical Conditions Score: Low (0.5)
↳ Social Impact: within an EJ block, within blocks where 55% of the households without vehicle access are located, serves Urban Core population
↳ Community Impact: serves primary destinations of Shattuck Park, Middle School, Hospital, CVS, Federal St Elementary School, and leads onto Main Street. Frequently used by the cycling community today
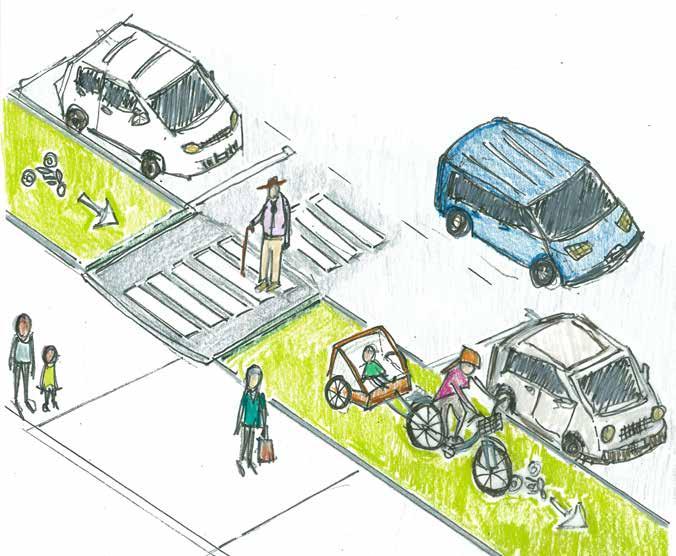
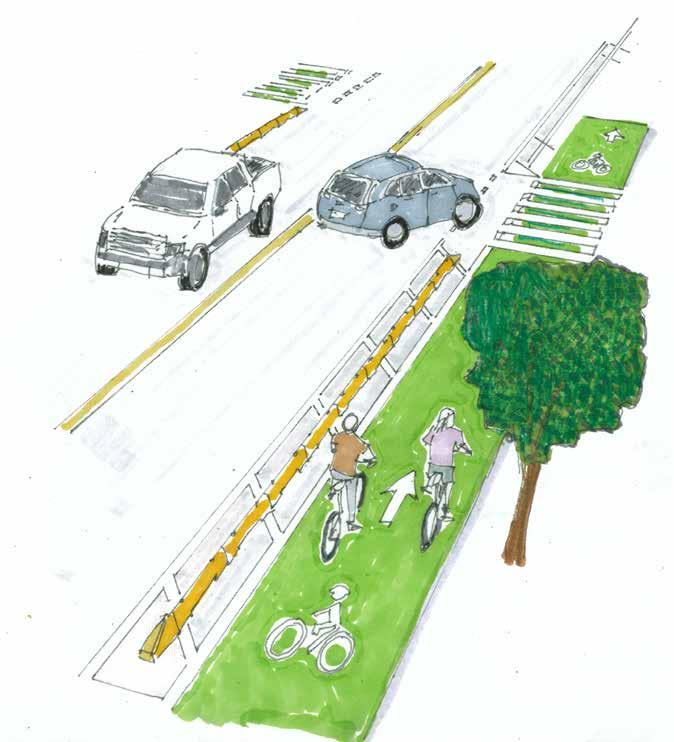
A physical barrier between the bike lane and travel lanes can increase safety for cyclists and drivers. Bike lane extension markings at intersection crossings help increase drivers’ awareness of cyclists in the roadway.
Silver Street is an east-west thoroughfare crossing a residential area at the northern extent of Greenfield’s urban core. Strava heatmap data suggests a high level of cycling activity on the road. Beginning west of Federal Street, the road is marked with 4-foot-wide striped bike lanes and intermittent sharrows in the lane. Major intersections are marked with bike lane extensions. These dashed white lines are used to indicate potential conflict areas where vehicles may turn in front of a bicycle. West of Silver Place / Wells Ave, the bike lanes are of inconsistent width, eventually disappearing near Leyden Road. With high traffic volume, a high incident rate, and vehicles operating in excess of the 30-mile-per-hour posted speed limit, additional protections are necessary to ensure the safety of cyclists on this route.
While fully-separated bike lanes are preferred, frequent driveway curb cuts along Silver Street make this an impractical intervention. Repainting the existing bike lanes green with a marked buffer would heighten drivers’ awareness of the presence of cyclists on the road. Intermittent bollards could be installed in key areas where there are no curb cuts. Special attention should be paid to priority intersections, where vehicles are most likely to collide with cyclists. Installing bike boxes at the stoplights on Federal and High would allow cyclists to safely turn with traffic. Enhanced crossroad markings at the intersections of Davis and Wells (Silver Place) ensure safe connection to preferred north-south routes.
↳ Physical Conditions Score: Medium (1.25-1.75)
↳ Social Impact: within an EJ block, within blocks where 10% of the households without vehicle access are located, serves Urban Core population
↳ Community Impact: serves primary destinations of Academy of Early Learning and the High School
With Federal and High Streets being high speed and high volume routes (as well as high-incident areas) establishing routes on parallel streets for cyclists looking for more comfortable alternatives becomes a priority. The layout of Greenfield’s urban core lends itself to efficient travel along these north- south lines, connecting the primary residential areas of the city to its business district. With several options available, the Conway Team evaluated each street based on its ability to meet physical and social criteria. From this analysis, two suitable routes emerged: Wells Street and Davis Street.
Wells Street runs through an industrial zone west of the train tracks. With its gentle slope, wide right-of-way, and low traffic count, the street is suitable for a north-south route. At its northern extent, Wells intersects with Silver Street, a primary east-west route. Both the Allen Street Bridge and Arch Street underpass connect to Wells. While consideration should be given to traffic entering and exiting the commercial properties in this area, clear sight lines allow both drivers and cyclists to anticipate the presence of each other. There is no parking on the east side of Wells, providing an adequate right-of-way for future bike infrastructure. By realigning the existing traffic lanes, there is room for painted bike lanes.
The commercial area on Wells Street is home to a number of emerging businesses, such as Four Phantoms Brewing Company, the Artisan Beverage Cooperative taproom, and Camelot Cat Cafe. Providing bike access to these businesses could spur economic activity in a more isolated part of town. 60 Wells Street is the future home of Clinical & Support Options’ new housing and service facility. Upon completion, the CSO building will hold a 30-bed shelter and 36 transitional apartments, with on-site case management and a nursing station. Locating a bike route along Wells Street would be a step towards equitable distribution of transportation infrastructure.
↳ Physical Conditions Score: Low (0)
↳ Social Impact: within an EJ block, within blocks where 55% of the households without vehicle access are located, serves Urban Core population
↳ Community Impact: serves primary destinations of Redistro and leads onto Main Street. Frequently used by the cycling community today
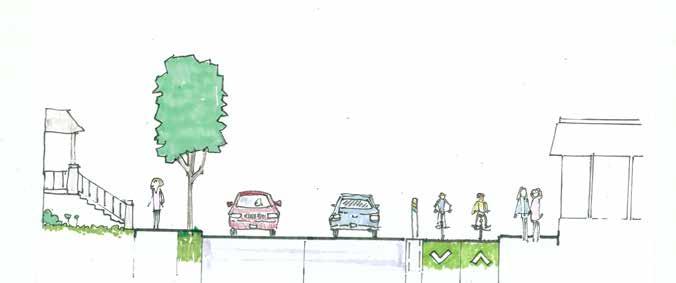
Portions of Wells Street are suitable for painted bike lanes, and for uninterrupted sections, bollards could be used for separation.
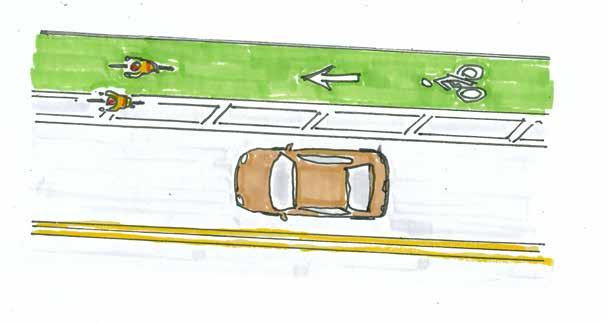
For a lower intervention option, painted buffers can be used in tandem with a painted bike lane to create separation.
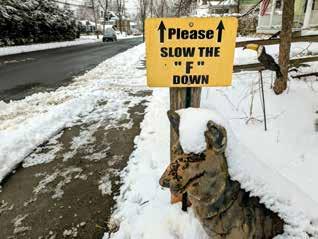
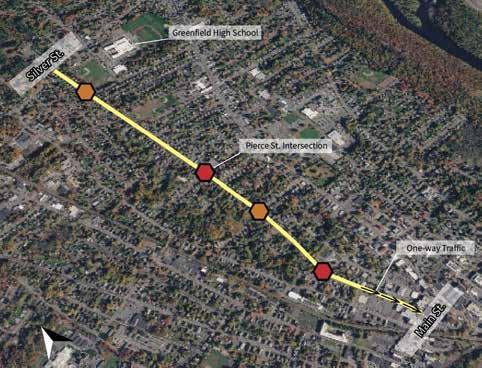
Davis Street is a centrally-located north-south route extending from Main Street to Silver Street. The 1.3 mile-long road has an average slope of 1.2% making for comfortable riding conditions. Davis provides direct access to many important destinations such as Greenfield High School, tennis courts, a skate park, the John Zon Community Center, and the future location of Green Field’s Market. When cycling on Davis Street, the typical rider is never more than two minutes away from the businesses on Federal Street. Signs posted on the street identify this as a bike route, however there are no road markings to reinforce this designation.
Davis Street’s proximity to dense residential areas and primary destinations make it an ideal connector route. With a road width of 30’ and street trees occupying the right-of-way, the options for fully-separated bike infrastructure on Davis are limited. However, the low speed limit and low average traffic count of 1,600 cars per day may be suitable conditions to establish a bike boulevard.
A bike boulevard provides a continuous route through a city’s road network. Through reduced speeds and traffic calming infrastructure, cyclists and motorists may comfortably share road space without the need for dedicated bike lanes. This is useful in residential areas where driveway curb cuts and on-street parking limit the ability to install bike lanes. With intermittent sections of 30 miles per hour today, it is recommended that the speed limit is reduced to 25 miles per hour for the extent of Davis.
In designing a bike boulevard, it’s essential to establish safe and reliable intersection crossings for cyclists. Traffic calming infrastructure such as raised crosswalks and roundabouts require motorists to be mindful of speed while navigating the throughway. Shared lane markings should be placed within 50’ of all intersections, and near the center of each directional lane, away from hazards such as parked cars.
The intersection of Main Street and Davis Street is a key connection point in the proposed bike network. Traffic is one-way to motorized vehicles on the block entering Main from Davis, limiting its use as a shortcut and reducing the daily traffic count. With no vehicle parking on the east side of Davis approaching Main, a buffered turning lane onto Davis should be considered, creating physical separation between cyclists and vehicles making a left turn onto Main.
↳ Physical Conditions Score: Low (0-0.25)
↳ Social Impact: within an EJ block, within blocks where 55% of the households without vehicle access are located, serves Urban Core population
↳ Community Impact: serves primary destinations of the High School, Community Center, and leads onto Main Street. Frequently used by the cycling community today
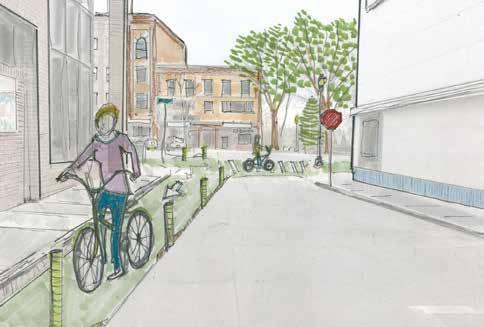
A centrally-located east-west route is essential to a comprehensive bike network. The low-speed, low-volume streets provide safe cycling options, linking residential neighborhoods to the proposed north-south routes. An east-west route using these secondary roads could meet the needs of riders while establishing an accessible alternative to the Main Street and Silver Street thoroughfares. The new east-west route also creates an opportunity to link two of Greenfield’s most popular outdoor recreation spaces: Rocky Mountain Park and the Green River Swimming and Recreation Area.
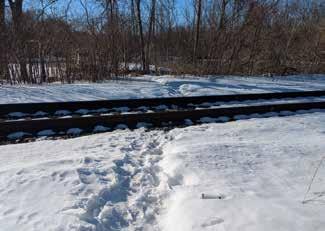
The primary challenge of siting a central east-west bike route is the presence of train tracks, with a limited number of railroad crossings within the city’s urban core. Currently, the bridge at Allen Street and underpass at Arch Street are the only legal railroad crossings between Silver Street and Main Street. Community members report using a “habit trail” to cross the tracks at Cleveland Street. Many students take this shortcut due to its proximity to Greenfield High School. The Complete Streets plan recommends a fence to discourage this hazardous crossing, but the pattern of use will persist until alternatives are provided.
The Conway Team recommends using a combination of Beacon Street and Pierce Street as the foundation of a primary east-west neighborhood route. The low-stress roads have room for painted bike lanes and sharrows at intersection approaches. Enhanced bike and pedestrian crossings at High and Federal increase visibility of cyclists passing through the high-traffic areas. The route is accessible to a number of community-identified destinations, including Greenfield Middle School, Roundabout Books, and Baystate Franklin Medical Center, the largest employer in Greenfield.
The route intersects with the proposed Davis Street route, providing a connection to downtown amenities to the south. From Davis, the route approaches Chapman Street, where access to the Allen Street bridge is one block away. Beyond the bridge, Allen Street has striped bike lanes between Wells and Elm Street. Further investigation is required to determine if connections can be made beyond Elm Street to the Riverside Greenway multi-use path.
A second east-west bike route prioritizes use of the Arch Street underpass to cross the rail line. Starting on Maple Street to the east, the parallel route connects to Garfield Street at Federal before turning onto the Davis Street route. New wayfinding signs would direct riders to the underpass, with Wells and Grove Street used to travel to points west.
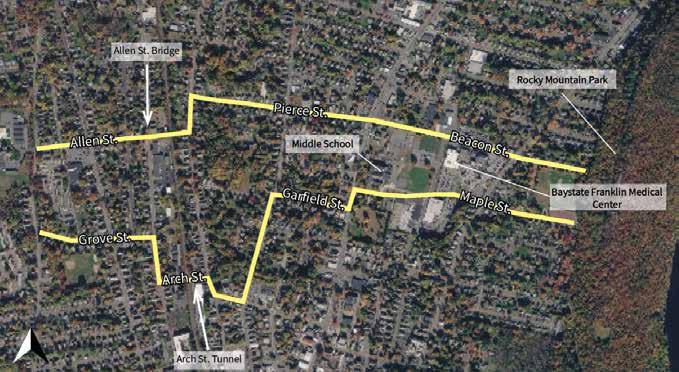
Two options for traveling East-West through the urban core.
Allen - Pierce - Beacon
↳ Physical Conditions Score: Low (0-1)
↳ Social Impact: within an EJ block, within blocks where 55% of the households without vehicle access are located, serves Urban Core population
↳ Community Impact: serves primary destinations of Foster’s Supermarket, Baystate Franklin Medical Center, the Middle School, Beacon Field, Poet’s Seat, and Rocky Mountain Park. Allen Street is frequently used by the cycling community today
↳ Physical Conditions Score: Low (0-0.5)
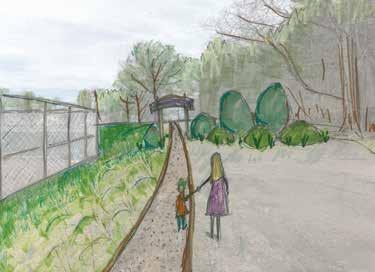
Possible shared use path through the Beacon Field parking lot.
↳ Social Impact: within an EJ block, within blocks where 55% of the households without vehicle access are located, serves Urban Core population
↳ Community Impact: serves primary destinations of Hillside Park, Federal Street Elementary School, and Rocky Mountain Park. Arch Street is frequently used by the cycling community today
The safety of the bridge is a primary concern for cyclists. The bridge’s narrow road width and guard rail restrict cyclists’ ability to stay out of traffic. Limited visibility creates hazardous conditions with vehicles lacking adequate stopping distance to avoid collisions. According to FRCOG, the crossing of Allen at Wells is the third most dangerous intersection in Franklin County. Present cycling infrastructure on the bridge is limited to road sharrows and a sign, both of which are difficult to observe in the dark. Future improvements may include large reflective “super sharrows” on the roadway and a Rectangular Rapid Flashing Beacon (RRFB) to indicate the presence of cyclists to drivers.
A safer alternative to Allen Street is the Arch Street underpass. With an AADV count of 2,000, Arch Street receives half the traffic of the bridge to the north. Through improved wayfinding, cyclists can be directed towards the tunnel as they cross town from east to west. The architecturally-distinct underpass is only wide enough for one vehicle at a time, and local drivers are accustomed to stopping for alternating traffic. The underpass presents an opportunity for creative and memorable traffic calming solutions, such as painting a mural on the road surface to indicate the space is shared by bikes and pedestrians.
To further prioritize bike and pedestrian use, the underpass could be closed to vehicular traffic, with bollards or raised planters placed at the entrances to restrict motorized travel. With a clearance of only 9’6”, the underpass is too small for emergency vehicles. Limiting access would require drivers to detour just 0.2 miles to Allen Street, while the new traffic pattern would make cycling a more attractive option for riders of all abilities.
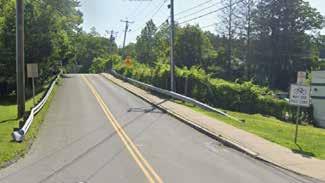
Cyclists are encouraged to use full lane on the Allen Street bridge, but the slope creates dangerous conditions of low visibility while crossing. From Google Street View.
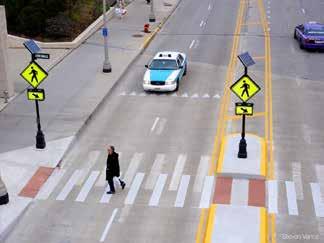
Adding a Rectangular Rapid Flashing Beacon would increase visibility of a cyclists presence to drivers and may increase safety. By Steven Vance
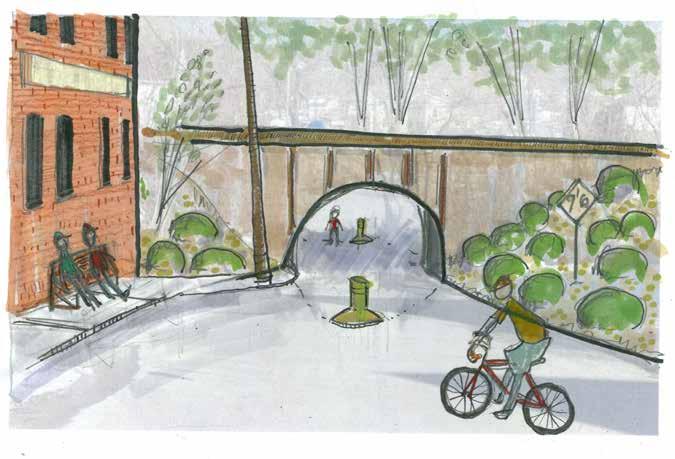
Closing the tunnel to vehicular traffic creates a safer neighborhood connector where cyclists and pedestrians can enjoy this unique architectural feature of the city.
The east-west routes open up potential off-road connectors south of Rocky Mountain Park. From Beacon Street, a multi-use path can run south along the Beacon Field parking lot into Parkway Street. From here, a wooded City-owned parcel can be used as a trail alternative to Mountain Road. This short segment is a popular cut-through for people in the neighborhood travelling to and from the park. The trail ends on Spring Terrace, from where bikes can follow signs to Main Street on the low speed, low traffic roads.
↳ Physical Conditions Score: Low (0-0.75)
↳ Social Impact: within blocks where 5% of the households without vehicle access are located, serves as a connector to the Urban Core
↳ Community Impact: serves primary destinations of Beacon Field, Poet’s Seat, and Rocky Mountain Park. Mountain Road is frequently used by the cycling community today for access to mountain biking trails and the Montague Bridge
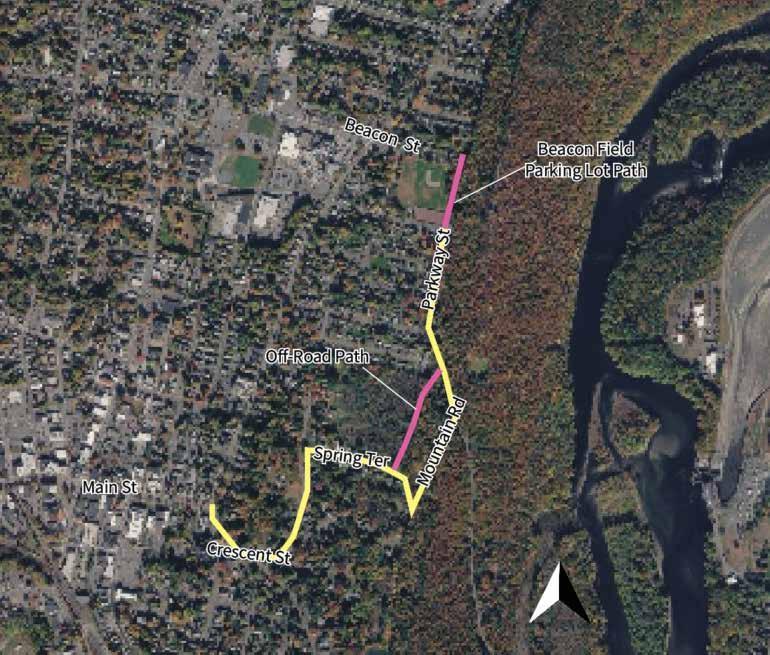
To establish a complete bike network, it’s necessary to provide safe access to services west of the interstate. Planned enhancements to bike infrastructure at the rotary will improve connectivity to Main Street, but bike access to Greenfield Community College remains a priority.
Colrain Road is a north-south route that links the college to the Route 2 shopping plazas and points north. A striped shoulder denotes space for cyclists on both sides of the road, however posted speeds of up to 35 miles per hour and high traffic volume create low-comfort riding conditions. A painted bike lane is recommended on both sides of the road between Route 2 and the rotary at College Drive. To increase visibility, intersection enhancements are recommended as well. The multi-use path on College Drive provides a separated route for cyclists riding to and from campus. East from the College Drive rotary is Colrain Street, which intersects with Riverside Ave near the southern entrance to the Riverside Greenway. As of March 2026, the Colrain Street overpass is under construction, requiring cyclists to detour.
↳ Physical Conditions Score: Medium (1-1.5)
↳ Social Impact: partially within an EJ block and leads into primary EJ blocks, within blocks where 7% of the households without vehicle access are located, serves as a connector to the Urban Core
↳ Community Impact: serves primary destinations of Greenfield Community College, Big Y, BJ’s, and Home Depot. Colrain Road and Colrain Street are identified as community priority routes for infrastructure projects
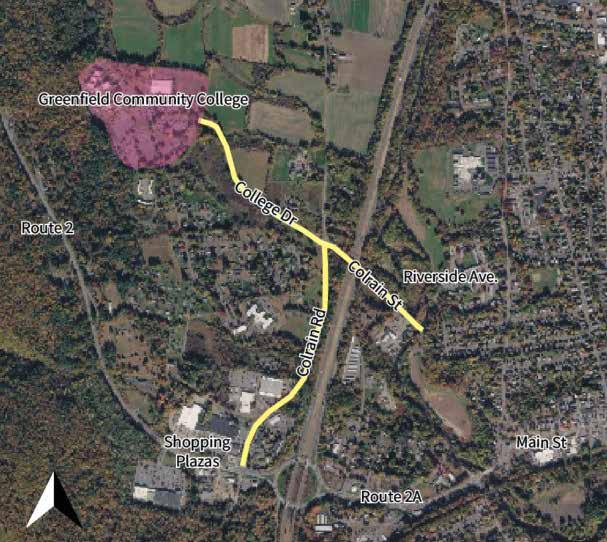
Coming from the shared use path on College Drive, Colrain Street connects to the Greenway and Colrain Road connects to the future infrastructure on Route 2/2A.
The most frequently cited problem area in community feedback is Turners Falls Road. In a survey distributed by the Conway Team, more than 40% of respondents identified Turners Falls Road as a primary area of concern. The moderately sloped mile-long route serves as the northern connection between Greenfield and Turners Falls to the east. The road is a priority route between the two communities, frequently used by Turners Falls residents accessing businesses and services in Greenfield. The narrow road width and limited shoulder space make this a dangerous route for cyclists and pedestrians. Guard rails and rock outcroppings present significant physical barriers to applying on-road infrastructure. With speed limits reaching 40 miles-per-hour, safer, more comfortable solutions should be prioritized.
Through input from the community, several route suggestions to connect the two towns have emerged and are described in the following pages. It is recommended that a feasibility study is pursued to confirm the viability of these conceptual solutions.
↳ Physical Conditions Score: Medium (2)
↳ Social Impact: leads to an EJ block in Turners Falls, within blocks where 5% of the households without vehicle access are located, serves as a connector to the Urban Core, but primarily provides access to 20% of the overall population and Turners Falls residents
↳ Community Impact: serves primary destinations of Turners Falls, most frequently requested priority routes for infrastructure projects by the community
With limited space for traffic separation, low-level interventions are a positive first step towards improving safety. Reducing the speed limit to 25-miles-per hour for the entire extent of Turners Falls Road is recommended. At lower speeds, drivers can yield to downhill cyclists and pass uphill cyclists with caution. Signs may be relied on to alert drivers to the presence of cyclists and pedestrians in the roadway. Facing downhill traffic, signs could indicate “Bicycles May Use Full Lane,” accompanied by large sharrows in the road. On the uphill side of the road, signs could remind drivers to give four feet of space to bikes when passing. A Rectangular Rapid Flashing Beacon at the bridge would alert approaching vehicles to the presence of bikes at this narrow crossing.
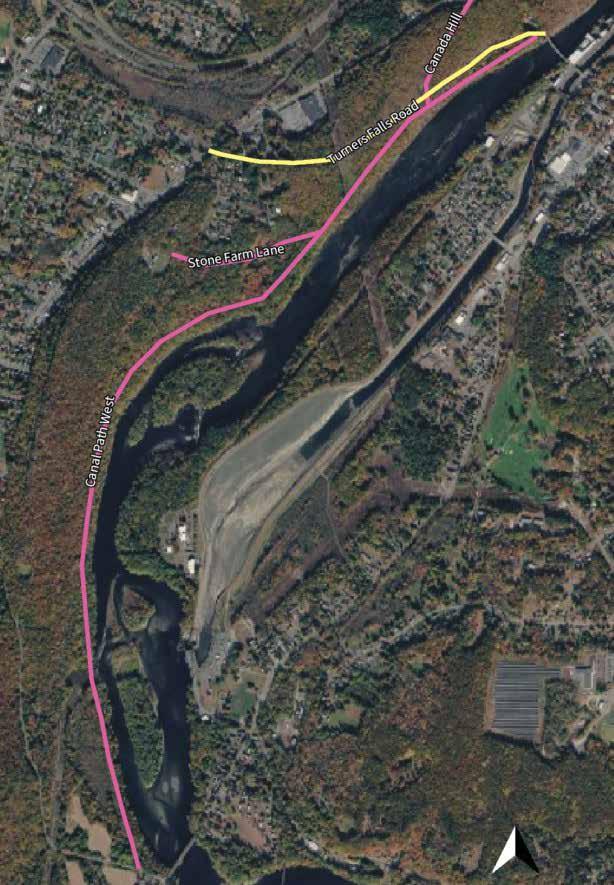
Various options are available to provide connectivity to Turners Falls, most of which are offroad solutions to access the bridge.
There appears to be limited road width on Turners Falls Road to add substantial bike and pedestrian infrastructure. The City could change this to a oneway traffic pattern, dedicating 10’-12’ to a shareduse path. This could be similar to the Wisdom Way project, which created separated infrastructure between the Franklin County Fairgrounds and River Street. Benches and bike racks could be installed at the Canada Hill trailhead, opening up a new access to a city-owned recreation destination. With Turners Falls Road used by more than 5,000 vehicles daily, this approach would have a significant impact on vehicular travel, requiring cars to either detour to the bridge in Gill to the north or Montague City to the south.
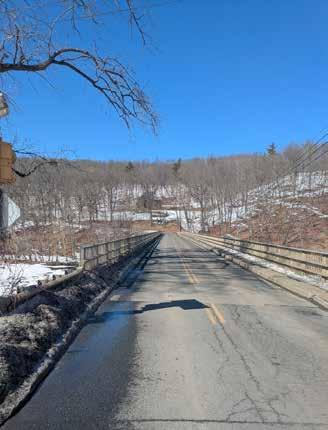
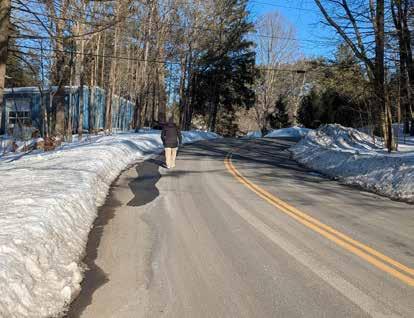
Canada Hill Road is accessed from Route 2A, approximately a mile east of the Turners Fall Road. The road currently ends at a gate, with the undeveloped extent connecting to the lower portion of Turners Falls Road near the bridge. Community members have identified this unused portion of Canada Hill Road as a potential connection to Greenfield, specifically the Stop and Shop. The City owns a 15-acre parcel known as the Renfrew Conservation Land adjacent to Canada Hill Road. The property has a 0.4-mile trail connecting to Wunsch Road. While removed from traffic, it’s unclear whether people would find this to be an undue detour from the current route.
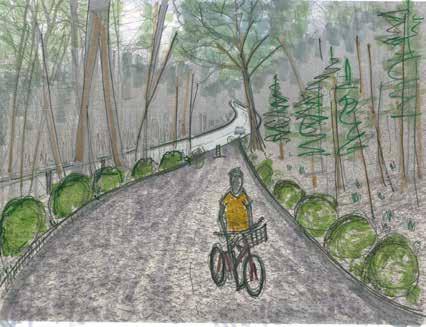
Formalizing access to the Canada Hill Road would provide a scenic alternative to Turners Falls Road and would increase access to primary destinations.
With the physical conditions of Turners Falls Road limiting infrastructure improvements, seeking an alternative route may have long-term benefits. A multi-use recreational path between Turners Falls Road and the Connecticut River could improve safety, maintain connectivity, and increase access to open space. The 2.5-mile long path would follow the course of the river, linking the Turners Falls Road Bridge to Mountain Road. Access from Stone Farm Lane provides an entry point to the neighborhood. Spur trails linking to Rocky Mountain Park open up the area to mountain biking.
The project would require stakeholder cooperation, crossing 66 acres owned by FirstLight Power and 85 acres of the Connecticut River State Park. The recreational path would be directly across the water from the popular Canalside Rail Trail in Turners Falls. It would serve as a key piece of the cycling network by mirroring the Riverside Greenway on the east side of Greenfield.
North of the urban core, Leyden Road is a primary connector to the rural neighborhoods in the north of the city as well as access to the town of Leyden. With its narrow roadway and moderate speed and traffic, it poses safety concerns for cyclists and pedestrians today. Also, the intersection at Nash’s Mill Road has been identified as an area of conflict when turning onto and off of Leyden Road for drivers, cyclists and pedestrians. The primary destination on Leyden Road roughly a mile north of the urban core is the Leyden Woods neighborhood, one of the city’s affordable housing communities. Safe access to this neighborhood has been mentioned by both the city and FRCOG as a priority enhancement in the coming years. Local bus access has been extended to serve this neighborhood, but further infrastructure is required to support the Leyden Woods community.
A first solution would be to install a sidewalk on Leyden Road from Silver Street to Leyden Woods Lane, if not further. With this solution, cyclists would benefit along with pedestrians as they would be able to bike on the sidewalk for that extent of the road as needed. With available right-of-way space, a multi-use path could also be constructed for a more bike-friendly solution.
↳ Physical Conditions Score: Low (0.75)
↳ Social Impact: leads to affordable housing neighborhood, within blocks where 7% of the households without vehicle access are located, serves as a connector to the Urban Core, but primarily provides access to 20% of the overall population
↳ Community Impact: serves primary destinations of the Leyden Woods neighborhood, overlaps with the Franklin County Bikeway
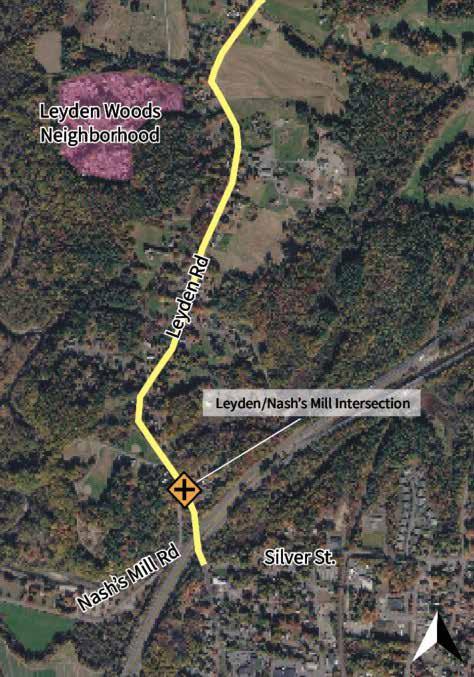
Providing safe access to the Leyden Woods neighborhood is a priority for the city. Conflict at the Nash’s Mill Road intersection should be addressed with additional infrastructure enhancements.
The Riverside Greenway is a 1.4-mile paved multi-use path that runs parallel to I-91 and the Green River. It connects the popular Green River Swimming and Recreation Area to Riverside Drive to the south. Community feedback suggests an interest in more off-street cycling options, such as using the scenic path to bike to the beach. However, a perceived lack of access creates a barrier to use. Currently, there are no places to enter or exit the path between the northern and southern terminuses. The path is bordered to the east by the Franklin County Jail and three apartment complexes owned by the Greenfield Housing Authority. There is no lighting on the path and a large encampment has been built at the river’s edge.
↳ Physical Conditions Score: N/A, offroad
↳ Social Impact: within an EJ block and near three affordable housing communities, within blocks where 28% of the households without vehicle access are located, serves Urban Core population
↳ Community Impact: serves primary destinations of the Academy of Early Learning, Valley Medical Group, Newton Elementary School. Frequently used by the cycling community today and extensions were documented as priority routes for infrastructure projects by the community
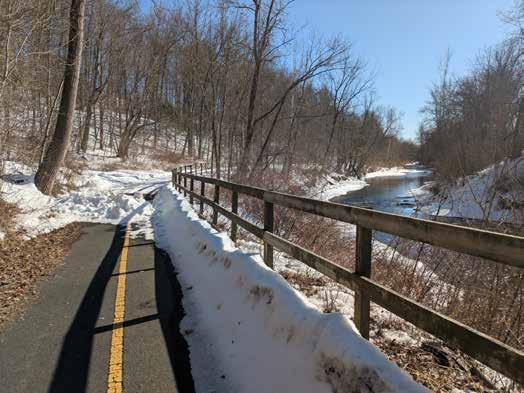
Although
Existing Proposed 1 mi
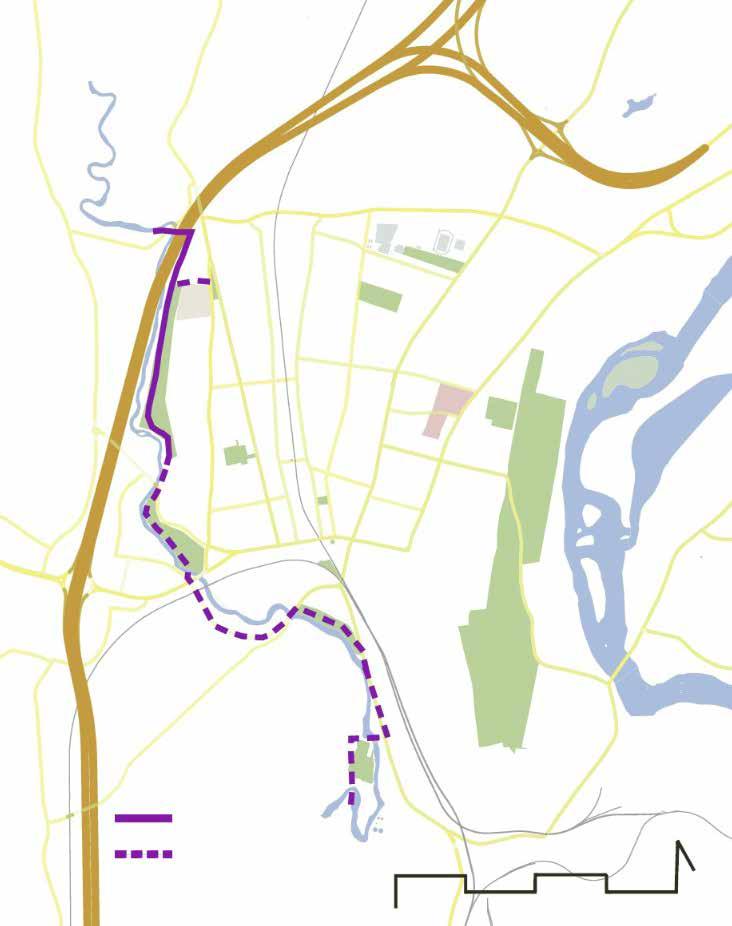
Extensions to the existing Greenway could be added over time to expand this recreational attraction for both Greenfield residents and tourists alike.
Connecting the Greenway to the neighborhood would open up new recreation possibilities in Greenfield. Improved access will lead to more activity, as people discover this community asset. Several options to extend the path were identified through the 2017 Complete Streets Plan as well as Strava heatmap activity, which indicates existing patterns of use. All recommendations require further investigation into land ownership, though options may include the following:
↳ Extend the path along I-91 / Route 2, connecting to the western end of Silver St. This would create a new link to a high-use east-west bike route using the same land parcel as the existing path. However, this extension would terminate at the intersection of Silver Street and Leyden Road, a high-speed corner, not currently suitable for bike crossings.
↳ Create a Greenway spur at the northern extent of Elm Street. An existing road grade behind the Oak Court Apartments ties directly into the Greenway at the 1-91 underpass. A new multi-use path through the Oak Court woods could be routed across the open space north of the apartments. By working with the Greenfield Housing Authority, the land could provide important neighborhood access and an alternative to Leyden Road.
↳ Explore the feasibility of a connection to the neighborhood at the southern end of the Greenway The open space between 150 Elm Street and the county jail would provide a direct and scenic route to the Green River. The proposed route is between Allen Street and Grove Street, establishing a link to the two proposed east-west routes.
Plans to develop this dirt road into a bike path have been in discussion for more than a decade. The 0.3-mile segment on the bank of the Green River could serve as a linear park and reroute cyclists away from the busy interchange of Mill and Deerfield Street. Though only a short segment, Meade Street is close to downtown and represents another piece of a Greenway extension that would expand access to green space through the city.
The 1.65 acre city-owned parcel is in the process of being restored as a meadow under a Municipal Vulnerability Preparedness (MVP) grant. The entrance to the Millers Meadow property is just 1,000 feet from the southern access to the Riverside Greenway. Installing large sharrows on Riverside Drive would bring attention to the presence of bikes in the road along this brief on-road connection.
The 2024 Regional Transportation Plan identifies the Millers Meadow parcel as a potential link in a larger network of multi-use paths. Incorporating trailhead parking into plans for this land would provide access to recreational cyclists to use the riverfront trail system. The construction of a bike and pedestrian bridge across the Green River would connect the path to Newton Elementary School at the intersection of Shelburne Road and Route 2A. From here, riders would have access to on-street bike lanes on River and Mill Streets. While striped lanes are present, markings have deteriorated and the route would benefit from new paint. Establishing these small linkages builds towards a broad network of cycling possibilities while highlighting Greenfield’s natural amenities.
An environmental impact assessment would be needed prior to trail establishment. Bikes can be damaging to sensitive ecosystems, and due to the proximity of the Green River, future bike infrastructure should be designed with ongoing maintenance and flood vulnerability in mind.
The 21-acre Green River Park represents another key piece of the proposed Greenway expansion. In the 1920’s this parcel was the nursery for Greenfield’s street tree program. Today, the expansive recreation area features fields, a playground, pickleball courts, and the city’s only dog park. The city-owned land has the potential to provide an off-road connection between Greenfield and Deerfield and is accessible from a footbridge off of Deerfield Road. The need for a safe link between the neighboring communities is frequently mentioned in community feedback. Building a bridge at the Deerfield River would provide a recreational route between the two towns. Rural roads on the Deerfield side of the river provide a comfortable approach to Old Deerfield and the expansive trail network of the Pocumtuck Range.
Prior to high-intervention infrastructure implementation, there are opportunities for fast and easy pilot programs that can help trial a proposed bike route for a designated period of time. By utilizing paint and temporary street markers, cities have been able to quickly implement separated bike lanes to better understand the impact, feasibility, and attractiveness of more formal bike infrastructure prior to breaking ground on construction.
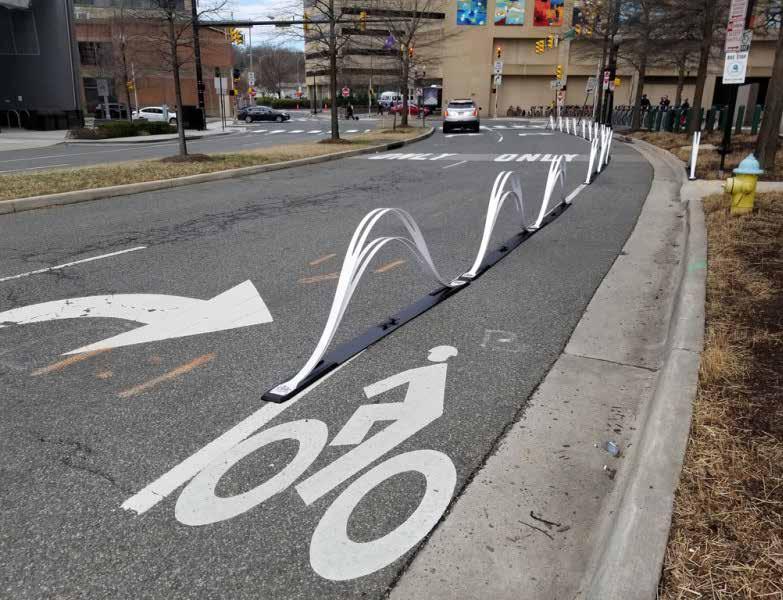
In 2020, the City of Chicopee, MA received funding from MassDOT through the “Shared Streets and Spaces” grant to establish a temporary “center loop” bike path throughout downtown. This grant was part of the “Quick-Launch/Quick-Build” municipal funding program that supported pilot projects which could inform future infrastructure projects. The proposal that was awarded included funding for three primary infrastructure solutions:
↳ Protected Bike Lane with Wave Delineators: a separated bike lane that is clearly delineated from the road with painted lines and temporary bike lane barriers (wave shaped, stand about 2 feet tall).
↳ Shared Lane Marking (“Sharrow”): indicates that space on the road is meant to be shared by bikes and cars.
↳ Bike Box: designated area at the head of a traffic lane at a signalized intersection that provides cyclists with a safe and visible way to get ahead of queuing traffic during the red signal phase.
Prior to implementation, the plan was presented to the community and concerns were addressed accordingly. Infrastructure was put in place with the intention of remaining up for a year and a half (with the delineators being removed during the winter months to accommodate snow removal). During the pilot period, the public could submit comments with feedback on the city’s website and the city was in contact with local businesses directly to collect feedback. The infrastructure was removed at the end of the pilot period and findings from that time have been used to develop future initiatives, including a Complete Streets Plan.
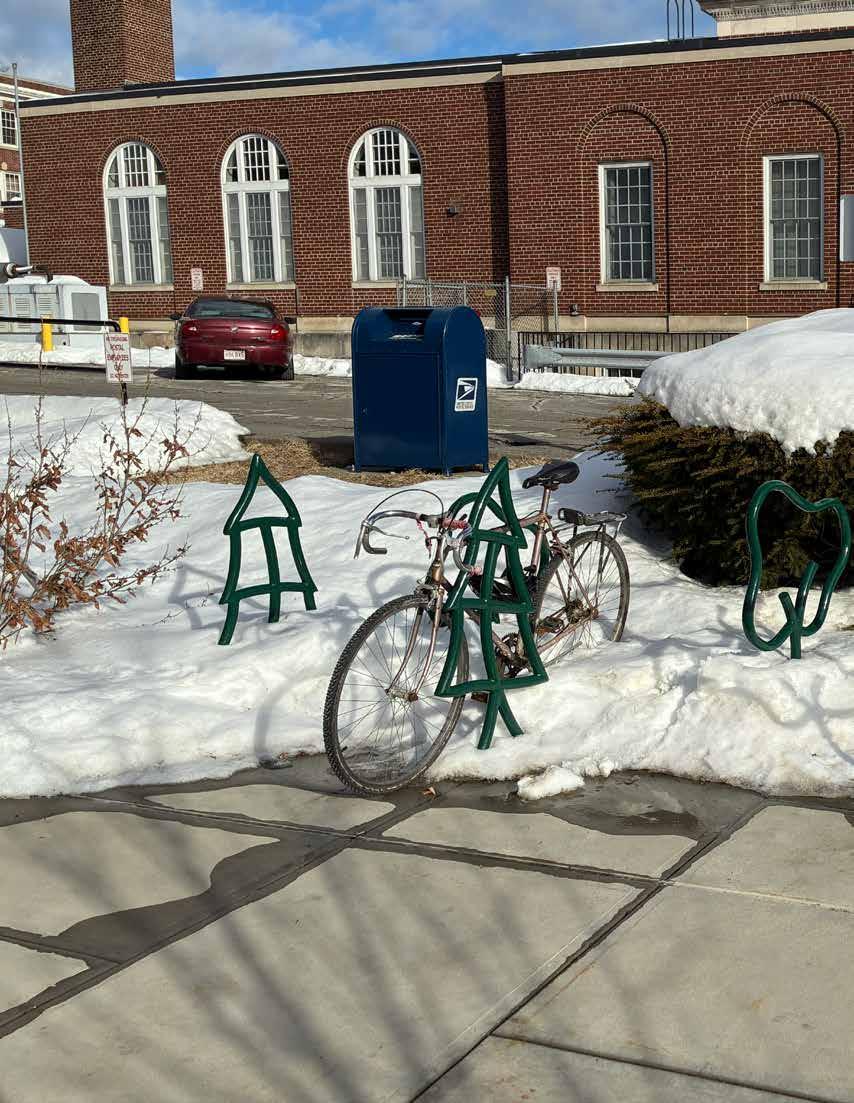
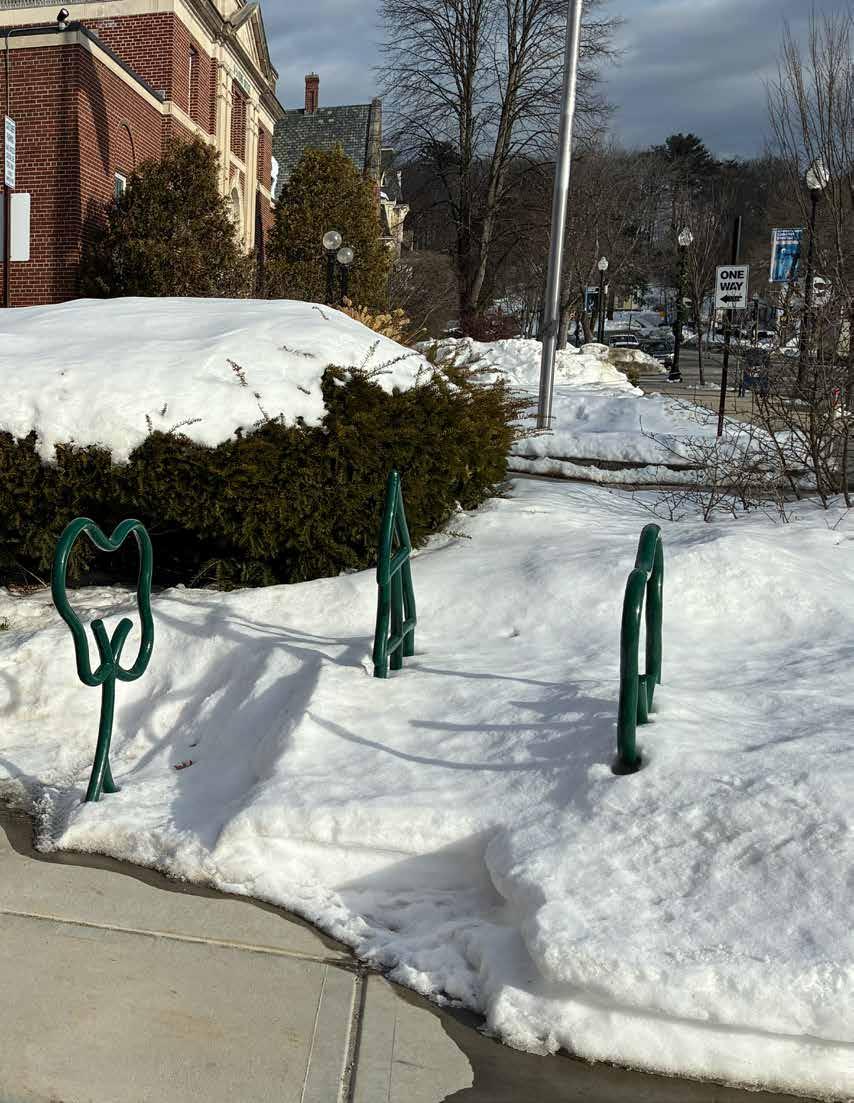
The community has voiced an interest in improving access to existing mountain biking trails while expanding the off-road network. Survey respondents cite the need for better connectivity to trails in neighboring towns, such as Deerfield and Montague. Siting a pump track is also a priority. There may be an opportunity to build upon the trail network on the east side of Greenfield, specifically in Rocky Mountain Park and Temple Woods, though a detailed environmental impact analysis is needed. An off-road alternative to Turners Falls Road would expand the network even further, with the potential for spur trails linking the parcels. The identified areas are near businesses on Federal Street, and creating a local destination for the mountain bikers could bring economic benefits to the community.
Enhancing trailhead access, signage, parking, and connections to nearby neighborhoods can make existing trails easier to reach without requiring a car. Prioritizing bicycle accessibility in both existing and future trail development supports outdoor recreation, encourages the use of active transportation, and helps ensure that mountain biking resources are available to a broader segment of the community. Further outreach is needed to identify gaps in Greenfield’s mountain biking trail network.
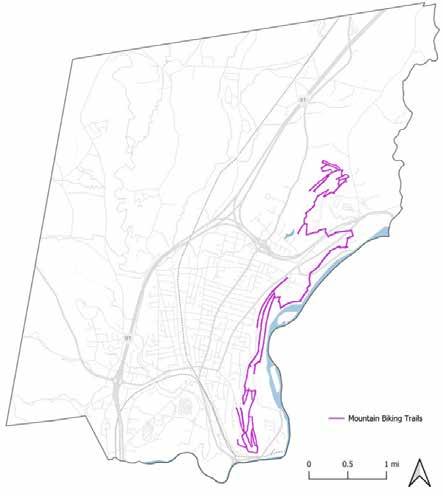
Education on safe cycling practices is an important component of improving bicycle transportation in Greenfield. In addition to infrastructure investments, educational programs can help cyclists and motorists better understand traffic laws, safe riding techniques, and strategies for sharing the road. Expanding bicycle safety education can support safer travel behavior, increase rider confidence, and encourage greater use of the city’s bicycle network.
Programs such as bike rodeos (see below) can provide youth with hands-on instruction in basic riding skills, traffic awareness, and safe cycling practices in a controlled environment. Initiatives like bike buses-organized group rides where students cycle to school together-can promote safe routes to school while helping children develop riding skills and independence. Organizations such as MassBike also offer educational classes for communities to help build rider confidence and train riders to be teachers in their community.
A bicycle rodeo is a fun way to teach children about the rules of the road while practicing safe bicycling. The rodeo consists of stations and courses where children can learn about bicycle safety and practice safe bicycle skills. Students begin practicing individual skills and eventually advance to a simulated neighborhood environment in the “Town of Safetyville.” Bicycle rodeos are typically offered to students ages 8-12, though younger or older students may also benefit from the training. Participating students should have permission from their guardians to attend. (MassDOT)
The Greenfield Police Department has held bike rodeos at the Middle School in past years.
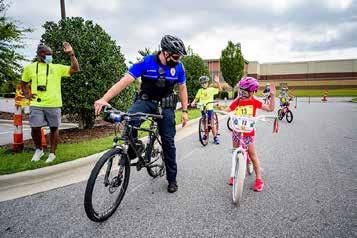
Greenfield has limited bicycle support infrastructure, including a small number of identified bicycle racks and repair stations. Bicycle racks are located at select primary destinations, such as the transit center and schools, and are scattered along Main Street (see “Observed Bike Racks Map” in Appendix). Some documented racks are in disrepair or are poorly designed, rendering them unusable. Bike repair facilities are even more limited, with existing stations located only at the transit center and Greenfield Community College. There is an opportunity to expand this infrastructure by increasing the number and distribution of bicycle racks and repair stations throughout the city, particularly at key destinations, commercial areas, and along major bicycle corridors. Expanding these facilities could improve convenience for cyclists and encourage greater use of cycling as a viable mode of transportation. No bike racks were observed at the following primary destinations and are suggested locations for additions.
Recommended Rack Additions
↳ Energy Park entrance
↳ Poet’s Seat Tower trailhead on Mountain Road
↳ Green River Swimming Area
↳ Beacon Field
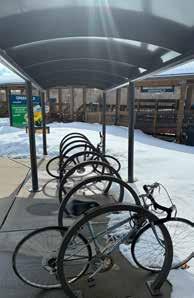
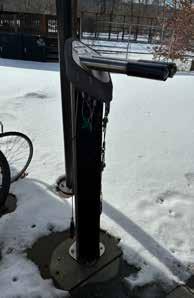
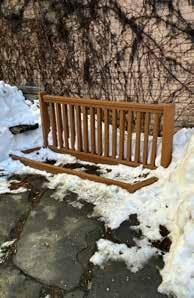
Establishing a volunteer-led Community Bicycle Committee could create a dedicated forum for residents and advocates to collaborate with local officials on improving bicycle infrastructure and policies. Such a committee could help identify gaps in existing facilities, prioritize investments in bike lanes, racks, and repair stations, and provide feedback on proposed transportation projects. A community bike committee could also promote bicycle safety education, organize events that encourage cycling, and serve as a bridge between the public and municipal decision-makers. By incorporating local knowledge and community input, the committee can help ensure that bicycle planning efforts are more responsive, inclusive, and effective in supporting safe and accessible cycling throughout the city. Participants from the community meeting were interested in the idea of forming a Greenfield Biking Committee with the City Planning Department and have initiated conversations to establish such a group.
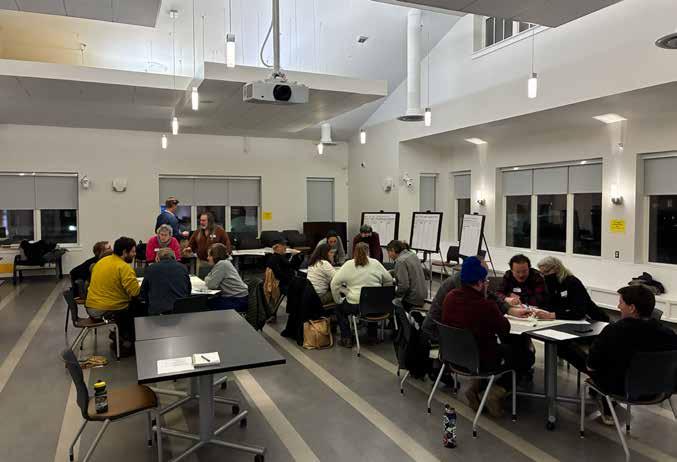
Looking ahead, Greenfield is experiencing a growing use of electric bicycles (e-bikes) as part of its evolving transportation system. According to Strava, in 2025, 3.6% of rides recorded in Greenfield were on e-bikes. In 2021, e-bikes represented less than 1% of all cycling activities.
E-bikes are increasingly recognized as an effective tool for reducing greenhouse gas emissions and decreasing reliance on personal vehicles. The American Planning Association has identified e-bikes as an emerging mobility option that can expand access to cycling by enabling longer trips and reducing physical barriers. In addition, state incentive programs are helping eligible residents offset the cost of purchasing an e-bike, making this mode of transportation more accessible to a broader range of users.
At the same time, community members in Greenfield have expressed concerns regarding e-bike speeds and appropriate locations for their use, particularly in shared spaces with pedestrians and traditional cyclists. As e-bike adoption continues to increase, the city will need to consider policies, education efforts, and infrastructure designs that support their safe integration into the transportation network. Future planning efforts should prioritize collaboration among cyclists, pedestrians, and other stakeholders to establish clear expectations for e-bike use and identify the routes where e-bikes may be most appropriate.
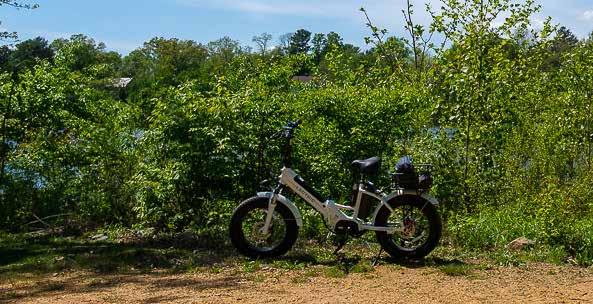
In August of 2022, the State of Massachusetts signed into law a definition of electric bikes.
CLASS 1: Bicycle equipped with a motor that provides assistance only when the rider is pedaling, and that ceases to provide assistance when the e-bike reaches 20 mph, with an electric motor of 750 watts or less.
CLASS 2: Bicycle equipped with a throttle-actuated motor that ceases to provide assistance when the e-bike reaches 20 mph, with an electric motor of 750 watts or less.
CLASS 3: undefined
Under Massachusetts law, e-bikes are allowed on roadways and in bike lanes as well as on bikeways and bike paths. However, local jurisdictions may regulate and prohibit their use on bikeways/bike paths, but only after a public notice and public hearing. E-bikes are not allowed on natural surface trails, unless they are specifically permitted by the local jurisdiction/land owner. Cyclists should check local regulations or trail signs to confirm what is allowed.
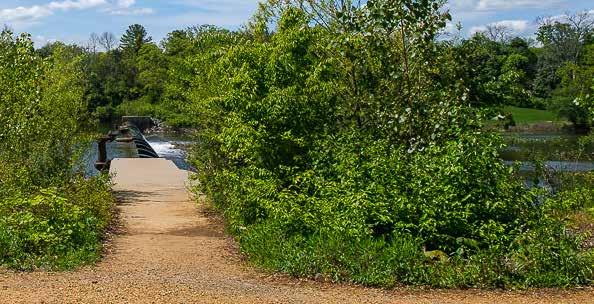
Land Acknowledgement. (2018, March 13). Nolumbeka Project. https://nolumbekaproject.org/pocumtuckhomelands-festival/
Twarog, E., Twarog, A., Larose, A., & Resident, G. (n.d.). COMPLETE STREETS PRIORITIZATION PLAN SUMMER 2017
Retrieved March 24, 2026, from https://greenfield-ma.gov/Document_Center/Department/Planning%20 &%20Development/Complete_Streets_Prioritization_Plan_2017.pdf?t=202302170953260
BIKEWAY SELECTION GUIDE. (2019). https://highways.dot.gov/sites/fhwa.dot.gov/files/2022-07/fhwasa18077.pdf
Bike Infrastructure | Urban Plan. (2025, March 24). Urban Plan. https://urbanplan.uli.org/resources/overview/keytopics/bike-infrastructure/
Pedestrian & Bicycle Information Center. (2026). Pedbikeinfo.org. https://www.pedbikeinfo.org/resources/ resources_details.php?id=5083
Bike Route Wayfinding - NACTO. (2025, May 21). NACTO. https://nacto.org/publication/urban-bikeway-designguide/designing-bikeways-for-all-ages-and-abilities/bike-wayfinding/
Bicycling Planning – FRCOG. (2026). FRCOG.org. https://frcog.org/project/franklin-county-bikeway/
Vision Zero. (n.d.). Www.nyc.gov. https://www.nyc.gov/content/visionzero/pages/
CDC. (2024, July 11). Vision Zero. Transportation Safety. https://www.cdc.gov/transportation-safety/vision-zero/ index.html
Greenfield Open Space and Recreation Plan. (2021). https://greenfield-ma.gov/Document_Center/ Department/Planning%20&%20Development/Open-Space-and-Recreation-Plan-2021-DCS-approved. pdf?t=202302171001310
Sustainable Greenfield. (2014). https://greenfield-ma.gov/Document_Center/Government/Sustainable%20 Greenfield%20Implementation%20Committee%20(SGIC)/Sustainable-Greenfield--Master-Plan-2014. pdf?t=202308041002590
FRCOG Population Projections. (May 2024). UMDI_V2024_Long-Term_Popu ... A_Totals_2010-2050_a.xlsx
Welcome to City of Greenfield, MA. Official Zoning Map. (2023). Greenfield-Ma.gov. https://greenfield-ma.gov/ departments/planning_and_development/zoning_and_ordinance_info.php
Quarterly Mayor’s Message - January 2026. (2026). Greenfield-Ma.gov. https://greenfield-ma.gov/news_detail_T4_ R420.php
Slopes and gradients. (2025). CHIPS. https://cyclehighways.eu/web/html/slopes-and-gradients.html
American Public Health Association. (2024). Environmental Justice. Www.apha.org. https://www.apha.org/Topicsand-Issues/Environmental-Health/Environmental-Justice
Safe Routes To School. (2019). Mass.gov. https://www.mass.gov/safe-routes-to-school
Greenfield Begins Sidewalk Condition Assessment. (2023). Greenfield-Ma.gov. https://greenfield-ma.gov/news_ detail_T4_R346.php
Census profile: Greenfield, MA. (n.d.). Census Reporter. https://censusreporter.org/profiles/16000US2527060greenfield-ma/
Franklin County Regional Transportation Plan (2024) – FRCOG. (2025, June 3). Frcog.org. https://frcog.org/ publications/franklin-county-regional-transportation-plan-2020/
Wedegartner, Mayor Roxann. D. (2023). Downtown Greenfield Revitalization Plan [Review of Downtown Greenfield Revitalization Plan]. https://greenfield-ma.gov/
Bicycle Level of Service calculator. (2016). Rideillinois.org. https://rideillinois.org/blos/blosform.htm
New Visions | Bicycle and Pedestrian Action Plan. (n.d.). Retrieved February 2026, from https://www.capitalmpo. org/wp-content/CRTC/images/new_visions/APPENDIX_E_BLOS.pdf
Furth, P. G., & Mekuria, M. C. (2013). Network Connectivity for Low-Stress Bicycling [Review of Network Connectivity for Low-Stress Bicycling]. https://www1.coe.neu.edu/~pfurth/Furth%20papers/2013%20Network%20 Connectivity%20for%20Low%20Stress%20
PDDG Chapter 11 - Shared Use Paths. (2018). Mass.gov. https://www.mass.gov/info-details/pddg-chapter-11shared-use-paths
NACTO. (2012, June 27). Urban Bikeway Design Guide. National Association of City Transportation Officials. https://nacto.org/publication/urban-bikeway-design-guide/
“Street Design Manual | NYC Street Design Manual.” Www.nycstreetdesign.info, www.nycstreetdesign.info/.
Shared Street | Woonerf. (n.d.). Www.vta.org. https://www.vta.org/cdt/street-design-home-page/shared-streetwoonerf
BICYCLE AND PEDESTRIAN NETWORK PLAN UPDATE. (2025). https://www.portsmouthnh.gov/sites/default/ files/2025-06/Bicycle%20and%20Pedestrian%20Master%20Plan%20Update_Final_DRAFT_06162025.pdf
BFA Awards Database. (n.d.). League of American Bicyclists. https://bikeleague.org/bfa/award-database/
MassDOT. (2026). Greenfield Mohawk Trail (Route 2A) Concept Plans Alternative 1 [Review of Greenfield Mohawk Trail (Route 2A) Concept Plans Alternative 1].
City of Greenfield. (2024). West Main Street Protected & Elevated Bike Lane [Review of West Main Street Protected & Elevated Bike Lane].
Cammalleri, A. (2026, January 16). Homeless shelter, supportive housing on Wells Street in Greenfield slated for summer completion. Greenfield Recorder. https://recorder.com/2026/01/16/cso-greenfield-housing-project/ (2023). LARGEST EMPLOYERS [Review of LARGEST EMPLOYERS]. In BusinessWest. BusinessWest. https:// businesswest.com/
Most Hazardous Intersections in Franklin County Reports – FRCOG. (2013). FRCOG.org. https://frcog.org/ publications/hazardous-intersections-franklin-county-2011-2013/
Greenfield Awarded $37,830 MVP Action Grant to Build Climate Resilience. (2023). Greenfield-Ma.gov. https:// greenfield-ma.gov/news_detail_T4_R290.php
Center Loop - Temporary Protected Bike Lane | Chicopee, MA. (2023). Chicopeema.gov. https://www.chicopeema. gov/908/Center-Loop
Trail Etiquette Toolkit. (2026). Massachusetts Bicycle Coalition. https://www.massbike.org/trail_etiquette_toolkit
Brown, A. (2022, December 21). The Year of the E-Bike. American Planning Association. https://www.planning.org/ planning/2022/fall/the-year-of-the-e-bike/
Electric Bikes FAQ. (2022). Massachusetts Bicycle Coalition. https://www.massbike.org/ebikesfaq
Photos licensed by the City of Greenfield
Photos taken by project team
Google Maps Street View
“Bicycle wayfinding signage, I-90 Trail, Seattle” by joshua_putnam, CC BY 2.0. https://www.flickr.com/photos/ jputnam/9719042836/in/photostream/
“Greenfield High School, Greenfield Massachusetts” by Faolin42, CC BY-SA 4.0. https://commons.wikimedia. org/wiki/File:Greenfield_High_School,_Greenfield_MA.jpg
“Greenfield, Massachusetts” by Doug Kerr, CC BY-SA 2.0. https://www.flickr.com/photos/ dougtone/4225329354/in/photostream/
“Abernethy Bike Bus-10.jpg” by BikePortland, CC BY 2.0. https://www.flickr.com/photos/59878729@ N00/53707659316
“Woonerf, Kaptensgatan” by La Citta Vita, CC BY-SA 2.0. https://www.flickr.com/photos/la-cittavita/4765641644
“Pedestrian refuge island on Monroe Street at the Art Institute of Chicago” by Steven Vance, CC BY-NC-SA 2.0. https://www.flickr.com/photos/jamesbondsv/6144572797
““Wave delineator” protected bikeway barriers, by Bike Fixation. Temporary pilot project on Potomac Ave in Crystal City” by BeyondDC, CC BY-NC 2.0. https://www.flickr.com/photos/beyonddc/47350321631
“Bicycle Rodeo” by City of Greenville, North Carolina, Public Domain Mark. https://www.flickr.com/photos/ cityofgreenvillenc/50334705767/
“Delaware & Raritan Canal State Park Trail” by Khürt Williams, CC BY-NC-SA 4.0. https://islandinthenet.com/ the-delaware-and-raritan-canal-park-trail-on-two-wheels/v
Existing Conditions Bicycle Trails
Incidents Crash Level Data
Open Space Protected and Recreational OpenSpace
Sidewalks FRCOG_Sidewalks
Roads & Highways,
Barriers to Movement
Mass GIS https://www.mass.gov/info-details/massgisdata-bicycle-trails
MassDOT Crash Open Data
Portal https://apps.crashdata.dot.mass.gov/cdp/ extract
Mass GIS https://www.mass.gov/info-details/massgisdata-protected-and-recreational-openspace
ArcGIS https://www.arcgis.com/home/item.html?id=0 0f86a17c1ca4279a2c99376ec2edaa7
MassGIS-MassDOT Roads Mass GIS https://www.mass.gov/info-details/massgisdata-massgis-massdot-roads
Barriers to Movement, Public Transit Trains
Barriers to Movement Rivers & Streams
Slopes, Physical
Conditions Model Greenfield_LiDAR_ ma2024_western_dem_ J1318219
Slopes, Physical
Conditions Model Road Inventory 2023
Environmental Justice Environmental Justice Populations
Household Vehicle
Access Household Vehicle Access from 2020 Census
Population Density Population from 2020 Census
Mass GIS https://www.mass.gov/info-details/massgisdata-trains
Mass GIS https://www.mass.gov/info-details/massgisdata-2000-us-census-tiger-linework
NOAA https://coast.noaa.gov/dataviewer/#/lidar/ search/
ArcGIS
https://www.arcgis.com/home/item.html?id=3f 87999a6ac248debd488461efc889d0
Mass GIS https://www.mass.gov/info-details/massgisdata-2020-environmental-justice-populations
NHGIS https://www.nhgis.org/
NHGIS https://www.nhgis.org/
Public Transit RTA Bus Routes Mass GIS https://gis.data.mass.gov/ datasets/MassDOT::rta-bus-routes/ explore?location=42.061336%2C71.672058%2C7
Strava Heat Map Strava Strava https://www.strava.com/maps/global-heatmap
Physical Conditions Model MA Roads with average daily traffic of at least 500 vehicles
ArcGIS https://www.arcgis.com/apps/mapviewer/ index.html?layers=81e05c52d45b4bd6b132f34 a7e9fa91b
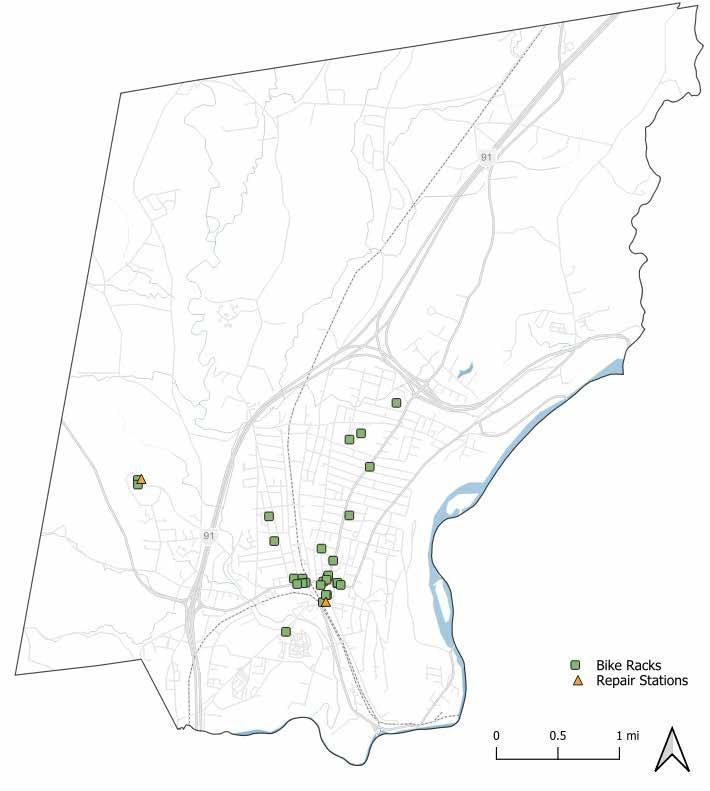
Observed Bike Racks & Repair Stations
Summary of the ten prioritized bike infrastructure projects identified in the 2017 Complete Streets
Prioritization Plan.
Facility Type Street Extent Details Recommendation Completed?
On-Street Bike Facility Allen Entire Extent
Side Path Colrain Road
On-Street Bike Facility Colrain Street
From College Dr roundabout to Mowhawk Trail
From Main St to roundabout at Colrain Rd
On-Street Bike Facility River / Mill Entire Extent
Stripe bike lanes (or shared lane markings where the roadway width is <30 feet)
New sidewalk on west side of roadway and striped bike lanes. (Low cost option could be striped pedestrian lane in west shoulder of road, provided there is space for 10’ travel lanes and bike lanes in each direction)
Include a mix of bike lanes where space is available, shared lane markings and signage.
Narrow travel lanes to 11’ and stripe bike lanes
Allen Street is an important east-west connection and currently has fastmoving motor vehicle traffic with short sight lines due to the RR bridge
Yes
On-Street Bike Facility Beacon Street High St to Parkway St
On-Street Bike Facility Main / 2A
Stripe bike lanes and sharrows at intersection approaches
From Shelburne Rd at River St to High
Stripe bike lanes and/ or enhanced shared lane markings
Need to improve pedestrian and bike access from commercial area on the Mowhawk Trail to GCC
Improves bicyclist connection between downtown and GCC.
Enhanced cyclist safety and comfort.
This is an important east-west bike connection and there are currently no bicycle facilites on this stretch
Critical bike connection through downtown Greenfield with access to businesses and other institutions.
Yes
Yes
Yes
No
No
Facility Type Street
Extent
Details
On-Street Bike Facility Conway
From Nash’s Mill Rd to Main St
On-Street Bike Facility Davis
From Silver St to Main St
Stripe bike lanes. Consider adding 4-way stops at the following intersecions: Spruce St, Grove St, Devens St
Construct bikeboulevard style treatment on Davis Street. Consider adding 4-way stops at the following intersections: Norwood, Pierce, Walnut / Pond, and Pleasant.
Recommendation Completed?
This is an important north-south corridor and represents one of the most comfortable crossings of I-91 for mant Greenfield residents. This roadway includes heavily traveled pedestrian and bicycle routesm with access to Green River Swimming and Rec area No
Establishing this important north-south connection as a comfortable alterative to Federal Street will encourage more widespread use of cycling for commuting and errands and fill a key gap in the existing bicycle network No
Bike Path
Connector Elm
From the intersection of Elm Terrace and Elm Street, through the existing break in the fence between the Franklin County Jail and the private residence @ 150 Elm Street, through to the Greenfield bike path
Bike Boulevard Hope Entire Extent
Construct paved bke path connection
No
Bike boulevard-style treatment
Desireable bicycle and pedestrian connection to Greenfield bike path location.
Significant increase of motor vehicle volume due to construction of new courthouse. This is an important north-south corridor for bikes and represents a comfortable alternative for north-south travelling bikes to avoid the Bank Row at Mill St. underpass. No

The City of Greenfield is exploring ways to develop a connected network of bike routes to encourage safe and comfortable cycling. Students from the Conway School evaluated existing bike infrastructure, roadway conditions, and community input to identify areas where improvements would be most impactful to the community. The student team sited potential bike routes by conducting an indepth analysis of both physical and social conditions. The resulting plan outlines a comprehensive bike network for Greenfield. A bicycle network could encourage more Greenfield residents to choose cycling for transportation and recreation by improving mobility, safety, and connectivity.

The Conway School is the only institution of its kind in North America. Its focus is sustainable landscape planning and design and its graduates are awarded a Master of Science in Ecological Design degree. Each year, students from diverse backgrounds are immersed in a range of real-world design and planning projects, ranging from sites to cities to regions.