At Home in Deerfield
A Zoning & Housing Analysis



































Prepared for the Town of Deerfield
The Conway School Winter 2026

Annika Lackner • James Riley • celine voyard



The Conway School Winter 2026
Annika Lackner • James Riley • celine voyard
The Conway School Winter 2026
We are extremely grateful for all the Deerfield town officials, but especially, Alex Galloway, whose guidance, kindness, and help made this a pleasure to work on.
We would like to thank our core team: Rachel Blain, John Cunningham, Lili Dwight, Andrea Leibson, Pam Predmore, Kathy Sylvester, and Kathleen Watroba. Their insight and efforts were and are extraordinary.
Thank you to dear friends Adriana Oyola-Vivas and Florita Coto-Tristan for your time and clarity in assisting with survey translation. To the residents of Deerfield who took the time to fill out our survey and attend our community events, thank you.
Special thanks to Emily Gaylord and Emily Johnson for offering additional support in our visualization process.
We would like to thank the faculty, staff, and fellow students for their irreplaceable support and guidance.
To address concerns about housing affordability and availability in Franklin County, in 2024, the Franklin Regional Council of Governments (FRCOG) released recommendations for municipalities to adopt in order to increase housing production. FRCOG shared specific recommendations for adjusting the town of Deerfield’s zoning bylaws including: modifying ADU bylaws to comply with state law; adjusting the minimum lot size and frontages in the Central Village Residential District (CVRD) for multiple types of housing; allowing townhomes by right in the CVRD; allowing duplexes by right in all residential districts; and reducing minimum parcel sizes in the Residential-Agricultural district that are served by sewer. This report examines what these zoning recommendations could mean for the town of Deerfield in regards to its community, ecological resources, and potential status as a Housing Choice Community (a Massachusetts state designation).
First, the report looks at existing zoning regulations. Currently, the majority of Deerfield is zoned to allow singlefamily housing by right. The two primarily residential districts in Deerfield are the Residential-Agricultural (RA) and Central Village Residential Districts (CVRD). The RA District is rural, with many farms and low density singlefamily development. The CVRD is denser; this district is where most multi-family housing is located in Deerfield, and it is closer to the downtown small business district and amenities such as the library and Town Hall.
Deerfield is a historically agricultural community, and residents value the “rural character” of their town. This agricultural history relates to the presence of prime farmland soils in town, especially along the Deerfield and Connecticut Rivers. North Deerfield is especially suitable for agriculture, being flatter and having richer soil than South Deerfield. Key ecological communities also exist along the Deerfield and Connecticut Rivers. In addition to the rivers running north and south through the town, major roads and transit lines also run north to south. Town sewer only exists in the CVRD in the south and in Old Deerfield in the north.
Existing conditions suggest that South Deerfield, particularly the CVRD, could be ideal for further housing development. In order to test this assumption, several maps were made according to a typology that ranked characteristics such as ecological constraints, infrastructure, physical topography and slope, and alignment with density patterns. This suitability analysis provided conclusions that matched the existing conditions, indicating that the CVRD is most suitable for further housing development, as is a small area near Old Deerfield.
Several strategies, such as infill, conversions, and “missing middle” housing, can help Deerfield expand housing options while maintaining its rural character. Rather than large-scale development, these approaches focus on incremental growth within existing neighborhoods and village centers.
Residents shared their perspectives on these strategies through participation in two community events, a survey, and a presentation for the Zoning Board of Appeals. Community feedback revealed that rural character is valued by many residents, but this does not preclude openness to increasing housing in the town.
The analysis and community engagement process drove exploration of specific tools and scenarios that could support increased housing in Deerfield, these include zoning for duplexes by right in residential districts; reducing minimum lot size, setback, and frontage requirements; allowing townhouses by right in certain areas; and allowing mixed-use housing in commercial districts.
NatioNal HousiNg sHortage
There is undeniably a housing crisis in the United States. Across the country, housing prices have risen about sixty percent since 2019, but average wages have not kept pace, leading to historically low housing affordability (Farberov). Furthermore, the country is short about 8.2 million housing units, and that number is predicted to reach 9.6 million by 2035 (McKinsey & Company). Academic journals, surveys, studies, institutions, and news agencies all report similar alarming statistics.
Massachusetts is no exception to this national trend; statewide, in fact, the crisis is worse. For every 100 extremely low-income renters in Massachusetts, only forty-four affordable and available homes exist, meaning that the state is short at least 183,000 units, and that’s only considering one income category (Stocker). The vacancy rate in Massachusetts is around 1.6%–an historic low–meaning extremely high competition for homes (Commonwealth of Massachusetts).
DeerfielD’s HousiNg NeeDs
Like any town, Deerfield has its own specific relationship with housing. According to Massachusetts Housing Partnership (MHP), demographics of Deerfield skew older, predominantly white (84.3%), and relatively affluent. The majority of residents own their homes, while only around 20% rent.
The population growth remained relatively stagnant in the past thirty-five years, increasing only from 5,018 in 1990 to 5,176 in 2023. At the same time, the population is aging, with about 28% of residents over the age of 65 and 33% between 50 and 64. Much of the town’s housing stock is also older, with 62% predating the 1980s, and only 4% of new housing having been built since 2010. Taken together, these trends suggests a need for not only more recent housing development but also flexible housing options.
Current zoning bylaws do not reflect Massachusetts
state regulations on accessory dwelling units (ADUs) and may be out-of-date with respect to other housing types. Many community members have expressed concern that Deerfield lacks sufficient housing stock to accommodate seniors wanting to downsize and agein-town.
Deerfield does fit a general trend in its region. In Franklin County, the vacancy rate is around 0.7%, and the Massachusetts Executive Office of Housing and Livable Communities (EOHLC) estimates that the region may need as many as 1,100 new homes by 2035. (Commonwealth of Massachusetts) While Franklin County needs more housing, due to the rural nature of the county, development tends to be slower due to less funding and more limited infrastructure. Therefore, decision makers in the county must be discriminating about where to invest its limited resources.
Franklin Regional Council of Governments (FRCOG) is a regional service organization serving the 26 municipalities of Franklin County, Massachusetts. In this capacity, it makes suggestions for changes in housing policy and zoning bylaws. Detailed on the next page, FRCOG has made suggestions specifically for Deerfield to aid in affordable housing production.
This report is an analysis and visualization of the effects of the zoning changes suggested by FRCOG for Deerfield’s housing, community, and ecological resources. It seeks to reflect community voices and needs and explores the tools, housing types, and the limitations and implications of zoning changes on the land.
In 2024, FRCOG released a regional housing plan, which identified specific constraints, challenges, opportunities, and recommendations for the future of the housing landscape of six towns in Franklin County. The report details how Franklin County, being the most rural county in Massachusetts, often faces disproportionate housing burdens, as housing deemed affordable in other parts of the state is often out of reach for Franklin County residents:
There is a net affordable housing shortage of 3,020 units in Franklin County affecting extremely low-ncome, very low-income, low-income, moderate-income, and middle-income households, with a specific shortage that is greatest in the extremely low-income and lowincome price brackets (FRCOG, “Regional Housing Plan 2024,” 5).
The plan lays out three recommendations for housing development: encouraging community desire for affordable housing and housing development through education and conversations; establishing local material support for housing development; and advocating for policy change, on the state level, to fund the planning and construction of housing in the towns (FRCOG, “Regional Housing Plan 2024,” 6).
The plan further identifies three key goals for the future of housing in Franklin County:
• Preserve existing housing
• Maintain existing affordability of housing
• Create a variety of new housing
FRCOG has made several particular recommendations for adjusting Deerfield’s zoning bylaws to aid in housing production. These recommendations include: modifying ADU bylaws to comply with state law; adjusting the minimum lot size and frontages in the Central Village Residential District (CVRD) for multiple types of housing; allowing townhomes by right in the CVRD; allowing duplexes by right in all residential districts; and reducing
parcel size in areas of the Residential-Agricultural district that are served by sewer.
This report examines what these zoning recommendations could mean for the town of Deerfield in regards to its community and ecological resources with FRCOG’s three key goals in mind.
DeerfielD’s ZoNiNg DistriCts aND Bylaws
Deerfield Zoning Districts
RA Residential Agricultural
CVRD Central Village Residential District
C-I Small Business
C-II
Commercial
I Industrial
PI
Planned Industrial
EPD Expedited Permitting District
Zoning is typically an attempt to capture the broad patterns of a place and shape what it could become. In Deerfield, housing development has centered around two main distinct residential districts, the Residential-Agricultural District (RA) and the Central Village Residential District (CVRD). Both have different histories that are reflected in what is currently allowable in terms of units and other landuse patterns.
Most of Deerfield is zoned to allow for single-family housing by right, with the exception of the industrial and planned industrial districts (I and PI on the maps) which do not allow housing. The Central Village District (CVRD) is the only section in Deerfield that is zoned for two-family housing by right. This relatively small area is the most densely populated section of town. Multi-family (more than two) homes are allowed only by special permit in portions of South Deerfield (CVRD, EPD, C-I). Housing that
is “incidental to commercial or industrial use” is allowed in the small business district (C-I) and the commercial district (C-II).
As is the case with many older communities, there are several non-conforming parcels–smaller lot sizes than current zoning would allow–in the Central Village Residential District (CVRD) and the Residential-Agricultural District (RA). These parcels typically date back to housing production before zoning was first instituted in Deerfield in 1966. Thus some areas are denser than zoning allows, and these areas are older. They’ve been part of the Town’s character for some time. Updating zoning bylaws to match these densities is one tool for encouraging housing production.
If the Town wants to follow FRCOG’s recommendations around mixed-use development, the Small Business District (C-I) and the Commercial District (C-II) both of which have established businesses may be important options for housing development as bringing housing into these districts may be a more viable solution than bringing in businesses to current residential districts. For this reason, they are included in this report but are not the primary focus.
The following pages share information about housing types allowed in each district, and about the form of each district.
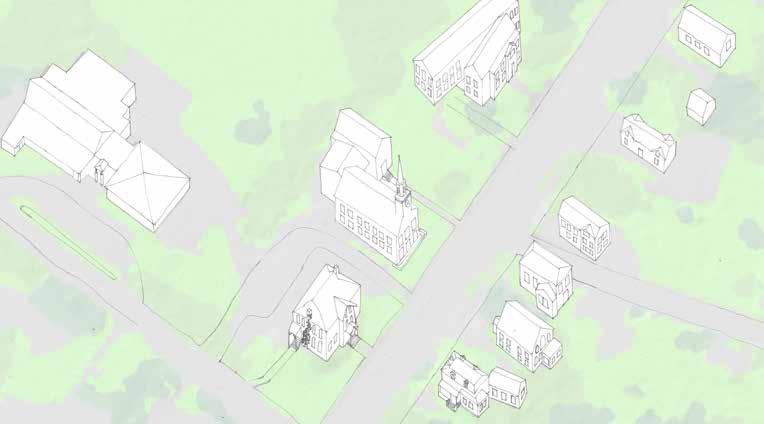
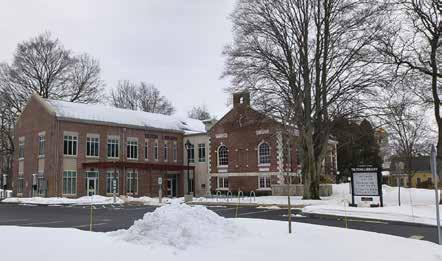
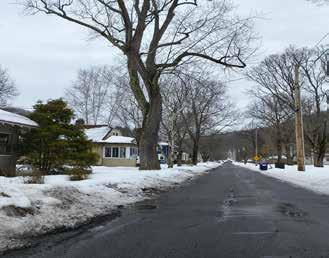
The Central Village Residential District (CVRD) is one of the two primarily residential districts in Deerfield. Unlike the RA it is a walkable district and contains many community resources and multiple transit stops. Sugarloaf Street and N. Main Street run roughly north and south with streets running east and west often to dead ends. This creates innately quiet streets with traffic running only to and from homes.
Land Uses and Amenities of Note:
• Town Hall
• Tilton Public Library
• Post Office
• Public Schools
• Cultural Hubs
• Places of Worship
H ousing A llowed in t H e CVR d Allowed By Right Allowed by Special Permit
• Single Family
• Two-Family
• Flexible Development
• ADU in Single Family
• Multi-Family Dwelling
• ADUs that are attached
• ADUs that are detached
• Dwelling incidental to commercial or industrial use
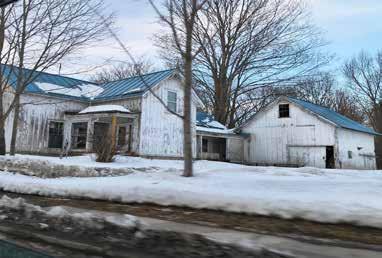
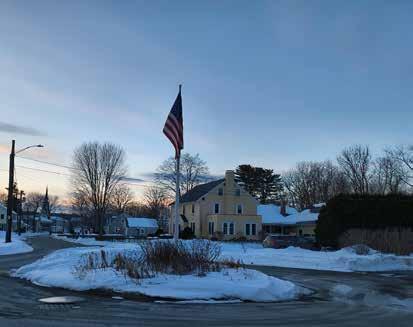
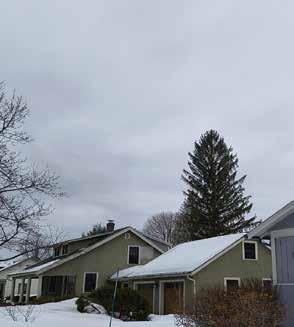
Examples of Homes in the CVRD

The Residential-Agricultural District (RA), which makes up most of Deerfield, is one of the two primarily residential districts in Deerfield and comprises very large parcels. There are some exceptions where small parcels are clustered together along roads and at major road intersections, most notably within Old Deerfield in the north.
Land Uses and Amenities of Note:
• Old Deerfield
• Deerfield Academy
• Eaglebrook School
• The Bement School
• Mount Sugarloaf
• Restaurants, Bakeries, and Confectionaries
• Various Farms
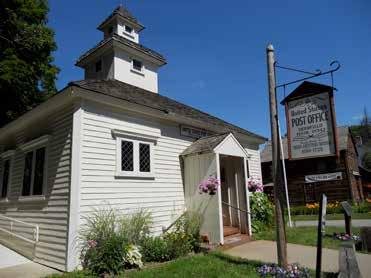
Allowed By Right
• Single Family
• Flexible Development
• ADU in Single Family
H ousing A llowed in t H e RA
Allowed by Special Permit
• ADUs that are attached
• ADUs that are detached

Not Allowed
• Two-family dwelling
• Multi-family dwelling
• Dwelling incidental to commercial or industrial use
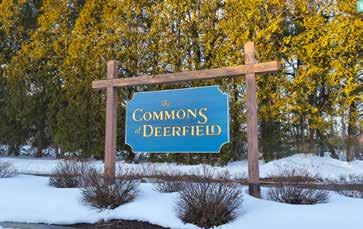
The RA has some housing developments
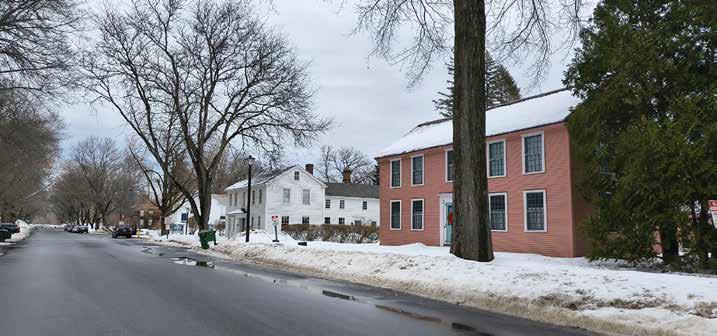
The RA contains historic buildings and private schools
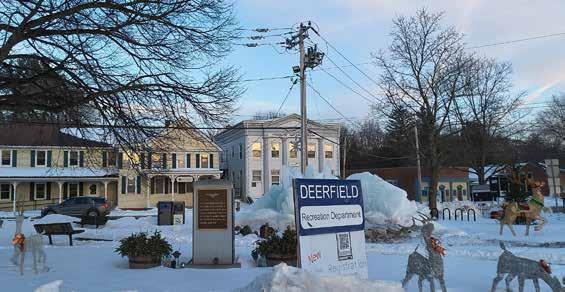
Nestled in the crook of the CVRD’s central space, just south of Town Hall, the Small Business District (C-I) is a transitional space between the more commercial districts around Route 5 and10 to the west and the residential spaces to the east. It is home to community spaces of leisure and business and benefits from its walkable proximity to residential spaces.
Housing Allowed in the Small Business District (C-I)
Allowed By Right
• Dwelling incidental to commercial or industrial use
• ADUs in Single Family
Allowed by Special Permit Not Allowed
• Multi-family dwelling
• Single Family
• Two-Family
• Flexible Development
• ADUs that are attached
• ADUs that are detached
Land Uses and Amenities of Note:
• Mass General Brigham, Family Practice
• Restaurants
• Berkshire Brewing Company
• Various shops
• Banks
• Hotel Warren (Mixed-Use Housing)
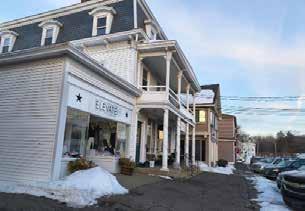
Local buisnesses and shops define the district
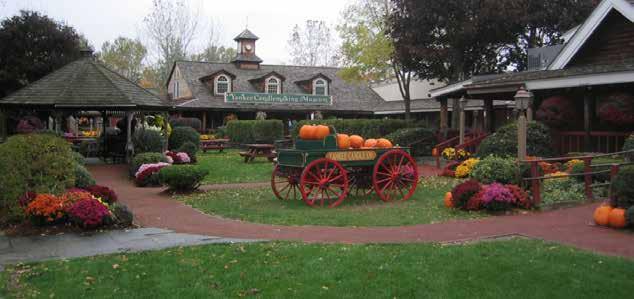
The Commercial District (C-II) exists in three major parts, two in South Deerfield and one in the northeast near the railyard. The two southern sections border the Small Business District and contain some of Deerfield’s frequently visited non-historic tourism locations.
H ousing A llowed in t H e C- ii
Allowed By Right
• Dwelling incidental to commercial or industrial use
• ADUs in Single Family
Allowed by Special Permit
• None
Land Uses and Amenities of Note:
• Yankee Candle
• Red Roof Plus
• Long River Produce Mart
• Magic Wings Butterfly Conservatory
Not Allowed
• Single Family
• Two-Family
• Multi-family
• Flexible Development
• ADUs that are attached
• ADUs that are detached

Allowing for the increase of housing may help many different kinds of residents stay in town and for more people to join the Deerfield community. Particular populations face distinct barriers and have needs that certain housing types can meet. The following groups should have special consideration and be centered when housing decisions are made:
Deerfield is an older town with a higher-than-average percentage of residents over the age of 65. As residents grow older in Deerfield their housing needs change. Seniors may find themselves living in too large a house, too far from resources and amenities, and too isolated from the community. Living densely, in smaller, more affordable and accessible homes near public transportation and walkable resources may improve quality of life for many seniors.
The Ad Hoc Senior Housing Committee, a dedicated and hardworking group of Deerfield residents, is committed to finding more affordable housing for this population and committee members have contributed their time, work, and feedback to this report. These issues around affordable senior housing are not new, but finding solutions and strategies to fix them is urgent and immediate.
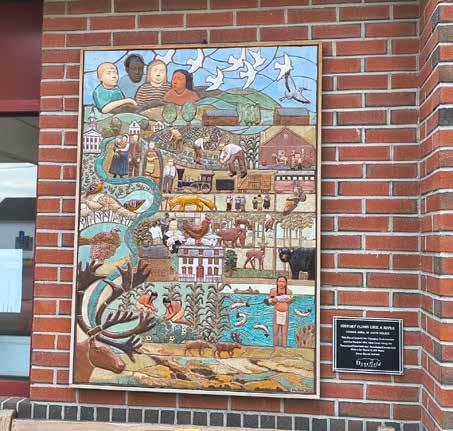
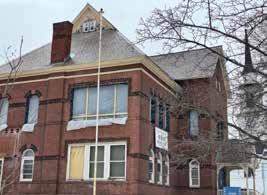
Similarly to seniors, residents with disabilities may have particular housing needs that are not currently being answered by Deerfield’s housing stock. While accessibility extends past the home and into the wider community, those with particular mobility needs, which includes some seniors, may require particular housing types (see Housing Typology).
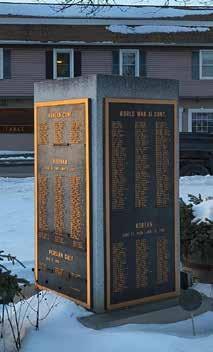
Like many communities, Deerfield is proud of its veterans. Though veterans comprise ten percent of the population, they, and their families, do not always receive the treatment they deserve. While there are currently nationwide, statewide, and regionally-specific services for veterans, and veteran homelessness is at a record low, veterans face housing insecurity at a higher-than-non-veteran rate. Thinking about the types of housing that would benefit veterans is important to the community and that is reflected in parts of this report (Town of Deerfield).
Deerfield’s history as an agricultural town has meant that many of the residents have been farmers. Deerfield has always relied on the labor of immigrants and migrants to produce more than sustenance farming. Today, large established multigenerational farms require workers that may or may not live in the community they work in. Likewise, young farmers trying to find land of their own may find it difficult to both live and work in Deerfield with current housing stock. Residents, in core-team meetings, surveys, and community engagement meetings, have mentioned that they would like to see more housing opportunities for those who work on Deerfield farms.
A common community sentiment (see Community Feedback) is the desire to make housing more affordable for those who work in Deerfield, particularly in government, community resource, and school-related jobs. The regional schools and several large private educational institutions in Deerfield benefit not just the town but also surrounding communities. Some teachers and other workers, who are committed to the community in a deeply personal way, do not currently but should have the opportunity to live in Deerfield.
Many families, particularly young ones, can struggle to find homes especially in a tight housing market like Deerfield has. In order to attract new families who can grow and contribute to the fabric of the community, more housing, and more diverse housing, is required.
While statistics differ on the size of the Latino population in Deerfield, Latino residents are the largest minority group in town and have been historically important to the town’s agricultural history (see Community Labor History). Latino residents or those coming into the community do not necessarily require particular housing types or require the same housing types as other populations on this list; however, increasing housing diversity can lead to increasing diversity in the community.
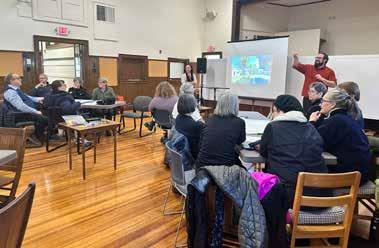
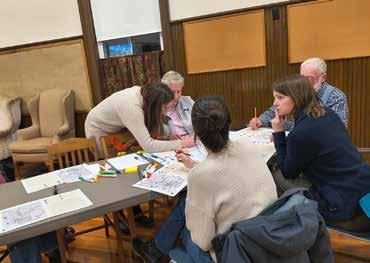
From January through March 2026, a core team of community members met weekly with Conway students to clarify and explore the process of visualizing and analyzing the effects of potential zoning changes to Deerfield. In addition, students facilitated two public meetings and ran a survey to better understand the needs and wants of the community around housing. Efforts to notify the public included canvassing flyers for the events and distribution of the survey through social media groups and other organizations concerned about housing.
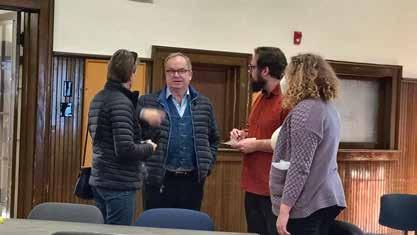
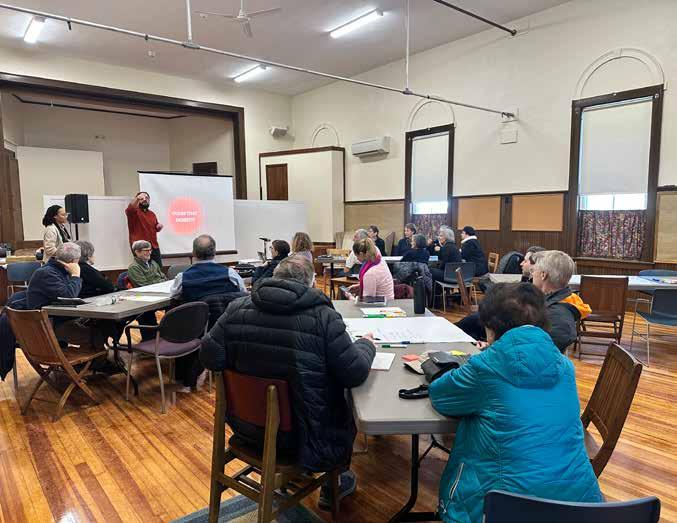
Residents engaged thoughtfully with activities and questions in community meetings.
The first public meeting occurred on February 9, 2026, and took place in two sessions, one at 2:00 PM and one at 6:30 PM. Times were chosen to allow for seniors who preferred not to drive at night as well as working residents and parents an opportunity to attend at convenient times. The first session was intended to gain a better understanding of community knowledge and preferences of housing types, and community density, and how those topics relate to different zoning districts.
Upon arrival, participants were asked to locate on a map where they live in Deerfield and indicate by colored sticker whether they rent or own their home. Participants who work in town or own rental properties they do not live in were asked to indicate that as well. This facilitated conversation and increased participants’ familiarity with looking at Deerfield in plan view while providing a visual representation of the geographic distribution of participants.
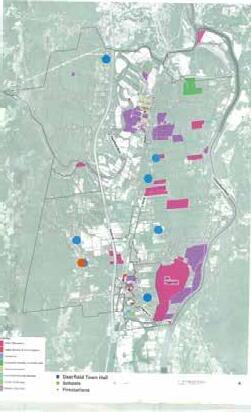
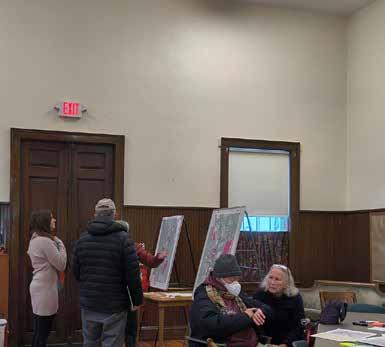
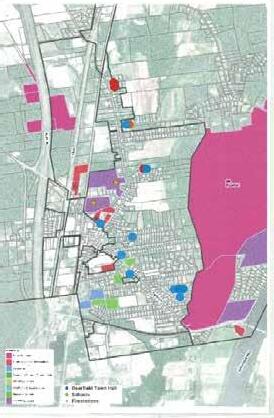
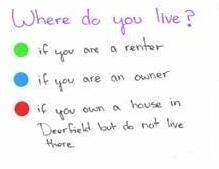
Participants gathered at four tables for the duration of the event. Conway students asked participants to answer the question, “What are your favorite things about living in Deerfield?” Participants were given a large sheet of paper with that question written on it, markers, post-it notes, and pens and were encouraged to answer the question collectively or individually as they felt comfortable. Common themes that came up were participants’ neighborhoods; their sense of community; the institutions and amenities of the town; a rural/agrarian character; the ability to participate in outdoor activities; and connection to regional resources.
Participants were asked to look at a series of pictures of different housing densities with examples of types of housing both in and out of Deerfield. Participants were then asked to rate their personal preferences of housing densities based on the pictures (knowing both the density and the appearance of the homes) and how much they would like to see them in their community. Participants were further asked to rate housing types while looking at pictures of structures currently in Deerfield.
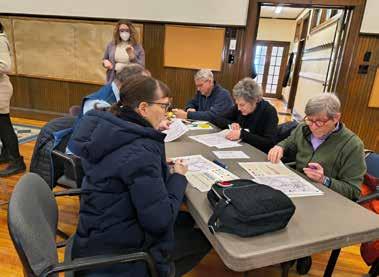
Participants showed a clear preference for mid-density units (15 to 20 units per acre) that were partially obscured from view from the street by trees and other vegetation and a clear dislike of high density units (35 to 60 units per acre) both obscured and unobscured and unobscured mid-density units (15 to 20 units per acre). There was no clear favorite in housing type, but single-family, duplex, mixed-use, and ADUs all were ranked highly by the majority of participants. This is consistent with survey results. Participants showed a clear dislike of housing with greater than eight units, which differed a little from survey findings.
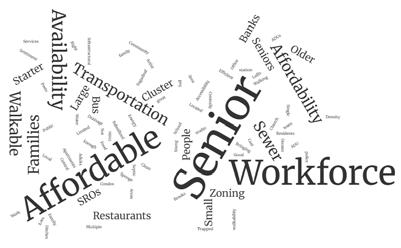
The facilitators then presented participants with a mapping activity. Participants were asked to list the three biggest issues concerning housing in Deerfield. They were also asked to map where 30 more units of housing could be placed in Deerfield using the housing types they ranked with these issues in mind. Participants were encouraged to complete the activity to the level that made sense to them: e.g., if they simply wanted to explain the three biggest issues and not do any mapping, they were allowed to do so. Some tables preferred to work as a group and others individually. The event concluded with a discussion of the mapping activity and overall takeaways of all the activities and discussion. The word cloud (top right) captures the most frequent words that appeared in the “top three issues” of the housing activity.
On March 19, 2026, the Conway Students presented a visual presentation and summarized version of a draft of this final report to the Deerfield Zoning Board of Appeals (DZBA) in their public meeting. Students began with a summary of community engagement and feedback they had received, sharing data from results of the survey. The students discussed the current state of housing in Deerfield with special attention to the sewer systems and their limitations. Further students shared broad patterns in the Residential-Agricultural District and the Central Village Residential District, and walked through current zoning of housing types in all the zones of Deerfield. Students repeated a version of the density-guessing
activity from the first community engagement meeting and shared information on housing typologies (singlefamily, mixed-use, duplex, and townhomes) that were popular housing choices from the survey. Students then discussed several of the tools that they analyzed for this project, introduced the topic of ADUs and discussed the versatility, benefits, and drawbacks of ADUs. There was an opportunity for the DZBA and other attendees to ask students direct questions and there was an open question time. Among the topics asked about were ADU cost and the feasibility of raised septic fields.
Rural character is an inexact phrase but one that is nonetheless useful to describe a certain set of qualities and signifiers that are important to the residents of Deerfield. In the first community meeting, residents defined rural character as something having to do with the landscape, the (food) resources, and the people in the community.
Development, if done correctly, need not eliminate these characteristics, but accentuate and support them while also supporting a community economically and culturally. That development can be shaped in a positive way through zoning and policy. There is a strong New England landscape tradition of common land for common good that has influenced historic land use patterns (Lapping 135). However, this tradition is challenged by the sometimes competing interests of residents, housing developers, farmers, and those concerned about the environment all looking to the land for some form of productivity. There may be a way to find the space for these needs, or to balance them, through careful planning and community engagement.
Those living in rural spaces for longer periods of time show stronger place attachment to “cultural features” of a landscape whether in use or in disuse, while most residents, regardless of length of time in an area, show “a preference for natural elements of landscapes, such as water features, woods, and wildlife, and for agricultural scenes such as stone walls and open fields” (Sadler 11). Visually, then, rural character may be defined by the signifiers of disuse and abandon, as much as those of currently-used spaces, at least for those who have been in a place for a long time. For every working farm there is a derelict tobacco barn, old stone wall, or new growth forest contributing to the feel of the place (Lapping 130-138). Rural character is not about the productivity of land alone. While an empty lot in an urban setting may indicate neglect or disrepair, an empty parcel in a rural setting may be essential to a view or a feeling, to the culture of a place. Sometimes the purpose of a place is not in its usefulness.
Ruralism has historically been defined in relation to cities. Even rural-centric studies have defined the importance of rural places in regards to their support of urban population centers, as “food-sheds” and viewsheds or places for cultural
tourism. According to Anna Jarita Sadler this is especially true of Western Massachusetts: “It cannot be overemphasized that the entire region benefits from its proximity to these natural and cultural landscapes”(14). Yet rural communities exist as their own independent places and spaces. Deerfield should look to ensure that it supports its community through its own grown food and houses its farmers in the town where they work. The duality of rural spaces is a central part of rural character. They are places in which people experiencing great poverty and feelings of being without choice exist side-by-side with those that have extreme privilege and wealth (Burnette 6). Rural places can be sustainable or they can be sites of extraction of natural resources. Due to their autodependence they can be isolating, especially to those who cannot drive or have mobility issues, like seniors, but they also can be collective spaces of tight-knit communities in which those same people feel connection. Rural communities are about people as much as they are about place. Housing decisions should take these dualities into account.
As opposed to urban development which can and must be more systems-based, rural development works best through people-focused plans. While re-zoning might make things possible, without financial support, best practice policy adoption, and empowering people to make the changes they know their community needs, it is unlikely that the market will fix Deerfield’s housing issues (7 Whittaker). In “Lessons in New Ruralism,” the authors point out “rural communities often do not have the right infrastructure to support people who want to age in place.” This is true in Deerfield. Currently, there are not enough housing options for seniors wishing to downsize their homes and live in more appropriate housing. Any future housing production plan or other material around development planning for Deerfield would benefit from a rural character conservation section or plan that clearly articulates a definition, a vision, measurable objectives, and policy areas for protecting rural character as Deerfield residents understand it. This would represent a significant commitment to Deerfield’s rural identity and to the desires of the community.
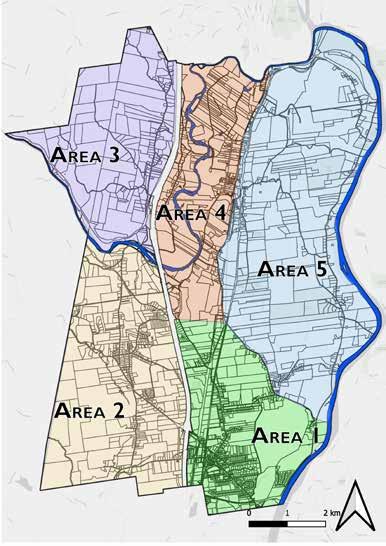
Reference Map Used in Survey
An online survey prompting residents to share info about their housing needs and preferences was open from February 20, 2026 through March 16, 2026 and had 114 respondents.
wHere iN DeerfielD Do resPoNDeNts liVe?
When asked where each respondent lived, a plurality of respondents reported that they live in southeast Deerfield. Areas 2 and 5 had nearly equal amounts of respondents as each other, 17.9% and 16.1% respectively, whereas areas 3 and 4 had the same percentage of respondents (8%).
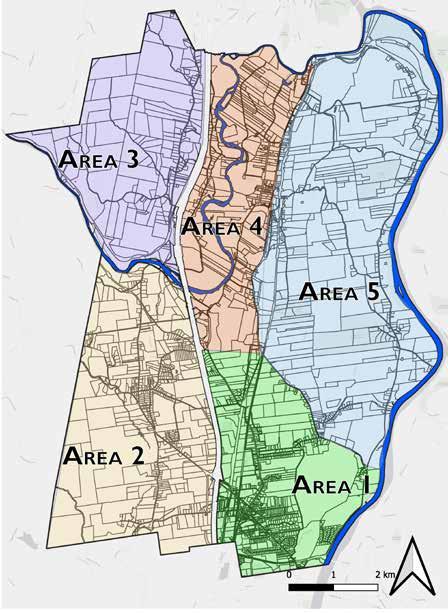
Area 2 - South of the Deerfield River, West of I-91
Area 1 - South of North Hillside Road/Hillside Road, East of I-91
Area 4 - East of I-91, West of Route 5/10
Area 5 - East of 5/10, North of North Hillside Road
Area 3 - North of the Deerfield River, West of I-91
The majority of respondents reported that they live in single-family homes that they own and more than 90% of the respondents were homeowners, with approximately 12% owning a condo. The majority of people living in Deerfield are homeowners, but even so, this response indicates that the survey is slightly skewed towards homeowner opinions as actual renter percentage is closer to 20%. This could bias the survey data in the direction of the concerns of homeowners over renters which may not capture the very real but minority position of nonhomeowners in Deerfield. More outreach should be conducted to reach renters to have their viewpoint better documented.
When asked about what their main concern is about their current housing situation, property taxes (72.1%) and utility costs (66.7%) were the most significantly popular answers with costly repairs (38.7%) and insurance costs (36.9%) being other major concerns. “Housing costs” (rent or mortgage) is the only other concern shared by more than 20% of respondents, while less than ten but more than five percent of respondents say that poor internet access and transportation access were concerns as well.
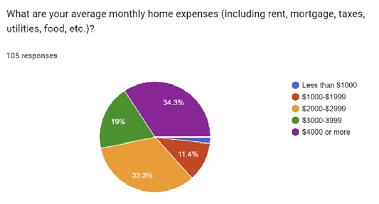
Almost 35% of respondents reported spending $4,000 or more per month on housing costs. Only roughly thirteen percent reported spending less than $2,000 on housing costs. When asked about the manageability of their home finances on a five-point scale with five being very manageable, few respondents said that expenses were either very manageable or very difficult. Only around twenty-one percent rated their finances as difficult (one or two on the scale). Taken as a bell curve, the trend skews slightly to the manageable side, meaning on the whole respondents do not feel they are struggling with housing cost.
When asked what “affordable” means to respondents, a few common themes came up. Some gave specific dollar amounts ranging from $1,200 to $2,500 for monthly rent and between $150,000 and $300,000 for purchase price for a house, a lower amount than most residents report paying.
Some respondents gave percentages ranging from 25% to 33% or equivalent fractions of their monthly income while others described the cost of housing using specific dollar amounts or average incomes (“$110,000” or “a median income”).
Other respondents described affordability as being related to having disposable income, having “a little left over,” not struggling, being comfortable, or being able to afford surprise costs and home repairs.
A few respondents were concerned about property taxes as an obstacle to affordability and suggested that some non-business tax-exempt landowners contributed to this obstacle by not paying their share of the tax burden.
Still, other respondents thought of affordability from the perspective of others. In particular, workers, lower-income residents, first-time home buyers, younger people moving into the community, and seniors were all mentioned as groups in need of affordable housing.
A few respondents made a distinction between “Affordable” as a specific policy term (subsidized housing) and “affordable” as something more personal and contextual to a specific place. It is likely that most residents, in conversation, would grasp this distinction. While most of the respondents’ views of affordability suggest that they would like to see both Affordable and affordable homes added to the housing supply, at least one respondent was hostile to the idea of subsidized housing.
Despite these different definitions of affordable, it has a clear importance to the respondents and was listed as the most important factor for residents if they were going to move.
“Affordable Housing” (capitalized) refers to deed-restricted government-subsidized housing units that are for low-income households, as defined as earning less than 80% of the Area Median Income, and is a legal governmental definition. Housing that is affordable (lowercase) refers to housing that costs 30% or less than a household’s income, which can fluctuate with market forces. In a wealthy community it is possible to have affordable housing without having “Affordable Housing” and it is vital to determine which, if not both, of the two a community wants.
wHat’s imPortaNt for moViNg?
Roughly half of the respondents cited types of housing, proximity to stores and services, and proximity to family and friends as important factors if they were to move. Proximity to schools, jobs, and transportation were less important with only roughly ten percent of respondents answering that they were important. One third to two fifths cited rural character, yard size, proximity to community centers, and number of bedrooms as important criteria in potential homes.
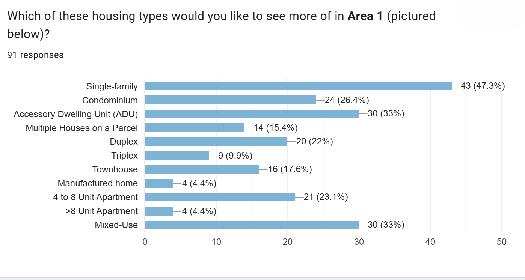
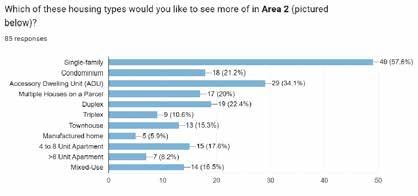
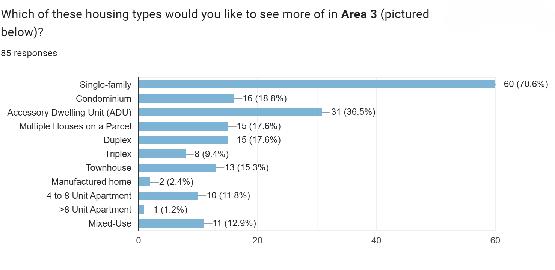
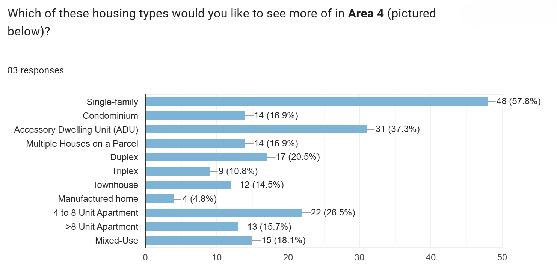
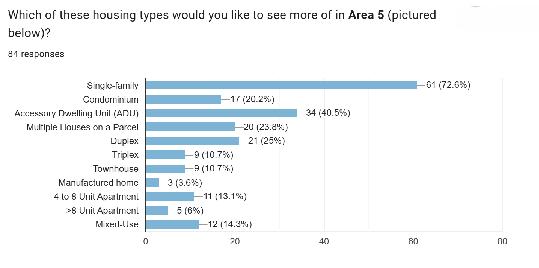
When respondents were asked what kinds of housing they would like to see more of in five geographic areas as shown in the map of Deerfield, single-family housing, condominiums, mixed-use housing, duplexes and ADUs were the most popular choices for Area 1. No respondents wanted greater-than-eight-unit apartments and few wanted triplexes.
Single-family housing is the most popular type of housing in all areas, but each area has a different combination of desired housing types, indicating that respondents are open to different areas of Deerfield supporting different mixtures of housing types.
wHo BeNefits from New HousiNg?
When respondents were asked who would benefit most from more housing being available, seniors, first-time home buyers, young adults,and families with children were the top choices. As roughly half of respondents were seniors, it is unsurprising to see that group selected. It is more noteworthy that the other groups, not necessarily represented by respondents, were identified. This indicates not just which current groups in Deerfield respondents knew personally and thought would benefit from housing but may indicate which type of resident that respondents were thinking of or wanted to see more of in the town.
wHo works wHere?
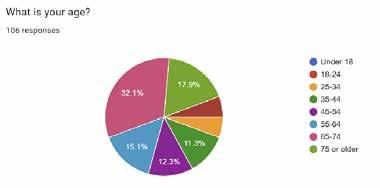
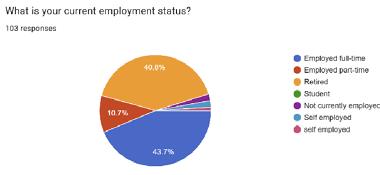
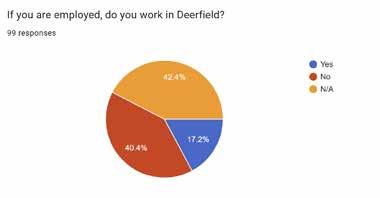
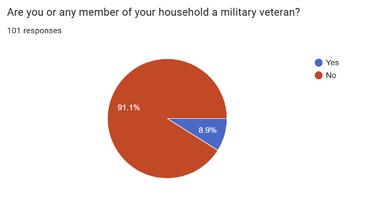
Half of respondents were older (sixty-five and above) and a plurality of respondents are retired. The majority of working respondents do not work in Deerfield. As some housing desires focus on Deerfield-worker housing, more research into labor statistics would be helpful in understanding patterns of work in the region. Education and related service jobs is the largest industry represented by respondents. About one-in-ten respondents are veterans or live with a veteran.
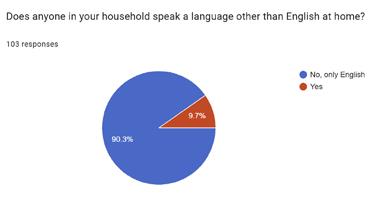
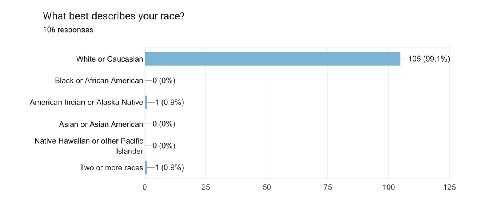
Nearly all respondents classify themselves as white and non-latino but nearly ten percent speak a language other than English in the home. Italian, French, and Ukrainian were the only languages listed by respondents.
wHat are tHe emPloymeNt seCtors?
Education is the highest represented employment sector. This may not be surprising given the number of schools both in Deerfield and in the region. However, future research should focus on reaching out to residents in other sectors to have a fuller picture of residents of Deerfield.
some fiNal tHougHts from tHe CommuNity Popular sentiments in the community meetings and survey are echoed in one community member’s answer to the final question of the survey, “Is there anything else you would like us to know about housing in Deerfield?” They shared:
It would seem that affordable housing solutions must involve the government and private sector working cooperatively without the outcome being maximized profit for the developer. Also, most folks in Deerfield would probably agree that maintaining our rural character is important, and therefore higher density housing development must be a goal towards this end. We also must continue to maintain some balance of industrial development so that tax revenue is not so reliant on homeowners. Finally, senior housing must be addressed so folks have a viable option to stay in Deerfield if they choose but have access to necessary care as they age.
Another community member added, “If we value the place we live, we should think long term so we can be good stewards of its future. To me, this means allowing housing development in sensible places without being overly restrictive, and considering zoning and permitting changes that make processes easier to navigate.” This too sums up a common and pragmatic view toward housing.
Some respondents were again concerned about taxes being too high, with larger land-owners not paying their fair share. Some respondents pointed to adding housing as a solution to high taxes as it would decrease the individual tax burden.
Other residents pointed to infill or building conversions as housing strategies that would help the housing crisis. In particular, some residents referenced a proposed plan to use the soon-to-be vacated town hall as a senior center.
Respondents discussed the benefits and drawbacks of different housing types. ADUs were suggested by some respondents as possibly helping the housing crisis, while others suggested they would only cause future issues.
Other respondents pointed to a “housing continuum” or a group of diverse housing types to answer to different needs.
Housing affordability was another common theme. Residents stressed the need for diverse, affordable housing, but insisted that any development should be sited near community services and small businesses. South Deerfield was suggested as a key site for denser development.
Respondents again emphasized particular groups of residents that need housing. Senior housing that is affordable, available, appropriate in size and accessibility, and adjacent to resources has a clear demand. Subsidized workforce housing and housing for (diverse) families were also mentioned by some responders. Respondents pointed to non-housing development and community design as working in tandem with housing development to provide accessibility for all residents.
Other respondents expressed frustration around the perceived inaction around housing. Some pointed to practical obstacles like permitting and the legal barrier to use engineered septic systems on new construction.
Some respondents were resistant to change, suggesting that no more development, housing or otherwise, is needed. Some respondents pointed to the greater use of services and resources that more residents would bring. At least one respondent acknowledged the need for housing but did not want to lose the character of the town.
This unease with change was reflected in the responses of other residents who did not want to lose open space. But others disagreed, suggesting that too much land was being limited in terms of development and that they wanted the Town to open up lots for buildings.
Each respondent expressed a desire and implied a vision for a better Deerfield. As the following analyses and scenarios explore possible zoning changes, these, sometimes competing, community concerns are a lens to view them through.
HousiNg as a resPoNse to laND
Although Deerfield did not pass zoning bylaws until 1966, settlement patterns were established long before that in response to their geography. From the slopes of geological features, to soils deposited from the Deerfield River, to the hydrological patterns of rivers, streams, and wetlands, residents are at the mercy of the land. As the people of Deerfield built their environment, they contributed to the conditions in which housing must be built. Housing decisions, ideally, are informed by realities of history and physical space.
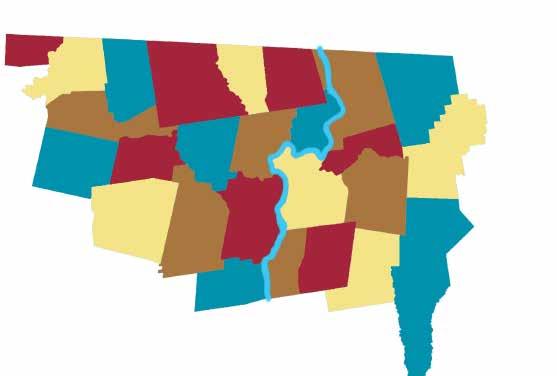
Regional Map of Franklin County
The convergence of the Deerfield River and the Connecticut River defines the northern section of town, with the area around Old Deerfield being a floodplain of the Deerfield River that is characteristically flat and fertile. To the west, the Deerfield River flows down from the foothills of the Berkshires. To the east, the Pocumtuck Ridge rises up, forming a barrier between most of the town and the Connecticut River. There is farmland in the valley between the Pocumtuck Ridge and the western bank of the Connecticut River. A relatively flat corridor runs down the central strip of Deerfield, but this flatness belies a complicated geological past that shapes Deerfield to this day.
regioNal CoNtext
Deerfield is located on the west side of the Connecticut River in Franklin County in Western Massachusetts. In addition to being part of the most rural county in Massachusetts, it is also part of the Pioneer Valley cultural region which stretches along the Connecticut River to the south and north in Massachusetts.
Deerfield’s connections to its neighboring communities is a boon in the form of shared community resources and cultural institutions. As one community member put it, Deerfield “is close enough to everything you could want, but far enough to be quiet.”
Topography of Deerfield
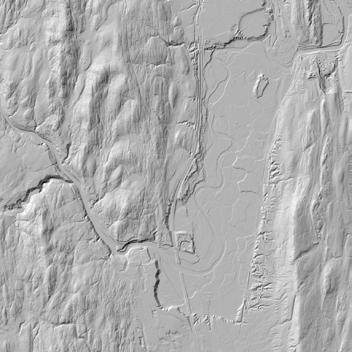


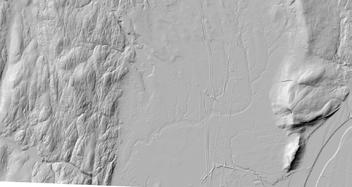


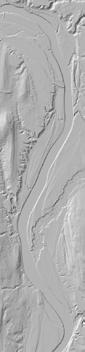




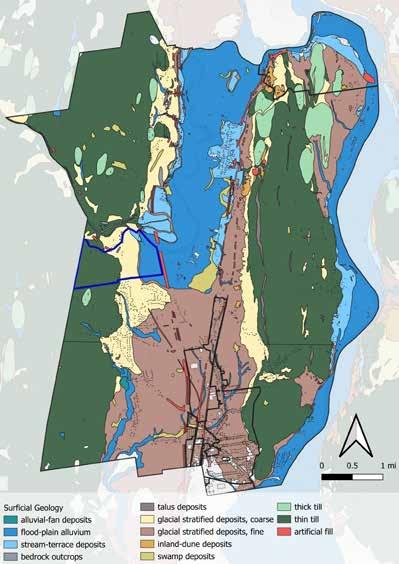
Deerfield has several distinct geological regions that help shape the town’s ecological relationships and its capacity for agriculture. While north Deerfield has historically maintained high-quality soil due to periodic and historical flooding of the Deerfield River, the floodplain that it sits on ends just north of the ridge that North Hillside Road and Lee Road run along today. This ridge, and flat land south of it, is the result of the 15,000-year-old Glacial Lake Hitchcock. The debris that was left behind from that lake which forms the surficial geology results in poorly drained soils in South Deerfield.
Because South Deerfield sits on these glacial deposits, it does not have the same rich soil that has been periodically



refreshed by the flooding of the Deerfield River. Instead, the glacial stratified deposits make the land in southern Deerfield less well drained and more susceptible to flooding, and they require more fertilizer and soil amendments to grow certain crops. Agricultural runoff containing these inputs and amendments is a concern for the natural water systems of South Deerfield. This indicates that South Deerfield may be a better place to develop housing as competition for prime agricultural land is less present. However, there is poor drainage in this area which can complicate housing development. Though a portion of South Deerfield has sewer (thus, septic suitable soils are not a limiting factor), the town center does experience flooding.
sloPe
Deerfield can be thought of as four north-to-south strips, with the western-most strip being mountains and hills, followed by a central strip of flat land in the Deerfield River valley and extending down to South Deerfield, then the Pocumtuck Ridge in the east, and finally the Connecticut River in the east.
Through the lens of slopes that are suitable for development, there is a clear reason that the majority of Deerfield’s historical settlement and growth is located
in the central strip of flat land. These above maps show parcels by slope, with green being the least steep and therefore most suitable for construction in terms of slope; slope alone does not show where it is best to build. Red parcels are the most steep and least suitable. It is worth noting that the slope criteria that make this land most suitable for development and construction also make it suitable for farming and agriculture.
Deerfield has many year-round and ephemeral wetlands, particularly in the central strip of the town and near rivers. During settlement, many of the wetlands were drained to make way for agriculture and this disruption has only increased as more development has taken place.
The Deerfield River contributes to the high-quality soil found in Deerfield through periodic, historical flooding. This flooding is also problematic for residents. In 2023, there was significant flooding in Deerfield, including damage to infrastructure and homes.
The northern portion of the CVRD and a portion of southwest Deerfield is in the Bloody Brook watershed. As development has occurred in this watershed, Bloody Brook has been altered to conform to a fixed course in portions. This results in flooding. As of last year, Deerfield has received approximately $220,000 in funding to mitigate some of these problems.
The Mill River flows southerly along a portion of Route 116 in western Deerfield and joins the Bloody Brook, just north of the Great Swamp. In addition to providing drinking water for Whately, the swamp has the largest black-gum-pin-oak-swamp white oak perched swamp, a critically imperilled community of plants, in the state (Commonwealth of Massachusetts). Therefore, any housing development that affects these watersheds needs to be done with awareness of the possible ecological ramifications to the swamp.
Decisions about new development in any of Deerfield’s watershed’s should take these historic issues and ecological realities into consideration. Adding more impervious
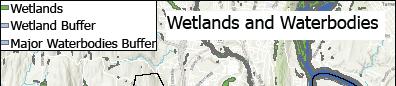
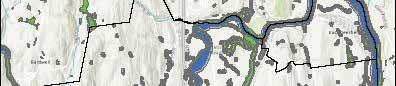
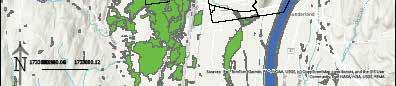
surfaces, such as parking lots or roads, increasing industrial or commercial development, and/or increasing agricultural runoff by establishing farms on less porous, less fertile land can have harmful effects ecologically and economically (Larabee). The Wetlands Protection Act provides 100-foot buffers for wetlands and a 200-foot riverfront area in which developers may not build, except through a permiting process.
Key natural communities--groups of plants and animals that have conservation priorities set by the state, though this does not translate neatly into legal protections--in Deerfield are primarily along the Deerfield and Connecticut Rivers, as well as a pocket in the southwest of Deerfield.
Some examples of these communities include:
• Major river floodplain forest occurs in patches along the Deerfield River. At least one of these patches is very large and free of invasive species and human disturbances. These forests are strongly dominated by silver maple. They occur along large rivers where soils are enriched with nutrients brought by annual floods.
• Mostly minimally disturbed, a large example of black gum-pin oak-swamp white oak “perched” swamp can be found in the large purple area in the southwest corner of Deerfield. There are a couple of smaller examples of these ecologically significant and unusual types of wetland. This community type is dominated by red maple, with black gum, pin oak, and swamp white oak.
• Along the Pocumtuck Ridge to the east, there are Circumneutral Rock Cliff community patches that are discontinuous along a northsouth running traprock ridge with a nearly vertical upper west slope. The exposed traprock ledges are dry and open with small cracks and moist nooks. Plants in the extremely sparsely vegetated Circumneutral Rock Cliff communities grow on small ledges and in crevices on a circumneutral cliff face. These communities support a great diversity of species.
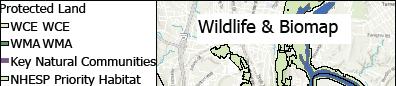
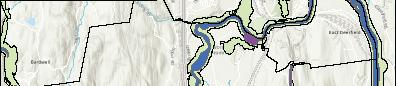
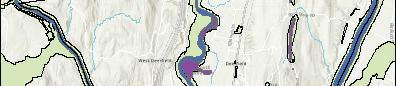
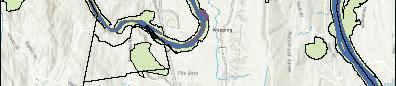
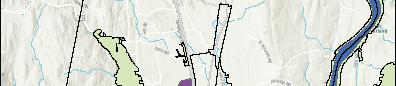
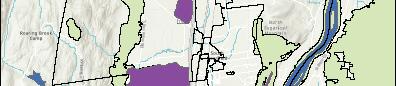
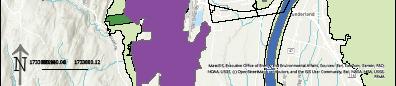
One of the most important layers on this map is the NHESP layer, which stands for Natural Heritage & Endangered Species Program, a crucial organization in the fight for conservation. Activities in areas mapped as priority or estimated NHESP habitats are subject to a filing process.
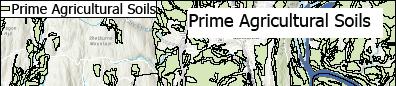
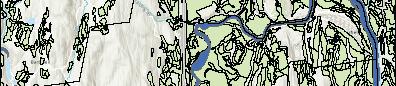
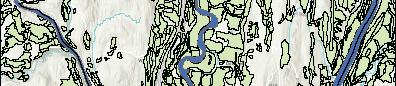
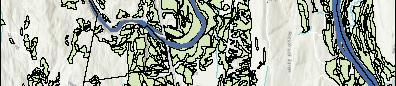
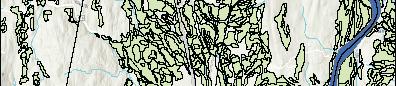
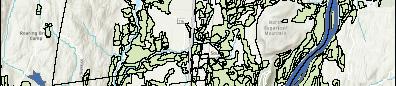
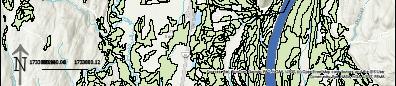
According to Slaff, Freedman, and Grist, the town sits on some of the best agricultural soils in the world. These soils are especially prominent along the Deerfield and Connecticut Rivers, but are also scattered throughout town. These soils are a key feature of Deerfield’s natural and social history.
According to Regenerative Design Group, Deerfield’s soils tested higher than state averages on soil organic carbon (SOC) levels. However, farming and development have depleted soil carbon and other soil health indicators well below capacity. “This presents Deerfield’s land managers with an opportunity to achieve a significant carbon drawdown using soil-smart practices. Because of
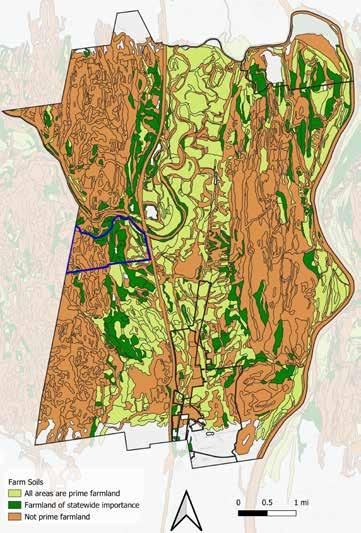
the exceptional vulnerability of Deerfield’s soils to riverine flooding and slow-but-steady development, the necessity and benefits of implementing soil smart practices is great.” (Deerfield Healthy Soils Report)
While development is largely restricted on APR lands, there are no other protections for prime agricultural soils. The Town may not want to encourage development on prime farmland soils if they want to expand agricultural production and prevent permanent damage to soils.
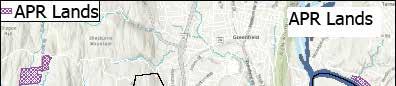
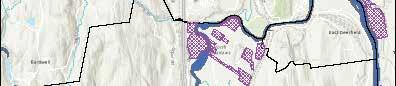
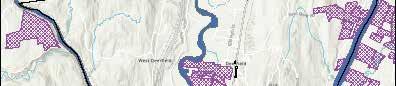
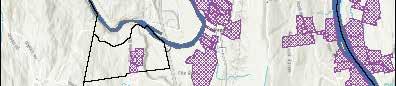
ProteCteD laND (aPr, CH. 61)
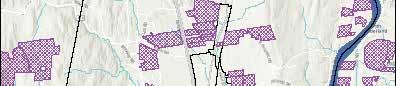
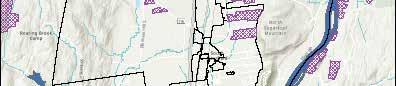
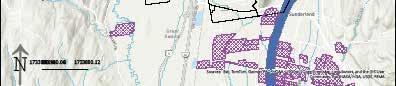
Development restrictions exist for some of Deerfield’s valuable agricultural lands by grace of the Agricultural Preservation Act (APR), which preserves lands as farmlands in perpetuity. There are several APRs in Deerfield, as visualized above.
Further, there are parcels enrolled in Chapter 61 for forestlands, 61A for agriculture land, and 61B for recreational land, all of which give preferential tax treatment to landowners who maintain their property as open space for timber production, agriculture, or recreation under Massachusetts law.
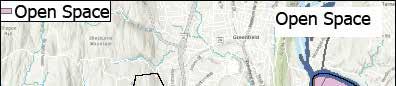
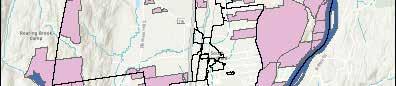
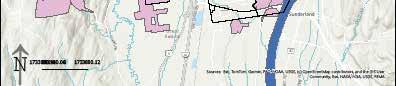
Crs aND otHer PermaNeNtly ProteCteD laND. This map shows other protected open space in Deerfield, including private and publicly owned parcels. This map includes private lands under conservation restrictions, such as a 47-acre area in the northeast of town owned by the Franklin Land Trust. Development is also restricted completely or otherwise limited in these areas. Therefore, when considering where to build new housing in Deerfield, these areas must be considered off-limits.
Impervious surfaces, hard non-porous areas covered in material like concrete, asphalt, or other similar stone-based aggregates, or areas covered by roofs or other structures that cause runoff, are an inevitable part of housing development. More impervious surfaces means that water has fewer places to go and that can lead to flooding. Both nuisance flooding and more dramatic climate-change related flooding have had expensive impacts on individual home owners and the Town’s budget, which can have downstream effects for residents as taxes may be raised or emergency recovery may be prioritized over town improvements.
Impervious surfaces can be destructive and costly. But this is not to say that density, and the concentrated areas of impervious surfaces that come with it, should be avoided. Deforestation, for example, of large lots for single-family suburban-style development can have an equal or greater impact on flood readiness and do more harm ecologically than density. Still, dense development should be done with mitigating strategies for dealing with stormwater and other ecological investments to offset the damage done by producing more impervious surfaces.
Limiting new impervious surfaces in construction of new homes, reducing current impervious surfaces by adjusting parking requirements, and exploring pervious pavement alternatives are useful tools for protecting the ecology and infrastructure of the community.
As mentioned in the surficial geology section, the portion of southern Deerfield where the CVRD, EPD, commercial districts, and industrial districts are located coincides with poorly draining soils that are composed of clay and silt. Because water does not infiltrate the soil and the land is prone to flooding independently of human interference in South Deerfield, flooding can be exacerbated by impervious surfaces even if not necessarily caused by them. Additionally there is the ecological concern of impervious surfaces in South Deerfield that cause the spread of contaminants which leach out of new impervious surfaces and flow into important wildlife habitats.
stormwater maNagemeNt
Current legal measures to protect wetlands and rivers may be insufficient to deal with the water from changing and unpredictable weather caused by climate change. Deerfield should anticipate these possibilities and adopt best practices for new construction. New housing can be produced with some key factors in mind.
As defined by the National Association of City Transportation Officials, key strategies include:
• Designing bioswales in new construction to convey water shed from impervious surfaces.
• Using pervious pavement as an alternative to impervious surfaces. Assessing suitability for these alternatives should take into account the natural infiltration rate of the soil and the intended intensity of use, as pervious surfaces are not appropriate in thoroughfares or heavily used roadways.
• Limiting the amount of off-street parking required for duplexes and other multi-family homes. (NACTO)
Adding to the tree canopy is another key strategy that can help with stormwater management as trees can intercept and slow rainfall, infiltrate runoff into soils, and uptake runoff.




Traffic through Deerfield is oriented north to south, with the major routes being Interstate 91, the major corridor through the Pioneer Valley; Route 5/10, which connects Deerfield to Sunderland/Whately to the south and Greenfield to the north; and Route 116, which runs northwest to Conway and southeast to Sunderland.
These roads connect Deerfield to resources outside of town such as hospitals, supermarkets, and other important institutions that Deerfield as a town of approximately 5,000 residents cannot support on its own. Likewise other communities are connected to Deerfield and its resources such as schools and cultural destinations like museums and breweries. This interconnectedness of communities is vital to Deerfield and those living there, particularly the populations of concern, such as seniors, families, and farmers. Many residents living in Deerfield rely on cars or public
transportation to get to and from work, as do the workers in Deerfield who may commute from neighboring towns. In town, the pattern of Deerfield’s roads, as influenced by topography, also deeply impacts housing. Housing is primarily found on roads branching off of main north and south routes in a common pattern for valley towns, as can be seen in the Central Village District. This, unlike a grid or radial pattern, innately creates quiet deadend neighborhood side-streets and busier main arteries. This is unlikely to change even with more development, as it is difficult to build grid patterns without altering existing development or substantially changing the physical landscape.



A railroad runs through the center of town and a cargo railyard lies in the northeast corner of town. A passenger train, which goes to the John W. Olver Transit Center in Greenfield in the north and Union Station in Northampton to the south, connects the region to New Haven and points beyond with twice-a-day service. Both stations are reachable by bus for Deerfield residents.
South of Deerfield, just over the border in Whately, there is a Park and Ride lot off Interstate 91, which is the terminus of the PVTA 46 Bus route that connects to UMass Amherst through Sunderland. The FRTA 31 route also connects to the Park and Ride and is the only public transit route through Deerfield.


The FRTA 31 bus route has multiple stops in the Central Village District and South Deerfield near important resources like the post office, library, both the elementary and the high schools, town hall, various workplaces, and medical facilities. There are some stops along Route 5/10, connecting to important resources such as food from produce stands in Deerfield and supermarkets up in Greenfield.
Developing housing around the CVRD thus could benefit seniors, residents without cars, non-drivers, and other residents who rely on the bus for transportation without significant changes to the current transit system.
Most of Deerfield (by area) relies on septic for residents’ wastewater, with only two relatively smaller areas connected to two separate municipal sewer systems. The Old Deerfield Wastewater Treatment Plant serves approximately 1,200 individuals in the northern part of Deerfield, including students, faculty, and workers at the Eaglebrook School, Deerfield Academy, The Bement School, and Old Deerfield. It is currently undergoing a phased upgrade that will replace the existing infrastructure of the 1970s era plant. The South Deerfield Wastewater Treatment Plant serves roughly 3,000 residents.
In community feedback sessions on February 9, 2026 participants cited a November 2025 increase of sewer bills by rougly 10% as a concern around housing costs. Adding new residential units to the system may lower individual bills as the sewer is currently under capacity. Connecting to a municipal sewer is easier and less expensive than building a septic system, as long as the sewer system is under capacity, as each new unit needs only to hook into existing infrastructure. Ongoing operational costs, including future upgrades and maintenance, is largely shared between all the units on the system. Because it is not feasible to extend the existing systems to all of Deerfield, building in dense patterns with multiple units per acre on the existing infrastructure is the most efficient way to use the systems. This is achievable in the CVRD and in the Old Deerfield section of the RA. While the CVRD already has some multi-family units, Old Deerfield’s historical protections may limit dense development there.
The majority of homes in the RA, however, use septic systems. Septic systems have spatial requirements as they are made up of a buried water-tight tank and a field for soil absorption, the size of both which is determined by the number of bedrooms in a house. Conventional septic systems separate waste into oils, greases, and other surface floating material or solids that sink to the bottom of the tank. The resultant water is slowly released into the soil by perforated pipes, different chambers,
or other mechanisms. Alternative septic systems will filter the waste water through sand, sawdust, closed constructed wetlands, or other material to separate contaminants.
Small parcels may not be large enough to meet the spatial constraints of traditional septic systems and private wells. Those who live in Deerfield but are not on municipal water must contend with their wells being 100 feet from their drainfields and 50 feet from their septic tanks, thus creating additional spatial limitations.These spatial constraints are further complicated by proximity to wetlands and rivers, as drainfields must be 100 feet from streams and wetlands. To complicate traditional systems in Deerfield further, Parcels on Sewer
drainfields can become over-saturated which can cause toilets and sinks to backup. Flooding and a high water table has led some residents to “have to pump out their septic tank two or three times per year,” according to community feedback.
Deerfield’s septic system bylaws date back to 1986 and do not seem to have been updated. Some residents find these laws to be stringent and believe they limit development. Mound systems, a septic strategy for areas where traditional systems are insufficient or impractical, are not allowed for new construction, which includes any ADU built and duplex or multifamily conversions (Town of Deerfield, 239-3). The construction of detached ADUs in particular are hindered by this as they would be required to connect to the existing home septic system, which limits where an ADU could be constructed. Deerfield requires a minimum leaching area that is one-and-a-half the size of the State requirement laid out in Title 5 (Town of Deerfield, 2396). Furthermore, duplex housing structures also have elevated thresholds requiring a 1,500-gallon tank and minimum size leachfield of 1,500 square feet (Town of Deerfield). To the right is a map of small dark parcels on septic which would not be able to meet this requirement. This map assumes the best possible conditions for expanding residents’ drainfields; there are likely many more parcels which would be impossible to meet this requirement on.
summary: wHat Do all tHe PatterNs meaN?



Deerfield is shaped by a rich agricultural past, which is in turn shaped by the floodplain soils there. North Deerfield is especially suitable for agriculture, being flatter and having richer soil than South Deerfield. Most historical development in Deerfield is located on the central strip of flat land created by the Deerfield River and Glacial Lake Hitchcock. Key ecological communities also thrive along the Deerfield and Connecticut Rivers, which does and should limit development around them. In addition to the rivers running north and south through the Town, major roads and transit lines also run north to south in the central strip. Town sewer only exists in two places throughout town; the CVRD in the south and Old Deerfield in the north which have grown as two clustered hubs of development.
When taken together, a clear pattern emerges from the existing conditions of the land and historical land use. If the Town would like to increase housing supply, it should do so by increasing density in one of or both of the hubs in North and South Deerfield, rather than seeking to expand into areas which will be more expensive, ecologically damaging, or disruptive of rural character. In the next section, we will take a closer look at how these maps talk to each other, and what they suggest for developing housing in Deerfield.
ParCel sCoriNg metHoD
Deerfield’s existing conditions suggest that South Deerfield, particularly the Central Village Residential District (CVRD), looks promising for additional housing. To confirm this and potentially reveal new opportunities, a suitability analysis has been conducted. The following section presents a series of maps that apply a “score” to each parcel in Deerfield. These scores explore parcels’ suitability to development by applying four criteria categories (“Ecological Constraints,” “Infrastructure Support,” “Physical Fit,” and “Density”) in attempt to answer these questions:
Criteria Questions:
• Ecology Constraints - Where should development be avoided?
• Infrastructure Support - Where is housing development closest to sewer and transit?
• Physical Fit - Where could more housing physically fit based on zoning and lot size?
• Density Fit - How might future housing reflect settlement patterns today?
Each question involves one or more maps. A scoring system is applied to each parcel based on high, moderate, and low constraint or support levels. These scores are then combined and reclassified to create four distinct 1-to-5 scale individual criteria maps. Finally, the criteria maps are combined and reclassified to produce a single overall suitability map, showing where housing development is most feasible.
eCologiCal CoNstraiNts: wHere sHoulD DeVeloPmeNt Be aVoiDeD?
Ecological constraints identify areas where development may or should be limited due to environmental sensitivity, regulatory protections, or physical limitations.
Layers Involved:
• Hydrology (200ft buffer for rivers; 100ft buffer for streams, ponds, and other water bodies)
• Open Space (categorized as permanently protected, limited protected, and unprotected)
• Slopes (0-6%, 6-12%, 12-18%, >18%)
• Vernal pools (100ft buffer)
• Wetlands (100ft buffer)
• Prime Agricultural Soils
• Natural Communities
Each feature was assigned a constraint score based on the degree to which it limits or restricts development. Higher negative scores indicate conditions where development is either prohibited or strongly discouraged.
Ecological Parcel Scoring:
Remaining parcels were scored 0
Development near rivers, streams, and other water bodies is limited under Massachusetts regulations to protect water quality, reduce flood risk, and maintain ecological health. Building too close to these areas can increase erosion, introduce pollutants, and disrupt natural systems, so these areas were given a high constraint score.
Wetlands play a critical role in storing floodwater, filtering stormwater, and supporting biodiversity, which is why they are strongly protected at both the state and federal level. Because development is typically prohibited or heavily restricted in and around wetlands, they are treated as a major constraint for housing.
Vernal pools are small but ecologically important habitats, especially for amphibians, reptiles, and other sensitive species. Even limited disturbance within their buffer zones can impact breeding cycles and long-term survival, so these areas were scored as highly constrained.
Land that is permanently protected—such as conservation land, parcels under easement, or agricultural preservation restrictions (APR)—is legally unavailable for development. Since housing cannot occur in these areas, they are considered a hard constraint.
These soils, particularly those close to the floodplains, are valuable for farming and long-term food production. While these areas are not always strictly protected (unlike soils on APR land), building housing could permanently remove productive farmland, which would generally be discouraged in rural areas. However, as noted in the surficial geology section of the existing conditions, some of the prime soils in the more poorly-drained areas (near the CVRD), may not be as fertile, possibly due to poor drainage or seasonal waterlogging.
Natural communities support important ecosystems and local biodiversity. Development might still be possible, but it is encouraged to do so with careful review and preventative steps to reduce environmental impact.
These lands have some level of protection, whether through local rules, traditional use, or functional use. Some examples include cemeteries, municipal golf courses, or parcels that need a majority vote to change their status. Development might be possible in some cases, but these areas are generally not suited for residential development.
These areas are unprotected by any legal or functional means. They are usually privately owned and could be sold or converted to another use at any time (e.g. scout camps, private golf courses, or private woodlands). While they may provide some ecological or scenic value, they are generally more feasible for development compared to protected or limited protected open space.
Slope was evaluated separately from the other ecological constraint layers for practical GIS software-related reasons. Scoring it on its own made it easier to assign constraint values accurately. If the workflow had allowed, the slope layer could have been merged directly with the other ecological constraints into a single continuous data set.
Slope Parcel Scoring:
Scoring Rationale: Slopes
High Constraint (-3)
Greater than 18%
Very steep slopes create construction challenges, including difficult grading, higher erosion risk, and expensive infrastructure needs. These areas are generally avoided for residential development.
Moderate Constraint (-2) 12-18%
Moderately steep slopes can sometimes be developed, but similar to >18% slopes, often require engineering work, which raises costs and environmental impacts.
Low Constraint (-1) 6-12%
These slopes present minor constraints that may influence site layout or design and are generally suitable for development.
No Constraint (0)
0-6%
Flat to gently sloping land is the easiest to build on, with minimal physical constraints.
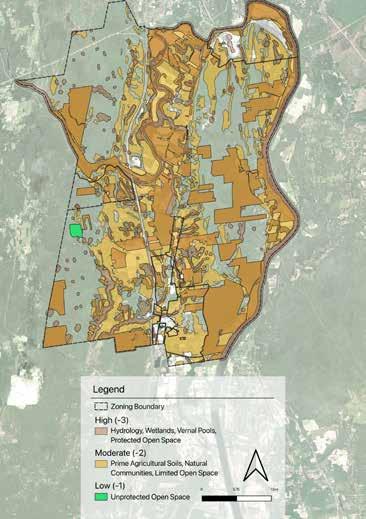
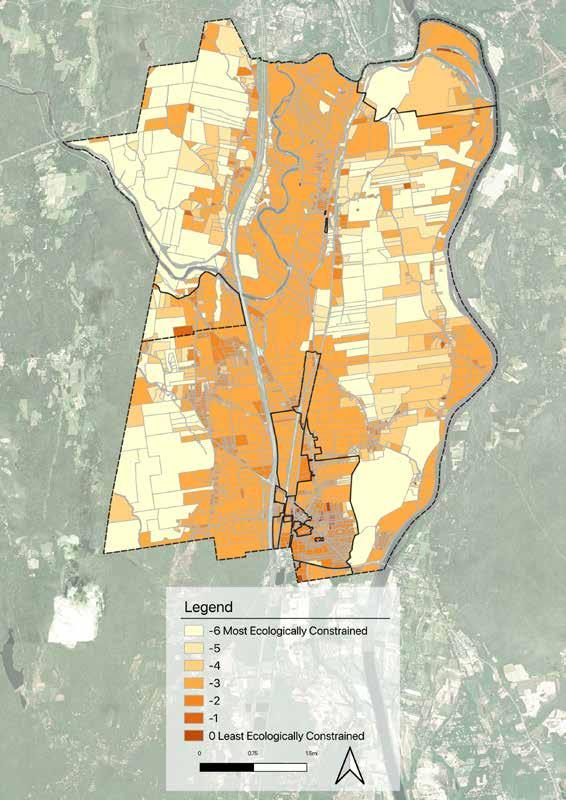
After scoring individual ecological features and slopes, the results were combined at the parcel level to give each parcel a total ecological constraint value seen on the next page. The initial scores ranged from -6 (most constrained) to 0 (least constrained), capturing the combined impact of overlapping constraints (e.g. wetlands that coincide with steep slopes have a score of -6).
When ecological factors and slopes are considered side by side, each highlights different limitations that are somewhat conflicting. The most flat areas also tend to be some of the most ecologically sensitive or constrained, particularly in the central north-south corridor as well as along the Connecticut River to
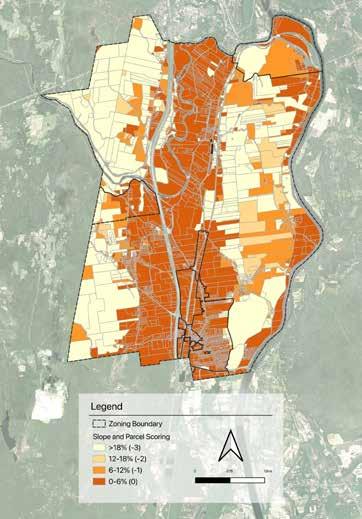
the east. These two factors are combined into the overall Ecological Constraints map (following page): the darker the parcel, the most suitable and least ecologically constrained. One begins to see that the darkest parcels with the most suitable slope on the slopes map, now have a lighter shade indicating a less suitable value for development. There are only a few individual parcels with the darkest shades (least constrained) dispersed throughout the Town with one smaller cluster within the CRVD.
To make the map easier to compare with the other suitability criteria categories (infrastructure, physical fit, and density) the scores were rescaled to a standard 1-5 range as shown in the table below the map.
iNfrastruCture suPPort: wHere woulD HousiNg DeVeloPmeNt Be Closest to sewer aND traNsit?
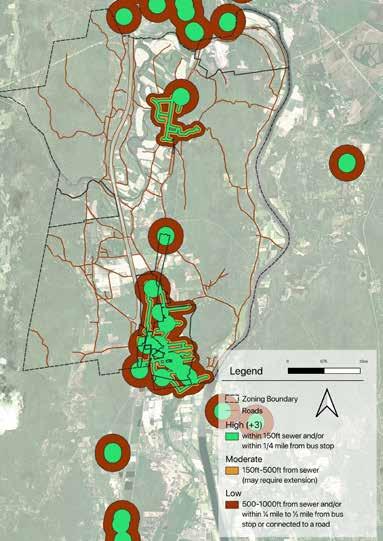
This category assigns more points to land adjacent to existing sewer lines, bus stops, and major roads. This assumes parcels with public transit access, roads, and sewer connection are preferable for new housing development.
Scoring Rationale: Infrastructure
High Support (+3)
Within 150ft of sewer OR within 1/4 mile of a bus stop
These parcels require minimal utility extension and are closest to transit, making development more efficient and cost-effective.
Moderate Support (+2)
Within 150-500ft of sewer (may require extension) Parcels are still close to sewer, but some extension of infrastructure would likely be needed.
Low Support (+1)
Within 150-1000ft of sewer OR within 1/4 to 1/2 mile of a bus stop OR connected to a road Development is feasible, but additional construction or infrastructure may be needed
No Support (0)
Parcels outside of the above criteria
Parcels are farther away from sewer, roads, or bus stops, likely facing higher costs with limited access to infrastructure
Infrastructure Parcel Scoring:
Infrastructure
within 150 ft of sewer and/or within ¼ mile of bus stop
Remaining parcels were scored 0
150ft-500ft from sewer (may require extension)
500-1000ft from sewer and/or within ¼ mile- ½ mile from bus stop or connected to a road
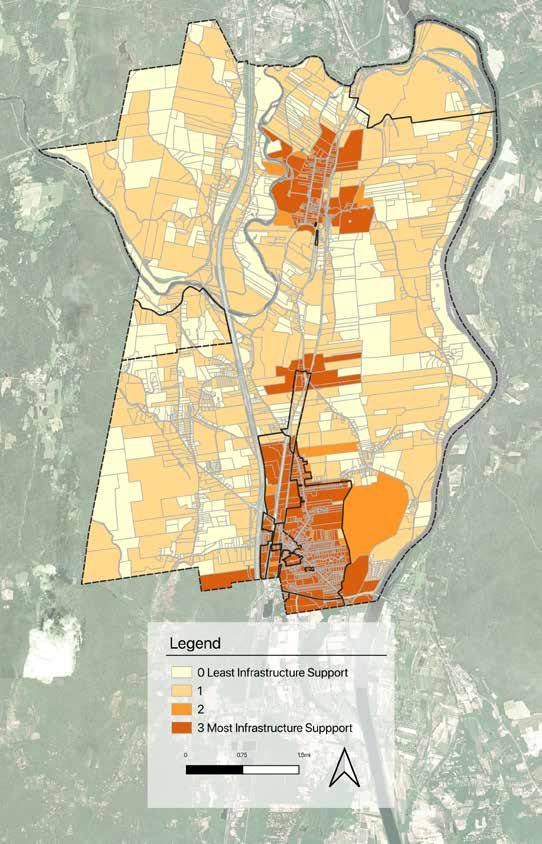
The three infrastructure layers were combined at the parcel level to create a total infrastructure support score. When a parcel met multiple support levels, the highest score was used to reflect the maximum infrastructure support available.
The combined scores originally ranged from 0 (no support) to 3 (highest support). Darker shades show parcels with stronger infrastructure support; these occur in the CVRD, EPD, Commercial I District, and Old Deerfield.
Lighter shades show parcels with limited access, where building might require septic systems, sewer, extensions, and/or transit connections.
PHysiCal fit: wHere CoulD more HousiNg PHysiCally fit?
Physical fit looks at where development could realistically fit based on zoning, lot size, current occupancy, and the potential to subdivide land. Higher scores indicate parcels that could more easily accommodate additional housing.
High Support (+3): Non-conforming parcels
Low Support (+1): Conforming parcels
Although non-conforming lots do not meet current zoning standards, and can potentially complicate housing development, they often reflect older patterns that differ from standard zoning requirements (e.g. smaller lot size, irregular layout). Mapping these areas can help highlight where zoning may be out of sync with conditions on the ground, which could be useful when thinking about changing zoning to encourage or allow infill.
Potential Subdivision (theoretical)
High Support (+3): Could fit more than 5 lots
Moderate Support (+2): Could fit between 2-5 lots
Low Support (+1): Could fit fewer than 2 lots
Parcels with more subdivision potential could hold more housing units.
Infrastructure Parcel Scoring:
High Support (+3): CVRD
Moderate Support (+2): RA, CI, CII
Low Support (+1): Other districts
Since zoning determines allowed housing density and types, parcels are scored based on districts that allow a wider range of housing types, increasing the “fit” for new development.
High Support (+3): Vacant parcels
Low Support (+1): Occupied parcels
Vacant parcels may be easier to develop than occupied parcels. They typically do not have buildings or other structures.
Zoning/Lot Conditions non-conforming lot; can fit >5 lots; lot within CVRD; vacant lot can fit 2-5 lots; lot within RA, CI, CII conforming lot; can fit <2 lots; lot within other districts; occupied lot
Remaining parcels were scored 0
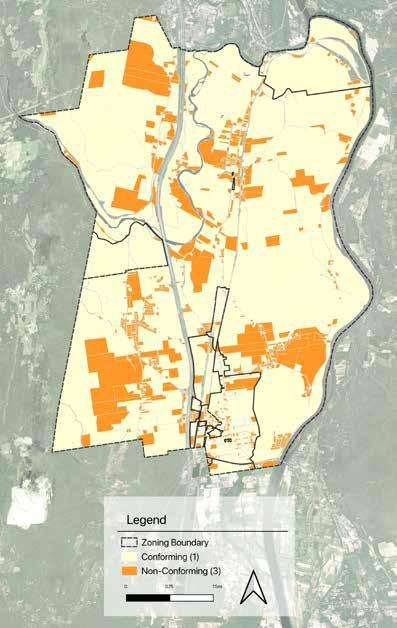
Non-conforming parcels were determined based on whether they meet the minimum lot size. These parcels are dispersed throughout the town and are, primarily, near Old Deerfield, north of Mount Sugarloaf, and southwest of Interstate 91. On the map below, darker shades indicate a greater mismatch with current zoning standards. Non-conforming parcels were scored higher to highlight areas where zoning adjustments, overlay districts, or flexible development standards could be considered to accommodate diverse housing types. Lighter shading on conforming lots indicates areas
meeting existing regulations. By scoring these differences, the map helps identify where conventional development aligns with current zoning and where targeted policy or regulatory changes could unlock additional housing opportunities.
For the map on the right, darker shades indicate parcels with the greatest theoretical potential for subdivision. These parcels are mostly located in the RA district. This exercise raises important questions for planning. How many additional lots could realistically fit? Should more be added, and if so, is
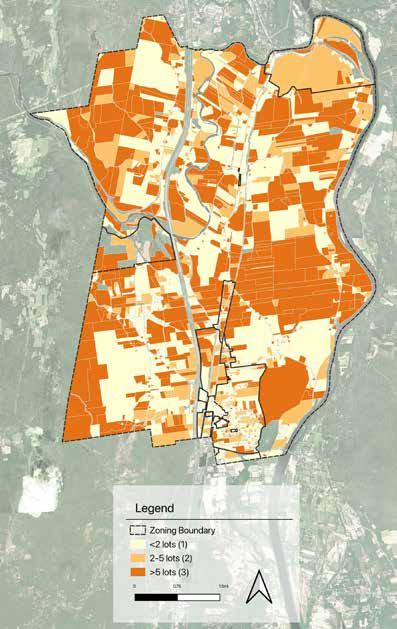
there community desire or need to support it? Even if it is unlikely, for larger lots to become highly developed, they were scored higher to highlight where expansion is physically possible. This approach encourages reflection not only on land capacity, but also on the policies and design strategies that would be required to translate theoretical potential into practical, context-sensitive housing opportunities.
Parcels were also scored based on which zoning of district they were in: lower scores are assigned to
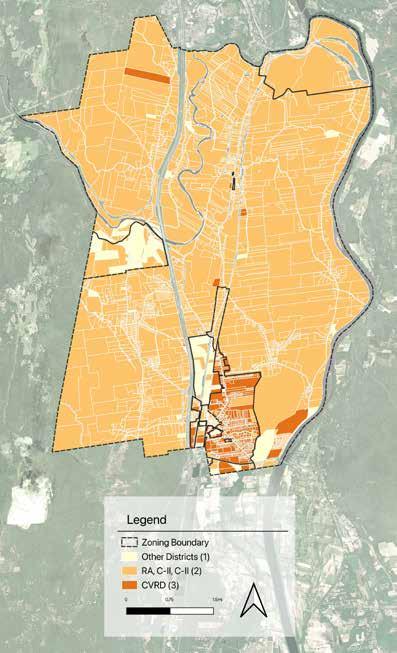
districts with more limited allowable housing types, while higher scores reflect districts that allow greater housing diversity. As a result, darker shades indicate areas where zoning already supports a wider range of housing types, primarily in the CVRD. However, keep in mind that there are errors within the assessor table, where some parcels may be incorrectly labelled.
The final map within the physical fit criteria is the vacancy map, where the darker shade indicates vacant parcels, which may offer more immediate opportunities for
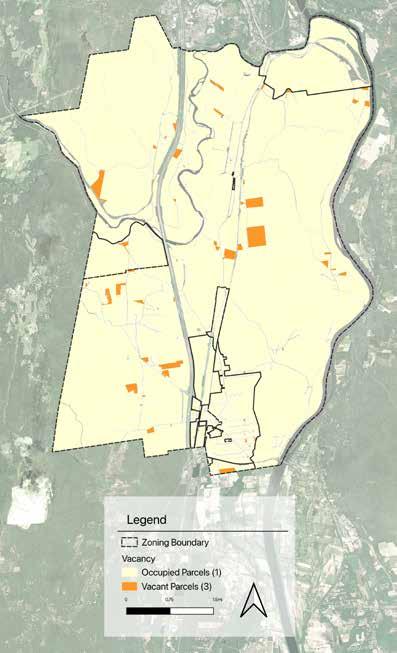
development compared to already developed lots. Because they may not require demolition or redevelopment, these parcels are scored higher. However, vacancy does not guarantee availability, prompting further consideration of ownership, constraints, and whether development aligns with community needs.
When looking at the combined physical fit map, very few parcels achieved the highest possible score of 10. More broadly, parcels within the RA district show midrange capacity to accommodate additional housing, largely due to their size and subdivision potential.
Interestingly, many parcels within the CVRD also demonstrate a similar capacity, suggesting that even within more established areas, there may be opportunities for infill or incremental development.
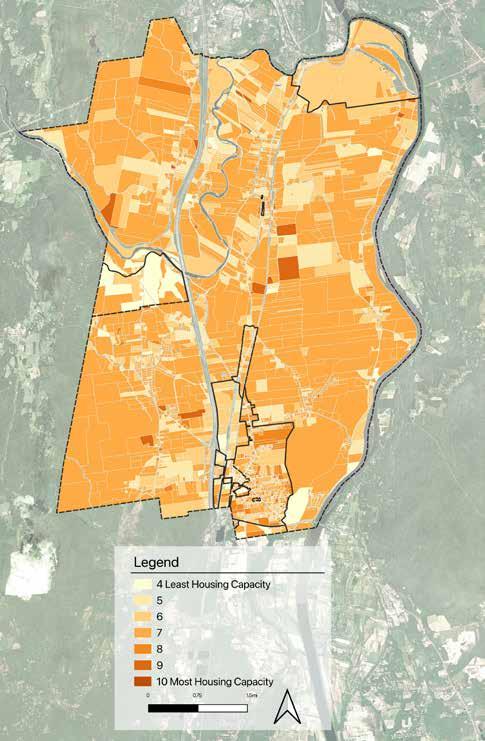
DeNsity fit: How migHt future HousiNg refleCt settlemeNt PatterNs toDay?
Density Fit looks at parcels where future housing could match the density of surrounding homes. Darker shades show parcels where new housing would fit well with existing housing patterns, while lighter shades show areas with low density where new housing may stand out.
Scoring Rationale: Density
Higher Density (+3):
Greater than 3 units per acre
Parcels are part of denser clusters. Infill or higher density development may fit well with the existing landscape pattern.
Moderate Density (+2)
Between 1 to 3 units per acre
Parcels in moderately dense areas, where new housing could partially align with existing housing patterns.
Low Density (+1)
Between 0 to 1 units per acre
Parcels are sparsely developed.
Density Parcel Scoring:
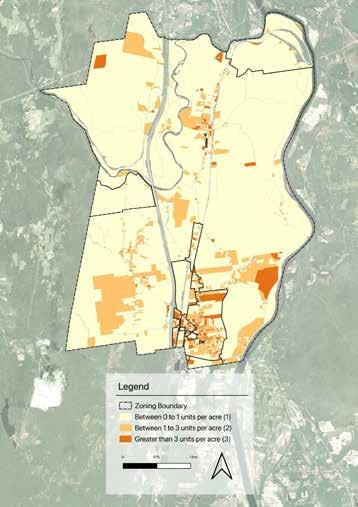
Density is mainly concentrated in Old Deerfield and within the CVRD, where existing development patterns are already more compact. Rather than introducing entirely new forms of development, these areas present opportunities for additional housing to align with and build upon established patterns.
In contrast, the more sparsely developed areas of town may be less suitable for denser development if the goal is to maintain existing landscape patterns.
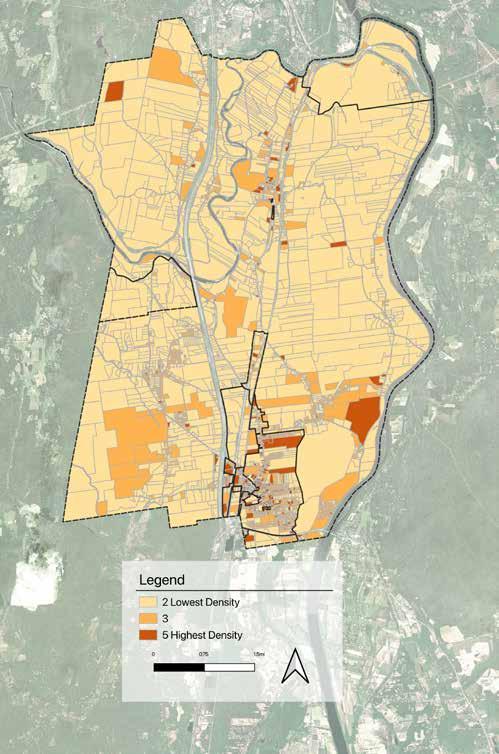
This page spread presents the four compiled criteria category maps—Ecological Constraints, Infrastructure Support, Physical Fit, and Density Fit—each reclassified to a 1-to-5 scale for consistency. Compiling these criteria allows comparison of multiple factors simultaneously and identification of parcels that perform well across several measures of development suitability.
Ecological Constraints Infrastructure Support
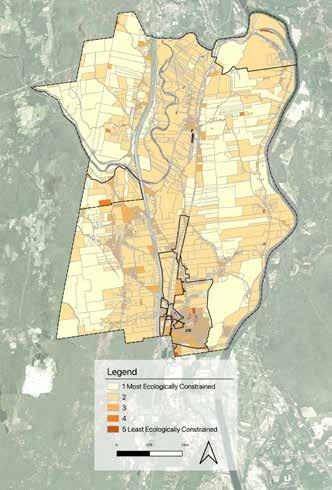
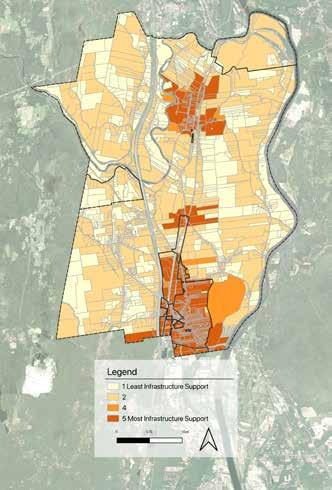
Physical Fit
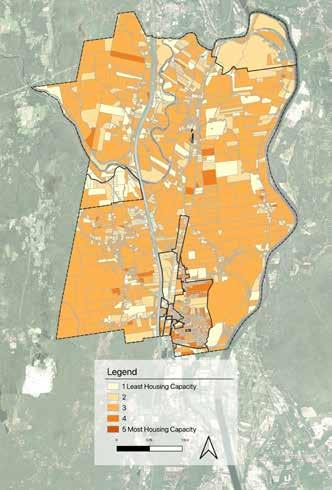
Density Fit
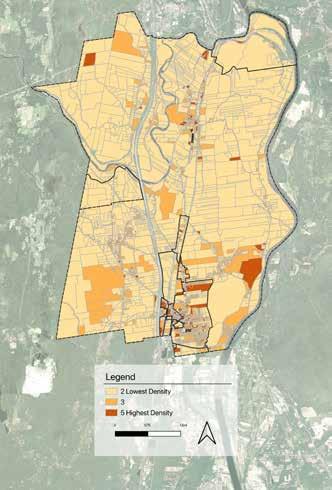
The Compiled Suitability Score combines all four criteria categories—Ecological Constraints, Infrastructure Support, Physical Fit, and Density—to provide an overall assessment of each parcel’s potential for housing development. Parcels were first scored individually on each criterion, resulting in a raw total between 4 and 19, and then reclassified to a 1-to-5 scale for easier comparison across the town.
Higher scores indicate parcels where multiple factors align favorably, suggesting that new housing could be accommodated more easily. This is especially found within the CVRD, central Commercial District, and Old Deerfield. Meanwhile, lower scores highlight areas with constraints that may require additional consideration. This is found throughout the RA and within the Water Overlay. By bringing these criteria together, the map encourages reflection on where development is most feasible, where policy or design flexibility could help unlock potential, and where limitations may guide approaches to grow more cautiously.
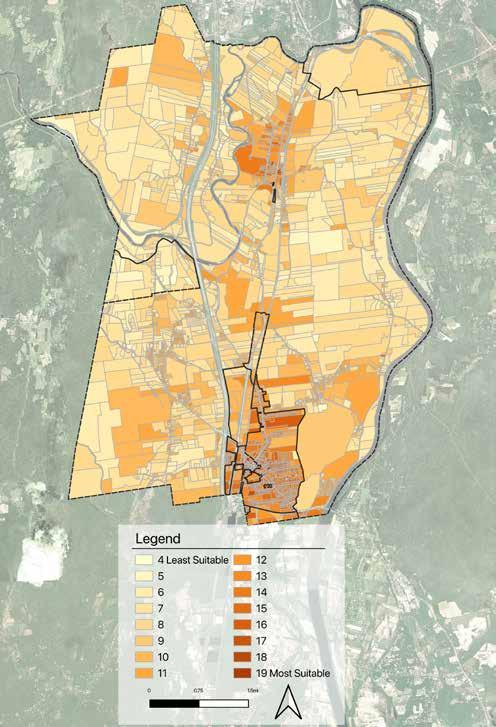
Note: Some parcels show mid to high range suitability for housing even though development is not allowed on them. This is a result of how the model was designed. The intention is not to suggest developing on these or any parcels; further analysis is necessary on a parcel by parcel basis.
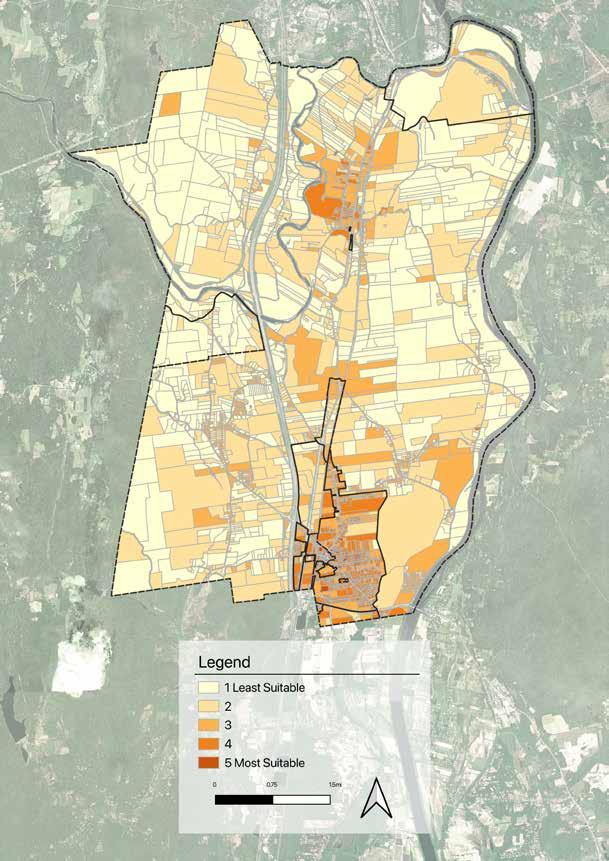
This map builds on the Compiled Suitability Score by overlaying suitable parcels with the highest ecologically contrained features–hydrology, wetlands, vernal pools, and permanently protected open space–which are referred to here as the Critical Environmental Areas.
Through this lens, many of the town’s parcels are affected by these constraints. Areas not intersecting Critical Environmental Areas appear in clusters in the southwestern region of RA, north of Mount Sugarloaf, northwest of Interstate 91, within and surrounding Old Deerfield, and across most of the CVRD.
Notably, many of the remaining highly suitable parcels are within the CVRD. This suggests that, when considering environmental constraints, prioritizing the CVRD and tackling a range of housing strategies within it could be key to accommodating additional housing. Some of these strategies will be explored in the following section.
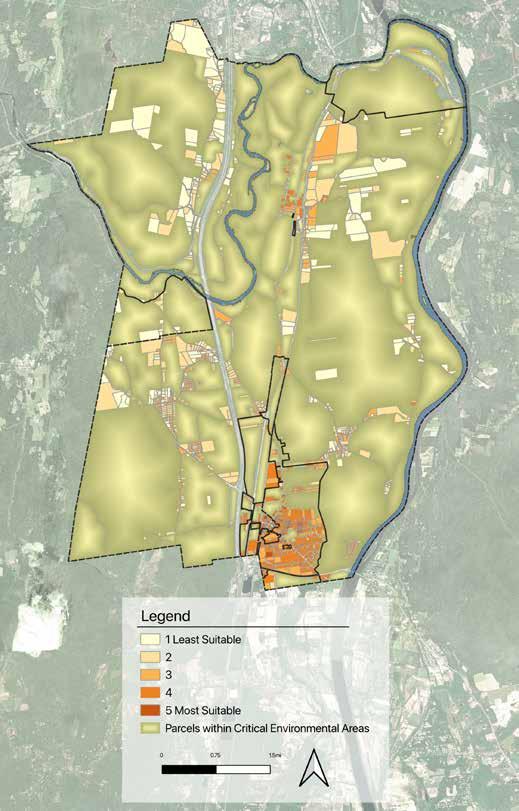
Housing needs shift throughout a life. Growing families may need as much space as they can afford but as children leave the home they move into smaller, less expensive units. As parents grow older, they, similarly, may need to downsize for financial, mobility, or community reasons. Young couples or single parents may need more space than they did as individuals. The changing of life circumstances necessitates the changing of physical spaces. Housing is not static nor is housing development strictly for community growth. More housing development can be for the people already in the community.
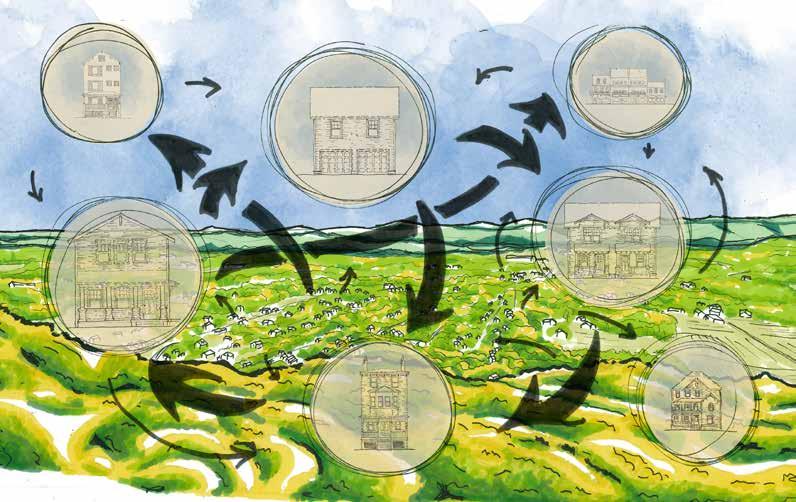
Several strategies can help Deerfield expand housing options while maintaining its rural character. Rather than large-scale development, these approaches focus on incremental growth within existing neighborhoods and village centers. The following strategies highlight ways housing can be added gradually through infill development, conversions of existing buildings, and the introduction of smaller multi-unit housing types commonly referred to as “Missing Middle” housing (Parolek 7-9).
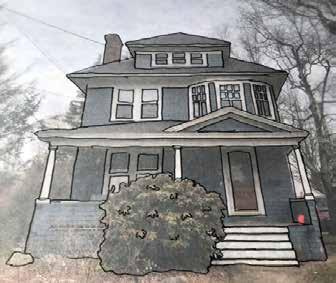
Conversion is a strategy of turning non-housing buildings into housing or single-family housing into multi-family housing. This can include offices, commercial buildings, civic, other types of buildings. This strategy is one that non-developer homeowners can use by converting their single-family house to a duplex, for example (Hogan and Leblanc).




Converting a house might not change its footprint and might make minimal changes to its outside appearance.
liViNg little
Living Little is a Massachusetts planning resource provided by the Metropolitan Area Planning Council (MAPC) that provides examples and policy tools for introducing smaller housing types in ways that fit community character. (living-little. mapc.org/)
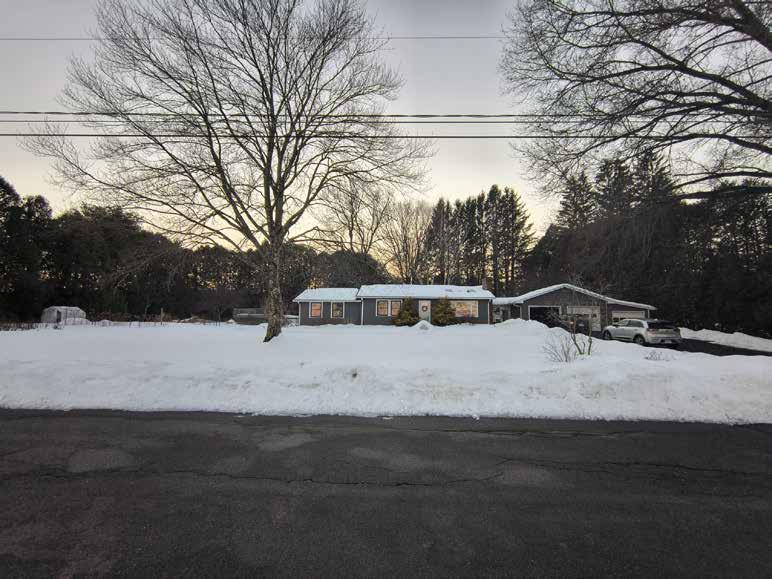
Missing Middle “is a range of multi-unit or clustered housing types, compatible in scale with single-family homes” that “meet the need for more housing choices at different price points” (Parolek 7). These housing types typically fill a gap between single-family homes and midrise apartments in more urban settings.
Infill is the strategy of building in empty spaces between buildings in already developed spaces rather than building parcels on the edge of communities or far away from developed centers. Infill can enhance the character of a space by bringing more form and order to it (Arendt 120).
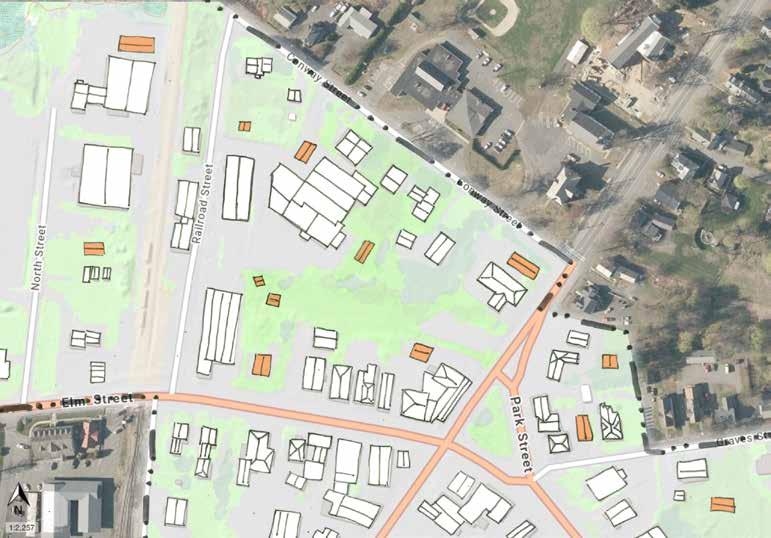
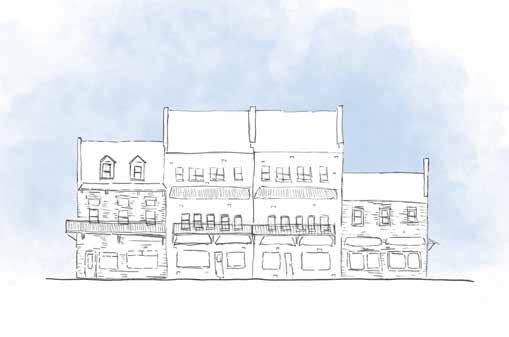
CommuNity BeNefits:
• supports local businesses by ensuring residents/ customers are nearby.
• may provide lower-cost rental housing
• creates walkable village centers
• small-scale housing growth
• increases housing options for smaller households
BuilDiNg reCommeNDatioNs (Parolek)
Minimum lot size: 3000 sq feet
Minimum Setbacks: 10 feet
Minimum Side: 0 feet
Suggested Height: 38 feet
Parking: 0-2 spaces per unit
DeerfielD CurreNt requiremeNts
Minimum lot size: 125000-20000 sq feet
Minimum Setbacks: 20-50 feet
Minimum Side: 10-25 feet
Maximum Height: 35 feet
Parking: 2 spaces per unit and 1 space per 250 square feet of gross floor area
Mixed-use buildings combine residential and commercial uses in the same structure. Housing units sit above shops, offices, restaurants, or other businesses. These buildings can support village centers by allowing people to live close to services and jobs.
Best suiteD for:
• Young / Single Adults
• Couples
• Downsizing residents
• Local workers
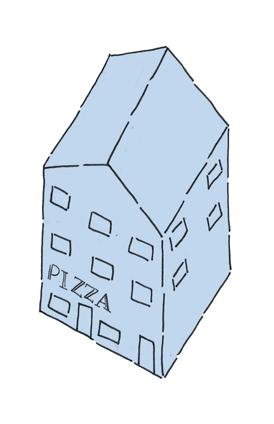
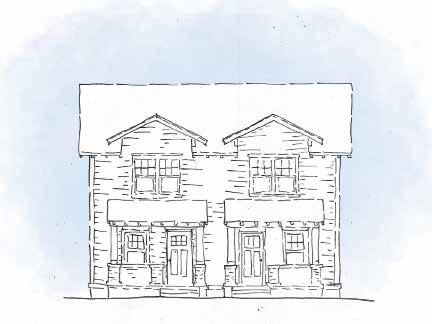
CommuNity BeNefits:
• increases housing options for smaller households
• provides lower-cost rental housing
• supports aging in place
• allows homeowners to generate rental income
• fits within existing residential districts
BuilDiNg reCommeNDatioNs (Parolek)
Minimum lot size: Between 50006050 square feet
Minimum Setbacks: 15 feet
Minimum Side: 5 feet
Suggested Height: 14 feet for one floor units, 21 feet for two floor units.
Parking: One space per unit (2)
A duplex contains two separate dwelling units within one building. Duplexes often share a similar size and appearance to a single-family home, allowing them to blend into residential districts while providing additional housing options. These buildings can be arranged in two main ways: side-by-side or stacked.
Best suiteD for:
• Starter households
• Couples
• Small families
• Downsizing residents
• Local workers
• Seniors living with rental income
Minimum lot size: between 15000 square feet
Minimum Setbacks:30 feet
Minimum Side: 10 feet
Maximum Height: 35 feet
Parking: 1 space per 250 square feet of gross floor area
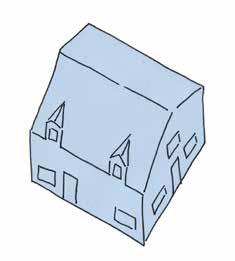
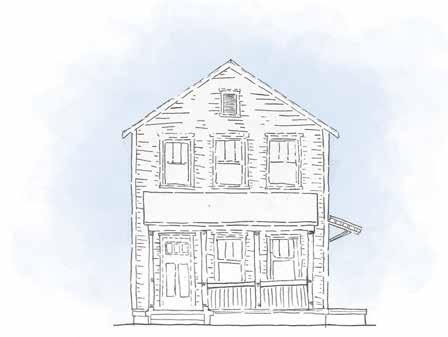
CommuNity BeNefits:
• increases housing options for smaller households
• provides lower-cost rental housing
• supports aging in place
• allows homeowners to generate rental income
• fits within existing residential districts
BuilDiNg reCommeNDatioNs (Parolek)
Minimum lot size: between 35005625 square feet
Minimum Setbacks: 15 feet
Minimum Side: 5 feet
Suggested Height: 21 feet
Parking: One space per unit (2)
Best suiteD for:
• Starter households
• Couples
• Small families
• Downsizing residents
• Local workers
• Seniors living with rental income
Minimum lot size: 15000 square feet
Minimum Setbacks: 30 feet
Minimum Side: 10 feet
Maximum Height: 35 feet
Parking: Two spaces per dwelling unit for multifamily, and an additional 0.5 space per unit for visitors
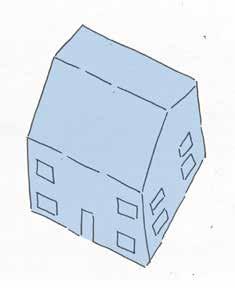
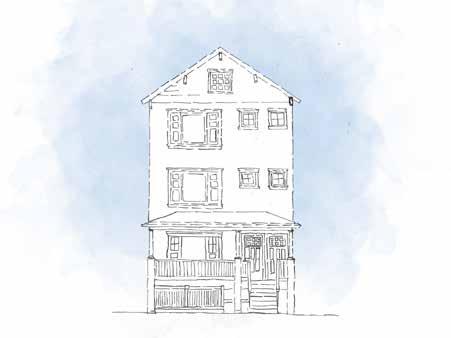
CommuNity BeNefits:
• small-scale housing growth
• increases housing options for smaller households
• provides lower-cost rental housing
• supports walkable village areas
• fits within existing residential districts
BuilDiNg reCommeNDatioNs (Parolek)
Minimum lot size: between 42005175 feet
Minimum Setbacks:15 feet
Minimum Side: 5 feet
Suggested Height: 30 feet
Parking: One space per unit (3)
Triplexes and fourplexes are small multi-family buildings that contain three or four dwelling units within one building. These homes are often similar in size and appearance to a large single-family home, but provide additional housing opportunities for smaller households. These buildings can be arranged side-by-side or stacked vertically, with either a separate or common entrance. Private outdoor space are available in the form of balconies, porches, or small patios.
Since these homes are slightly larger than duplexes, they may be more suited near village centers or commercial districts, where incremental housing can support walkability and local businesses. Sprinkler installation will also be required as this building includes more than two units.
Minimum lot size: 18000 square feet
Minimum Setbacks: 30 feet
Minimum Side: 10 feet
Maximum Height: 35 feet
Parking: 2 spaces per dwelling unit for multifamily, plus 0.5 space per unit for visitors
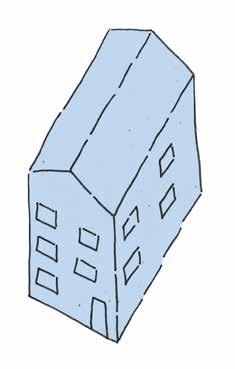
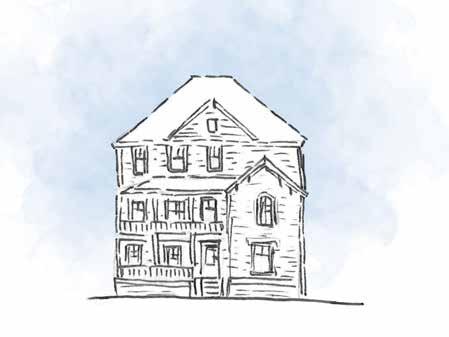
Best suiteD for:
• Starter Households
• Single adults
• Couples
BuilDiNg reCommeNDatioNs (Parolek)
Minimum lot size: 6000 square feet
Minimum Setbacks: 15 feet
Minimum Side: 5 feet
Suggested Height: 21 feet
Parking: One space per unit (4)
• Small families
• Downsizing residents
• Local workers
• Young professionals
Minimum lot size: 18000 square feet
Minimum Setbacks: 30 feet
Minimum Side: 10 feet
Maximum Height: 35 feet
Parking: 2 spaces per dwelling unit for multifamily, plus 0.5 space per unit for visitors
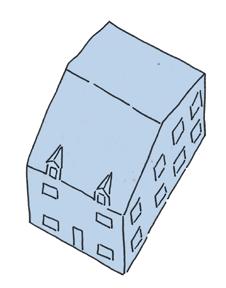
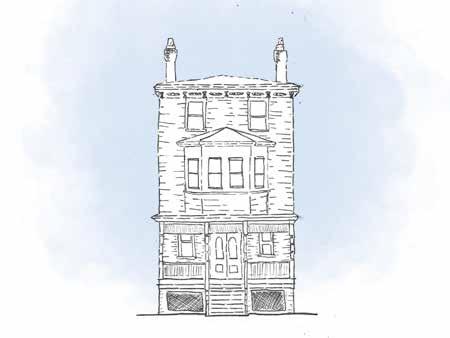
CommuNity BeNefits:
• Small-scale housing growth
• Increase housing options for smaller household
• Provides lower-cost rental housings
• Supports first-time homeownership opportunities
• Creates walkable village centers
• Fits within existing residential districts
BuilDiNg reCommeNDatioNs (Parolek)
Minimum lot size: 2750 square feet
Minimum Setbacks: 15 feet
Minimum Side: 0 feet
Suggested Height: 28 feet
Parking: 0-2 spaces
Townhouses are attached homes that share one or more side walls with neighboring units. These homes tend to be arranged in rows of similar units, each with its own private entrance facing the street.
Since townhouses have relatively small building footprints, multiple units can be developed along a single block while maintaining a scale that fits within the residential districts.
These buildings are well-adapted for walkable areas near village centers, transit routes, or residential edges, where denser housing can support local services and community activity.
Best suiteD for:
• Couples
• Small families
• Downsizing residents
• Local workers
• First-time homebuyers
Deerfield has no bylaws for townhouses
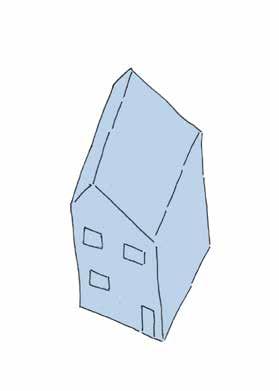
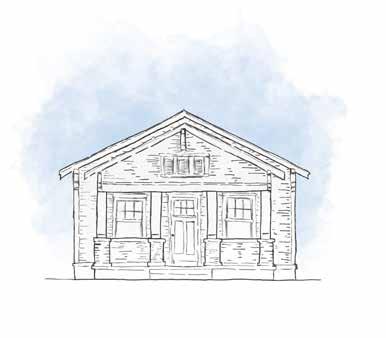
CommuNity BeNefits:
• Small-scale housing growth
• Increases housing options for smaller households
• Provides lower-cost rental housing
• Supports aging in place
• First within existing residential districts
Cottage courts are small (one or one-and-a-half stories) clusters of detached homes arranged around a shared courtyard or common open space. With compact footprints, multiple homes are able to fit on a single lot while also preserving shared outdoor space.
Each cottage faces the central courtyard and includes a small semi-private dooryard that transitions between the home and the shared open space. In most cottage court developments, a central structure will be located to access amenities such as storage, laundry facilities, or parking.
The small and clustered nature of cottage courts can create a pocket neighborhood while still maintaining a scale that fits within residential districts.
• Preserves shared open space through clustered development
BuilDiNg reCommeNDatioNs (Parolek)
Minimum lot size: 16,500-18,750 feet
Minimum Setbacks: 15 feet
Minimum Side: 5 feet
Suggested Height: 15 feet
Parking: one space per unit (6-8)
Best suiteD for:
• Couples
• Downsizing residents
• Seniors
• Local workers
• Single adults
Deerfield has no bylaws for cottage courts
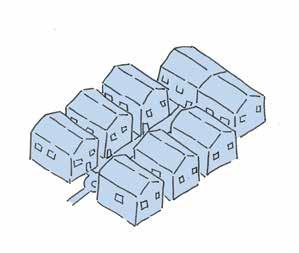
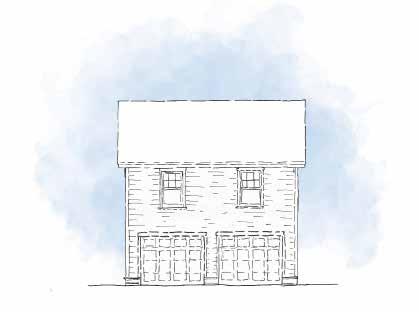
CommuNity BeNefits:
• Small-scale housing growth
• Increases housing options for smaller households
• Provides lower-cost rental housing
• Supports aging in place
• Allows homeowners to generate rental income
• Provides housing for family members or caregivers
• Fits within existing residential districts
BuilDiNg reCs
Unit Size:
900 square feet allowable by right or half the size of existing structure
1200 square feet allowable by special permit.
Parking: No additional parking spaces
Accessory Dwelling Units (ADUs) are small, independent housing units located on the same lot as a primary home. These homes do not require the purchase of additional land or major new infrastructure since they are built within or alongside existing homes.
ADUs can take several forms. Internal ADUs are created by converting spaces within an existing home, such as a basement or attic. Attached ADUs are built as additions to the primary house, either beside it or above structures such as garages. Detached ADUs are small standalone homes located elsewhere on the property, often in a backyard.
Best suiteD for:
• Single adults
• Couples
• Small families
• Local workers
• Seniors or caregivers
• Extended family members
Unit Size:
900 square feet allowable by right or half the size of existing structure (not fully adopted)
Parking: 3 spaces for single family with Accessory apartment
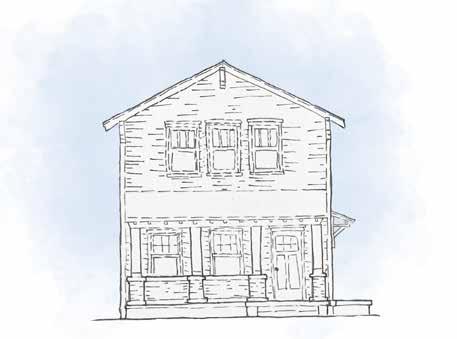
CommuNity BeNefits:
• can provide first-time homebuyers with equity if units are properly sized.
• depending on building-style, can provide seniors appropriate housing for life-style.
soutH BeND iNDiaNa - Cottage
Minimum lot width: 32 feet
Unit Width: 24 feet
Unit Depth: 44 feet
Floors: 1
Parking: 2 spaces
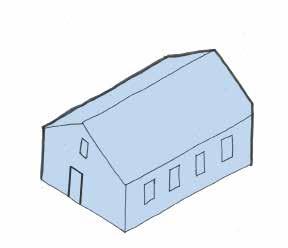
Single-family homes are the most common type of housing in Deerfield. In developing more singlefamily housing, there are some specific strategies that can increase density while maintaining this form in new development. Examples listed below come from South Bend Neighborhood Infill, a document of pre-approved plans for housing in South Bend Indiana. Deerfield may want to develop its own lists and criteria for pre-approved housing plans.
Best suiteD for:
• Growing Households
• Multi-generational Families
• Older Couples (Cottage)
soutH BeND iNDiaNa - Narrow
Minimum lot width: 30 feet
Unit Width: 20 feet
Unit Depth: 36 feet
Floors: 2
Parking: 2 spaces
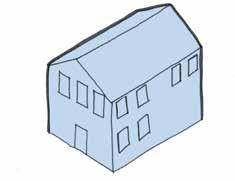
soutH BeND iNDiaNa - Carriage
Minimum lot width: 34 feet
Unit Width: 24 feet
Unit Depth: 24 feet
Floors: 2
Parking: 0 spaces (housing sits on a two-car garage)
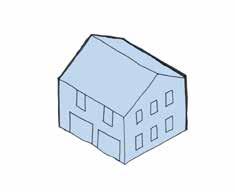
In addition to thinking about types of housing units, Deerfield would benefit from examining the current barriers and practices that have been successful elsewhere at increasing housing options.
CurreNt Barrier - ZoNiNg:
Housing bylaws can restrict density, mixed-use, and other housing types in an effort to shape a certain character of a place. These bylaws can discourage developers from pursuing housing development or have unintended consequences for a community.
PossiBle solutioN - re-ZoNiNg:
By re-evaluating the zoning bylaws of the districts to provide housing alternatives, and communicating to the public the benefits of zoning changes, municipalities like Deerfield can change their bylaws to allow for the kind of growth that meets the needs of residents.
suggesteD PraCtiCe - CHaPter 40y starter
Home DistriCts:
By establishing a starter home district that allows for densities of four units per acre and includes an affordability restriction of up to 100% of the Area Median Income, a municipality can incentivise the production of smaller, more affordable homes for first-time buyers.
suggesteD PraCtiCe - CHaPter 40r smart
growtH DistriCts:
Creating particular areas of concentrated development around village centers, transit, commercial districts, and under-used structures for mixed-use housing or other residential development creates more opportunity for livelier and stronger communities, diverse housing types, and a stronger housing market.
suggesteD PraCtiCe - DeeD restriCtioNs:
Using legally binding agreements, communities can ensure land usage is consistent with neighborhood character, community agricultural or environmental needs, or other identified town goals.
suggesteD PraCtiCe - Pre-PermitteD PlaNs:
By providing developers with pre-approved designs and plans, their costs for permitting, review, and risk for denial go down. The Town also benefits from being able to better control the types of development, architecture, scale, and aesthetics that new development brings. This is especially important for a community, like Deerfield, in which a particular character is important.
CurreNt Barrier - ParkiNg requiremeNt:
Off-street parking requirements result in financial, spatial, and ecological limitations of housing development, especially when combined with other open space requirements for parcels. Re-evaluating parking requirements for homes in Deerfield could open up possibilities for housing types, limit the amount of impervious surfaces, and allow for denser development.
CurreNt Barrier - exPeNsiVe fees & Permits:
Permitting fees, utility connection fees, construction fees, and possible tax increases can limit who can build or convert their property into denser housing types. Often the lack of capital of homeowners can lead to only those already wealthy or those wishing to profit from housing development to build housing. Homeowners seeking to add an ADU or convert their housing type for other family members to move in, for example, may not be able to do so for financial reasons.
CurreNt Barrier - CommuNity oPPositioN:
Communities can oppose housing changes for many reasons. Deerfield residents have expressed concerns about schooling, loss of natural environments or farmland, and traffic.
PossiBle solutioNs - CommuNity eDuCatioN:
Efforts to educate the community around misconceptions and hear their valid concerns can help establish a committed group of residents that will work toward housing. Listening to the community and communicating back, can address concerns like protection of open spaces, taxes, traffic, and the potential complications of adding residents to utilities, infrastructure, and services.
suggesteD PraCtiCe - DeeD restriCtioNs:
Using legally binding agreements, communities can ensure land usage is consistent with neighborhood character, community agricultural or environmental needs, or other identified town goals. This practice was introduced in conversation with the core team with the understanding that it may reduce cost for a set amount of time.
suggesteD PraCtiCe - CommuNity laND BaNks:
Empowering public authorities or non-profit organizations to acquire, manage, or redevelop property, can allow those entities to make those properties productive to meet community goals, such as increasing affordable housing or stabilizing property values.
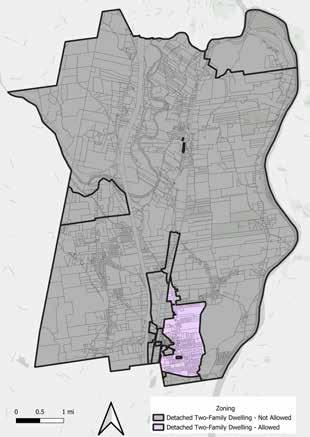
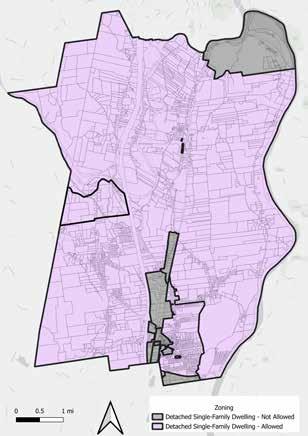
Left: current zoning in Deerfield. Only the CVRD, highlighted in purple, is zoned to allow for two-family housing by right. Right: proposed changes to zoning in Deerfield, which would allow for two-family housing by right in all districts except for those limited to commercial and/or industrial purposes.
Currently, only the Central Village Residential District (CVRD) in Deerfield is zoned to allow for two-family housing by right. By revising zoning of more districts to allow for two-family dwellings, additional housing becomes possible without necessarily changing the footprint of structures if existing homes are converted to duplexes.
One concern with this approach in the Residential Agricultural (RA) district, is that the construction of new duplexes could change the character of this area.
Allowing for two-family housing by right in the RA district would most likely appeal to those in large homes, especially seniors, who could benefit from
converting their single-family residences into duplexes; doing so could create opportunities for seniors to age in place (and avoid major housing upkeep beyond their means), provide housing to someone who needs it, and earn supplemental income while still maintaining residence.
Notably, the conversion of existing large homes into two-family dwellings would not alter the external conditions of the structure drastically, thus maintaining the rural character that residents wish to maintain.
Also, allowing duplexes could provide affordable housing options near farms, benefitting farmworkers with a chance to live near their workplace. This further supports the rural character of the RA district through supporting continued maintenance of existing farms.
It may also be worth exploring whether or not there could be adjustments to the current dimensional requirements of single-family lot sizes and frontage. Taking a look at Deerfield’s zoning bylaws, singlefamily dwellings are required to have a minimum lot size of 60,000 square feet and a minimum frontage of 200 feet.
Further explanation will be provided on lot size and frontage reductions in the next tool, but for demonstration purposes, a hypothetical reduction in RA dimensional requirements can illustrate the potential for additional housing while maintaining rural character. For example, reducing the minimum lot size from 60,000 to 30,000 square feet and the frontage from 200 to 120 feet (roughly 50-60% of current RA requirements) would allow larger parcels to support duplexes without significantly altering the external appearance of existing homes or the overall rural landscape.
This scenario can be seen on the next page, where parcels are determined based on meeting the proposed lot size minimum of 30,000 square feet and a frontage minimum of 120 feet. Parcels are further distinguished by land use code (residential or nonresidential) as there may be some inconsistencies in the assessor’s data. As a result, parcels meeting the proposed minimums are visible throughout the town, particularily in the western and southwestern regions alongside major routes and other smaller, but frequently used roads. These parcels tend to vary in size but are often already substantially larger than the reduced minimums, suggesting that the proposed reductions are modest enough to maintain the existing rural development pattern while still allowing for increased housing flexibility. In many cases, parcels meeting the proposed minimums could support incremental increases in housing such as the conversion of existing single-family homes, without requiring significant subdivision or visible changes to the landscape.
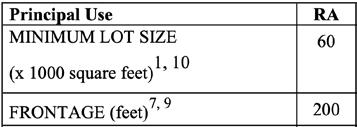
If Deerfield re-zones the CVRD, the Small Business District, and the EPD to allow for multi-family homes by right, it could increase density in the most walkable area closest to town resources like schools, town hall, the library, and transit. Special permits are a real barrier for developers, so this could encourage multifamily development in these areas. Other benefits of this approach include adding more appropriate housing for seniors and diverse populations, and increasing overall population–all of which could contribute to lower utility bills and tax burdens for the whole town.
Another concern with this approach would be that it does not specifically incentivize affordable housing, thus relying on the market to produce affordable housing.
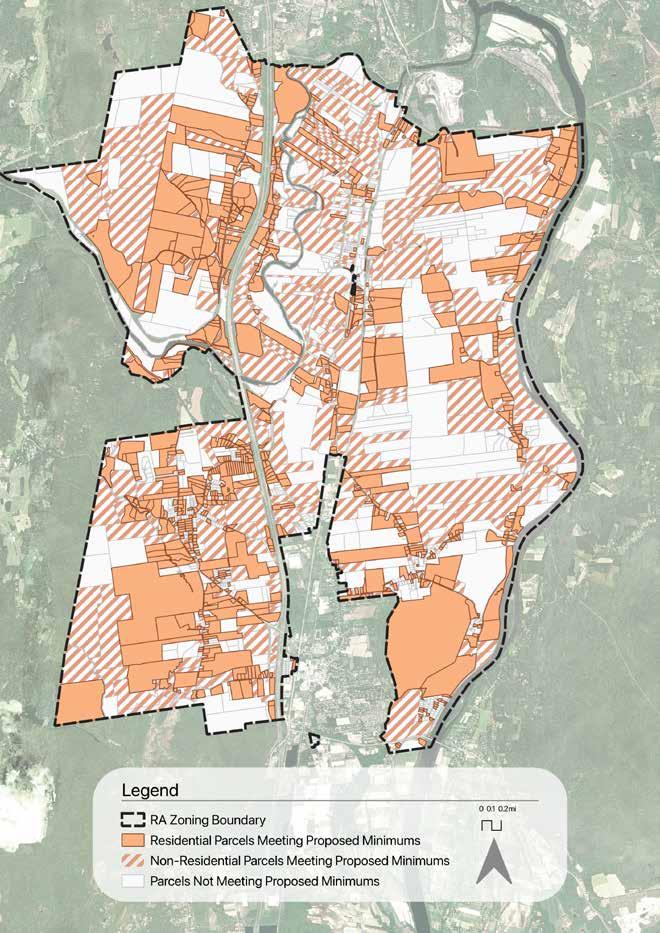
The dimensional requirements found in the Town’s zoning bylaws attempt to establish a particular character for each district. At the same time, they may pose barriers to incremental housing efforts.
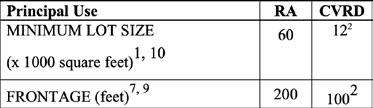
Taking a look at the dimensional requirement table above, a single-family dwelling is expected to have a minimum lot size of 12,000 square feet. An example of two roughly-12,000-square-foot lots can be seen below.
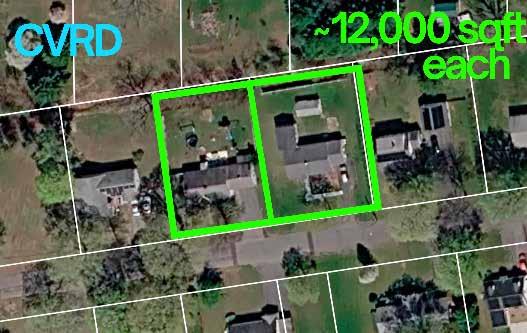
While the CVRD allows for single- and two-family by right, and multi-family housing by special permit, current dimensional requirements add an additional barrier.
A footnote in the single-family requirements references different dimensional requirements for two-family and multi-family dwelling units:
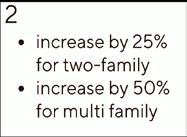
Current Min Lot Size: single-family: 12,000 sqft two-family: 15,000 sqft
multi-family: 18,000 sqft
Current Frontage: single-family: 100 ft two-family: 125 ft multi-family: 150 ft
Even if more housing types are legally allowed by right in CVRD, the minimum lot size requirements make parcels too small to have a duplex (15,000 square feet, 125 feet) or a multi-family home (18,000 square feet, 150 ft).
Knowing this additional barrier, this tool attempts to explore how flexible the CVRD might become if twofamily (and by extension, multi-family) dimensional requirements matched those of the single-family.
The map on the following page highlights parcels that meet the current dimensional requirements for duplexes (15,000 square feet for lot size and 125 feet for frontage). For the purposes of accuracy, two different types of parcels were accounted for: those distinctly labelled as “residential”
under the land use code, as well as any parcel that simply met the dimensional criteria. The former was done to account for parcels that may have been missed by the assessor’s table. In this case, 173 residential parcels and 25 non-residential parcels meet current duplex requirements. Compare this to the map on the right, which highlights parcels that meet the current dimensional requirements for single-family dwellings (12,000 square feet for lot size and 100 feet for frontage). With an increase of almost twice as many parcels, 341 residential parcels lit up along with an additional 39 non-residential parcels. When subtracting duplex-compliant parcels from all parcels, one is left with the map on the next page, now showing parcels that would newly meet duplex standards under single-family dimensional requirements. In this case, 168 residential parcels lit
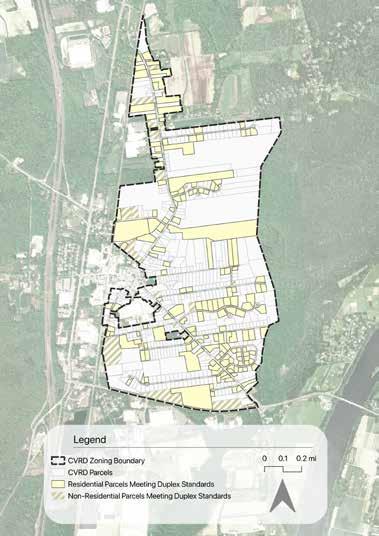
lit up to meet these standards, along with an additional 14 non-residential parcels. Although this adjustment to the Town’s zoning bylaws is seemingly minor, suddenly, a moderate number of parcels could support duplex conversions by right.
With further investigation, it might be worth considering how these numbers might change when including multi-family parcels or further adjusting single-family dimensional requirements; it could remove more hidden barriers.
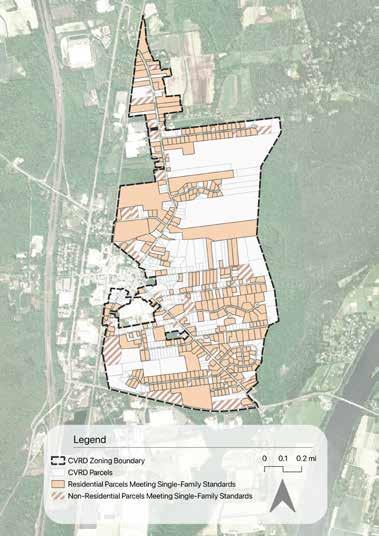
Parcels Newly Meeting Duplex Standards under Single-Family Requirements
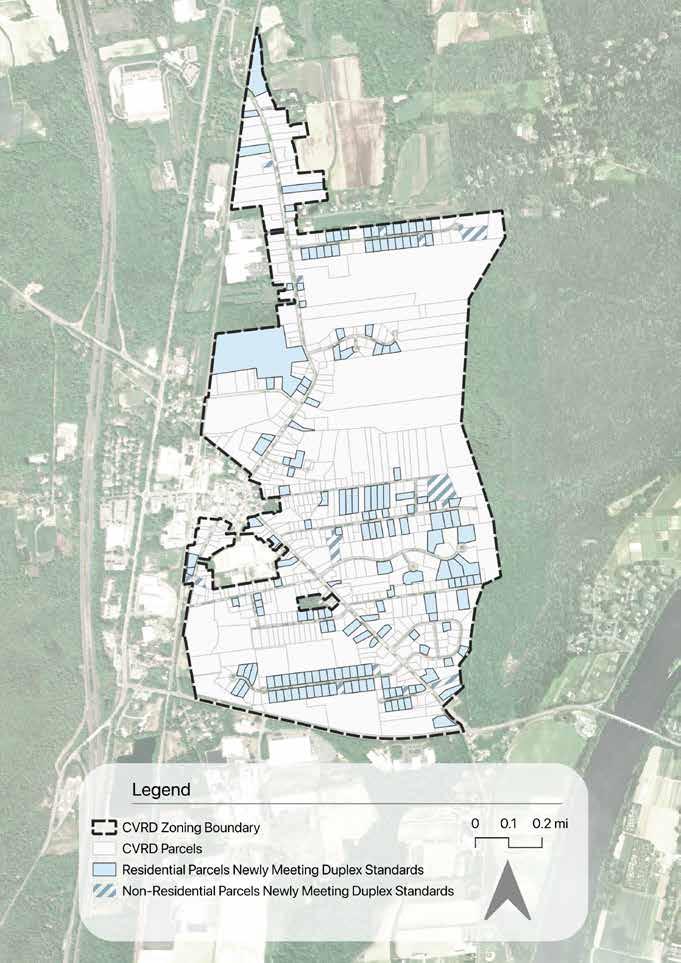
Small adjustments to dimensional requirements can make a large difference to housing potential, particularly when attempting to increase the number of homes per acre. This is very relevant to Deerfield’s housing story, especially since most of the homes are single family. The following scenario attempts to explore how reducing the frontage to 75 feet and adjusting minimum lot size to accommodate four homes per acre could create new opportunities for residential development while maintaining the town’s character.
Parcels were assessed based on two criteria: 1) whether the minimum frontage requirement of 75 feet was met, and 2) whether the total lot area could support at least one dwelling unit under a density of four units per acre. Parcels meeting both criteria were identified as parcels fitted for additional units and assigned fitted unit capacity ranges of 1-3, 3-6, 6-11, and 11+. Parcels were either coded as residential or non-residential under the land use in this analysis.
Among parcels coded as residential, 714 parcels could support 1-3 units, 371 parcels could support 3-6 units, 192 parcels could support 6-11 units, and 317 parcels could support 11 or more units. Non-residential parcels fitted for additional units totaled 672. Parcels that did not meet either lot size or frontage requirements totaled to 816 and were marked as parcels not fitted for more units.
From these results, parcels not fitted for more units tended to be smaller or those without access to roads. Within more clustered areas, residential parcels by fitted unit capacity were most commonly within the 1-3 unit range. Between the two major roadways Interstate 91 and Route 5, these parcels could mostly support between 3-6 units, while some of the largest parcels on the outskirts of town had capacity for 6 or more units.
Overall, these patterns can help target particular areas where incremental housing may be more feasible based on parcel size and road access.
Zoomed in CVRD: Parcels Assessed by Fitted Unit Capacity
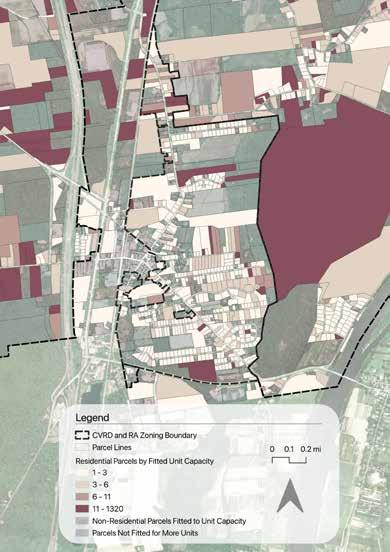
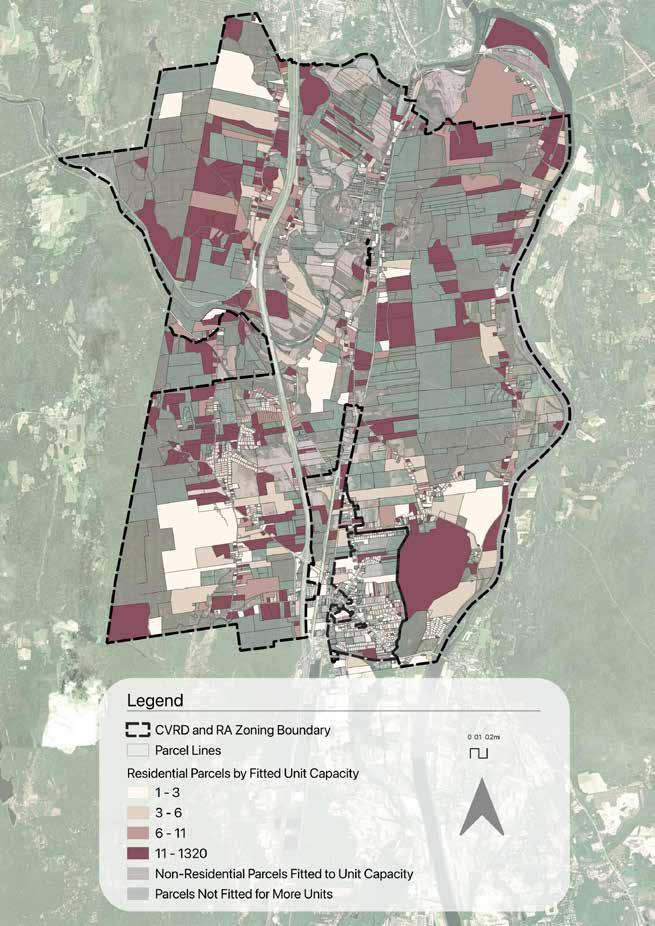
Townhouses, as mentioned in the Housing Typology section, are suitable for infill because of their small footprint. (Missing Middle recommends a minimum lot size of 2750 square feet.) The construction is flexible enough where multiple small units could fit within a parcel or be extended to cover a whole block. Looking at the map on the next page, this tool attempts to explore how many townhouse units could fit throughout the CVRD.
Similar to the previous tool, parcels are identified based on meeting the single-family minimum lot size of 12,000 square feet and/or being labelled as residential under land use code.
Results of the map, summarized in the table below, indicate that 104 parcels are under the minimum lot size for single family (<12,000) but are large enough to fit 1-4 townhouses using the missing middle minimum lot size (2750 per unit). 28 parcels are below the 12,000 minimum lot size and the minimum for the townhouses.
Larger parcels show a higher capacity for townhouses, with there being an interesting distribution among the residential parcels. The 4 to 6 unit range and the 10+ unit range each contain 172 parcels, showing that parcels could feasibly accomodate both moderate- and higher-density development.
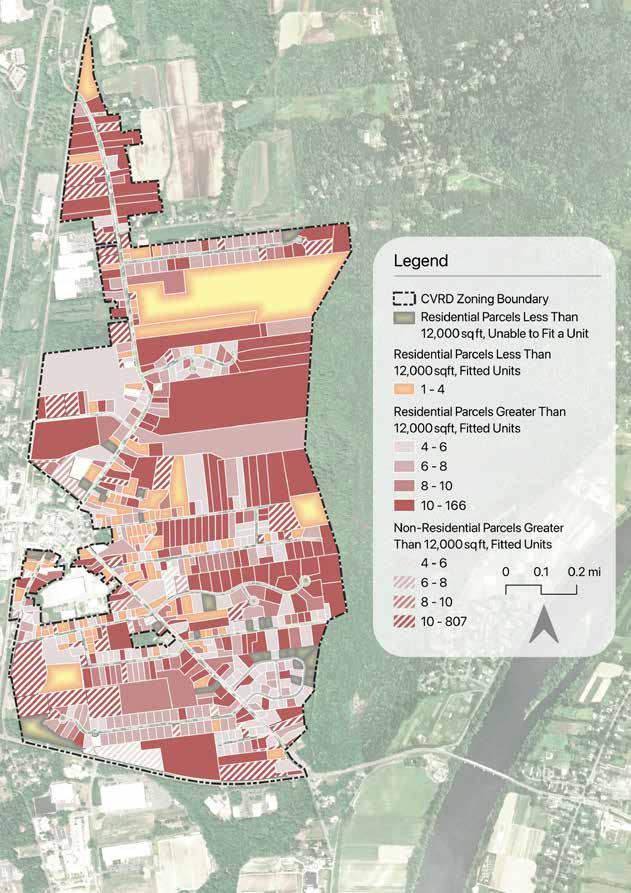
Although the zoning conditions of the Commerical (C-I) and Small Business (C-II) districts are more restrictive in introducing different types of housing, there is still potential in making the most use out of mixed-use housing. This tool attempts to explore the number of residential units that could possibly fit within the existing parcels.
To begin, the area of existing building footprints was subtracted by each parcel area to avoid double counting. Since Missing Middle’s mixed-use typology recommends 1,750 square feet per unit, the remaining buildable area was then divided by this recommendation, resulting in a rounded potential unit value. Finally, this value was categorized into the following ranges: 0 units, 1-2 units, 3-6 units, and 7+ units.
Surprisingly, the majority of the C-I and C-II districts have space to develop more dense housing exceding 7 units. However, for portions that are embedded within high service and infrastructure support areas like the CVRD, unit capacity is varied. In fact, most of the 0 unit capacity comes from parcels in area D. This is likely due to such parcels already having been more developed compared to the rest of its district that may be further away from sewer, housing clusters, and resources.
Mixed-Use Potential Units by Parcel in C-I & C-II Districts
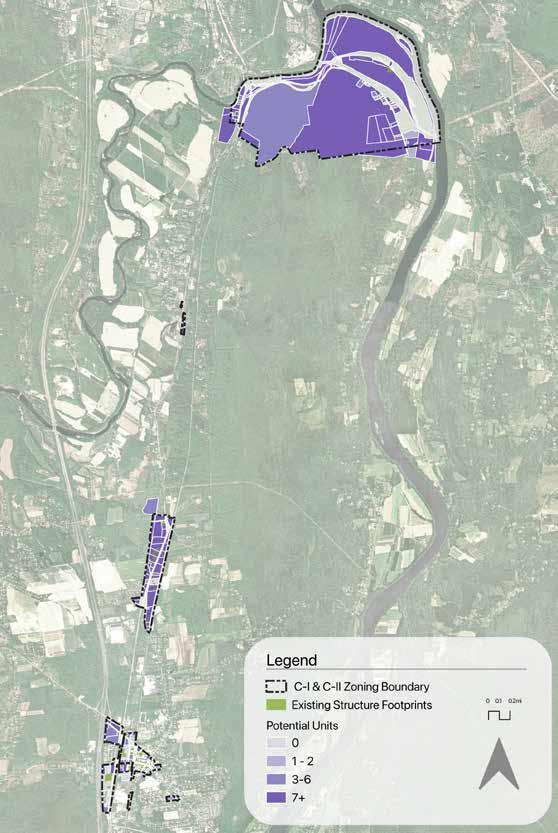
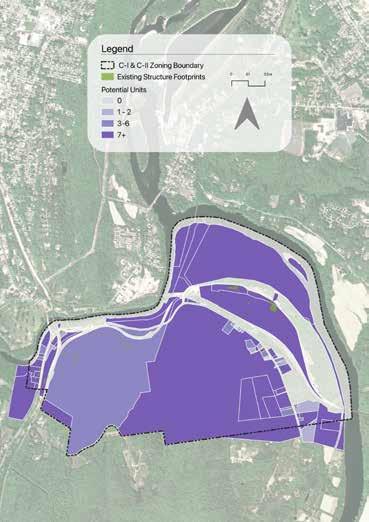
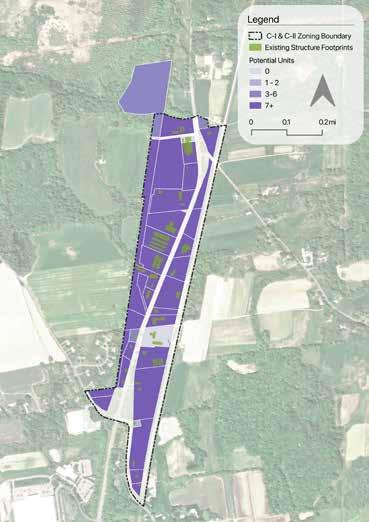
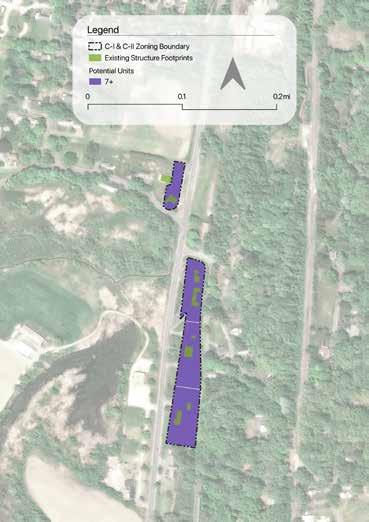
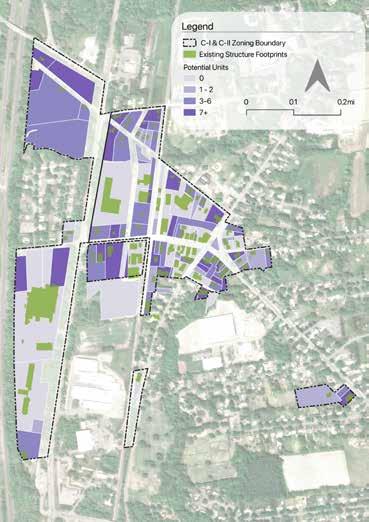
As expressed in the existing conditions as well as the suitability analysis, parcels within CVRD have been highlighted for high housing potential due to their close proximity to sewer/water in South Deerfield (and without the added pressure to maintain a historic landmark status to the extent of parcels in Old Deerfield).
What about the parcels that surround the CVRD within the RA district that also have direct access to sewer/water? Should the zoning requirements for these parcels be the same as requirements for parcels reliant on septic? Or should their zoning reflect their access to infrastructure, potentially aligning more closely with the requirements of the CVRD? Is there a middle ground between rural and village regulations? A series of scenarios were developed to evaluate how reductions in minimum lot size and frontage requirements could affect development capacity within RA parcels that are served by municipal sewer.
Scenarios
The current RA zoning requires a minimum lot size of 60,000 sqft and 200 ft of frontage. Three scenarios representing graduated reductions in dimensional standards were evaluated:
These scenarios attempt to represent increasing levels of flexibility, ranging from more modest reductions (similar to Tool 2.1) which hope to maintain rural character, to more compact standards that approach suburban-like development patterns. Importantly, it is worth noting that even the most reduced scenario is less dense than the minimum residential zoning standards found in CVRD, still allowing any increase of housing potential within the RA parcels near the CVRD to remain contextually appropriate.
To begin, RA parcels were selected if they were within a 150foot buffer from the municipal sewer system. For these parcels, development capacity was then calcuated under both current zoning and the three reduced-dimension scenarios. The number of potential units per parcel was determined by dividing parcel area by the minimum lot size required under each scenario. All results were rounded down to the nearest whole number to reflect realistic subdivision potential.
To account for frontage, two options could occur. For parcels that met the required frontage, they would be subdivided into multiple units based on lot size. For parcels that did not meet required frontage, they only had the current development capacity of one unit since they cannot be further subdivided.
Finally, the units estimated for each scenario would be compared to the unit number allowed under current RA zoning to determine the number of additional units per parcel or net gain in units. This would show how different dimensional standards influence development
potential across sewer-served parcels.
The final map (right) assesses potential across scenarios based on how development capacity changes. For example, a parcel that supports only one unit under current zoning may accommodate multiple units under reduced lot size and frontage requirements, indicating a high level of responsiveness to zoning changes. Parcels that remain limited to a single unit across all scenarios demonstrate low potential for additional development.
In the next series of map closeups, potential is defined by the following:
“High potential” are parcels that could support the largest increase in units under reduced lot size and frontage (unit gains increased steadily from the low, to moderate, to high adjustment scenarios); “Moderate potential” are parcels that showed some additional capacity (where there was a noticeable increase from the low to moderate adjustment scenarios, but smaller gains from the moderate to high adjustment scenarios); “Low potential” are parcels that showed little or no increase under any scenario.
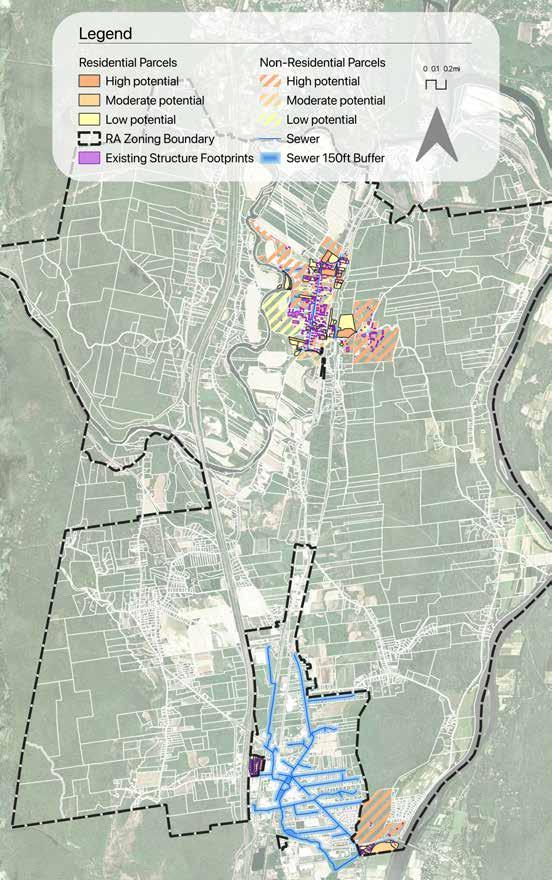
Parcels were also distinguished as residential or nonresidential under the land-use codes.
In total, 193 RA parcels were found to be within 150 feet of municipal sewer, 81 of which were residential parcels and 112 non-residential. Out of the residential parcels, 56 were counted as low potential (69%), 6 as moderate potential (7%), and 19 (23%) as high potential. Most of the high potential residential parcels, however, tended to be located in Old Deerfield, where there may be more restritctions on housing development.
Out of the non-residential parcels, 65 were counted as low potential (58%), 5 as moderate potential (4%), and 42 as high potential (38%). While the purpose of including the non-residential parcels was to account for possible inaccuracies in the assessor’s table, extremely large parcels with high potential are likely environmentally constrained and should be cross-checked against the suitability analysis for confirmation.
Overall, both residential and non-residential parcels within 150 ft of municipal sewer are primarily mapped as low potential for additional development under the three proposed zoning adjustment scenarios. However, for the small subset of residential parcels that show high responsiveness to zoning adjustments, reducing lot size and frontage requirements could meaningfully increase development capacity.
Zoning Responsiveness of Sewer-Served RA Parcels
Old Deerfield (top right)
East of CVRD (bottom left) West of CVRD (bottom right)
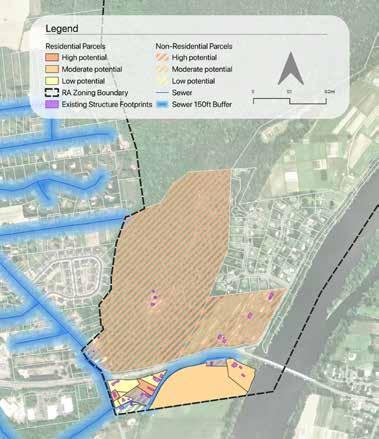
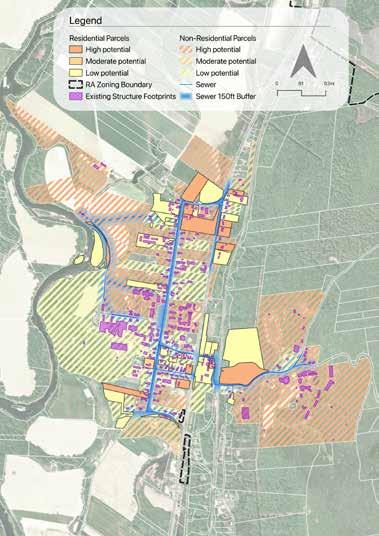
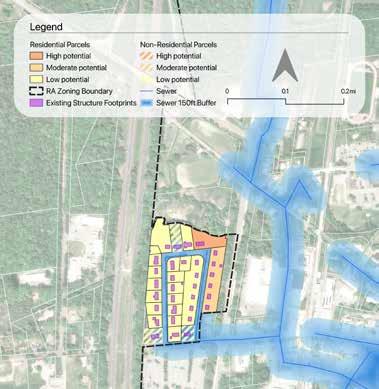
Tool 1.1 Duplexes by Right in RA, Reduced Dimensional Requirements + Sewer Access
Referencing Tool 1.1, where residential parcels in the RA district were identified using reduced dimensional requirements (a minimum lot size of 30,000 square feet and 120 feet of frontage), this analysis further evaluates development feasibility based on access to water and sewer.
Out of the 731 residential parcels identified in the RA district (A), only 23 (3%) are within 150 feet of the municipal sewer system (B). Since the remaining parcels are likely on septic and are potentially limited in additional housing development due to costs and capacity constraints, small infill and building conversion may still be feasible. In the future, it may also be worth exploring how the ability of these parcels to accommodate more units could change if the current sewer system were extended maybe an extra 100-200 feet, similar to what was explored in the suitability analysis.
Tool 1.2 Same Lot Size for Single-Family Homes and Duplexes in CVRD + Sewer Access
In Tool 1.2, parcels were that meet the single-family dimensional requirements were subtracted by parcels that already fit the current duplex dimensions to produce a final map of “newly meeting duplex” parcels (Figure 3). These parcels included both residential and non-residental land-use codes. The municipal sewer system was overlaid on only the residential parcels, since non-residential parcels are unlikely to be converted to housing under current regulations.
Out of the 182 residential parcels (C), 175 intersected the 150-foot sewer buffer, leaving 7 parcels apparently without direct municipal sewer access (D). While this may be true, the 7 parcels identified were located on Snowberry Circle, where the recently built Sugarloaf Condos exist. It is also just as likely that the sewer infrastructure dataset used in this tool is outdated, and may not account for recently extended pipes.
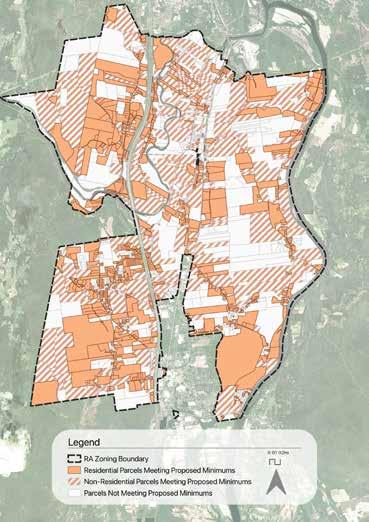
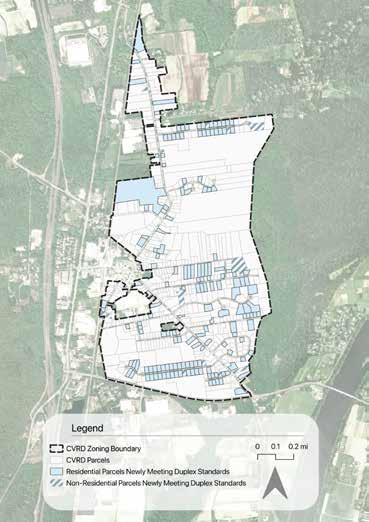
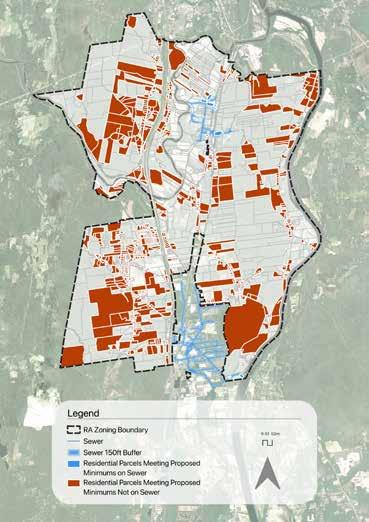
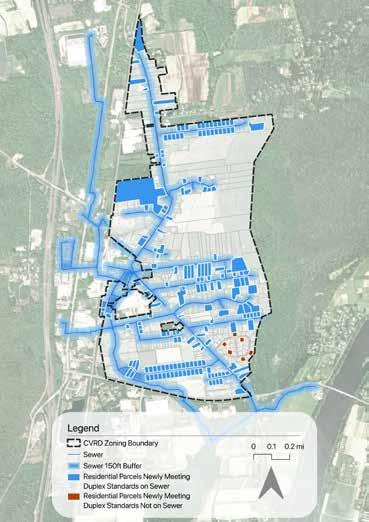
Referencing back to Tool 1.3, where parcels were assessed to explore how reducing the frontage to 75 feet and adjusting minimum lot size to accommodate four homes per acre could create opportunities for housing development, this analysis further determines the feasibility of the tool by overlaying municipal sewer access.
Out of the 2,090 residential parcels that had fitted unit capacity to accommodate four homes per acre (A), 675 (32%) were within 150 feet of the sewer (B). Of those 675 parcels, they were broken down into the following ranges: 385 (53%) residential parcels fit 1 to 3 units, 248 (37%) parcels fit 3 to 6 units, 43 (6%) parcels fit 6 to 11 units, and 26 (5%) parcels fit 11 or more units. Since over half of the identified residential parcels can accommodate 1 to 3 units, particularly within the CVRD, these results further support incremental infill as an appropriate strategy for the Town. Parcels that can accommodate 11 or more units also tended to be located within the CVRD, with some additionally present in nearby commercial districts, which may be worth consideration for mixed-use housing opportunities.
Referencing back to Tool 1.4, where parcels were identified based on meeting the CVRD single-family minimum lot size of 12,000 sqft and divided by Missing Middle’s recommended townhouse footprint of 2,750 sqft, this tool further assesses the housing feasibility of townhouses by overlaying the residential parcels with sewer access.
Out of the 532 residential parcels that exceeded 12,000 sqft (C), a majority of 476 (89%) were within 150 feet of sewer (D). Likewise, of the 132 residential parcels below 12,000 sq ft, 116 (87%) were within 150 feet of sewer. Parcels not within the sewer buffer tended to be located along the outskirts of the CVRD, particularly along the edges of Mount Sugarloaf. Similar to the parcels on Snowberry Circle, this may reflect limitations in the sewer infrastructure dataset rather than actual service gaps. Overall, these results suggest that townhouse development is largely feasible within the CVRD.
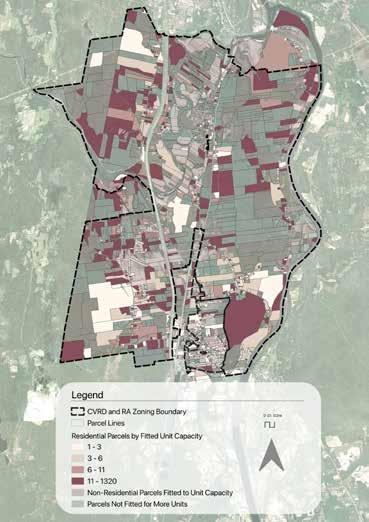
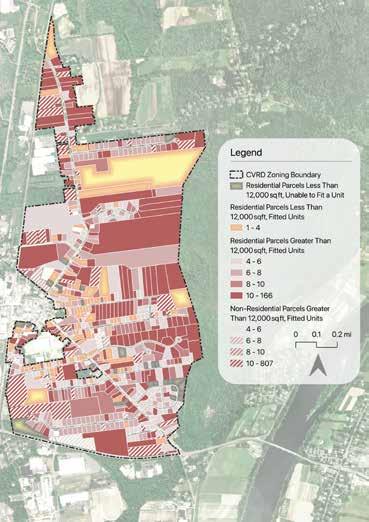
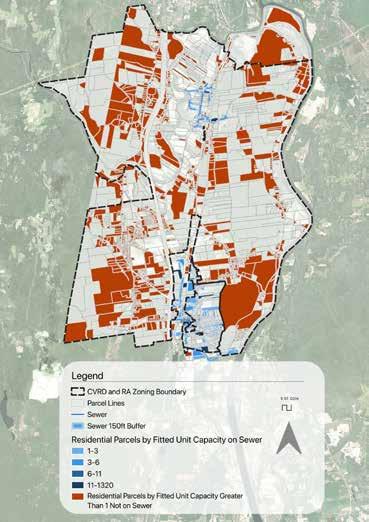
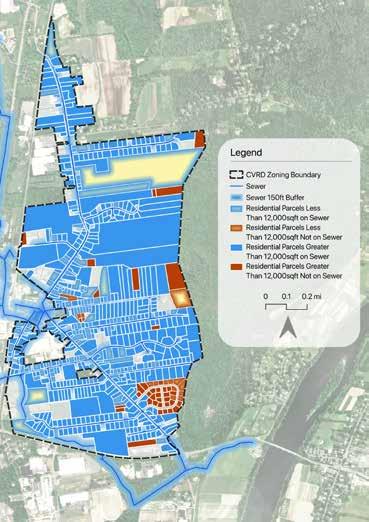
Tool 1.5 Mixed-Use Housing in the Commercial Districts + Sewer Access
Referencing back to Tool 1.5, where parcels were identified to explore the number of residential units that could possibly fit within the existing parcels, only the commercial districts that were in close proximity to the CVRD were found to have access to municipal sewer (see map on the next page). Out of the 201 existing commercial parcels that could potentially fit an additional one or more residential units, approximately 75 (37%) were within 150 feet of sewer. This implies that while mixed-use housing opportunities exist, they are currently limited by infrastructure availability and may depend on future sewer expansion or targeted investment.
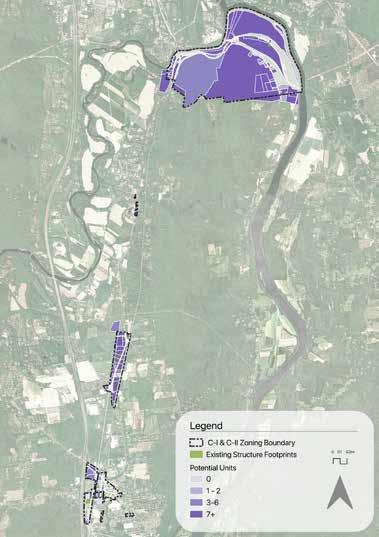
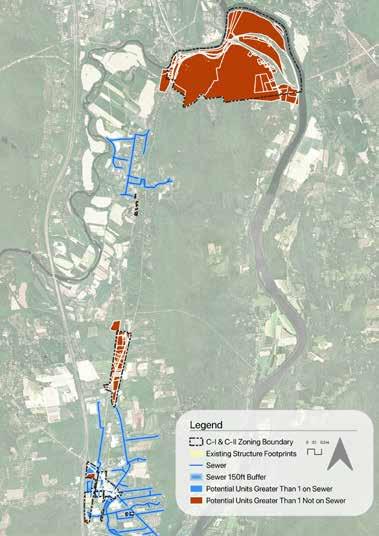
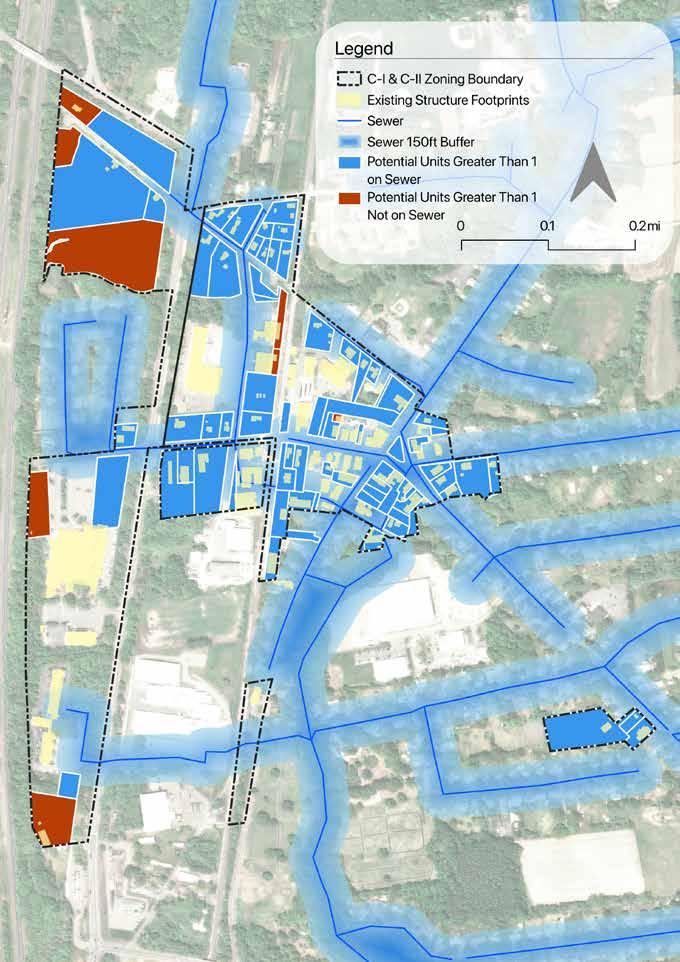
Referencing Tool 1.1, where residential parcels in the RA district were identified using reduced dimensional requirements (a minimum lot size of 30,000 square feet and 120 feet of frontage), this analysis further evaluates development feasibility based on each parcel’s relationship to critical (and protected) environmental areas drawn from the suitability analysis.
Out of the 731 residential parcels in the RA district (A), 391 parcels (53%) are located within critical environmental areas and should be approached with caution for additional housing development (B). These parcels tend to be extremely large and, in many cases, act as buffers between smaller clustered parcels and protected landscapes. If further housing in these areas (or parcels of this size) is desired, it may be useful to encourage Flexible Developments or Conservation Subdivisions, particularly for parcels containing environmentally sensitive land.
In Tool 1.2, parcels that meet the single-family dimensional requirements were subtracted by parcels that already fit the current duplex dimensions to produce a final map of “newly meeting duplex” parcels. These parcels included both residential and non-residental land-use codes. To evaluate development feasibility in relation to environmental constraints, the critical environmental areas layer was overlaid only on residential parcels that newly met duplex standards, since non-residential parcels are unlikely to be converted under current regulations.
Out of the 182 residential parcels newly meeting duplex standards (C), about 36 parcels (20%) are located within the critcal environmental areas, mainly within the northern portion of the CVRD, near wetlands and protected agricultural lands (D). Overall, most parcels remain outside environmentally sensitive areas, suggesting that duplex development is generally feasible within appropriate locations.
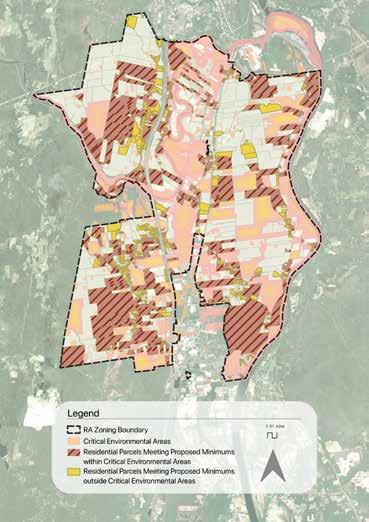
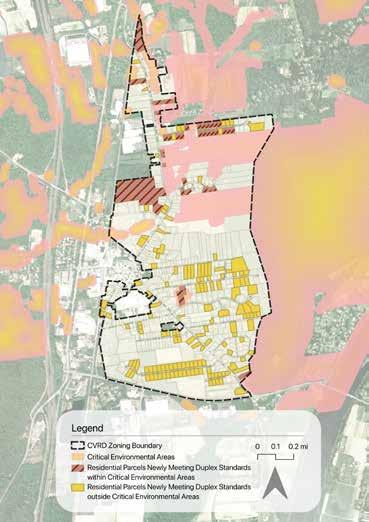
Referencing Tool 1.3, where residential parcels in the RA district were identified using reduced dimensional requirements (a minimum lot size of 30,000 square feet and 120 feet of frontage), this analysis evaluates development feasibility based on each parcel’s relationship to critical environmental areas.
Out of the 2,090 residential parcels that had fitted unit capacity to accommodate four homes per acre (A), 804 (38%) located within critical environmental areas, leaving 1,286 parcels (62%) in more feasible locations for development (B). Of those 1,286 parcels outside of critical areas, 513 (40%) could accommodate 1 to 3 units, 498 (39%) could accommodate 3 to 6 units, 151 (12%) could accommodate 6 to 11 units, and 124 (10%) could accommodate 11 or more units. Similar to the sewer overlay, the majority of the residential parcels have capacity to carry 1 to 3 units. These parcels also tend to be smaller and clustered together: the majority of parcels support 1–3 units, typically smaller and more clustered, particularly in the southern portion of Deerfield.
This analysis evaluates townhouse feasibility by overlaying critical environmental areas. Out of the 532 residential parcels that exceeded 12,000 sqft (C), a majority of 429 (81%) parcels were outside of the critical environmental areas (D). Similarily, of the 132 parcels that were below 12,000sqft, 114 (86%) were also outside of these areas. Protected areas tended to surround Mount Sugarloaf in the east, northern agricultural lands, and wetlands. Overall, approximately 82% of CVRD parcels fall outside environmentally sensitive areas, indicating strong potential for townhouse development in appropriate locations.
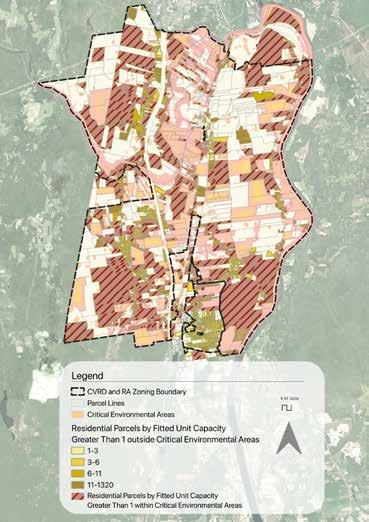
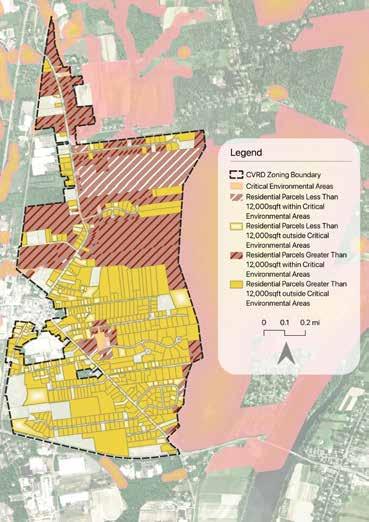
Tool 1.5 Mixed-Use Housing in the Commercial Districts + Critical Environmental Areas
Referencing back to Tool 1.5, where parcels were identified to explore the number of residential units that could possibly fit within the existing parcels, there is a relatively even distribution of parcels within and outside critical environmental areas that can support additional residential units.
Out of the 201 commercial parcels with potential for added housing, approximately 100 are within critical environmental areas, while 101 are outside. This suggests that while mixed-use opportunities exist, careful site-specific consideration is necessary, as development in environmentally sensitive areas may place additional stress on existing ecological systems.
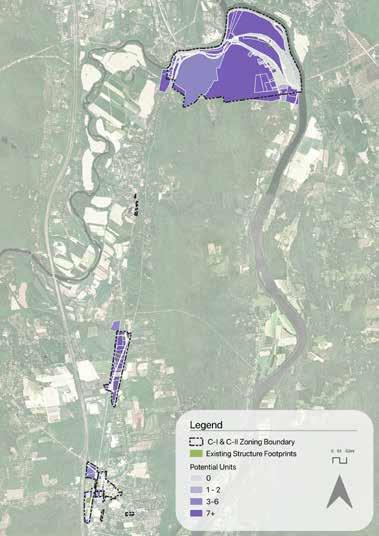
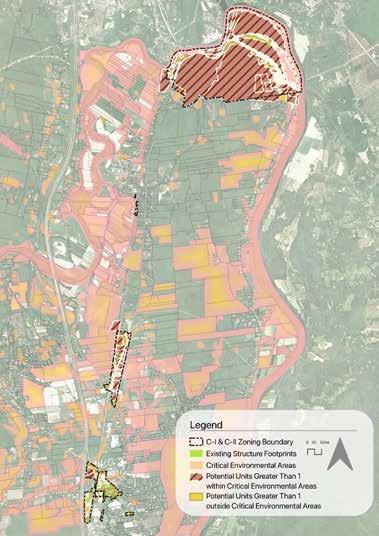
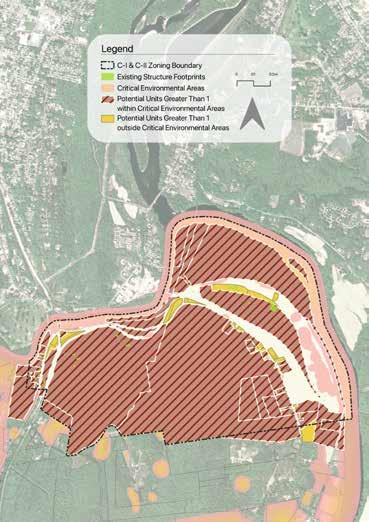
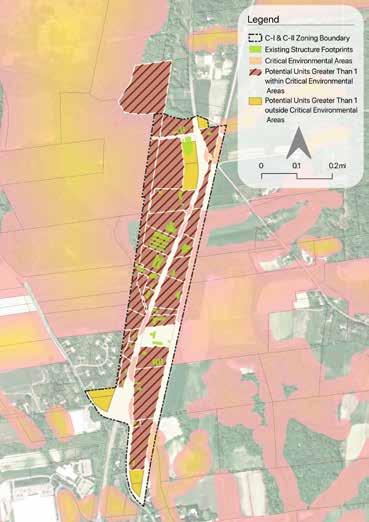
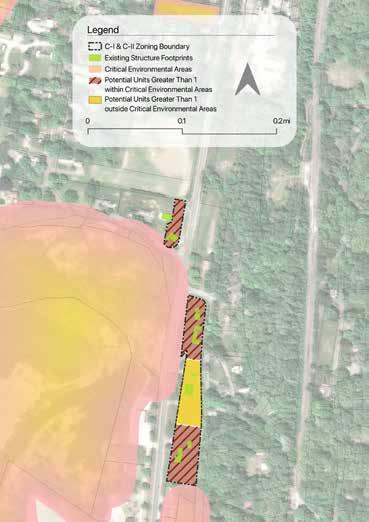
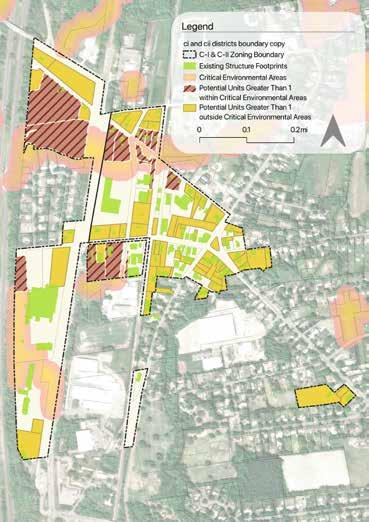
Tool 1.6 Reduced Lot Size with Sewer + Critical Environmental Areas
In Tool 1.6, a series of scenarios were developed to evaluate how reductions in minimum lot size and frontage requirements could affect development capacity within RA parcels that are served by municipal sewer. Overlaying enviromental conditions shows almost an even split of residential parcels within and outside of the critical environmental areas that have potential for more housing. Out of the 81 residential parcels, 41 are within the critical environmental areas. Therefore, while it may be feasible and cost effective to increase housing on these particular RA parcels, it is just as important to be aware of the ecological conditions before tackling such a project.
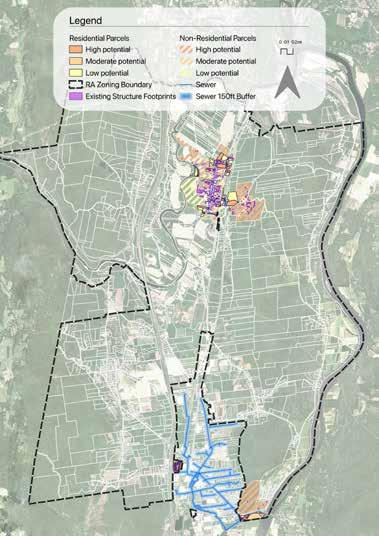
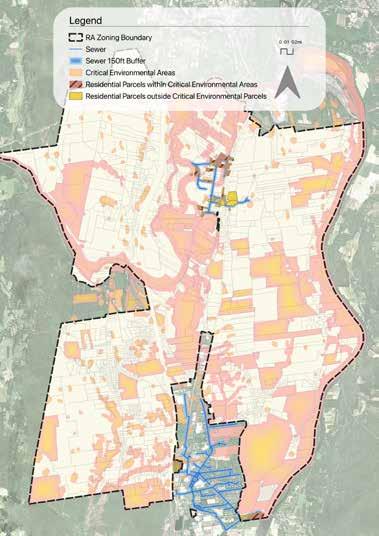
Reduced Lot Size with Sewer + Critical Environmental Areas
Old Deerfield (top right)
East of CVRD (bottom left)
West of CVRD (bottom right)
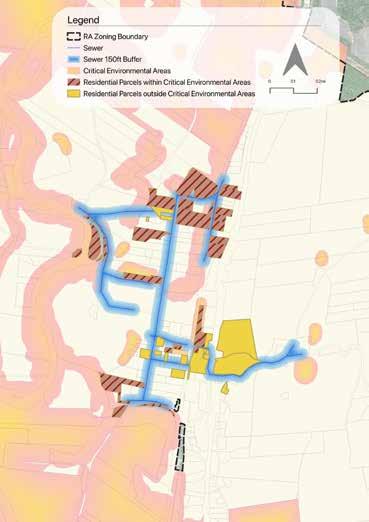
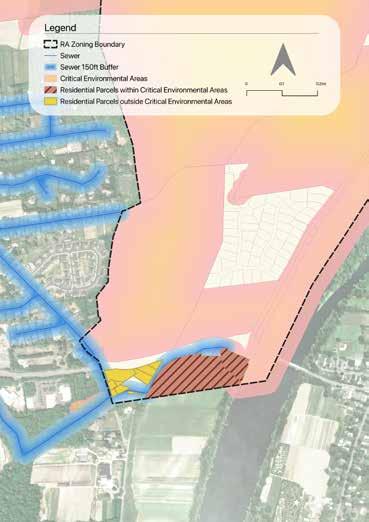
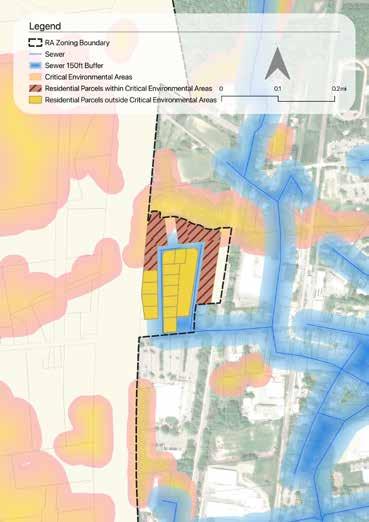
Arendt, Randall. Rural by Design. Planners Press, 1994.
“Case Studies of New Ruralism.” American Planning Association, nne.planning.org/knowledge/ new-ruralism/. Accessed 10 Apr. 2026.
City of South Bend. South Bend Neighborhood Infill: Pre-approved, ready-to build housing. City of South Bend, July 2025,https://docs.southbendin.gov/WebLink/DocView.aspx?d bid=0&id=401746&page=1&cr=1. March 27, 2026.
Deerfield Healthy Soils Report, https://www.deerfieldma.us/DocumentCenter/View/1044/Deer field-Healthy-Soils-Report. Accessed 27 Mar. 2026.
Farberov, Snejana. “Affordability Crisis Worsens as Home Prices Hit ‘Shocking’ New High—5 Times What the Typical Household Earns.” Realtor.Com, 24 June 2025, www.realtor.com/news/ trends/affordability-crisis-home-prices-record-household-income-housing-report-2025/.
FRCOG. Regional Housing Plan 2024. FRCOG https://frcog.org/wp-content/uploads/2024/10/FR COG-Housing-Plan-FINAL-10.2.24.pdf. March 27, 2026.
FRCOG. “Franklin County Housing Snapshot.” Mass.Gov, Commonwealth of Massachusetts, https:// www.mass.gov/info-details/franklin-county-housing-snapshot. Accessed 27 Mar. 2026.
FRCOG. “Franklin Regional Council of Governments.” FRCOG, frcog.org/. Accessed 27 Mar. 2026. Franklin County Regional Housing Plan, https://frcog.org/wp-content/uploads/2024/10/FR COG-Housing-Plan-FINAL-10.2.24.pdf. Accessed 27 Mar. 2026.
FRCOG Housing Study Dashboard, CommunityScale, communityscale.github.io/FRCOG/#Over view. Accessed 27 Mar. 2026.
Hogan, Terry, and Wes LeBlanc. “How a New Vision for Flexible Co-Living Conversions Can Sup port Housing Affordability.” Gensler, 21 Oct. 2025, www.gensler.com/blog/pew-study-flexi ble-office-to-co-living-conversions.
“Housing Choice Grant Program.” Mass.Gov, Commonwealth of Massachusetts, 2026, https://www. mass.gov/how-to/housing-choice-grant-program.
“Housing Choice Initiative Designation.” Mass.Gov, Commonwealth of Massachusetts, 2026, www. mass.gov/info-details/housing-choice-initiative-designation.
“Housing Supply and Production.” Mass.Gov, Commonwealth of Massachusetts, www.mass.gov/ housing-supply-and-production. Accessed 27 Mar. 2026.
Lapping, Mark B. A Landscape History of New England. MIT Press, 2013.
Larabee, Chris. “Deerfield Officials Eye Federal Grant Program for Flooding Mitigation.” Greenfield Recorder, 7 Feb. 2025, recorder.com/2025/02/07/deerfield-officials-eyefedeal-grant-program-for-flooding-mitigation-59293811/#:~:text=Flooding%20near%20 Bloody%20Brook%20in,has%20inundated%20yards%20and%20roads.
Mass.Gov, https://www.mass.gov/doc/black-gum-pin-oak-swamp-white-oak-perched-swamp-0/ download#:~:text=Page%201,nested%20within%20larger%20wetland%20systems. Accessed 27 Mar. 2026.
McKinsey & Company. Nationwide Housing Crisis, 1 Oct. 2025, www.mckinsey.com/featured-in sights/week-in-charts/nationwide-housing-crisis.
Metropolitan Area Planning Council. Little Living. Metropolitan Area Planning Coucil, 2018,https:// living-little.mapc.org/static/Living-Little-Full-Report-9fc1870f1f8086682647d134aea345a0. pdf. March 27, 2026.
“New Ruralism.” New Ruralism | The McHarg Center, mcharg.upenn.edu/blog/new-ruralism. Ac cessed 10 Apr. 2026.
Rural & Small Town Housing Choice Community Designation , https://www.mass.gov/doc/2026rural-and-small-town-housing-choice-designation-best-practices/download. Accessed 27 Mar. 2026.
Sadler, Anna Jarita. Rural Character in the Hilltowns: Understanding Attitudes about Planning in the Context of Attachment to Place. 2008.
“Social Housing Overview.” House Our Neighbors, www.houseourneighbors.org/social-hous ing-overview. Accessed 27 Mar. 2026.
Stocker, Jordan. “NLIHC Releases 2025 Gap Report: What It Means for Massachusetts - Chapa - Cit izens’ Housing & Planning Association.” CHAPA, 15 Mar. 2025, chapa.org/nlihc-releases2025-gap-report-what-it-means-for-massachusetts/.
“Stormwater Management.” NACTO, 23 Dec. 2024, nacto.org/publication/urban-street-designguide/street-design-elements/stormwater-management/.
Town of Deerfield. “Zoning Code.” Code of Use Regulations, sec. 239-1, 1986
Town of Deerfield. “Zoning Code.” Code of Zoning, ch. 179
“Veterans’ Services.” Town of Deerfield, www.deerfieldma.us/247/Veterans-Services. Accessed 27 Mar. 2026.“Veterans’ Services.” Town of Deerfield, www.deerfieldma.us/247/Veterans-Ser vices. Accessed 27 Mar. 2026.
“What Does 15 Units per Acre Look Like?” Lincoln Institute of Land Policy, Lincoln Institute of Land Policy, 19 Dec. 2024, www.lincolninst.edu/data/what-does-15-units-per-acre-looklike?utm_source=pardot&utm_medium=email&utm_term=xxx_publication_housing&utm_ content=lle2512_what_does_15_units_per_acre_best_of_2025&utm_campaign=_landlines.

















The town of Deerfield is a small, rural community in Franklin County, Massachusetts. The Town contracted the Conway School to create a housing analysis in support of the planned Housing Production Plan update. This report details strategies that Deerfield can undertake to increase housing while protecting its abundant natural resources, supporting equity, and preserving the rural character so many of its residents cherish.
The Conway School is the only institution of its kind in North America. Its focus is sustainable landscape planning and design and its graduates are awarded a Master of Science in Ecological Design degree. Each year, students from diverse backgrounds are immersed in a range of real-world design and planning projects, ranging from sites to cities to regions.