2Q 2 019 | M A NH AT TA N | 2
Overview Closed Sales
Contracts Signed
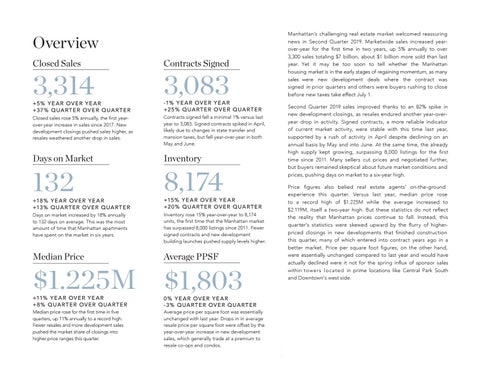
+5% Y E A R OV E R Y E A R +3 7 % Q UA R T E R OV E R Q UA R T E R
-1% Y E A R OV E R Y E A R +2 5% Q UA R T E R OV E R Q UA R T E R
3,314
3,083
Closed sales rose 5% annually, the first yearover-year increase in sales since 2017. New development closings pushed sales higher, as resales weathered another drop in sales.
Contracts signed fell a minimal 1% versus last year to 3,083. Signed contracts spiked in April, likely due to changes in state transfer and mansion taxes, but fell year-over-year in both May and June.
Days on Market
Inventory
132
+18 % Y E A R OV E R Y E A R +13 % Q UA R T E R OV E R Q UA R T E R
8,174
+15% Y E A R OV E R Y E A R +2 0 % Q UA R T E R OV E R Q UA R T E R
Days on market increased by 18% annually to 132 days on average. This was the most amount of time that Manhattan apartments have spent on the market in six years.
Inventory rose 15% year-over-year to 8,174 units, the first time that the Manhattan market has surpassed 8,000 listings since 2011. Fewer signed contracts and new development building launches pushed supply levels higher.
Median Price
Average PPSF
+11% Y E A R OV E R Y E A R + 8 % Q UA R T E R OV E R Q UA R T E R
0 % Y E A R OV E R Y E A R - 3 % Q UA R T E R OV E R Q UA R T E R
$1.225M Median price rose for the first time in five quarters, up 11% annually to a record high. Fewer resales and more development sales pushed the market share of closings into higher price ranges this quarter.
$1,803
Average price per square foot was essentially unchanged with last year. Drops in in average resale price per square foot were offset by the year-over-year increase in new development sales, which generally trade at a premium to resale co-ops and condos.
Manhattan’s challenging real estate market welcomed reassuring news in Second Quarter 2019. Marketwide sales increased yearover-year for the first time in two years, up 5% annually to over 3,300 sales totaling $7 billion, about $1 billion more sold than last year. Yet it may be too soon to tell whether the Manhattan housing market is in the early stages of regaining momentum, as many sales were new development deals where the contract was signed in prior quarters and others were buyers rushing to close before new taxes take effect July 1. Second Quarter 2019 sales improved thanks to an 82% spike in new development closings, as resales endured another year-overyear drop in activity. Signed contracts, a more reliable indicator of current market activity, were stable with this time last year, supported by a rush of activity in April despite declining on an annual basis by May and into June. At the same time, the already high supply kept growing, surpassing 8,000 listings for the first time since 2011. Many sellers cut prices and negotiated further, but buyers remained skeptical about future market conditions and prices, pushing days on market to a six-year high. Price figures also belied real estate agents' on-the-ground experience this quarter. Versus last year, median price rose to a record high of $1.225M while the average increased to $2.119M, itself a two-year high. But these statistics do not reflect the reality that Manhattan prices continue to fall. Instead, this quarter's statistics were skewed upward by the flurry of higherpriced closings in new developments that finished construction this quarter, many of which entered into contract years ago in a better market. Price per square foot figures, on the other hand, were essentially unchanged compared to last year and would have actually declined were it not for the spring influx of sponsor sales within towers located in prime locations like Central Park South and Downtown's west side.
President & CEO S A L E S | PAG E 3 I N V EN TO R Y | PAG E 6 P R I C E S | PAG E 8 N E I G H B O R H O O DS | PAG E 10
2Q 2 019 | M A NH AT TA N | 3
Sales •
Second Quarter 2019 marketwide sales rose 5% year-over-year to 3,314 closings, the first year-over-year increase and greatest number of sales since Third Quarter 2017. This quarter’s yearly improvement in sales followed six straight quarters with declines. Total sales volume rose year-over-year for the second consecutive quarter, up 8% to $7 billion in sales, the highest in seven quarters. New development closings have powered the increases in sales volume experienced year-to-date in 2019.
•
3,083 contracts were signed from April through June, an annual drop of 1%. While signed contracts spiked in April as buyers and sellers rushed to sign and close before new tax rates take effect in July, they fell year-over-year in May and June.
•
More than 20% of all Second Quarter 2019 closings were apartments that signed prior to the start of 2019. This percentage was more than 10% higher than last year when just 10% of all closings had contract dates predating the start of 2018. CLOS E D S A L E S
2Q18
%CHG (YR)
1Q19
%CHG (QTR)
CLOSED SALES
3,314
3,164
5%
2,412
37%
SALES VOLUME
$7.03B
$6.48B
8%
$4.98B
41%
3,083
3,124
-1%
2,473
25%
132
112
18%
116
13%
CONTRACTS SIGNED DAYS ON MARKET
•
Average days on market increased 18% versus last year, with apartments typically taking 132 days to find a buyer. This was the longest amount of time since Second Quarter 2013.
Contracts Signed
AV ER AG E DAYS O N M A R K E T
5,000
150
5,000
4,000
120
4,000
3,000
90
3,000
2,000
60
1,000
30
0
2Q15
2Q16
2Q17
2Q18
2Q19
0
DAYS ON MARKET
NUMBER OF CLOSED SALES
Closed Sales
2Q19
NUMBER OF CONTRACTS SIGNED
•
CO N T R AC T S S I G N E D
2,000
1,000
0
2Q15
2Q16
2Q17
2Q18
2Q19
2Q 2 019 | M A NH AT TA N | 4
2Q19
2Q18
%CHG (YR)
1Q19
%CHG (QTR)
1,672
1,771
-6%
1,385
21%
MARKET SHARE
50%
56%
-117%
57%
55%
DAYS ON MARKET
129
110
17%
111
17%
SALES
Resale co-op sales fell 6% year-over-year to 1,672 closings, the lowest number of any second quarter since 2009. This was the fifth consecutive quarter that sales declined on an annual basis, the only product type for which sales have now declined on a yearly basis for over a year. Second Quarter 2019 was the first time since 2017 that resale co-op market share fell, dipping 5% versus last year and 6% from last quarter.
NUMBER OF CLOSED SALES
CLOS E D S A L E S
AV ER AG E DAYS O N M A R K E T
2,500
125
2,000
100
1,500
75
1,000
50
500
25
0
2Q15
2Q16
2Q17
2Q18
2Q19
0
DAYS ON MARKET
Resale Co-op Sales
2Q18
%CHG (YR)
1Q19
%CHG (QTR)
SALES
909
988
-8%
667
36%
MARKET SHARE
27%
31%
19%
28%
7%
DAYS ON MARKET
136
115
19%
128
7%
The number of resale condo sales fell 8% year-over-year to 909 closings. Since the Manhattan market began to slow 14 quarters ago in First Quarter 2016, resale condo sales have declined year-over-year in every quarter but one. By Second Quarter 2019, resale condo sales were 77% below their 2013 peak and spent an average of 136 days on the market, the longest amount of time in six years.
2Q19
2Q18
%CHG (YR)
1Q19
%CHG (QTR)
SALES
736
405
82%
360
104%
MARKET SHARE
22%
13%
9%
15%
7%
Closed new development sales increased by the greatest percentage since Second Quarter 2010, up 82% year-over-year to 736 closings, a three-year high. Fifteen new developments have commenced closings so far this year, double the number that began closings in the first six months of 2018. Included among these are Fifteen Hudson Yards and One Manhattan Square, each of which had well over 100 contracts ready to close by the start of the quarter. Note: New developments are excluded because many available, unsold units are held off the market for long periods of time.
NUMBER OF CLOSED SALES
New Development Sales
1,500
150
1,250
125
1,000
100
750
75
500
50
250
25
0
2Q15
2Q16
2Q17
2Q18
2Q19
2Q15
2Q16
2Q17
2Q18
2Q19
800 600 400 200 0
0
DAYS ON MARKET
2Q19
NUMBER OF CLOSED SALES
Resale Condo Sales
2Q 2 019 | M A NH AT TA N | 5
Sales Days on Market by Price Range % CH AN G E (Y E AR -OVER- YEA R)
2Q 19
2Q19
Market Share by Price Range U N D ER $ 5 0 0 K
2Q 18
100%
2Q18 131 days
+23%
U N DER $ 5 0 0 K
107 days
$ 50 0 K TO $1M
119 days
+22
$ 5 0 0 K TO $1M
97 days
$1M TO $2M
130 days
+17%
$1M TO $ 2 M
111 days
$2M TO $3M
145 days
+18%
$ 2 M TO $ 3 M
124 days
$3M TO $ 5M
177 days
+26
$ 3 M TO $ 5M
140 days
20%
$ 5M+
184 days
-2%
$ 5M+
187 days
0%
UNDER $ 50 0 K
%
%
80% 60% 40%
$ 5 0 0 K - $1M 6% 7% 10%
$1M - $ 2 M
9%
8%
8%
9%
8%
10%
2Q15
11%
11%
26%
27%
34%
17%
$5M+
8%
26%
35%
$3M-$5M
8%
11%
24%
$2M-$3M
36%
33%
13%
27%
32%
13%
11%
12%
11%
2Q16
2Q17
2Q18
2Q19
Average days on market rose for all price ranges except for the over $5M market. Compared to last year, that range had half as many units spend over a year on the market, driving days on market down by 3 days. Increases in studio to two bedroom inventories pushed days on market higher under $3M.
Versus this time last year, the share of sales over $1M grew 5%, with the $1M to $2M and $3M to $5M ranges capturing an additional 2% thanks to the increase in new development sales. The drop in resale condo and co-op sales fueled a 4% drop in sales from $500K to $1M and a 1% drop in under $500K.
Days on Market by Bedroom Type
Market Share by Bedroom Type
% CH AN G E (Y E AR -OVER- YEA R)
2Q 19
2Q19
91 days
80%
1 BED
104 days
60%
+16%
2 BED
115 days
40%
+5%
3+ BED
141 days
20%
127 days
STUDIO
1 BED
125 days
%
+20
2 BED
134 days 148 days
3+ BED
100%
2Q18 +39%
STUDIO
STUDIO
2Q 18
0%
Days on market increased for all bedroom types, with the magnitude of year-overyear shifts inversely related to apartment size. Marketing times lengthened most for studios, up 39%, and least for three+ bedrooms, which were up only 5%.
1 BED
16%
2 BED
3+ BED
18%
20%
18%
19%
31%
31%
31%
32%
37%
36%
38%
39%
17%
14%
13%
13%
10%
2Q15
2Q16
2Q17
2Q18
2Q19
29%
38%
The market shares of sales declined 2% for studios and 3% for three+ bedrooms. One and two bedroom market share each rose 2%, pushed higher thanks to new development closings Downtown.
2Q 2 019 | M A NH AT TA N | 6
Inventory •
Marketwide inventory rose 15% year-over-year to 8,174 active listings, the first time since Third Quarter 2011 that active listings have exceeded 8,000 units.
•
Inventory also increased versus First Quarter 2019, up 20%. This quarter-overquarter increase is typical of spring seasonality, but the pace at which supply grew versus the first quarter was faster than any quarter since 2016.
•
•
Most of the inventory available as of the end of the quarter were lingering apartments listed in previous quarters which had not yet sold, as Second Quarter 2019 actually had 10% fewer homes hit the market compared to last spring. This quarter’s year-over-year increase therefore resulted from fewer contracts signed during the first six months of 2019 compared to last year and the launch of several new developments that publicly listed units following the commencement of sales in Second Quarter 2019.
BY PRICE R ANGE 2Q18 570
+21
UNDER $ 50 0 K
472
$ 50 0 K TO $1M
2,267
+22
$ 50 0 K TO $1M
1,857
$1M TO $2M
2,088
+13%
$1M TO $2M
1,841
$2M TO $3M
1,156
+18%
$2M TO $3M
$3M TO $ 5M
976
%
1,117 500
1,000
1,500
8,174
7,078
15%
6,831
20%
5,000 4,000 3,000 2,000 1,000 0
2Q19
1Q15 2Q15 3Q15 4Q15 1Q16 2Q16 3Q16 4Q16 1Q17 2Q17 3Q17 4Q17 1Q18 2Q18 3Q18 4Q18 1Q19 2Q19
2Q18
2Q19
UNDER $ 50 0 K
0
%CHG (QTR)
BY BEDROOM T Y PE
2Q19
$ 5M+
1Q19
6,000
By bedroom type, increases in listed supply exceeded 10% for all types. Studios, which saw sales decline most, saw supply grow most, up 19%. Conversely, slower growth in one bedroom supply correlated with a 9% yearover-year increase in closed sales.
% C HA NGE (YE A R -OV E R -YE A R )
%CHG (YR)
7,000
Inventory growth was seen in all price ranges, but was most pronounced at the low-end under $1M where growth rates exceeded 20%. Supply increased by less at higher prices, and even increased over $5M for the first time in two years.
Breakdown of Active Listings
2Q18
8,000
NU MBER OF UNIT S
•
INVENTORY
2Q19
2,000
2,500
%
%
+5
%
+12
2Q18 835
+19
S TU DIO
1 BEDROOM
2,534
%
+12
1 BEDROOM
2,267
2 BEDROOM
2,587
+19%
2 BEDROOM
2,181
982
3+ BEDROOM
2,218
+15%
3+ BEDROOM
1,931
$3M TO $ 5M
933
0
$ 5M+
993
0
500
1,000
1,500
2,000
S TU DIO
500
1,000
1,500 2,000
2,500
2,500
%
0
500
699
1,000
1,500
2,000
2,500
2Q 2 019 | M A NH AT TA N | 7
Resale Co-op Inventory 1Q19
%CHG (QTR)
3,887
3,380
15%
3,217
21%
48%
48%
0%
47%
0%
Resale co-op inventory rose 15% year-over-year to 3,887 active listings, the highest quarterly total since Third Quarter 2012. Resale co-op supply has now risen by double-digits for seven consecutive quarters, a trend not experienced since 2009.
MARKET SHARE
%CHG (YR)
1Q19
%CHG (QTR)
3,182
2,733
16%
2,628
21%
39%
39%
0%
38%
0%
Resale condo inventory increased 16% to 3,182 available units, and was last higher in First Quarter 2009. In Second Quarter 2019, two new resale condo listings hit the market for every apartment purchased from April through June.
%CHG (YR)
1Q19
%CHG (QTR)
1,105
965
15%
981
13%
MARKET SHARE
14%
14%
0%
14%
-1%
NEW UNIT LAUNCHES
749
647
16%
383
96%
INVENTORY
New development listings rose for the first time in six quarters, rising 15% annually to 1,105 publicly listed units, the highest total since 2010. Inventory this quarter was pushed higher by the launch of eleven new developments over the last three months, nearly all of which publicly listed their units shortly after announcing the launch of sales.
60 50
2,000
40
1,500
30
1,000
20
500 0
10 2Q15
2Q16
2Q17
2Q18
2Q19
4,000 3,500 3,000 2,500 2,000 1,500 1,000 500 0
2Q15
2Q16
2Q17
2Q18
2Q19
1,250 1,000 NU MBER OF UNIT S
2Q18
70
2,500
New Development Inventory 2Q19
80
3,000
NU MBER OF UNIT S
INVENTORY
2Q18
90
3,500
Resale Condo Inventory 2Q19
100
4,000
750 500 250 0
2Q15
2Q16
2Q17
2Q18
2Q19
0
100 90 80 70 60 50 40 30 20 10 0
100 90 80 70 60 50 40 30 20 10 0
% SHARE
%CHG (YR)
% SHARE
2Q18
% SHARE
% SHARE
MARKET SHARE
2Q19
NU MBER OF UNIT S
INVENTORY
N U M B ER O F U N I T S
2Q 2 019 | M A NH AT TA N | 8
Prices •
•
Marketwide average and median price and price per square foot statistics all increased year-over-year. Given that resale price statistics mostly declined versus last year, this quarter’s pricing gains were a result of significant increase in new development sales. Median price rose 11% year-over-year to a record-high of $1.225M. The share of new development sales increased from 12% last year to more than 22% in Second Quarter 2019, pushing more sales into higher price ranges versus Second Quarter 2018.
•
Although the median increased by double-digits, average sale price grew by a more moderate 3% year-over-year. Averages this quarter were influenced by a 50% drop in closings over $30M.
•
Price per square foot increases were negligible, however. Median and average price per square foot each rose less than 1% to $1,331 and $1,803 per square foot, respectively. Price per square foot figures this quarter were largely supported by a select number of new development penthouse and 220 Central Park South closings, without which average and median price per square foot would have declined.
•
2Q18
%CHG (YR)
1Q19
%CHG (QTR)
MEDIAN PRICE
$1.225M
$1.100M
11%
$1.135M
8%
AVERAGE PRICE
$2.117M
$2.047M
3%
$2.064M
3%
MEDIAN PPSF
$1,331
$1,325
0%
$1,274
5%
AVERAGE PPSF
$1,803
$1,795
0%
$1,852
-3%
•
Resale condo price figures all dropped versus last year. Median price fell 5% to $1.350M while average price fell 3% year-over-year to its lowest level since 2015. In addition to a noticeable drop in resales at recently completed well-located new developments, more closings took place at older condominiums that were less centrally located.
•
New development average and median sale price fell more than 10% annually. Closings under $3M grew at nearly double the pace that sales over $3M did, capturing a greater share of overall new development sales. Yet, average and median price per square foot figures were nevertheless higher versus a year ago; there was an absolute increase in sales over $3,000 per square foot due to ongoing deliveries at luxury new developments like 220 Central Park South, One Eleven Murray, Fifteen Hudson Yards, and 565 Broome.
Resale co-op median price rose 2% year-over-year to $829K, but median price per square foot fell 5% in the same period to $1,000. Buyers in Second Quarter 2019 moved east and north in pursuit of more space over prime locations. Average price and price per square foot both dropped as fewer closings took place within historically expensive buildings.
Median and Average Price MEDIAN PRICE
Price Per Square Foot
AVERA GE PRIC E
AV E R A G E P P SF
$2,000
$2M
$1,800
PRICE PER SQUARE FOOT
$2.5M
$1.5M
SALE PRICE
2Q19
$1M $0.5M $0
2Q15
2Q16
2Q17
2Q18
2Q19
M ED I AN P P S F
$1,600 $1,400 $1,200 $1,000
2Q15
2Q16
2Q17
2Q18
2Q19
2Q 2 019 | M A NH AT TA N | 9
Resale Co-op Prices 2Q18
%CHG (YR)
1Q19
$829K
$810K
2%
$829K
0%
$1.380M
-5%
$1.270M
3%
MEDIAN PPSF
$1,000
$1,053
-5%
$1,018
-2%
AVERAGE PPSF
$1,139
$1,317
-14%
$1,182
-4%
AVERAGE PRICE
$1.0
%CHG (QTR)
$1.309M
MEDIAN PRICE
MEDIAN PRICE BY BEDROOM STUDIO
$429K
$452K
-5%
$455K
-6%
1 BEDROOM
$720K
$725K
-1%
$699K
3%
2 BEDROOM
$1.211M
$1.306M
-7%
$1.312M
-8%
3+ BEDROOM
$2.550M
$2.700M
-6%
$2.270M
12%
2Q19
2Q18
%CHG (YR)
1Q19
%CHG (QTR)
MEDIAN PRICE
$1.350M
$1.417M
-5%
$1.350M
0%
AVERAGE PRICE
$2.272M
$2.247M
-3%
$2.078M
5%
MEDIAN PPSF
$1,365
$1,434
-5%
$1,390
-2%
AVERAGE PPSF
$1,691
$1,816
-7%
$1,665
2%
AV ERAG E P P S F
$1,600 $1,400
$0.8
$1,200 $1,000
$0.5
$800 $600
$0.3
$400 $200
$0
2Q15
2Q16
2Q17
2Q18
2Q19
$0
PRICE PER SQUARE FOOT
2Q19
MEDIAN PRICE (MILLIONS)
PRICES
M E D I A N PR I CE
Resale Condo Prices
STUDIO
$632K
$670K
-6%
$646K
-2%
1 BEDROOM
$961K
$1.018M
-6%
$950K
1%
2 BEDROOM
$1.690M
$1.895M
-11%
$1.635M
3%
3+ BEDROOM
$3.400M
$3.525M
-4%
$3.250M
5%
%CHG (QTR)
$2,000
$1.5
$1,500 $1.0
$1,000
$0.5 $0
$500
2Q15
2Q16
2Q17
2Q18
2Q19
$0
PRICE PER SQUARE FOOT
MEDIAN PRICE BY BEDROOM
$2,500
$2.0 MEDIAN PRICE (MILLIONS)
PRICES
New Development Prices 2Q18
%CHG (YR)
1Q19
MEDIAN PRICE
$2.512M
$2.849M
-12%
$2.542M
-1%
AVERAGE PRICE
$3.884M
$4.478M
-13%
$5.093M
-24%
MEDIAN PPSF
$2,151
$2,057
5%
$2,056
5%
AVERAGE PPSF
$2,516
$2,490
1%
$2,970
-15%
MEDIAN PRICE BY BEDROOM STUDIO
$1.347M
$886K
52%
$1.375M
-2%
1 BEDROOM
$1.532M
$1.398M
10%
$1.647M
-7%
2 BEDROOM
$3.245M
$2.650M
22%
$2.785M
17%
3+ BEDROOM
$5.943M
$6.432M
-8%
$6.051M
-2%
$4.0
$3,500 $3,000
$3.0
$2,500 $2,000
$2.0
$1,500 $1,000
$1.0 $0
$500 2Q15
2Q16
2Q17
2Q18
2Q19
$0
PRICE PER SQUARE FOOT
2Q19
MEDIAN PRICE (MILLIONS)
PRICES
2Q 2 019 | M A NH AT TA N | 10
Upper Manhattan
Neighborhoods
SALES
M E D I A N PR I CE
280 $768K +2%
+7%
AV ER AG E PP S F
I N V EN TO R Y
+4%
+31%
$881
591
West Side SALES
576 -6
%
M E D I A N PR I CE
AV ER AG E PP S F
+5
+1
$1.445M $2,036 %
%
I N V EN TO R Y
1,312 +17%
East Side
Midtown SALES
448 -12%
SALES
M E D I A N PR I CE
$902K
AV ER AG E PP S F
$1,485
+1%
-11%
I N V EN TO R Y
1,435
671 -3%
M E D I A N PR I CE
AV ER AG E PP S F
I N V EN TO R Y
-9%
-13%
+15%
$1.089M $1,409
1,936
+12%
Downtown SALES
M E D I A N PR I CE
AV ER AG E PP S F
+21
+4
1,228 $1.697M +30
%
$2,122
%
%
I N V EN TO R Y
2,368
Financial District & Battery Park City
+12%
SALES
112 -17
%
% C H A N G E ( Y E A R - O V E R -Y E A R )
M E D I A N PR I CE
$1.010M -2
%
AV ER AG E PP S F
I N V EN TO R Y
-12
+24%
$1,267 %
532