The KIDS COUNT in Colorado! Data Book is an annual publication of the Colorado Children’s Campaign that provides the best available state- and county-level data about the well-being of children in Colorado.
This research was funded by the Annie E. Casey Foundation, Anschutz Foundation, Buell Foundation, El Pomar Foundation, and Jay and Rose Phillips Family Foundation. The Colorado Children’s Campaign thanks them for their support and acknowledges that the findings and conclusions presented in this report are those of the author(s) alone, and do not necessarily reflect the opinions of these foundations.
The KIDS COUNT in Colorado! 2026 Data Book is produced by the staff of the Colorado Children’s Campaign.
Lead Author:
Maya Gould, Vice President of Research, Colorado Children’s Campaign
Contributors:
Erin Autrey, Designer, Causeworthy
Sarah Hughes, Consultant, Groundswell for Good
The Colorado Children’s Campaign thanks the many individuals and organizations who provided data and expertise to inform this report.
Permission to copy is granted so long as KIDS COUNT in Colorado! Data Book and the Colorado Children’s Campaign are listed as a source.
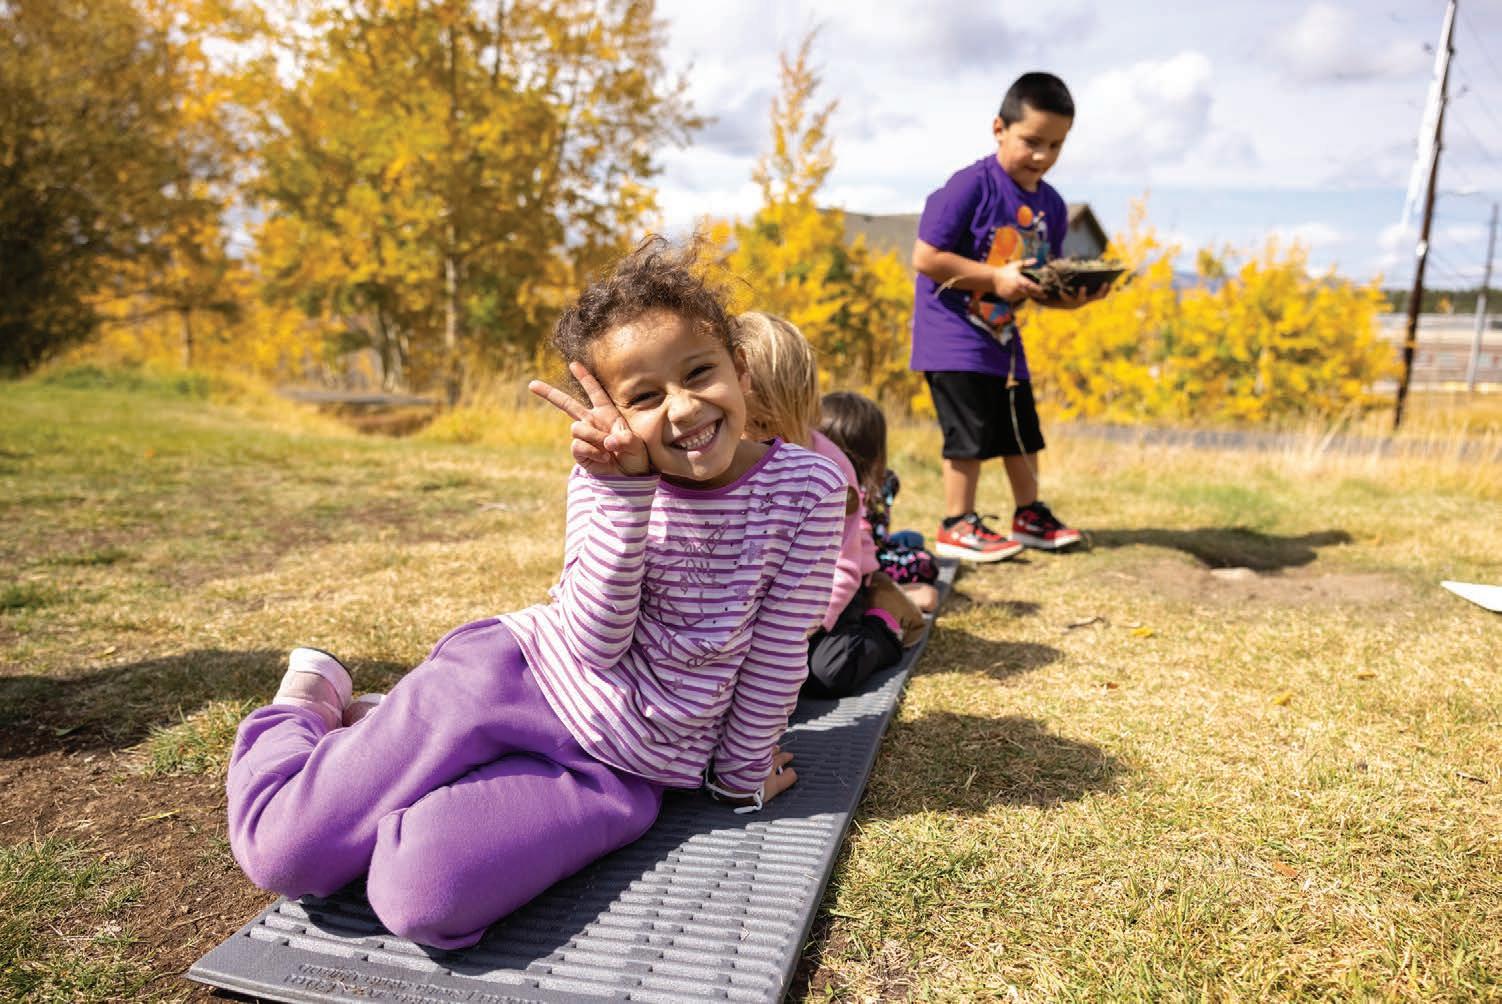
This report features imagery of real Colorado children and families, compliments of Great Outdoors Colorado (GOCO).
Cover Photo by: moxie82inc.
Jared Polis Governor
June 10, 2026
I am pleased to introduce the KIDS COUNT in Colorado! Data Book. In the eight years I have been Governor, Colorado has made remarkable progress for kids and families. This year’s report from the Colorado Children’s Campaign helps us see both how far we have come and the work we still have to do to make sure our children are set up to have the best possible lives today and to flourish in the future. There is a lot to celebrate. Graduation rates have reached an all-time high, with 86% of students graduating on time or early up from 77% a decade ago. And Universal Preschool is now reaching more than 43,000 four-year-olds across the state, saving families money across the state.
But the KIDS COUNT in Colorado! Data Book is also a call to action. Through my National Governors Association Chair’s Initiative, Let’s Get Ready! Educating All Americans for Success, I have been working with Governors, educators, employers, and researchers across the country to redefine what it means for students to be truly “ready” for success. Even with a rising graduation rate, the data in this year’s report make clear that we have more work to do. Too many Colorado students are still not meeting grade-level expectations in math or English, and significant gaps persist by race and income. We need to continue to look for and act on opportunities to support academic foundations, workforce readiness, civic engagement, and lifelong well-being for all of our young people, and I am excited to now be working in partnership with the Colorado Children’s Campaign to create a dashboard that will allow us to more easily measure our success towards meeting these goals.
The data and research in the KIDS COUNT in Colorado! Data Book is critical to achieving what we know is possible for youth and families in Colorado – if we use it to work together to identify challenges and find solutions. I appreciate the Colorado Children’s Campaign’s effort to uplift the needs of kids through this report, at the state Capitol, and beyond.
Sincerely,
Jared Polis Governor State of Colorado
June 10, 2026
Each year, the KIDS COUNT in Colorado! Data Book provides a snapshot of how children across the state are doing. The data remind us of what is at stake and who is relying on us to pay attention.
This is a moment when data matter. In difficult times, clear, reliable information helps us understand where children are thriving and where they are being left behind.
For that reason, this year’s report includes a section on children in the Colorado child welfare system for the first time. Thousands of Colorado children are in foster care or receiving other services aimed at addressing and preventing abuse and neglect. Our goal is to help our readers begin to understand how the child welfare system operates and who it serves.
This year’s report also highlights progress Colorado is making for kids. In the last decade, we have expanded health coverage, launched universal preschool, and introduced tax credits for low-income families, among other efforts to support young people’s well-being. Yet many families still struggle to afford life in Colorado, and federal funding and access to critical programs has been cut or threatened since the release of our last report.
Well over half a million Colorado children rely on Medicaid or the Child Health Plan Plus (CHP+) for health care. More than 350,000 children depend on food assistance through the Supplemental Nutrition Assistance Program (SNAP) to put food on the table. Nearly 28,000 children receive child care assistance through the Colorado Child Care Assistance Program (CCCAP). These programs can make the difference between a child seeing a doctor when they are sick or going without care; between a parent going to work or not; and between a family meeting its basic needs or falling behind. And the children who have counted on these programs will feel the impact of cuts the most.
We hope the information on these pages empowers you to ask questions in your own communities and to make the case for what children need, whether it’s at your local city council, the state Capitol, or in Washington.
The more-than-1.2 million children growing up in Colorado today need us to pay attention – so they can focus on being kids.
In partnership,
Heather Tritten President and CEO
Colorado Children’s Campaign
CEO
Heather Tritten
President and
Colorado Children’s Campaign
Demographics
Who Are Colorado’s Kids?
1,246,000 children live in Colorado. Roughly one in five Coloradans (21%) are kids.
CHILDREN BY AGE, 2024
380,800 491,600 373,700
Source: Colorado Department of Local Affairs
Source: Colorado Department of Local Affairs
1 in 9 children
11% or 136,500 kids Experience poverty, 2024
Source: Population Reference Bureau analysis of U.S. Census Supplementary Survey and American Community Survey
870,800 PK-12 Students Enrolled in Public School, 2025-26
27,000 Immigrant students
120,800
Multilingual learners
Source: Colorado Department of Education
119,500 Special education students
More Than Half of Colorado Kids Live in the Front Range
CHILD POPULATION, 2024
COUNTIES WITH THE LARGEST CHILD POPULATION, 2024 1. El Paso 165,255 2. Arapahoe 150,148 3. Adams 132,622 4. Denver 128,264 5. Jefferson 110,184
Source: Colorado Department of Local Affairs
Colorado is home to 1,246,088 children under the age of 18. More than half (55%) live in just five Front Range counties: El Paso, Arapahoe, Adams, Denver, and Jefferson.1
Colorado’s child population is declining. Between 2019 and 2024, the child population decreased by about 29,000 kids.1 However, in 2024, 64,249 babies were born in Colorado, almost 3,000 more than the year prior. El Paso County had the most births (9,139), followed by Denver County (8,610) and Arapahoe County (7,687).2
1 Colorado Department of Local Affairs, State Demography Office. (2026). County Single Year of Age Lookup, 2024. Retrieved March 2026.
2 Colorado Department of Public Health and Environment. (2025). Administrative data request, 2024.
The Decennial Census
Every 10 years, the United States conducts a count of all people living in the country known as the Decennial Census. The Census reports more than just the number of people. It is the best available tool to understand who lives in Colorado and how the state's population is changing. It also serves as a critical foundation for other data sources that illuminate what kids need.
The Census also plays a large role in determining the amount of federal funding Colorado receives for programs like Medicaid, child care subsidies, and cash assistance. Money is allocated, in part, based on how many people live in the state and their economic situations. However, children, especially young children, are consistently undercounted in Colorado and across the nation. In the 2020 Census, about 3.3% of Colorado children under the age of 5 were not counted. In some counties, nearly 6% of young kids were missed by the Census.3 This undercount resulted in fewer federal dollars being sent to Colorado than the state would have received if all children were counted.
Young children are undercounted for a variety of reasons, including living arrangements that are hard to describe, such as multigenerational homes or blended families; families that are difficult to reach; and confusion among caregivers about whether to count children when responding to questions.4
Planning is already underway for the next Census, which will be conducted in 2030. These data will be used to describe children in Colorado and influence funding for federal programs for the following decade.
(2024).
Census Bureau. (2022). Census Bureau expands focus on improving data for young children.
Photo by: Caveman Collective
Living Arrangements and Resources
One in Nine Children Experience Poverty
Source: Population Reference Bureau analysis of U.S. Census Supplementary Survey and American Community Survey, 2024
Colorado children live in diverse family arrangements. Most children (72%) live with two parents and 20% of children live with a single mother.5 About 31,000 children are cared for, at least partially, by a grandparent.6
Most children (95%) live with at least one working adult,5 yet many still face economic hardship. Close to half of public school students (45%) are considered economically disadvantaged,7 living with families making less than 185% of the federal poverty level, and 11% of children experience poverty.8 See page 16 for more information on household resources and childhood poverty.
5 U.S. Census Bureau, American Community Survey. (2026). Table B23008, 2020-2024
6 U.S. Census Bureau, American Community Survey. (2026). Table B10002, 2024
7 Colorado Department of Education. (2026). Pupil membership statistics, 2025-26 school year. Retrieved March 2026
8 Population Reference Bureau. (2025). Children in poverty in Colorado, 2024.
Demographics in the PK-12 Public School System
Data on public school students provide a more detailed understanding of Colorado kids’ experiences.7
120,846 students are multilingual learners
119,507 students received special education services
76,058 students are identified as gifted and talented
27,012 students are immigrants
See page 71 for more information on the 2025-26 student body
Economic Security
Colorado has a high family median income.1 Yet many families struggle to make ends meet. Economic security – having enough money to reliably cover basic needs like housing, food, health care, and child care – helps children be healthier, happier, and able to focus on just being kids.2
Economic Security at a Glance
$94,500
Average cost of living, family of four
1 in 9 children
Experience poverty (100% FPL)
One in four children are economically disadvantaged. About 24% of Colorado kids live below 185% of the federal poverty level (FPL). This is the eligibility for the National School Lunch Program, the threshold used by the Colorado Department of Education to identify students as economically disadvantaged.
$124,700
Median family income
1 in 4 children
Face economic hardship (185% FPL)
Highlights
Single-parent households are almost four times as likely to experience financial hardship as married households. About 60% of single-parent households with children do not make enough money to afford all of their basic needs, compared with 16% of married households with children.
Note: Data are from 2024 unless otherwise noted.
Medicaid and the Child Health Plan Plus (CHP+) serve more than 600,000 kids, many of whom are also participating in other federal programs. Federal programs help a significant number of children and their families afford food, child care, health care, and other everyday needs. Medicaid and CHP+ are the largest programs, serving 616,257 children.
Sources: United For ALICE; U.S. Census Bureau, American Community Survey; Population Reference Bureau; Colorado Department of Health Care Policy and Financing
Median Family Income
A stable household income helps children have what they need to thrive.2 In Colorado, wide gaps in resources mean that economic stability remains hard to achieve for many families.
$124,700
The Data
The U.S. Census Bureau’s American Community Survey reports the median income among families with children. Median income describes the middlemost income, meaning half of Colorado families make more money and half of Colorado families make less money than the median income.
2024 median income among Colorado households with children
The median income for families with children is $124,682, well above the national median family income of $101,167.3
There are stark differences in income by race. Asian and Pacific Islander families with children have the highest median income: $162,400, or nearly $100,000 more than the median income of Black or African American families ($62,900) and double the median income of Hispanic or Latino families ($81,300).4 Racial disparities in household income are tied to policies and systems that shaped and continue to affect the economic opportunities available to different communities.5
1 U.S. Census Bureau, American Community Survey. (2026). Table B19013, 2024. Retrieved March 2026.
2 Child Trends. (2024). Poverty matters for children’s well-being, but good policy can help.
3 U.S. Census Bureau, American Community Survey. (2026). Table B19125, 2024.
4 Population Reference Bureau. (2026). Analysis of 2024 U.S. Census Bureau, American Community Survey 1-year, Public Use Microdata Sample. Data request, 2024.
5 Center on Budget and Policy Priorities. (2018). Advancing racial equity with state tax policy.
Child Opportunity Index
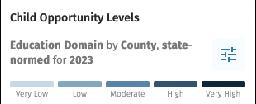
Income is only one measure of household resources. The Child Opportunity Index, a project of the Boston University Institute for Equity in Child Opportunity & Healthy Development, goes beyond just income to describe neighborhoods where children have — and do not have — what they need. It includes measures of access to healthy food, safe housing, good education, and other resources tied to child well-being.
Access to opportunity varies widely across Colorado. Children living in the Front Range and in many rural resort communities have better supports, access to education, and opportunities to thrive. By contrast, kids living on the eastern plains and in southern Colorado are more likely to grow up in neighborhoods with limited access to health care, income, and other resources.6 These differences show that where a child lives in Colorado shapes their ability to learn, build new skills, and reach their potential.
Children Living in the Eastern Plains and Southern Colorado Have Limited Access to Resources
Federal Poverty Level
Growing up in poverty shapes a child’s life into adulthood, affecting health, academic achievement, exposure to adverse experiences, earnings, and opportunities.2 But many Colorado families who earn more than the federal poverty level – equal to $31,200 per year for a family of four in 2024 – still struggle to make ends meet.
The Data
Two U.S. Census Bureau tools track children experiencing poverty: the American Community Survey and the Small Area Income Poverty Estimate (SAIPE). The federal poverty level (FPL) is calculated by tripling the 1963 annual food budget and adjusting for family size and inflation. It is an imperfect measure of economic hardship, which is why researchers and policymakers look beyond the federal poverty level to understand the full scope of families in need.
One in Nine Children Experience Poverty
$31,200
Federal Poverty Level, Family of Four (2024)
About 136,500 Kids in Colorado Experience Poverty
CHILDHOOD POVERTY RATE, 2024
COUNTIES WITH THE HIGHEST RATES OF CHILDHOOD POVERTY, 2024:
Source: U.S. Census Bureau, Small Area Income and Poverty Estimates
CHILDHOOD POVERTY RATE BY RACE AND ETHNICITY, 2024
Note: Data for Black or African American children are not reported because the margin of error is too large.
Source: Population Reference Bureau analysis of U.S. Census Supplementary Survey and American Community Survey
One in nine Colorado children — about 136,500 kids — experience poverty. The rate decreased by about four percentage points over the last decade, but progress has leveled off in recent years. Colorado does have a lower rate than the nation (11% compared to 15%), but the need remains significant across the state.7
Childhood poverty is more common in rural communities. Costilla County (36%) and Saguache County (33%) have the highest rates of childhood poverty. The lowest rates are primarily along the Front Range and in mountain resort regions, including Douglas County (4%) and Pitkin County (5%).8
Racial disparities in child poverty persist. Nearly 20% of Hispanic or Latino children experience poverty, compared to 6% of white children and 6% of Asian and Pacific Islander children.9 These disparities reflect longstanding barriers to economic opportunities among different racial and ethnic groups.5
7 Population Reference Bureau. (2025). Children in poverty in Colorado, 2024.
8 U.S. Census Bureau. (2026). Small Area Income and Poverty Estimates Program, 2024. Retrieved March 2026.
9 Population Reference Bureau. (2025). Children in poverty by race and ethnicity in Colorado, 2024.
Many Children Who Live Above the Poverty Level Still Face Economic Hardship
CHILDREN BY HOUSEHOLD INCOME, 2024
Percentage of children by household income relative to federal poverty level
100 to 199%FPL
50 to 99% FPL
Below 50% FPL
Eligible for Child Health Plan Plus (CHP+) (260% FPL)
Eligible for Supplemental Nutrition Assistance Program (SNAP) (200% FPL)
Eligible for Reduced-Price Lunch (185% FPL)
Eligible for Medicaid (142% FPL)
Eligible for Free Lunch (130% FPL)
Federal Poverty Level (100% FPL)
Extreme Poverty (50% FPL)
Eligible for Basic Cash Assistance (~16% FPL for a family of 3)
Source: U.S. Census Bureau, American Community Survey (1-year estimate)
COLORADO CHILDREN BY INCOME THRESHOLDS, 2024
Children living in households with income
Source: U.S. Census Bureau, American Community Survey (1-year estimate)
Nearly one in four children live in low-income households. The Colorado Department of Education identifies children as economically disadvantaged when they are eligible for the National School Lunch Program (185% FPL). About 24% of Colorado kids meet this threshold. Additionally, many children living below 200% FPL (26%) and 300% FPL (42%) also face economic hardship10 and are eligible for public assistance programs that provide health care, child care, and food.
CHILDREN WITH HOUSEHOLD INCOMES BELOW 185% FPL, 2020-24
Source: U.S. Census Bureau, American Community Survey (5-year estimate)
Extreme childhood poverty persists. More than 76,800 Colorado children experience extreme poverty,10 meaning their families make less than 50% FPL ($15,600 for a family of four in 2024). These children have the most significant difficulty accessing food, health care, and other basic needs.
Tax Policies’ Impact on Childhood Poverty
Three Colorado tax credits help many families move out of poverty:
• Family Affordability Tax Credit (FATC): Provides a credit of up to $3,200 per child under 6 and up to $2,400 for children ages 6 to 16, based on income.
• Colorado Child Tax Credit (CTC): Provides a credit of up to $1,200 per child under 6, based on income.
• Colorado Earned Income Tax Credit (EITC): Provides a credit of up to 50% of the federal EITC, or up to $4,230 in 2025.
An evaluation led by Appalachian State University and Washington University in St. Louis found that these refundable credits significantly improve Colorado kids’ household resources. Researchers estimated that all three credits reduce child poverty by 37%.
The FATC has the biggest impact, reducing childhood poverty by about 20%. Nearly half of Colorado families with children (44%) were eligible for the FATC in 2024.11
Cost of Living
Families achieve economic security when they can reliably afford housing, food, health care, and other basic needs. In Colorado, the cost of meeting those basic needs varies significantly by region, and many families earn too much to qualify for assistance but not enough to get by without stress and sacrifice.
The Data
Households with children experiencing financial hardship, 2024
The Asset Limited, Income Constrained, Employed (ALICE) tool, developed by United For ALICE, calculates a Household Survival Budget – the minimum income necessary to meet basic needs – based on household size and location. Households earning below this threshold are considered to be experiencing financial hardship.
Close to 30% of Colorado Households With Children Experience Financial Hardship
HOUSEHOLDS WITH CHILDREN EXPERIENCING FINANCIAL HARDSHIP, 2024
In Seven Counties, 50% or More of Households With Children Experience Financial Hardship
Source: United For ALICE
Single-Parent Households Are Almost Four Times As Likely to Experience Financial Hardship As Married Households
Source: United For ALICE
On average, a Colorado family of four with one infant and one preschooler needs just over $94,500 per year to meet basic needs, but costs vary widely by location. For example, a family living in Summit County needs $131,748 annually to make ends meet while a family in Baca County needs $65,976.12
Similarly, rates of financial hardship vary across the state. About 27% of Colorado households with children experience financial hardship. The highest rates are in Costilla (74%), Bent (61%), and Alamosa (55%) counties. The lowest rates are in Cheyenne (9%), Dolores (12%), and Grand (12%) counties.12 In each of these counties, families are stretching limited resources and making difficult decisions about which basic needs to prioritize.
COLORADO HOUSEHOLD SURVIVAL BUDGET FOR A FAMILY OF FOUR, 2024
Source: United For ALICE
Single-parent households are almost four times as likely to experience financial hardship as married households. About 60% of single-parent households with children experience financial hardship –44 percentage points higher than the share of married households with children experiencing financial hardship and 33 percentage points higher than the state average.12 This disparity is partly explained by the financial advantages of dual-income households.
12 United For ALICE. (2026). Data request, 2024.
2026 Spotlight: Federal Public Assistance Programs
Many Colorado families who struggle to make ends meet rely on federal public assistance programs to afford visits to the doctor, food, diapers, child care, and other needs. These programs, primarily funded by federal dollars, improve short- and long-term outcomes for kids and help families on their path towards economic security.13
In the most recent year for which data are available (Colorado Fiscal Year 2024-25):
• Medicaid and the Child Health Plan Plus (CHP+) are the largest federal public assistance programs, providing health insurance to 616,257 children.14 The programs covered 42% of births in Colorado in 2024.15
• Supplemental Nutrition Assistance Program (SNAP) is the second largest program, providing cash for food to 354,953 children – nearly 20,000 more children than two years prior.16
• Temporary Assistance for Needy Families (TANF) provides monthly basic cash assistance to 50,538 children.16 These children and their families experience extreme poverty and use cash assistance to afford their basic needs.
• Colorado Child Care Assistance Program (CCCAP) supports 27,598 children under the age of 14 to attend child care or afterschool care to help their parents be able to work. However, due to funding constraints, CCCAP only serves about 11% of eligible children.17 See page 58 for more information on CCCAP funding.
The Colorado state departments that administer these federal programs uphold federal rules, develop state-specific regulations, and contribute state funding to supplement federal dollars. However, the federal government is the primary funder. For example, federal dollars account for 71% of CCCAP funding as of the most recent state fiscal year.18
Many children and families receive support from multiple programs. Most of these programs serve households with similar income levels, meaning families who qualify for one program often qualify for another. However, Colorado does not report enrollment across multiple programs.
13 Urban Institute. (2024). How do children and society benefit from public investments in children?
14 Colorado Department of Health Care Policy and Financing. (2025). Administrative data request, FY 2024-25.
15 Colorado Department of Health Care Policy and Financing. (2025). Report to the community, FY 2024-25.
16 Colorado Department of Human Services. (2026). Administrative data request, FY 2024-25.
17 Colorado Department of Early Childhood. (2025). Annual report on the Colorado Child Care Assistance Program, FY 2024-25.
18 Colorado Department of Health Care Policy and Financing. (2025). Administrative data request, FY 2024-25.
Federal Programs Help a Significant Number of Colorado Children Afford Their Basic Needs
Health Insurance
Medicaid & Child Health Plan Plus (CHP+)
519,081
children enrolled in Medicaid
97,176 children enrolled in CHP+
Purpose: Help children and families with low incomes stay healthy.
Scope: Provide public health insurance to families who do not make enough money to afford private insurance. Medicaid serves children and their families. CHP+ serves only children and pregnant individuals.
Eligibility:
142% FPL (Medicaid)
Equal to $44,304 for a family of four in 2024 260% FPL (CHP+)
Equal to $81,120 for a family of four in 2024
See page 48 for more information on Medicaid & CHP+
Other Basic Needs
Temporary Assistance for Needy Families (TANF)
50,538
children received TANF basic cash assistance
Purpose: Help families living in extreme poverty afford basic needs and pursue economic mobility.
Scope: Provide monthly cash stipends and other supports to working families struggling to afford their children’s basic needs.
Eligibility:
Meet the ‘need standard,’ based on household size Equal to $421/month for a single parent with two kids in 2025
Supplemental Nutrition Assistance Program (SNAP)
354,953 children enrolled in SNAP
Purpose: Help families with low incomes afford food.
Scope: Provide monthly stipends to families for food and nutrition.
Eligibility: 200% FPL
Equal to $62,400 for a family of four in 2024
See page 43 for more information on SNAP
Child Care
Equal to $117,945 for a family of four in 2026 FEDERALLY FUNDED
Colorado Child Care Assistance Program (CCCAP)
27,598
children enrolled in CCCAP
Purpose: Help working families with low incomes afford child care.
Scope: Provide child care subsidies to families who need to work but struggle to afford child care or afterschool care.
Eligibility: 300% FPL and below, varies by county Program exit is 85% State Median Income (SMI)
See page 58 for more information on CCCAP
Sources: Colorado Department of Health Care Policy and Financing; Colorado Department of Early Childhood; Colorado Department of Human Services
Children Experiencing Homelessness
Housing instability disrupts a child’s life, affecting everything from school attendance and academic outcomes to health. In Colorado, the most common reason kids experience homelessness is because their families struggle to afford housing.19
The Data
The Colorado Department of Education reports the number of PK-12 students served by the McKinney-Vento Homeless Education Program. Additionally, the U.S. Department of Housing and Urban Development (HUD) publishes the Point-In-Time Count, which tracks the number of children experiencing sheltered and unsheltered homelessness over time. However, as of the writing of this report, HUD data have not been updated since 2024. For that reason, these data are not included in this year’s report.
Economic Hardship Is the Primary Cause of Homelessness Among Colorado Students
PK-12 STUDENTS SERVED BY MCKINNEY-VENTO HOMELESS EDUCATION PROGRAM, 2020-25 SCHOOL YEARS
73% of PK-12 Students Experiencing Homelessness Live Without a Parent or Guardian 10%
of PK-12 Students Experiencing Homelessness Live in Doubled-Up Arrangements Due to Economic Hardship
Source: Colorado Department of Education, 2024-25 school year
STUDENTS SERVED BY MCKINNEY-VENTO, 2024-25 SCHOOL YEAR
Source: Colorado Department of Education
The McKinney-Vento Homeless Education Program, offered through the Colorado Department of Education, is a federally funded program that serves children experiencing homelessness to support stable school enrollment, education, and housing. The program includes students who are unsheltered as well as students who are living in shelters, hotels, or sharing housing with others in a doubled-up arrangement.
The McKinney-Vento program serves 21,376 Colorado children, roughly 2% of all public school students. Nearly 75% of students participating in the McKinney-Vento program experience homelessness because their families struggle to afford housing.20 Colorado is the tenth least affordable state for renters, making safe, stable housing particularly difficult to find.21 Front Range counties have the highest populations of students experiencing homelessness.20
Students who are Hispanic or Latino are disproportionately affected by homelessness. Nearly 60% of students experiencing homelessness are Hispanic or Latino, and recent increases in student homelessness are driven largely by this group.20 This disparity reflects broader economic challenges. Families who are Hispanic or Latino have a lower family median income than the overall population,4 making them more vulnerable to the housing instability that can lead to homelessness.
20 Colorado Department of Education. (2026). Administrative data request, 2024-25 school year.
21 National Low Income Housing Coalition. (2025). Colorado, 2025.
Child Welfare
For the first time, the KIDS COUNT in Colorado! Data Book includes a section on children involved in the child welfare system. The child welfare system is built to keep kids safe and connect families to the services they need to maintain their child’s well-being and prevent further involvement in the system. Colorado’s child welfare system is county-administered and state-supervised. Most decisions are made and most services are provided at the local level.
Child Welfare at a Glance
118,000
Reported suspicion of child abuse or neglect (referrals)
31,300 Assessments
2,400 Substantiated findings
45%
On-time high school graduation rate
12,200
Children receiving child welfare services
6,300 In-home services
39%
17-year-old foster youth who have experienced homelessness
Highlights
5,900 Out-of-home services (foster care)
54%
17-year-old foster youth who have experienced incarceration
Very few referrals lead to substantiated findings of abuse or neglect. Among the roughly 118,000 reports of suspected abuse or neglect, 26% lead to an investigation and about 2% lead to a substantiated finding.
Very few referrals lead to substantiated findings of abuse or neglect. Among the roughly 118,000 reports of suspected abuse or neglect, 26% lead to an investigation and about 2% lead to a substantiated finding.
Almost half of children in foster care are living with a close family member or friend. About 46% of children in foster care are in kinship care, living with a close relative or family friend to maintain greater stability and connection to their community.
Almost half of children in foster care are living with a close family member or friend. About 46% of children in foster care were in kinship care, living with a close relative or family friend to maintain greater stability and connection to their community.
Foster youth graduate at significantly lower rates than their peers. Less than half of foster youth (45%) graduated on time compared to 86% of all students. Graduation rates among foster youth are improving but remain the lowest in the state.
Foster youth graduate at significantly lower rates than their peers. Less than half of foster youth (45%) graduated high school on time compared to 86% of all students. Graduation rates among foster youth are improving but remain the lowest of any group tracked by the state.
Note: Data are from Colorado Fiscal Year 2024-25 and Federal Fiscal Years 2020-24.
Sources: Colorado Department of Human Services; Colorado Department of Education
Child Welfare in Colorado
Children involved with the child welfare system have often experienced extreme trauma and hardship. The system provides services to keep kids safe and help families create nurturing environments for their children. Financial hardship is one of the strongest predictors of child welfare involvement,1 and in many cases, concerns labeled as neglect are closely tied to poverty rather than a lack of concern by parents.2
The child welfare system provides services intended to:
• Keep children safe and protect them from harm
• Connect families to the support they need to create a positive home for their children
• Establish permanent environments for kids when their home is no longer safe
Child Welfare Prevention
Key Terms in Child Welfare:
• Referral: Report of concern for a child’s safety or well-being from a professional or community member
• Assessment: Evaluation of child safety and family strengths and needs by caseworker
• Substantiated Finding: Confirmed finding of child abuse or neglect
• In-Home Services: Services to support child safety and well-being while the child remains in the home
• Out-of-Home Services (Foster Care): Temporary removal of child from the home due to safety concerns
• Kinship Care: Type of foster care wherein the child resides with a close family or friend
Outside of the child welfare system, Colorado invests in a range of prevention-focused services to reduce the likelihood of child welfare involvement. These include basic cash assistance, access to child care, and home visiting programs that help families build stability and meet their children’s needs. While not all families who receive these services are at risk of involvement in the child welfare system, research suggests these supports are often effective methods to reduce child maltreatment.3
1 Chapin Hall. (2023). Economic and concrete supports: an evidence-based service for child welfare prevention.
2 National Council of Juvenile and Family Court Judges. (2023). Distinguishing poverty experienced by families from child neglect.
3 Center on Budget and Policy Priorities. (2023). Research reinforces: providing cash to families in poverty reduced risk of family involvement in child welfare.
Referrals to Child Welfare
Children often enter the child welfare system through reported suspicions of child abuse and neglect, known as referrals. Many referrals come from mandatory reporters — professionals like teachers, doctors, and therapists who are required to report suspicions of abuse or neglect within 24 hours — but anyone can make a referral through the Colorado Child Abuse and Neglect Hotline. County staff determine when a referral indicates a need for an assessment of child safety.
The Data
The Colorado Department of Human Services provides data on statewide referrals, assessments, and substantiated findings of abuse or neglect.
About 2% of Referrals to Child Welfare Result in a Substantiated Finding of Abuse or Neglect
REFERRALS, ASSESSMENT, AND FINDINGS, COLORADO FISCAL YEAR 2024-25
Referrals
Assessments
Substantiated Findings
118,04231,2582,378
Source: Colorado Department of Human Services
In Colorado Fiscal Year 2024-25, there were just over 118,000 referrals to the child welfare system. A vast majority of these referrals did not result in an investigation or finding. About one in four referrals (26%) led to an assessment to determine whether a child required protection, and about 2% of all referrals led to a substantiated finding of abuse or neglect. 4
4 Colorado Depar tment of Human Services. (2026). Administrative data request, FY 2024-25.
Children Receiving Child Welfare Services
Children and families can receive services without a substantiated finding of abuse or neglect. Counties provide two types of services: In-home services and out-of-home services. In-home services are provided while the child remains at home. Families are referred to resources intended to protect the child’s safety and prevent further involvement in the system. Out-of-home services, commonly known as foster care, are provided when there are immediate concerns about a child’s safety in the home. In these situations, the child is removed, at least temporarily, to ensure their safety and well-being.
The Data
12,208
Children who received child welfare services in FY 2024-25
Source: Colorado Department of Human Services
The Colorado Department of Human Services provides data on children and families who received in-home services and children who were placed in foster care. Referral data include all children referred to the system in Colorado Fiscal Year 2024–25. Service data include all children who received services in Colorado Fiscal Year 2024–25, regardless of when they were referred.
About 40% of Colorado Children Who Received Child Welfare Services Were Younger Than Six
CHILDREN
Source: Colorado Department of Human Services
COLORADO CHILDREN SERVED BY CHILD WELFARE BY RACE AND ETHNICITY
Source: Colorado Department of Human Services
COLORADO CHILDREN WHO RECEIVED SERVICES BY SERVICE TYPE, FY 2024-25
Children in foster care who are living with a close family or friend
Note: Children placed in out-of-home care are not included in the count of in-home services; however, it is possible they received in-home services as well at some point throughout the year.
Note: The rate of kinship care placements is calculated on the last day of the state fiscal year (June 30, 2025).
Source: Colorado Department of Human Services
As of the most recent fiscal year, 12,208 children receive in-home or out-of-home services. About 40% of children are younger than six, 33% of children are school-aged, and 26% are teens. Most children who receive services are white (41%) or Hispanic (36%). Black children are disproportionately represented in the system. About 18% of children who receive services are Black,4 while just 5% of Colorado children are Black.5 This disparity mirrors national trends, and has been linked to higher rates of poverty and practices in investigating and reporting abuse and neglect.6
About 3% of children served by child welfare are American Indian and Alaska Native children.4 These children are subject to special legal standards and protections under the Indian Child Welfare Act, a federal law intended to preserve Native families’ culture and the role of tribal authority.
5 Colorado Department of Local Affairs, State Demography Office. (2026). Administrative data request, 2024.
6 National Conference of State Legislatures. (2021). Disproportionality and race equity in child welfare. Retrieved March 2026.
Foster Care
About 49% of children receiving services in the child welfare system are placed in out-of-home services, commonly known as foster care.4 Foster care is intended to be a temporary place for children to live until it is safe for them to return home. When reunification is not an appropriate outcome, counties look for a more permanent living situation. Once a child turns 18, they can decide to remain in foster care until the age of 21, an arrangement referred to as extended foster care.
In June 2025, almost half (46%) of children in foster care were living with a close family or friend, known as kinship care.4 Kinship care often supports a child’s stability and connection to community.7
GRADUATION RATES AMONG FOSTER YOUTH, 2024-25 SCHOOL YEAR
Source: Colorado Department of Education
Many foster youth have experienced abuse, neglect, and chronic instability, which shapes their health and academic outcomes. Children in foster care typically have worse physical and mental health outcomes than their peers.8 Their academic outcomes also lag. Only 45% of foster youth graduate on time compared with 86% of all students.9 There has been progress in recent years, but foster youth graduation rates still remain the lowest in the state. About 39% of former foster youth still have not received a high school degree or GED by 19 years old.10
7 Child Welfare Information Gateway & U.S. Office of Administration for Children & Families, Children’s Bureau. (2025). Working with kin caregivers.
8 Turney, K. & Wildeman, C. (2016). Mental and physical health of children in foster care. Pediatrics, 138(5).
9 Colorado Depar tment of Education. (2026). Graduation/Completion Statistics: 2024-2025 school year. Retrieved March 2026.
10 U.S. Administration for Children and Families, Children’s Bureau. (2025). Data and statistics: NYTD, FY 2020-24. Retrieved March 2026.
Total PopulationFoster Youth
EXPERIENCES
OF 17-YEAR-OLDS IN FOSTER CARE, FEDERAL FY 2020-24
Experienced incarceration
Experienced homelessness
Enrolled in Medicaid
Sources: Colorado Department of Human Services; U.S. Administration for Children and Families, Children’s Bureau
Many foster youth struggle to find stability. More than half of 17-year-olds (54%) said they have been incarcerated, and nearly 40% said they had experienced homelessness. While many teens maintain some connection to support — about 90% are enrolled in Medicaid — these services have not been enough to prevent significant hardship.10, 11
Good health from the earliest years is foundational to lifelong well-being, educational achievement, and economic stability.1 New Colorado data highlight growing barriers in accessing health care that threaten decades of progress in children’s health.
Health at a Glance
10%
Low-weight births
66%
Fully vaccinated 2-year-olds (2021 birth cohort)
616,300
Children enrolled in Medicaid and Child Health Plan Plus (FY 2024-25)
One in three 2-year-olds in Colorado are not fully vaccinated. The American Academy of Pediatrics recommends seven vaccines for children by the time they are 18 months. About 34% of kids born in 2021 still had not received all recommended vaccinations by 24 months.
Highlights
6%
Children without health insurance
70%
Children with limited access to pediatric primary care
Medicaid and Child Health Plan Plus (CHP+) served 10% fewer children in the last year, and the uninsured rate doubled among low-income children. In Colorado Fiscal Year 2024-25, Medicaid and CHP+ served a combined total of 616,257 children – about 70,000 fewer kids than the year prior. At the same time, the share of children living below 150% FPL without health insurance doubled from between 4% and 5% to 10%.
Note: Data are from 2024 unless otherwise noted.
About 70% of kids cannot easily access pediatric primary care. Seven in ten Colorado kids live in neighborhoods that do not have enough pediatric providers. Access is the worst in rural communities.
Sources: Colorado Department of Public Health and Environment; Children’s Hospital Colorado; Population Reference Bureau; Colorado Department of Health Care Policy and Financing
Prenatal Care
High-quality prenatal care supports the health of pregnant adults and babies.2 In Colorado, many families face challenges accessing timely and adequate prenatal care.
The Data
The Kotelchuck Index, reported by the Colorado Department of Public Health and Environment, describes whether a mother received adequate prenatal care by measuring when prenatal care began and the number of prenatal visits. Care is considered adequate if a parent had 80% or more of expected visits.
One in Three Babies in Colorado Are Born to Mothers Who Receive Late or Insufficient Prenatal Care
BABIES BORN TO MOTHERS BY LEVEL OF PRENATAL CARE, 2024
1 U.S. Department of Health and Human Services, Office of Disease Prevention and Health Promotion. (n.d.). Early childhood development and education Retrieved March 2026.
2 U.S. Department of Health and Human Services: National Institutes of Health. (2017).
BABIES BORN TO MOTHERS WHO DID NOT RECEIVE ADEQUATE PRENATAL CARE BY COUNTY, 2024
Source: Colorado Department of Public Health and Environment
One-third of babies (33%) were born to mothers who do not receive adequate prenatal care, either because their care started late or because they did not have the recommended number of visits. In four rural counties, 50% or more of babies were born to women who did not receive adequate care: Kit Carson (57%), Custer (56%), Baca (53%), and Clear Creek (50%).3
Most women cannot easily access prenatal care. According to one estimate by the Colorado Department of Public Health and Environment, about three in four women live in a community where there are only enough providers to serve less than 20% of the need.4
3 Colorado Department of Public Health and Environment. (2025). Administrative data request, 2024.
4 Colorado Department of Public Health and Environment. (n.d.). State-Designated Health Professional Shortage Areas (sHPSAs), 2024. Retrieved March 2026.
Low Birthweight
The Data
The Colorado Department of Public Health and Environment reports babies born with a low birthweight, defined as weighing less than 2,500 grams or about 5.5 pounds.
Nearly One in 10 Colorado Babies Are Born Weighing Less Than 5.5 Pounds
Source: Colorado Department of Public Health and Environment
Almost 10% of babies are born with a low birthweight.3 This is most often caused by preterm birth or restricted fetal growth in addition to inadequate prenatal care, chronic stress, and certain health conditions during pregnancy.5 In Colorado, high altitude also contributes to low birthweights across the state.7
5 March of Dimes. (n.d.) Low birthweight.
6 The Annie E. Casey Foundation. (2025). 2025 KIDS COUNT Data Book.
7 Bailey, B.A. et al. (2020). High altitude continues to reduce birth weights in Colorado. Maternal and Child Health Journal, 23(11).
Children with a low birthweight are at a higher risk of serious medical complications, chronic health conditions, and dying before their first birthday.5 Low birthweights are more common in Colorado than in many other states.6 38 | KIDS COUNT in Colorado! 2026 Data Book
Infant Mortality
Infant mortality refers to babies who die before their first birthday. Research links infant mortality to a number of issues, including the availability and accessibility of health care, socioeconomic conditions, and public health practices.8 In Colorado, infant mortality rates vary significantly by race and ethnicity.
The Data
The Colorado Department of Public Health and Environment reports the rate of infant mortality per 1,000 live births.
Source: Colorado Department of Public Health and Environment
Infant mortality rates differ significantly by race and ethnicity. The state rate is 4.6 infant deaths for every 1,000 live births. Babies who are Native Hawaiian or Pacific Islander have the highest rate of infant mortality (11.6) – more than double the state rate – while Asian babies have the lowest rate (1.5).3 These disparities, including the high rate among Native Hawaiian or Pacific Islander babies, reflect differences in health care access, use of care, and economic security.9
8 The Annie E. Casey Foundation. (2018). That scary infant mortality rate.
9 U.S. Department of Health and Human Services, Office of Minority Health. (2023). Infant mortality and Native Hawaiian/Pacific Islanders.
Vaccines
Vaccination helps children develop immunity by safely stimulating the body’s immune response, reducing the risk of illness from preventable infectious diseases and limiting disease outbreaks within communities.10 Colorado public schools require vaccinations against diseases such as hepatitis B (HepB), varicella (also known as chickenpox), measles, and rubella. Medical exemptions for vaccinations are allowed in almost every state, but Colorado is one of 16 states that also allows students to forgo vaccine requirements for personal or religious reasons.11
One in Three 2-Year-Olds Are Not Fully Vaccinated
The Data
Children’s Hospital Colorado publishes annual reports on vaccine-preventable diseases. The Colorado Department of Public Health and Environment reports the immunization rate among public school students.
Source: Children’s Hospital Colorado
Colorado ranks 30th in the nation for 2-year-old vaccination rates and 37th in nation for 3-year-old rates. The American Academy of Pediatrics recommends seven vaccines for children by the time they are 18 months old, including vaccinations for measles, mumps, rubella, tetanus, polio, pneumococcus, and other infectious diseases. About one in three (34%) Colorado kids born in 2021 had not received all recommended vaccinations by 2 years old, and most of these children were still not vaccinated by age 3.12
Low vaccination rates mean a higher risk of disease across Colorado. While most families still support routine vaccines for their children,13 some parents are becoming more hesitant to get their children vaccinated because of fears about safety and potential side effects and lack of trust in the health care system. This has resulted in lower rates of childhood immunization and a greater risk of disease outbreaks, which are particularly dangerous for infants, older adults, and immunocompromised people.14
Outbreaks of preventable diseases are increasing in Colorado and across the nation.15 Kindergartner vaccination rates for measles, mumps, and rubella (MMR) are now below the 95% threshold needed to prevent measles outbreaks. In 2025, measles cases were reported across multiple Colorado counties including Mesa, Adams, Arapahoe, Denver, El Paso, and Montezuma.16
10 Centers for Disease Control and Prevention. (2024). Explaining how vaccines work. Retrieved March 2026.
11 National Conference of State Legislatures. (2026). State non-medical exemptions from school immunization requirements. Retrieved March 2026.
13 Centers for Disease Control and Prevention. (2024). Parental attitudes and behaviors toward school and daycare vaccination requirements. Retrieved March 2026.
14 Kaushik, A., et al. (2025). Pediatric vaccine hesitancy in the United States –The growing problem and strategies for management including motivation interviewing. Vaccines (Basel), 13(2):115.
15 Centers for Disease Control and Prevention. (2026). Measles cases and outbreaks. Retrieved March 2026.
COLORADO KINDERGARTNERS WHO RECEIVED REQUIRED VACCINES, 2019-20 AND 2024-25 SCHOOL YEARS
2024-25 2019-20
Source: Colorado Department of Public Health and Environment
Fewer students receive all required immunizations now than in prior years. In the 2024-25 school year, a smaller share of kindergartners were fully immunized than in the 2019-20 school year. Notably, the rate of DTaP vaccination – used to protect against diphtheria, tetanus, and pertussis – fell by six percentage points.17
17 Colorado Department of Public Health and Environment. (2025). State of Colorado immunization data. Retrieved March 2026.
Varicella DTaP Polio MMR HepB
Children need access to healthy food to grow strong, be healthy, and get ready to learn.18 Many kids in Colorado do not have reliable access to nutritious foods.
The Data
The U.S. Census Bureau Current Population Survey Food Security Supplement reports the number of children and families facing food insecurity. The Colorado Department of Public Health and Environment Baby & You Survey Program reports rates of food insecurity among Coloradans who recently gave birth.
Recent Progress in Reducing Food Insecurity Is Reversing
CHILDREN LIVING IN HOUSEHOLDS THAT WERE FOOD INSECURE IN THE LAST YEAR, 2014-24
Parents who recently gave birth facing food insecurity, 2024-25
Source: Colorado Department of Public Health and Environment
Source: Population Reference Bureau Analysis of Current Population Survey
Recent progress in reducing food insecurity is reversing. Nearly one in seven Colorado kids face food insecurity (15%) compared to 13% a few years prior.18 This rise is largely driven by increasing food costs and the end of COVID-19 pandemic-era relief policies, including enhanced Supplemental Nutrition Assistance Program (SNAP) benefits that provided families with additional dollars to afford food.19
Food insecurity is even more common among families with babies. Between 2024 and 2025, 28% of Coloradans who had recently given birth said they faced food insecurity in the last year.20
18 Population Reference Bureau. (2026). Children living in households that were food insecure at some point during the year in Colorado, 2022-24. Retrieved March 2026.
19 Food Bank of the Rockies. (2025). What is food insecurity and how does it impact Colorado and Wyoming. Retrieved March 2026.
20 Colorado Depar tment of Public Health and Environment. (2024). Baby & You 2024 birth cohort survey data. Retrieved March 2026.
Colorado! 2026 Data
Childhood Obesity
Kids who are overweight are at increased risk of chronic health conditions, poor mental health, and a lower self-reported quality of life.21 In 2023-24, Colorado had the lowest rate of children ages 6 to 17 who were overweight or obese in the nation. Still, almost one in four Colorado children are overweight or obese (23%).22
23%
Colorado children who are overweight or obese
Supplemental Nutrition Assistance Program
The Supplemental Nutrition Assistance Program (SNAP) is a federally funded program that helps families afford food by providing monthly cash for groceries and other food expenses. SNAP helps nearly 355,000 kids in Colorado access food. In Colorado Fiscal Year 2024-25, 354,953 children participated in SNAP, about 20,000 more children than two years prior. Denver County serves the most children (54,646 children), followed by El Paso County (50,211 children) and Adams County (46,386 children). Approximately 35% of children using SNAP are younger than 6 years old.23
Healthy School Meals for All
Colorado’s Healthy School Meals for All program provides free meals to public school students attending participating schools. The program serves roughly 447,000 lunches a day.24 See page 75 for more information.
21 Centers for Disease Control and Prevention. (2025). Consequences of obesity.
22 United Health Foundation. (2025). Overweight or obesity – Children in Colorado. Retrieved March 2026.
23 Colorado Department of Human Services. (2026). Administrative data request, FY 2024-25.
24 Colorado Department of Education. (n.d.). School year 2024-25 impact report
Oral Health
Healthy teeth and gums help children eat, speak, and smile with confidence. Most Colorado kids have access to dental services, but data on kids’ oral health are mixed.
The Data
Delta Dental of Colorado Foundation and the Colorado Health Access Survey estimate the number of children who have access to dental services, as reported by their parents. The Colorado Department of Public Health and Environment conducts the Basic Screening Survey, which randomly screens public school students in kindergarten and third grade for dental decay.
Most Colorado Children Have Access to Dental Care
94%89%81%
Children with good, very good, or excellent oral health.
Children who had dental insurance in the last year.
Children who visited a dentist or dental hygienist in the past 12 months.
Source: Delta Dental of Colorado Foundation (2025)
Most Colorado kids can access dental care. About 81% of kids ages 0 to 18 received dental care in the last year. The most common reason kids did not see a dentist was fear of pain from dental procedures. About 94% of parents report that their children have good, very good, or excellent oral health.25
However, data collected by professionals who assess children’s oral health directly show poorer outcomes than parent-reported data. In the 2022-23 school year, 61% of third graders and 46% of kindergartners had tooth decay. Tooth decay can be caused by a variety of factors, including plaque, personal habits, and diet.26
25 Delta Dental of Colorado Foundation. (2025). Colorado Oral Health Data Dashboard. Retrieved March 2026.
26 Colorado Department of Public Health and Environment. (n.d.). Colorado Basic Screening Survey Dashboard. Retrieved March 2026.
Child and Teen Mortality
Nearly all Colorado children live to adulthood, yet child deaths occur each year. Both the teen mortality rate and the rate of deaths by suicide continue to decline.
The childhood mortality rate is declining. In 2024, there were 27.9 deaths per 100,000 children ages 1 to 19, compared to 30.1 deaths in 2023. In particular, the mortality rate among teens ages 15 to 19 decreased substantially in just one year. Still, teens have a significantly higher rate of death than younger children.3
Death by suicide among teenagers is also becoming less common. In 2024, there were 14.0 suicide deaths per 100,000 teens ages 15 to 19, down from 22.1 deaths in 2020.3
The Data
The Colorado Department of Public Health and Environment reports data on child mortality and causes of death. The mortality rate describes the number of children who died per 100,000 children.
Teens Have A Significantly Higher Mortality Rate Than Younger Children
DEATHS PER 100,000 COLORADO CHILDREN AGES 1 TO 19, 2014-24
Source: Colorado Department of Public Health and Environment
Youth Mental Health
Youth mental health is improving. Between 2021 and 2023, the share of high school students who reported sadness and hopelessness dropped by about 14 percentage points, and the share of youth who said they seriously considered suicide decreased by 6 percentage points.27 The teen suicide rate decreased substantially between 2020 and 2024.3 This progress could be driven, in part, by expanded access to mental health services. In 2025, 8% of children had parents who reported their child needed mental health care or counseling services but did not get it, down from 16% in 2023.28
27 Colorado Department of Public Health and Environment. (2023). 2023 Healthy Kids Colorado Survey results. Retrieved March 2026.
28 Colorado Health Institute. (2026). 2025 CHAS: Mental Health. Retrieved March 2026.
Uninsured Children
Children with health insurance are more likely to visit a doctor for primary and preventive care, ultimately improving their long-term health and reducing costs for families, providers, and the health care system.29 In Colorado, recent progress in health insurance coverage for kids is reversing.
The Data
The U.S. Census Bureau’s American Community Survey estimates the share of children who have health insurance.
The Uninsured Rate Among Colorado Children Rose to 6% in 2024
CHILDREN UNDER 19 WITHOUT HEALTH INSURANCE, 2013-24
Source:
CHILDREN UNDER 19 WITHOUT HEALTH INSURANCE, 2024
Source:
In Just One Year, The Uninsured Rate Among Children Experiencing Poverty More Than Doubled
SHARE OF COLORADO CHILDREN UNDER 19 WITHOUT HEALTH INSURANCE BY HOUSEHOLD
INCOME, 2023-24
SHARE OF COLORADO CHILDREN UNDER 19 WITHOUT HEALTH INSURANCE BY RACE AND ETHNICITY, 2023-24
Note: Data for American Indian or Alaska Native children are not reported because the margin of error is too large.
Source: Population Reference Bureau analysis of American Community Survey
The share of children without health insurance is rising, reversing years of progress. In 2024, 6% of children lacked health insurance, up from 4% in 2023.30 Low-income children were most affected. The uninsured rate for children living below 150% FPL doubled to 10%,31 even though these children qualified for public health insurance. The uninsured rate also rose across nearly all racial and ethnic groups, with Black or African American and Hispanic or Latino children experiencing the largest increases.32 This increase is due, in part, to the end of COVID-19 pandemic-era policies that left many eligible children temporarily uninsured.
30 Population Reference Bureau. (2025). Children age 18 and below without health insurance in Colorado, 2024. Retrieved March 2026.
31 Population Reference Bureau. (2025). Children without health insurance by poverty level in Colorado, 2024. Retrieved March 2026.
32 Population Reference Bureau. (2025). Children without health insurance by race and ethnicity in Colorado, 2024. Retrieved March 2026.
Medicaid and Child Health Plan Plus (CHP+)
Families who do not receive health insurance through an employer and do not make enough money to afford private insurance can enroll in public health insurance to help them access health care. Medicaid and CHP+ provide health insurance to a significant number of Colorado kids. In 2024, 42% of births were covered by Medicaid or CHP+.33
Medicaid and CHP+ Enrollment Declined by 10% in Just One Year
COLORADO CHILDREN ENROLLED IN MEDICAID OR CHP+, 2018-25
519,081
Source: Colorado Department of Health Care Policy and Financing
33 Colorado Department of Health Care Policy and Financing. (2025). Report to the community, FY 2024-25.
97,176
Enrollment in both programs declined significantly in the last year. In Colorado Fiscal Year 2024-25, Medicaid and CHP+ served a combined total of 616,257 children – 70,000 fewer kids than the year prior.34 This decline is partially due to the end of federal policies implemented during the public health emergency which helped kids maintain enrollment more easily. When these policies ended, many children temporarily lost coverage not because they were ineligible, but due to administrative barriers such as missed paperwork or renewal issues.35
Cover All Coloradans
In January 2025, Colorado launched Cover All Coloradans, a state-funded program that provides health coverage to immigrant children and pregnant and postpartum adults without legal documentation status. As of February 2026, over 27,000 people were enrolled in the program, including 20,000 children. Almost every county in Colorado has enrollees, with the highest number of people enrolled in Adams, Arapahoe, Boulder, Denver, El Paso, and Weld counties.36 Prior to its launch, many children and pregnant adults enrolled in Cover All Coloradans did not have access to comprehensive perinatal care or well-child visits, and many providers and safety net clinics across the state cared for these children without compensation.
34 Colorado Department of Health Care Policy and Financing. (2025). Administrative data request, FY 2024-25.
35 Kaiser Family Foundation. (2023). Understanding Medicaid procedural disenrollment rates.
36 Colorado Department of Health Care Policy and Financing. (2026). Administrative data request, February 2026.
2026 Spotlight: Access to Pediatric Care
Pediatric care supports children’s short- and long-term health outcomes and prevents serious illness. The American Academy of Pediatrics recommends 11 well-child visits between birth and 2½ years old and annual visits starting at 3 years old.37 These visits ensure children are healthy, meeting developmental milestones, and have the support they need at home.38 However, many children miss appointments because their families struggle to find the time, resources, and transportation to get them there.39
The Data
The Colorado Department of Public Health and Environment identifies health professional shortage areas. These analyses report children who cannot easily access care by comparing the supply of pediatric health care professionals, including doctors, nurse practitioners, and physician assistants, to the number of kids who need well-child visits in the area.
70% of Kids Cannot Easily Get to a Pediatric Health Care Provider
37
38
39
R.
Caregiver and clinician perspectives on missed well-child visits. Annals of Family Medicine, 18(1):30-34.
Hagan, J.F., J.S. Shaw, and P.M. Duncan (eds.). Bright Futures: Guidelines for Health Supervision of Infants, Children, and Adolescents. 4th ed. Elk Grove Village, IL: American Academy of Pediatrics, 2017.
American Academy of Pediatrics. (2019). The well-child visit: why go and what to expect.
Wolf,
(2020).
Source: Colorado Department of Public Health and Environment, 2024
COLORADO CHILDREN IN COMMUNITIES WITH PEDIATRIC PROVIDER SHORTAGE, 2024
Level of Shortage Number and Percent of Children
Significant Shortage:
Enough providers to meet less than 60% of need
Moderate Shortage:
Enough providers to meet 60 to 80% of need
Small Shortage:
Enough providers to meet 80 to 100% of need
Adequate Supply:
Enough providers to 100% or more of need
388,115 (31%)
273,187 (22%)
202,018 (16%)
377,366 (30%)
Source: Colorado Department of Public Health and Environment
There are not enough pediatric providers in Colorado, particularly in rural communities. Roughly 70% of kids live in communities with an inadequate supply of pediatric providers. In rural areas, almost no communities have enough providers, forcing families to travel particularly long distances for well-child visits.4 These barriers often lead families to forgo appointments due to limited time, resources, and transportation.39 About one in 10 children do not go to the doctor because their parents cannot take off work.40
Communities with an adequate supply of pediatric care are most often located near hospitals or large medical centers.4 Still, across the state, about 17% of children cannot easily get an appointment as soon as they need
BARRIERS TO ACCESSING PEDIATRIC CARE, 2025
1 in 6 children could not get an appointment as soon as they needed one
1 in 10 children could not go to the doctor because their parents had to work
Source: Colorado Health Institute
Colorado ranks 15th in the nation for the ratio of general pediatricians to number of children, with 1,130 pediatricians, or one pediatrician for every 1,075 children.41 Although Colorado has more pediatricians than many other states, many of these providers are not located in the communities that need them most.4
40 Colorado Health Institute. (2025). Colorado Health Access Survey. Data request, 2025. 41 American Board of Pediatrics. (2025). General pediatricians U.S. state and county maps. Retrieved March 2026.
Early Childhood
Photo by: moxie82inc.
Children’s earliest years lay the foundation for their lifelong learning, health, and success. Colorado has made significant efforts to help more families access child care, developmental resources, and prepare kids for school.1 Still, many children and families are struggling to get the support they need.
Early Childhood at a Glance
380,800
Children under 6
Colorado does not have enough licensed care to serve all infants and toddlers. There are enough licensed child care seats to serve just 13% of infants and 29% of toddlers. While not all families are looking for licensed centers or homes, most do not even have the option.
164,000
Licensed child care seats for children under 6 (July 2025)
43,400
4-year-olds enrolled in Colorado Universal Preschool program
27,600
Children enrolled in the Colorado Child Care Assistance Program
Highlights
When seats are available, many families cannot afford them. At least half of Colorado families would need to spend 33% or more of their income to send two kids to licensed child care. Families experiencing poverty do not have enough money to cover the cost of care.
$38,500
Annual cost of licensed child care center for an infant and toddler
10,700
Children enrolled in Head Start or Early Head Start
13,600
Children on a waitlist or enrollment freeze for the Colorado Child Care Assistance Program (as of March 1, 2026)
More than 9,000 families are on a waitlist or in an enrollment freeze for child care subsidies. The Colorado Child Care Assistance Program (CCCAP) helps low-income working families afford child care. But due to funding constraints, thousands of families who cannot afford child care are waiting for help.
Note: Data are from Calendar Year 2024 and Colorado Fiscal Year 2024-25 unless otherwise noted.
Sources: Colorado Department of Local Affairs, State Demography Office; Colorado Department of Early Childhood; University of Wisconsin Population Health Institute
Licensed Child Care
Licensed child care providers such as child care centers or family child care homes provide enriching environments for kids while their parents are at work. However, across Colorado, many families cannot find licensed seats, especially for their youngest children.
The Data
The Colorado Department of Early Childhood compares estimates of licensed child care capacity to the number of children living in Colorado each year. While capacity may be overstated for some age groups due to licensing rules and population counts, these estimates provide the best available data on the gap between supply and demand.
Colorado
Only Has Enough Licensed Child Care to Serve 13% of Infants
Most Colorado families cannot find licensed child care for their infant or toddler. Colorado has enough seats to serve just 13% of infants and 29% of toddlers. Apart from San Juan County, no Colorado county has enough capacity to serve all infants.2 While not all families are looking for licensed child care, most do not even have the option.
Expanding Capacity: The Child Care Workforce
One of the biggest limitations to creating more child care seats is providers’ ability to recruit and retain teachers.3 In Colorado, there are roughly 26,600 early childhood professionals, but there is high turnover in the field. About 19% of professionals left the field in Fiscal Year 2023-24.4
Many early childhood professionals want to remain in the field but cannot afford to.3 Child care professionals earn an average of $39,560 a year,5 significantly less than the average wage for all Colorado workers.6 At the same time, providers cannot increase pay without raising child care prices, which would make child care even more unaffordable for families.3
2 Colorado Department of Early Childhood. (2025). Annual licensed capacity maps. Retrieved March 2026.
3 National Association for the Education of Young Children. (2025). An unsustainable status quo.
4 Colorado Depar tment of Early Childhood & University of Denver, Colorado Evaluation & Action Lab. (n.d.). Colorado Early Care and Education Workforce Data Dashboard. Retrieved March 2026.
5 U.S. Department of Labor Statistics. (May 2024). Occupational Employment and Wage Statistics (OEWS) profiles. Retrieved March 2026.
6 Colorado Department of Labor and Employment. (2025). Press Release: Colorado Occupational Employment and Wages – 2024.
Child Care Affordability
Even when seats are available, many families cannot use licensed child care because it is too expensive. Colorado is one of the least affordable states in the country for child care.7
The Data
Child Care Aware of America reports the typical cost of child care by a child’s age and by type of provider. The University of Wisconsin Population Health Institute calculates the share of the median income required to pay for child care for two children, known as the child care cost burden.
AVERAGE ANNUAL COST OF CHILD CARE IN COLORADO, 2024
Most Colorado Families Must Spend At Least One-Third of Their Income On Child Care for Two Kids
PERCENT OF
MEDIAN
INCOME NEEDED TO PAY FOR CHILD CARE FOR TWO CHILDREN, 2024
COUNTIES WITH THE GREATEST CHILD CARE COST BURDEN
Percent of median income needed to pay for child care for two children
Source: University of Wisconsin Population Health Institute
The federal government recommends families spend no more than 7% of their income on child care.8 Yet even in Colorado’s most affordable counties, families spend significantly more.9
Most families must spend at least one-third (33%) of their income on child care for two children. Affordability varies across counties. Child care is least affordable in Washington County, where a family making the median income must spend nearly two-thirds of their income (63%). It is most affordable in Las Animas County, where child care for two children costs 20% of the median income.9
Child Care Costs More Than Families Experiencing Poverty Earn
COST OF CHILD CARE FOR AN INFANT AND A TODDLER VS FAMILY INCOME, 2024
Annual income: $31,000
Cost of child care, infant and toddler: $39,000
Percent of income: 123%
Annual income: $58,000
Cost of child care, infant and toddler: $39,000
Percent of income: 67%
Source: Child Care Aware of America: Analysis by Colorado Children’s Campaign
Child care prices are particularly difficult for low-income families to afford and prevent many from being able to use licensed care at all. Families experiencing poverty do not make enough money to cover the cost of child care for two kids. A family of four living in poverty makes just under $32,000 annually (2024). Licensed, center-based child care for an infant and toddler in Colorado costs roughly $38,500 per year,7 which is $6,500 more than the family’s total annual income. Families who are not experiencing poverty but are still economically disadvantaged also struggle to afford care. A family of four making $57,720 a year (185% FPL in 2024) would need to spend 67% of their income to send two children to child care.7 This leaves very little money left for other basic needs like food and housing.
8 U.S. Depar tment of Health and Human Services. (2024). Improving child care access, affordability, and stability in the Child Care and Development Fund (CCDF).
9 University of Wisconsin Population Health Institute. (2025). Child care cost burden. Retrieved March 2026.
2026 Spotlight: Colorado Child Care Assistance Program (CCCAP)
The Colorado Child Care Assistance Program (CCCAP) helps working families with low incomes afford child care. These families rely on CCCAP to be able to access safe, enriching learning environments for their children while they are at work, seeking work, or in school. The program has historically been underfunded and as of the spring of 2026 is facing an acute funding shortfall. As of March 2026, about 9,000 families and 13,600 children are on a waitlist for care or affected by an enrollment freeze.10 Even if enrollment freezes and waitlists are cleared, the program still will not have enough funds to serve all Colorado families who cannot afford child care.
CCCAP is primarily funded by federal dollars. The program serves eligible children up to age 13. Children who have additional care needs can enroll up to age 18. In Colorado, CCCAP is a county-administered, state-supervised program.
Counties determine income eligibility thresholds. Most set eligibility at 185% FPL ($61,050 for a family of four in 2026), but eligibility ranges by county, up to 300% FPL. A family can remain enrolled in the program as their income increases so long as it remains below 85% of the state median income ($117,945 in 2026).11
Enrollment
CCCAP serves just a portion of families who qualify for support. The program reaches about 27,600 children, or 11% of eligible children.12
The Colorado Child Care Assistance Program Serves Just 11% of Eligible Children
11%
Eligible children served by CCCAP, FY 2024-25
18,352
Families receiving CCCAP
27,598
Children receiving CCCAP
Source: Colorado Department of Early Childhood
10 Colorado Department of Early Childhood. (2026). CCCAP waitlists or freezes. Retrieved March 2026.
11 Colorado Department of Early Childhood. (2026). CountyFPGs-CCCAP. Retrieved March 2026.
12 Colorado Department of Early Childhood. (2025). FY 2024-25 annual report on the Colorado Child Care Assistance Program.
Limited funding has left CCCAP unable to keep pace with the growing need across Colorado. As of March 1, 2026, there are 13,565 children and 9,291 families on a waitlist or in an enrollment freeze.10 While waiting for help, these families – who already struggle to make ends meet – likely face disruptions to work and school. Many have no choice but to rely on child care they consider unsafe or inadequate.13 The problem is growing. Between June 2025 and March 2026, the number of children stuck on a waitlist or in an enrollment freeze more than doubled.10
The Number of Colorado Children on Waitlists or In An Enrollment Freeze More Than Doubled in Less Than a Year
CHILDREN ON A CCCAP WAITLIST OR IN AN ENROLLMENT FREEZE, JUNE 2025-MARCH 2026
CHILDREN ON A CCCAP WAITLIST OR AFFECTED BY AN ENROLLMENT FREEZE AS OF MARCH 1, 2026
Source: Colorado Department of Early Childhood
The Brookings Institution. (2026). What happens when families cannot access child care subsidies.
2026 Spotlight: Colorado Child Care Assistance Program (CCCAP)
Spending
During Colorado Fiscal Year 2024-25, the state spent $170.7 million through CCCAP to support child care for low-income families. The program is funded by the federal Child Care Development Fund (CCDF) (71%), Colorado state funds (19%), and local funds (10%).14
CCCAP Is Getting More Expensive
COLORADO CHILD CARE ASSISTANCE PROGRAM EXPENDITURES IN MILLIONS, FY 2019-25
2019-202020-212021-222022-232023-242024-25
Source: Colorado Joint Budget Committee
COLORADO CHILD CARE ASSISTANCE PROGRAM EXPENDITURES, FY 2024-25
$127 million
Money needed to end CCCAP waitlists and enrollment freezes (as of March 1, 2026)
Source: Colorado Department of Early Childhood
Temporary federal funding allowed CCCAP to expand its budget and serve more children. But funding has expired and counties are struggling to maintain enrollment. CCCAP spending increased by nearly $50 million over the past six years, largely driven by federal funding received by the state during the COVID-19 pandemic.14 This increased funding allowed Colorado to enroll more children in CCCAP.
Source: Colorado Joint Budget Committee
A federal policy known as continuous eligibility requires that once a child is enrolled in the program, they must continue receiving services so long as they remain eligible. When pandemic-era federal funding expired, Colorado had to maintain enrollment for more children with less money. At the same time, the cost of care is rising. Colorado is increasing provider reimbursement rates to better align with federal requirements and the true cost of delivering care, further adding to program expenses. As a result, many counties have implemented enrollment freezes.
Colorado is currently relying on an unused balance of federal funds to maintain CCCAP, but those resources are limited. Meanwhile, the unmet need continues to grow. The Colorado Department of Early Childhood estimates that serving all 13,565 children currently on waitlists or affected by enrollment freezes would require an additional $127.2 million — an increase of nearly 75% in program funding.15
Even if enrollment freezes and waitlists are cleared, the program would still be serving just a fraction of eligible children, leaving many low-income families without financial support for child care. See page 56 for information on child care affordability.
15 Colorado Department of Early Childhood. (2026). Administrative data request, March 2026.
Photo by: moxie82inc.
Informal Child Care Arrangements
Many families do not use licensed child care. Instead, they find informal arrangements like family, friend, or neighbor care (FFN), or piece together care in different ways. In Colorado, most families with babies do not have a routine child care arrangement.
The Data
The Baby & You Survey Program, administered by the Colorado Department of Public Health and Environment, surveys Coloradans who recently gave birth. The program’s Survey 2, which includes representative data on child care arrangements among 12-month-olds, was administered between January 2024 and February 2025 to parents who gave birth in 2023. In future years, data on child care arrangements for older children will also be available.
Most Colorado Parents Do Not Have Routine Child Care for Their 12-Month-Old
According to the most recent data, more than half of parents (60%) do not have a routine child care arrangement for their 12-month-old. These parents are likely staying home with their child or piecing together care in different ways. Parents with routine child care most often report that their 12-month-old is cared for by a relative (16%) or at a licensed child care center (15%).16
Very few low-income families have routine child care. Nearly 80% of families enrolled in Medicaid or Child Health Plan Plus (CHP+) do not have a routine child care arrangement, compared with
Parental Leave
In 2024, Colorado introduced the Family Medical Leave Insurance Program (FAMLI) to support families after the birth of a child or during times of medical need. Through FAMLI, Coloradans can use up to 12 weeks of paid parental leave after a child is born. Parents can also receive additional leave if their baby required time in the Neonatal Intensive Care Unit (NICU). As of March 2026, over 132,000 parents applied for FAMLI support for parental bonding leave. 18 50% of families who were not enrolled in public health coverage.16 Licensed child care is not an option for most of these families because of its high cost.17 See page 56 for more information on child care affordability. Many families cannot afford the child care arrangement they want. About one in four parents (23%) said they would prefer a different type of child care. Most of these parents said they would be interested in a child care center or some type of in-home care for their child, like a nanny or relative. Cost was the primary barrier to accessing their preferred form of care.16
Family Support Services
Families benefit from additional resources, outside of child care, to help raise their children. Colorado offers a variety of family support services to make sure kids are meeting their developmental milestones and have what they need as they grow.
The Data
The Colorado Home Visiting Coalition provides data on children and families served through home visiting models, including Parents as Teachers (PAT), Home Instruction for Parents of Preschool Youngsters (HIPPY), Home-Based Head Start, Family Connects, Baby Bear Hugs, SafeCare Colorado, Healthy Steps, Healthy Families America, Nurse-Family Partnerships, and Child-First. The Colorado Department of Early Childhood provides data on Early Intervention Colorado.
Home Visiting
Supporting families in creating enriching environments at home helps children build skills, stay healthy, and feel secure.19 Home visiting programs offer support to families in their homes, focusing on ensuring resources and programming are culturally relevant and in the family’s home language. Each home visiting model in Colorado uses an evidence-based curriculum that focuses on various aspects of parenting and child development, including health, development, school readiness, parenting skills, and child safety.
While home visiting models have a range of outcomes, most programs have been proven to improve parent-child interaction, school readiness, and health while preventing child abuse and neglect.20
LANGUAGES SPOKEN BY PARENTS SERVED BY HOME VISITING PROGRAM, FY 2024-25
12,771
Children Receiving Home Visiting Services, FY 2024-25
100,946
Visits Provided by Home Visiting Programs, FY 2024-25
Source: Colorado Home Visiting Coalition
19 Garcia, J.L., and Heckman, J.J. (2023). Parenting promotes social mobility within and across generations. Annual Reviews of Economics, (15):349-388.
20 Colorado Home Visiting Coalition. (2026). 2024-25 annual report.
Home visiting models reach over 12,000 children across Colorado. In Fiscal Year 2024-25, 12,771 children received home visiting support – roughly 1,000 more children than the year prior –through 100,946 visits. Over half of families (54%) served were Hispanic or Latino and nearly 70% of parents spoke Spanish.20
Early Intervention
Identifying kids in need of developmental support early, and getting them the right services, gives them a better chance to develop the skills they need to learn, grow, and succeed.21 Early Intervention Colorado screens and provides services to children who are younger than 3 years old with disabilities or developmental delays in areas like speech and walking.
More Children Are Receiving Early Intervention Services
Source: Colorado Department of Early Childhood
More than 20,000 children receive early intervention services. Colorado receives about 19,000 annual referrals to early intervention and evaluates around 11,000 infants and toddlers each year. Children whose evaluations show they would benefit from developmental support are then connected to appropriate services. In Fiscal Year 2024-25, 20,666 children received services as a result of early intervention – about 3,500 more than two years prior. More kids are enrolling in services now than in prior years because of expanded eligibility and increased funding.22
21 Centers for Disease Control and Prevention. (2026). Why act early if you’re concerned about development.
22 Colorado Department of Early Childhood. (2026). Administrative data request, FY 2022-25.
Colorado Universal Preschool Program
The Colorado Universal Preschool Program provides 15 hours a week of free preschool to all 4-year-olds and 30 hours a week to 4-year-olds with qualifying factors related to income, housing, and special learning needs. Certain 3-year-olds can also receive services. The program served over 43,000 4-year-olds in its most recent year.
The Data
The Colorado Department of Early Childhood publishes an annual report on the 4-year-olds served by the Colorado Universal Preschool Program.
Over Half of Children Served by Universal Preschool Are From Low-Income Families
4-YEAR-OLDS ENROLLED IN COLORADO UNIVERSAL PRESCHOOL BY INCOME, FY 2024-25
One in Four Children Were Dual Language Learners
4-YEAR-OLDS ENROLLED IN COLORADO UNIVERSAL PRESCHOOL PROGRAM BY RACE AND ETHNICITY, FY 2024-25
Note:
Colorado is ranked third in the nation for preschool access, in part because of the Colorado Universal Preschool Program.23 The program serves about 68% of 4-year-olds in Colorado, or 43,398 kids in its most recent year.24 Over half of children in the program (55%) are from low-income families, defined as households making less than 270% FPL.
In its second year, Fiscal Year 2024-25, the program provided more full-time care. About 22% of children received 30 hours of free preschool, an increase of nearly 12 percentage points from the prior year. The program also expanded its reach to dual language learners. About one in four participating 4-year-olds were dual language learners, a 50% increase from the year prior.24
Early Head Start and Head Start
Early Head Start, which serves children ages 0 to 2, and Head Start, which serves children ages 3 to 5, provide comprehensive early care and education services for children and their families. Families can enroll if they are earning at or below 100% FPL. Families receiving other public assistance, those experiencing homelessness, and children in foster care may also be eligible.
Early Head Start and Head Start served 10,710 kids in Colorado Fiscal Year 2024-25, roughly 460 fewer children than the year prior. Nearly two-thirds of kids (6,865) are served by Head Start, and one-third of kids (3,845) are served by Early Head Start.25
23 National Institute for Early Education Research. (2024). State of preschool, Colorado.
24 Colorado Department of Early Childhood. (2026). Colorado Universal Preschool Program year 2024-25 annual report.
25 Colorado Department of Early Childhood. (2026). Administrative data request, FY 2023-25.
School Readiness
Strong early childhood development helps young kids get ready for school.26 In Colorado, there are significant disparities in school readiness, meaning many children enter kindergarten without the foundational skills they need to learn.
The Data
Public schools administer kindergarten readiness assessments to all kindergartners in the fall of each year. The Colorado Department of Education collects and reports the Kindergarten School Readiness (KSR) data.
Children Who Are Economically Disadvantaged Are Significantly Less Likely to Be Ready for Kindergarten
COLORADO
STUDENTS WHO MEET SCHOOL READINESS EXPECTATIONS BY INCOME, 2025-26 SCHOOL YEAR
Note: Students are identified as economically disadvantaged when they qualify for the National School Lunch Program (185% FPL). Source: Colorado Department of Education
26 The Brookings Institution, Center on Child and Families. (2012). Starting
There are stark disparities in school readiness by household income. While the majority of students are ready across all domains – ranging from 66% in physical and motor development to 53% in mathematics –children from lower-income households are far less likely to arrive at kindergarten prepared. Economically disadvantaged students are about half as likely to be ready for school as the overall population.27 These gaps reflect national patterns and are closely tied to unequal access to resources and heightened stress in many low-income homes.26
27 Colorado Department of Education. (2026). Colorado’s Achievement Plan for Kids (CAP4K).
A quality education is a powerful factor in shaping a child’s health, financial stability, and ability to reach their potential.1 In Colorado, most students are on a path to graduate, but many lack adequate support to meet grade-level expectations.
K-12 Education at a Glance
870,800 PK-12 public school students (2025-26 school year)
Six in ten third graders do not read or write on grade level. About 58% of third graders do not meet academic expectations in English language arts. Rates remain similarly high through eighth grade.
28%
Students who are chronically absent (2024-25 school year)
86%
On-time graduation rate (2024-25 school year)
Students not meeting academic expectations in English (2025)
55%
Grades 3 through 8
39%
Grade 11
Students not meeting academic expectations in Mathematics (2025)
64%
Grades 3 through 8
Highlights
There are significant disparities in academic achievement by race, ethnicity, and income. Black, Hispanic and Latino students and students from low-income households are significantly less likely to meet academic expectations in English and math. For example, 74% of economically disadvantaged eighth graders do not meet expectations in English language arts compared to 45% of students from higher-income households.
Source: Colorado Department of Education
67%
Grade 11
Nearly 30% of students are chronically absent. Almost 245,000 K-12 students (28%) are chronically absent, defined as missing 10% or more of the school year.
Student Body
Colorado has just under 1,900 schools across 178 school districts that provide free public education to students in prekindergarten through 12th grade. Colorado’s student body is diverse, with students of color making up just over half of the student population.
The Data
870,800
PK-12 Students Are Enrolled in Colorado Public Schools, 2025-26 school year
The Colorado Department of Education, alongside all public schools, conducts an annual Student October Count to determine how many children are enrolled in public school.
PK-12 STUDENT BODY BY STUDENT CHARACTERISTICS, 2025-26 SCHOOL YEAR
Disadvantaged
PK-12 STUDENT BODY BY RACE AND ETHNICITY, 2025-26 SCHOOL YEAR
Source: Colorado Department of Education
As of the most recent school year (2025-26), there are 870,800 PK-12 public school students. Nearly half of students (45%) are identified as economically disadvantaged by their eligibility for the National School Lunch Program (living under 185% FPL). The student body is more racially diverse than in prior years. In the 2025-26 school year, just over half of students were students of color (51%), compared to 46% in the 2015-16 school year.2
1 The Annie E. Casey Foundation. (2010). Early warning! Why reading by the end of third grade matters.
2 Colorado Department of Education. (2026). Pupil membership statistics: 2025-2026 pupil membership. Retrieved March 2026.
Declining Enrollment
Student enrollment fell by more than 10,000 students in one year. Enrollment has been dropping since the COVID-19 pandemic, with the sharpest decline occurring between the 2019–20 and 2020-21 school years.2 In the most recent school year (2025-26), enrollment declined by 10,272 students. This decline is a part of long-term drop in the Colorado child population and is expected to continue in the coming years.3
Colorado Joint Budget Committee. (2026). Supplemental budget requests, FY 2025-26, Department of Education school finance and categorical programs.
Attendance
School attendance is directly linked to academic success. Ninth grade attendance is a better predictor of high school graduation than test scores.4 In Colorado, many students continue to miss a significant amount of school.
The Data
The Colorado Department of Education reports students who are chronically absent, defined as missing 10% or more of school days, including both excused and unexcused absences.
Chronic Absenteeism in Colorado Is Declining, But Remains Higher Than Pre-Pandemic Levels
RATE OF CHRONIC ABSENTEEISM AMONG K-12 STUDENTS, 2019-25 SCHOOL YEARS
Source: Colorado Department of Education
4 Attendance Works. (2024). Keep your child on track in middle and
RATE OF CHRONIC ABSENTEEISM AMONG K-12 STUDENTS, 2024-25 SCHOOL YEAR
Source: Colorado Department of Education
Colorado students miss more school than they did before the pandemic. In the 2024-25 school year, 28% of K-12 students were chronically absent compared to 23% in the 2019-20 school year.5 Although this marks an improvement from prior years, nearly 245,000 students miss a significant amount of school. Rates of chronic absenteeism vary significantly by county, ranging from 42% in Huerfano County to 10% in Kiowa County.6 Low attendance is tied to difficulties related to school climate and mental health, both of which increased during and after the COVID-19 pandemic.7
Healthy School Meals for All
The Healthy School Meals for All program, enacted by Colorado voters in 2022, allows schools participating in the National School Lunch or School Breakfast program to provide free meals to all students, regardless of income. The program aims to reduce the stigma of receiving free meals at school and the administrative burden for staff. As of the most recent reporting (2024-25 school year), Healthy School Meals for All serves over 194,000 breakfasts and 447,000 lunches each day. The program is growing. Between school year 2023-24 and 2024-25 school year, the number of breakfasts served increased by 5% and the number of lunches increased by 3%.8
Disciplinary Actions
Colorado continues to improve its data on discipline and behavioral incidents. In the most recent school year (2024–25), just over 64,500 students received a disciplinary action. Out-of-school suspension is the most commonly reported type of discipline, with most incidents stemming from detrimental behavior, code of conduct violations, and disobedience or defiance.9
5 Colorado Depar tment of Education. (n.d.). Attendance statistics, 2024-25 school year. Retrieved March 2026.
6 Colorado Depar tment of Education. (2026). Administrative data request, 2024-25 school year.
7 MSUToday. (2026). MSU research links mental health, school climate to attendance.
8 Colorado Depar tment of Education. (n.d.). School year 2024-25 impact report.
9 Colorado Depar tment of Education. (n.d.). Discipline statistics, 2024-25 school year. Retrieved March 2026.
Teachers
Teachers play a critical role in students’ learning. They shape classroom culture, adapt instruction to meet diverse student needs, and implement innovative educational strategies.10 In Colorado, recruiting and retaining classroom teachers is an ongoing challenge.
The Data
The Colorado Department of Education reports data on the teaching workforce including teacher salary, turnover, and unfilled positions.
54,767 teachers 2025-26 school year
$74,909
Source: Colorado Department of Education
Colorado has just over 54,700 public school teachers. Teacher turnover rates remain high. Between fall 2024 and fall 2025, the teacher turnover rate was 16%.11 Low wages are one reason for high turnover. In 2024, Colorado ranked 41st in the nation for average starting teacher salary and 20th in the nation for average salary among all teachers.12 However, the number of vacant positions decreased substantially in the last year. In the 2024-25 school year, 255 teaching positions remained unfilled, compared with 635 positions the year prior.13
11 Colorado Department of Education. (2026). School district/staff statistics, 2025-2026 data. Retrieved April 2026.
12 National Education Association. (2024). Educator pay in America.
13 Colorado Department of Education. (2026). Educator Shortage Survey results, 2024-25 school year. Retrieved March 2026.
Academic Performance
Colorado offers three statewide measures of academic performance: the Colorado Measures of Academic Success (CMAS) for students in grades three through eight, the Preliminary Scholastic Assessment Test (PSAT) for students in grades nine and ten, and the Scholastic Assessment Test (SAT) for students in grade 11. Statewide standardized assessments reflect not only what students know, but the adequacy of education systems and supports. Across Colorado, many students are not getting the support they need to meet grade-level expectations.
The Data
The Colorado Department of Education reports the share of students who meet expectations on the CMAS, PSAT, and SAT. See page 82 for data by race, ethnicity, and student characteristics.
Colorado Students Are Not Meeting Academic Standards
STUDENTS GRADES 3 THROUGH 8 NOT MEETING ACADEMIC EXPECTATIONS ON CMAS, 2025 11TH GRADE STUDENTS NOT
Many Colorado students do not meet academic standards. In grades three through eight, about 55% of students do not meet expectations in English language arts on the CMAS, and 64% do not meet expectations in mathematics.14 These trends continue into high school. By 11th grade, roughly 7 in 10 students (67%) do not meet expectations in mathematics on the SAT. There is some improvement in reading and writing, but still nearly 4 in 10 students (39%) are not reading and writing at grade-level.15
Third Grade Literacy
Third graders’ ability to read at grade level is a key predictor of their future success.1 Yet nearly 60% of Colorado third graders are not meeting this milestone.14 Children who do not master reading by the end of third grade are less likely than their peers to meet future academic expectations, graduate from high school, and achieve economic self-sufficiency in adulthood. They also experience more social and behavioral problems.1
Reading at grade level is critical for future learning. Through the end of third grade, students are learning to read. Starting in fourth grade, they are reading to learn. Students who are not proficient by then struggle to understand lessons across subject areas and keep up with their peers. One national estimate shows that up to half of the fourth grade curriculum is incomprehensible for students reading below grade level,1 which contributes to why many Colorado students continue to fall short of academic expectations as they get older.14,15
58%
3rd Graders Not Meeting Grade-Level Reading and Writing Expectations, 2025
Source: Colorado Department of Education
14 Colorado Department of Education. (2025). Spring 2025 CMAS data and results. Retrieved March 2026.
15 Colorado Department of Education. (2025). 2025 SAT/PSAT data and results. Retrieved March 2026.
Graduation Rates
Students who graduate high school have higher earnings, better health, and greater overall stability than students who do not.16 In Colorado, graduation rates continue to rise.
The Data
The Colorado Department of Education reports the rate of students who graduate on time, within four years of starting high school, by student cohort. See page 82 for data by race, ethnicity, and student experience.
Colorado’s On-Time Graduation Rate Continues to Rise
Source: Colorado Department of Education
More Colorado students are graduating on time. In the 2024-25 school year, 86% of students graduated on time compared to 77% of students in 2014.17 Between 2023-24 and 2024-25, graduation rates increased across nearly all student groups, except among Asian students, who saw a 0.6 percentage point decline, and military-connected students, who saw a 0.8 percentage point decline.18 See page 84 for more information on graduation rates by student groups.
While more students are earning diplomas, many are not prepared for higher education, workforce, and adulthood.1 For example, just 23% of students earn a postsecondary credential on time.19 On average, students take four years to complete a two-year associate’s degree and 4½ years to complete a four-year bachelor’s degree.20
17 Colorado Depar tment of Education. (2025). Graduation/completion statistics: 2024-2025 school year. Retrieved March 2026.
18 Colorado Depar tment of Education. (2026). News Release – Colorado graduation rate reaches highest level in more than a decade; dropout rate at all-time low.
19 Colorado Department of Higher Education. (2023). Pathways to prosperity: Postsecondary access and success for Colorado’s high school graduates.
20 Colorado Department of Higher Education. (2025). 2025 higher education return on investment report.
2025 Spotlight: Disparities in Academic Performance
Colorado has significant disparities in academic performance across race, ethnicity, income, and student characteristics. Gaps begin in elementary school and persist through high school graduation. These disparities stem from unequal access to resources students need to succeed — both inside and outside of the classroom.21
Significant Racial Disparities Persist From Elementary School to High School Graduation
STUDENTS NOT MEETING EXPECTATIONS IN ENGLISH BY RACE AND ETHNICITY, 2025
3RD GRADE STUDENTS NOT MEETING EXPECTATIONS ON CMAS, ENGLISH LANGUAGE ARTS
8TH GRADE STUDENTS NOT MEETING EXPECTATIONS ON CMAS, ENGLISH LANGUAGE ARTS
Note: Scores for Hawaiian or Pacific Islander and American Indian or Alaska Native students are not reported because of the small number of students.
11TH GRADE STUDENTS NOT MEETING EXPECTATIONS ON SAT, READING AND WRITING
Source: Colorado Department of Education
21 The Brookings Institution. (2020). Categorical inequalities between Black and white students are common in US schools—but they don’t have to be.
8TH GRADERS NOT MEETING EXPECTATIONS IN ENGLISH LANGUAGE ARTS BY INCOME AND SPECIAL EDUCATION, 2025
ECONOMIC STATUS
STATUS
Note: Students’ status
Source: Colorado Department of Education
Most Colorado students do not meet grade-level academic expectations. However, students who are Black, Hispanic, Native Hawaiian or Pacific Islander, or American Indian/Alaska Native are significantly less likely to meet academic standards. For example, about three in four Hispanic third graders (75%) do not meet expectations in English language arts, compared to 46% of white and Asian students. These disparities persist through high school.14,15
Gaps by income and special education status are also substantial. About 74% of economically disadvantaged students do not meet academic standards in English language arts, compared to 45% of students from higher-income households.14
ON TIME GRADUATION RATES BY STUDENT CHARACTERISTIC, 2024-25 SCHOOL YEAR
Note: Economically disadvantaged is measured by eligibility for the National School Lunch Program (185% FPL). Note: Categories are not mutually exclusive.
ON TIME GRADUATION RATES BY RACE AND ETHNICITY, 2024-25 SCHOOL YEAR
Source: Colorado Department of Education
Disparities persist all the way to graduation. On time graduation rates vary significantly by student characteristics. For example, students in foster care are the least likely to graduate (45%), with graduation rates 40 percentage points lower than the state average. Gifted and talented students (96%) and military connected students (88%) are the most likely to graduate on time. Rates also vary by race and ethnicity. American Indian or Alaska Native students are the least likely to graduate on time (71%) and Asian students have the highest graduation rates (93%).17
Disparities across academic performance and high school graduation reflect unequal access to resources and opportunities that support student learning. Decades of research show that factors like household income and school funding play a major role in shaping student outcomes.21 Gaps in academic achievement have lasting effects as students age. Students who read and write on grade level and graduate on time have higher earnings, better health, and long-term economic stability.16 Yet many Colorado kids who already lack adequate resources at home leave high school without the academic skills they need to thrive and continue to face barriers as they grow into adulthood.1
County Data
Photo by: moxie82inc.
STATE OF COLORADO
ADAMS COUNTY
ALAMOSA COUNTY
ARAPAHOE COUNTY
ECONOMIC
BOULDER COUNTY
CHEYENNE COUNTY
CLEAR CREEK COUNTY
ECONOMIC
CONEJOS COUNTY
CROWLEY COUNTY
CUSTER COUNTY
DENVER COUNTY
DOUGLAS COUNTY
EL PASO COUNTY
ELBERT COUNTY
FREMONT COUNTY
GARFIELD COUNTY
GILPIN COUNTY
HINSDALE COUNTY
JACKSON COUNTY
ECONOMIC
JEFFERSON COUNTY
KIOWA COUNTY
KIT CARSON COUNTY
LA PLATA COUNTY
LARIMER COUNTY
LAS ANIMAS COUNTY
LINCOLN COUNTY
MORGAN COUNTY
OURAY COUNTY
PHILLIPS COUNTY
PITKIN COUNTY
ECONOMIC
SAGUACHE COUNTY
SAN JUAN COUNTY
SAN MIGUEL COUNTY
ECONOMIC
2026 Board of Directors
Dr. Edwin Asturias
Professor of Pediatrics and Epidemiology at University of Colorado School of Medicine Denver, CO
Charlotte Brantley Treasurer Community Leader Golden, CO
Shanna Farmer Vice Chair President/CEO, United Way of Pueblo County Pueblo, CO
Dr. Millie Hamner
Keystone Policy Center Keystone, CO
Vernon Jones Jr.
Executive Lead Learner/Co-Creator, FaithBridge Denver, CO
Sharlene Keithley
Immediate Past Chair Director of Strategic Planning and Revenue, Desoto and Senatobia Children's Clinics Denver, CO
Tyler Lyons
Brand President, Lender/Manager, at Alpine Bank Denver, CO
2026 Staff
Madi Ashour Director of K-12 Education Policy
Sarah Barnes Vice President of Policy
Leah Caputo Director of Advocacy and Community Engagement
Tesha Ferrell Development and Advocacy Coordinator
Maya Gould Vice President of Research
Cristal Ibarra Director of Operations and Belonging
Jena Joiner Policy Analyst
Riley Kitts Chief Policy and Research Officer
Rosemary Rodriguez Chair
Director, Together We Count Denver, CO
Kerry Tipper Secretary General Counsel, University of Colorado Denver, CO
Shawna Mounsey Chief Development Officer
Tess Rittenberg Children’s Policy Fellow
Toni Sarge Director of Health Policy
Mathangi Subramanian Director of Early Childhood Policy
Heather Tritten President and CEO
John Wojcik Director of Digital Marketing and Design
Jackie Zubrzycki Vice President of Communications
About the Data
This report draws on data from multiple state, federal, and nonprofit sources. Data reflect the most recently available information as of the printing of this report and cover different time periods. Data are reported by calendar year, Colorado state fiscal year (July 1 through June 30), Federal fiscal year (October 1 through September 30), and school year (academic year). Due to lags in data reporting, most data in this report are from Calendar Year 2024 or Colorado Fiscal Year 2024-25.
Some figures are rounded for clarity. At times, the sum of parts does not equal 100% due to rounding.
Race and ethnicity categories vary by data source based on how information is collected and reported. Labels used in this report reflect source terminology.