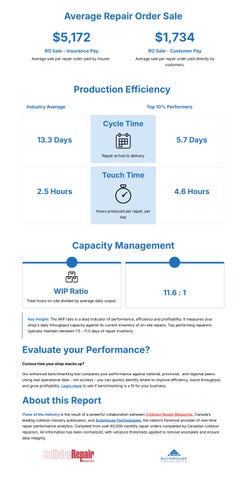
AverageRepairOrderSale
$5,172
ROSale-InsurancePay
Average sale per repair order paid by insurer.
$1,734
ROSale-CustomerPay
Average sale per repair order paid directly by customers.
ProductionEfficiency


CapacityManagement

WIPRatio
Total hours on-site divided by average daily output.
KeyInsight: The WIP ratio is a lead indicator of performance, efficiency and profitability. It measures your shop's daily throughput capacity against its current inventory of on-site repairs. Top performing repairers typically maintain between 7.5 - 11.0 days of repair inventory.
EvaluateyourPerformance?
Curioushowyourshopstacksup?
Our enhanced benchmarking tool compares your performance against national, provincial, and regional peers. Using real operational data - not surveys - you can quickly identify where to improve efficiency, boost throughput, and grow profitability. Learnmore to see if benchmarking is a fit for your business.
AboutthisReport
PulseoftheIndustryis the result of a powerful collaboration between CollisionRepairMagazine, Canada¾s leading collision industry publication, and AutoHouseTechnologies, the nation¾s foremost provider of real-time repair performance analytics. Compiled from over 60,000 monthly repair orders completed by Canadian collision repairers. All information has been normalized, with variance thresholds applied to remove anomalies and ensure data integrity.