FORESIGHT
ANNUAL COLUMBUS OFFICE TENANT REPORT PRESENTED BY COLLIERS | COLUMBUS
TENANT BEHAVIOR AFFECTING THE OFFICE MARKET - p. 6
WHERE ARE BUSINESSES RELOCATING? - p. 14
OFFICE DESIGN TRENDS - p. 20
WHAT CAN WE EXPECT IN 2026? - p. 27

ANNUAL COLUMBUS OFFICE TENANT REPORT PRESENTED BY COLLIERS | COLUMBUS
TENANT BEHAVIOR AFFECTING THE OFFICE MARKET - p. 6
WHERE ARE BUSINESSES RELOCATING? - p. 14
OFFICE DESIGN TRENDS - p. 20
WHAT CAN WE EXPECT IN 2026? - p. 27

Interview: From the Office Market Experts
Look for this icon throughout for insight on 2026 predictions.
12
14 Tenant Migration: Where Are Businesses Relocating?
20 The Evolving Workplace: Insights on Design Trends
22 Interview: Medical Office Outlook
24 Central Ohio Revitalization: Creating New Workspaces
27 What’s to Come What We Can Expect in 2026
The Columbus office market is evolving and showing sustained promise for building owners and tenants alike. From premium Class A space to efficient, renovated Class B options, along with infrastructure revitalization occurring downtown and in suburban office hubs like Dublin, Columbus provides strong fundamentals for new and existing market players. This Colliers | Columbus report explores dynamic tenant demand trends and exciting revitalization projects around Columbus that will impact the office market, while highlighting new opportunities for occupiers and owners. This report delves into workplace trends, tenant behavior analysis utilizing curated data, migration patterns, interviews with brokerage and office design leaders and forecasts for Columbus office space in 2026.

At Colliers | Columbus, we help accelerate our clients’ success, specializing in industrial, office, retail and investment properties. Services provided within these specialties include leasing, disposition, tenant and buyer representation, corporate services, property management, facility services, construction management, development, valuation and consultation. Our full service platform allows our clients to focus on their core business and add value through a strategic approach to real estate.
Reach out to our team with any questions, or for the inside scoop!
Email: columbus@colliers.com


STEPHANIE MORRIS Senior Research Analyst
Stephanie leads research initiatives, delivering data-driven insights and analytical support to the Colliers | Columbus team and their clients. She monitors emerging trends and helps clients translate insights into informed business decisions. By combining market data with her commercial real estate expertise and forward-thinking approach, Stephanie produces reports that enable clients to respond to current market conditions and strategically plan for the future.
JAKE LORD Research Analyst
Jake specializes in research and analytics, supporting the Colliers | Columbus team and their clients. He executes data-driven reports, maintains the commercial property database, analyzes quarterly market trends and leverages statistical modeling to forecast future market activity.

“
Columbus
remains
one of
the
Midwest’s most compelling growth stories. Thoughtful development, revitalized districts and a diverse economic base continue to attract capital and occupiers.
-
Stephanie Morris Senior Research Analyst, Colliers | Columbus
“
“
Well-located, amenity-rich Class A properties continue to command a meaningful rent premium and outperform the broader market, underscoring sustained demand for quality. At the same time, today’s flightto-quality is less prestige-driven, allowing thoughtfully renovated Class B properties to compete when they offer compelling value.
- A.J. Norman First Vice President, Colliers | Columbus
“
T
In the post-pandemic office environment, flight-to-quality has dominated national headlines with large occupiers driving highly visible investments in Class A+ office space. While these transactions are impactful, they represent a narrow slice of overall leasing activity.
In Columbus, demand for Class B office space continues to form the backbone of the market. While Class A+ commitments capture attention, the majority of lease velocity occurs in Class B assets, driven by smaller tenants prioritizing affordability, right-sized footprints, and functional locations.
Over the past eight years, Class B buildings have recorded more leases in seven of the last eight years, with 2023 standing as the lone exception. The data reinforces that Class B office is sustaining market activity beneath the surface of headline transactions.
While Class A transactions dominate media attention, Class B assets account for the majority of leasing activity. Over the past eight years, Class B buildings captured approximately 55% of all executed leases, reinforcing their role as the primary driver of market liquidity in Columbus.
The lone deviation occurred in 2023, when a limited number of large Class A commitments temporarily shifted aggregate leasing volume. This shift proved short-lived, as Class B lease velocity rebounded the following year.
Lease activity in Columbus is driven less by trophy transactions and more by steady Class B absorption, underscoring the importance of pricing discipline and operational efficiency for owners of mid-tier assets.
Average Lease Size by Property Type
Includes: new leases over 1,000 square feet
Class B leasing activity is structurally concentrated among smaller occupiers. Over the past eight years, more than 70% of Class B leases were under 5,000 square feet, compared with 56% in Class A buildings, reinforcing the role of mid-tier assets as the primary destination for small and growth-oriented firms. These tenants are often local professional services or entrepreneurial businesses prioritizing cost control, flexibility, and operational efficiency over high-amenity environments.
The average Class B lease size has remained relatively stable both before and after the pandemic, indicating that demand for smaller footprints in mid-tier buildings is not cyclical but foundational. These tenants are not trading down on quality; they are intentionally right-sizing, seeking efficient layouts and manageable occupancy costs rather than excess space. As tenant discipline persists, Class B buildings offering flexible suites and competitive pricing are likely to remain the market’s most consistent source of leasing velocity.
Class B will remain the primary engine of leasing activity in 2026, as smaller occupiers continue to prioritize affordability, flexibility and efficient footprints. While high-profile Class A commitments may capture attention, sustained market liquidity will depend on mid-tier assets capable of accommodating sub-5,000 square foot demand. Owners of undifferentiated Class B product may face growing pressure, but well-positioned buildings offering competitive pricing and adaptable layouts will outperform. 2026 prediction
Rather than abandoning high-quality office space, tenants are redefining what “quality” means. Today’s flight-toquality is less about maximizing square footage or securing a trophy address and more about aligning space with actual workplace needs. Tenants continue to commit to Class A environments, but with smaller footprints, greater emphasis on experience and heightened expectations around efficiency and execution.
The initial post-COVID return-to-office period in 2022 and 2023 was marked by heightened attention on flight-toquality, as occupiers re-evaluated workplace strategies and committed to higher-quality environments. During this period, Class A buildings captured a meaningful share of large lease transactions, including several commitments exceeding 25,000 square feet.
By 2024 and 2025, this surge in large-scale Class A leasing moderated. While Class A continued to attract tenant demand, the number of leases over 25,000 square feet declined sharply, falling from 10–11 annual transactions in 2022–2023 to just three to five per year in 2024–2025. This pullback was concentrated at the upper end of the size spectrum, with 50,000-plus square foot deals becoming increasingly scarce.
The shift does not signal a retreat from quality. Rather, it reflects a transition from expansion-oriented decisionmaking toward a more disciplined approach, as tenants move beyond re-entry and stabilization phases and align real estate commitments with right-sized occupancy needs.
Includes: new leases over 1,000 square feet
While large Class A transactions moderated, the composition of leasing activity shifted toward smaller footprints. Leases exceeding 25,000 square feet declined sharply between 2022–2023 and 2024–2025, falling by more than 60%, while mid-sized transactions between 10,000 and 25,000 square feet remained stable. The moderation was concentrated at the top end of the size spectrum rather than across all leasing activity.
At the same time, smaller Class A transactions demonstrated resilience. Leases under 5,000 square feet accounted for approximately 57% of all Class A deals in both periods, maintaining their share even as overall volume moderated. Notably, the smallest tenants increased their presence within the mix, with sub-2,500 square foot leases rising from 28% to 33% of total Class A activity.
These patterns suggest that tenants are not abandoning Class A office space but are instead redefining how they access it. High-quality buildings continue to attract demand when paired with efficient layouts, shared amenities and locations that support hybrid work patterns. The modern flight-to-quality favors precision over scale as occupiers seek environments that enhance employee experience without committing to oversized footprints.
2026 prediction
The next phase of flight-to-quality will reward precision over prominence. Large Class A lease commitments are likely to remain episodic in 2026, as tenants increasingly align space decisions with stabilized hybrid work patterns and measured growth strategies. Demand for high-quality office will persist, but primarily through smaller, rightsized transactions that emphasize experience, flexibility and speed to occupancy. Class A owners reliant on large, single-tenant commitments may encounter longer lease-up timelines, while assets designed to accommodate multiple smaller users will hold a competitive advantage in an increasingly disciplined market.
Our Office Services Group at Colliers | Columbus specializes in the leasing and sale of office space across Central Ohio. Owners, investors and tenants trust our office brokerage team for their in-depth market knowledge and reliable advice to develop tailored solutions for their real estate needs. With a dedicated focus on the office market, they possess extensive expertise in tenant behavior and current industry trends.
As tenant demand shifts toward smaller, well-designed office spaces, where should owners prioritize investment to make their buildings more competitive?
Building owners are investing in common area features that allow tenants to take advantage of what the building offers instead of building those amenities within their own space. Examples include classrooms or conference rooms that accommodate 20 or more people in the common areas, as well as soft seating and informal meeting or gathering areas that make the building more attractive to tenants.
- Chris Potts, Senior Vice President
Are you seeing a moderation in the “flight-to-quality” trend among office tenants? Why or why not?
I don’t see a pullback from the flight-to-quality, but tenants have become more disciplined and selective. Well-located, amenity-rich Class A properties continue to command a meaningful rent premium and outperform the broader market, underscoring sustained demand for quality. At the same time, today’s flight-to-quality is less prestige-driven, allowing thoughtfully renovated Class B properties to compete when they offer compelling value.
- A.J. Norman, First Vice President
What viable paths do you see for large, single-tenant suburban offices with limited operating income to fund tenant improvements or speculative suites?
There are options for owners to fund TI and spec suites, but none are particularly attractive, especially if the owner is short on cash. They are unlikely to move forward with these projects without available capital. One option is to initiate a cash call with their investors to raise funds, which is usually not well received. Another option is to approach their bank or another lender for a construction loan, which may not be approved or, if approved, could come with high interest rates and potentially require the owner to post another asset as collateral. The most common way owners structure deals when TI is needed and cash is limited is by offering free rent in lieu of a tenant improvement allowance. For example, if the cost of the work is equivalent to six months of free rent, the landlord may ask the tenant to pay for the buildout upfront in exchange for that free rent. However, this is not a perfect solution, as tenants typically do not have or prefer not to spend that level of cash on an office buildout.
- Marty Ellinger, Senior Associate
How are you partnering with property management teams to deliver more customized outcomes for your clients and landlords?
Ensuring clear communication with brokers and property managers is essential to delivering building services efficiently. At the same time, anticipating the needs of a modern property helps keep it in excellent condition while remaining cost-effective.
- Chris Potts, Senior Vice President
“Landlords that can offer well designed, flexible layouts and immediate occupancy are gaining a competitive advantage, particularly with tenants seeking optionality and speed in an evolving office landscape.
- Grant Horton Brokerage Associate, Colliers | Columbus
In 2025, we saw increased activity in owner-user sales. When do you expect to see investors reengage in Columbus?
Investors have already started re-engaging here. There were notable transactions in 2025 that will guide future investors in price discovery. Investors are starting to see office product as attractive due to higher cap rates compared to historical comps, as well as a positive outlook on the return to the office. They are finding value in price and see increased demand ahead in our world. Class A properties in prime locations with amenities will be the first to go. We will then see a run to buy value-add properties in Class B markets.
- Marty Ellinger, Senior Associate
How are landlords differentiating their buildings to attract and retain tenants in today’s market?
Landlords are investing in amenities that support how employees engage in the building. This includes upgraded tenant lounges, common conference centers, fitness facilities, outdoor space and food and beverage concepts. Many owners are prioritizing comfort, design and functionality to make the office a destination rather than an obligation. There is a growing emphasis on hospitality-inspired environments that encourage collaboration, productivity and longer daily utilization of the space. In order to set their building apart from others in the market, spec suites and delivering turnkey buildouts are becoming significant drivers of facilitating deals, especially on a tight timeline. These solutions allow tenants to reduce upfront capital investment, shorten decision cycles and move into high quality space with minimal disruption. Landlords that can offer well designed, flexible layouts and immediate occupancy are gaining a competitive advantage, particularly with tenants seeking optionality and speed in an evolving office landscape.
- Grant Horton, Brokerage Associate
“In what ways have tenants approached lease renewals differently over the past year compared to prior cycles?
We’re reaching out to tenants much earlier. Tenants now know with more certainty what their footprint looks like. There are some that are sitting on excess space right now waiting for their expiration date. If we can learn of this early, we can potentially solve their excess space issue sooner and possibly create a winwin situation for them and the landlord. Separately, there are many tenants now back to the office full time and growing. By reaching out sooner, we know of their longer term plans and can help accommodate them possibly sooner than their expiration date. In previous cycles, there has been so much uncertainty, it was difficult for tenants to make decisions until closer to expirations.
- Andrew Jameson, Vice Chair
Tenant migration patterns across the Columbus office market continued to evolve in 2025 as occupiers finalized return-to-office strategies and reassessed long-term space needs. Leasing activity accelerated year-over-year, signaling growing tenant conviction despite ongoing uncertainty around workplace utilization. We employ a point system based on signed square footage to track office user migration across Columbus. Additionally, our analysis of transaction data uncovers key statistics, emerging trends and potential shifts in tenant behavior. This report provides a deeper dive into office tenant migration patterns within the Columbus market.
Leases Signed - 49
Signed SF - 327,094 SF
Average TI - $24.52
Average Term - 52 months
Leases Signed - 59
Signed SF - 356,656 SF
Average TI - $22.81
Average Term - 52 months
Leases Signed - 96
Signed SF - 668,709 SF
Average TI - $26.03
Average Term - 48 months
Leases Signed - 71
Signed SF - 434,491 SF
Average TI - $19.87
Average Term - 52 months
Leases Signed - 91
Signed SF - 645,569 SF
Average TI - $35.01
Average Term - 49 months
Leases Signed - 81
Signed SF - 427,854 SF
Average TI - $15.16
Average Term - 46 months
Leases Signed - 90
Signed SF - 751,624 SF
Average TI - $21.23
Average Term - 54 months Q4
Leases Signed - 53
Signed SF - 304,626 SF
Average TI - $20.87
Average Term - 47 months
Leasing activity accelerated in 2025, with 315 office leases signed, driving a 14% year-over-year increase in total transaction volume compared to 2024. The rise in deal count and signed square footage signals increased tenant confidence as occupiers finalized return-to-office strategies and space requirements. Average tenant improvement allowances increased to $24.25 per square foot, reflecting continued demand for amenitized office environments. Meanwhile, the average lease term declined slightly to 49.1 months, reinforcing tenants’ preference for flexibility.
Leases Signed - 275
Signed SF - 1,786,950 SF
Average TI - $23.44
Average Term - 51 months
Leases Signed - 315
Signed SF - 2,129,673 SF
Average TI - $24.25
Average Term - 49 months
Average lease terms declined modestly in 2025, continuing a multi-year trend toward shorter commitments as tenants prioritize flexibility. While lease lengths remain just under five years, longer-term commitments were concentrated among Healthcare and Real Estate/Construction tenants, particularly in Dublin, the CBD and Arlington/Grandview.
The number of deals and total square footage leased increased in 2025, with transaction volume up 14%. Average TI allowances increased slightly to $24.25, while the average lease term decreased slightly to 49.1 months.
Highest Average TI Allowance by
Average TI Allowance by Submarket:
Tenant improvement allowances increased again in 2025, remaining elevated as occupiers placed greater emphasis on space quality and functionality. Healthcare, Engineering/Manufacturing and Real Estate/Construction tenants commanded the highest TI allowances, reflecting specialized build-outs and higher capital requirements.
* The TI (tenant improvement) allowance is the amount that the landlord will spend for the tenant to build out their space.


Total leased square footage rose year-over-year in 2025, supported by steady tenant participation and increased deal velocity. Dublin and the CBD captured the largest share of leasing activity, reinforcing their position as primary destinations for office users seeking accessibility and amenity depth.

Represents the number of tenants that were new to the submarket
Dublin | 123 points
29 tenants (143,713 SF)
47 tenants (441,489 SF)
2 tenants (2,281 SF)
Worthington | 37 points
16 tenants (57,000 SF)
22 tenants (84,284 SF)
9 tenants (35,666 SF)
Gahanna/Airport | 16 points
5 tenants (21,623 SF)
9 tenants (23,737 SF)
1 tenant (2,548 SF)
Powell | 9 points
8 tenants (22,755 SF)
1 tenant (1,250 SF)
2 tenants (6,439 SF)
Delaware | -1 point
0 tenants (0 SF)
0 tenants (0 SF)
1 tenant (1,036 SF)
Represents the number of tenants that moved within the submarket
CBD | 97 points
17 tenants (107,217 SF)
tenants (308,952 SF) 4 tenants (34,510 SF)
Arlington/Grandview| 35 points 14 tenants (69,496 SF)
tenants (92,334 SF)
tenants (36,140 SF)
Easton | 15 points
9 tenants (59,480 SF) 3 tenants (14,146 SF) 3 tenants (19,046 SF)
North Central | 6 points 2 tenants (16,676 SF) 3 tenants (19,294 SF) 5 tenants (13,330 SF)
East | -1 point 3 tenants (12,593 SF)
(9,028 SF)
(100,824 SF)
Southeast | -8 points
0 tenants (0 SF) 0 tenants (0 SF) 4 tenants (25,703 SF)
Represents the number of tenants that left the submarket
Westerville | 37 points
13 tenants (131,063 SF)
23 tenants (127,511 SF)
6 tenants (118,693 SF)
Polaris | 27 points
3 tenants (63,891 SF) 13 tenants (73,014 SF) 0 tenants (0 SF)
New Albany | 10 points 1 tenant (175,000 SF) 4 tenants (15,493 SF) 0 tenants (0 SF)
Hilliard | 2 points
0 tenants (0 SF)
2 tenants (18,565 SF) 2 tenants (8,640 SF)
Southwest | -2 points
tenant (1,900 SF)
tenants (0 SF)
tenants (6,850 SF)


50,000 SF and up ..............................
20,000 SF to 49,999 SF......................
10,000 SF to 19,999 SF.......................
5,000 SF to 9,999 SF..........................
0 SF to 4,999 SF.................................
0 SF to -4,999 SF................................
-5,000 SF to -9,999 SF....................... -10,000 SF to -19,999 SF....................
SF to -49,999 SF...................
SF and
Red represents movement to the submarket, while blue represents movement from the submarket.


Arrows represent trending tenant movement
Represents the hottest submarket of 2025

1/3
of tenants leasing new space entered the market through Dublin and Worthington, highlighting these submarkets as key on-ramps for first-time Central Ohio occupiers.
Dublin and CBD recorded the highest share of tenants remaining within the same submarket, reflecting tenant satisfaction, location stickiness and renewal strength.
of all new leasing activity was captured by Dublin and the CBD, reinforcing their status as the region’s primary demand drivers.


55%
of leases with terms greater than five years were signed in Dublin, the CBD and Arlington/Grandview, concentrating long-term tenant commitments in established submarkets.
Dublin remained the most sought-after submarket for Financial Services and Business Services tenants, driven by accessibility, parking, and amenity depth.
Healthcare tenants most frequently selected Dublin and Westerville, favoring submarkets that balance suburban access with growing medical and institutional infrastructure.
Nearly 40% of all leases signed in 2025 were by Healthcare, Financial Services and Business Services tenants, underscoring the continued dominance of service-oriented occupiers in the Columbus office market.
Healthcare, Financial Services and Engineering/Manufacturing accounted for 40% of leases with terms exceeding five years, signaling stronger long-term commitment from tenants with stable operational needs.

Healthcare tenants recorded the highest average TI allowances at $25.57 per square foot, driven by specialized buildouts and long-term operational requirements.

Tenant improvement allowances continued to climb in 2025 as landlords responded to heightened expectations around office quality and functionality. Healthcare, Engineering/ Manufacturing and Real Estate/Construction tenants consistently required higher buildout investment, reinforcing a market dynamic where capital is concentrated in fewer, higher-conviction deals. Elevated TI levels are expected to persist into 2026 as competition for durable tenants remains strong.
Leased square footage increased year-over-year in 2025, supported by steady tenant participation and sustained deal velocity.
Activity remained concentrated in Dublin and the CBD, which continued to capture the largest share of market demand.
With tenant counts holding relatively stable, overall leasing volume is expected to remain consistent heading into 2026.
Average lease terms declined slightly in 2025, reflecting occupiers’ preference for flexibility as workplace strategies continue to evolve. Despite shorter overall commitments, longer lease terms are clustered within established submarkets and among industries with stable operational needs, including Healthcare and Real Estate/Construction.
Healthcare, Financial Services and Engineering/Manufacturing tenants drove a large share of leasing activity in 2025, shaping both migration patterns and capital deployment.
These industries demonstrated a willingness to commit to higher TI allowances and, in many cases, longer lease terms, signaling confidence in longterm space needs. Together, they are positioned to remain the primary sources of office demand entering 2026.


Tenant demand in 2026 is expected to be most active among users seeking spaces under 5,000 square feet, reinforcing a market driven by deal volume rather than large single-tenant absorption. This segment continues to reflect cautious expansion, hybrid work strategies, and the formation of new local offices.
• Leases under 5,000 square feet represented 63% of all deals signed in 2025, underscoring the dominance of small-tenant activity.
• As of Q1 2026, 46 tenants are exploring space between 2,000 and 5,000 square feet, representing the largest concentration of in-market demand.
Dublin is expected to capture the largest share of suburban leasing activity in 2026. However, the CBD will remain highly competitive as tenants seek amenity-rich, centrally located space.
• The majority of tenants seeking spaces between 10,000 and 25,000 square feet are targeting Dublin and the CBD, signaling sustained demand in both submarkets for core office product.
• Healthcare and Financial Services tenants are projected to drive a significant share of leasing activity in 2026, with both industries favoring Dublin and the CBD at higher rates than other tenant groups.
In 2026, building owners remain focused on elevating the workplace experience, investing in modern amenities and thoughtfully designed office environments to attract and secure tenants. At the same time, companies are leveraging tenant improvement allowances to create high-quality, purpose-driven spaces that help recruit and retain top talent as employees continue returning to the office.

To explore how these priorities are shaping workplace design, Colliers Columbus connected with Columbus-based architecture and interior design firm Darin Ranker Architects. Darin Ranker, Architect and Owner and Beth Rihl, Owner and Senior Project Manager/Interior Designer, shared their perspective on today’s evolving office trends and how their team helps deliver efficient, amenity-rich environments for both building owners and tenants.

Darin Ranker Architects is known for tenantfocused workplace design and repositioning existing buildings. How would you describe your firm’s core workplace philosophy today, and how has that evolved since pre-COVID?
Our philosophy has always been to listen very carefully to our clients’ needs first and foremost. It has not changed. The client and building owner needs are what have evolved since COVID.
How does your approach differ when you’re designing directly for an occupier versus advising a landlord on speculative or repositioned office space? Where do you see the biggest gaps between landlord assumptions and tenant expectations today?
Our approach to design doesn’t change a great deal between owners and tenants. Both want the best design while considering construction costs.
The largest gap is educating prospective tenants on the cost implications associated with current tenant buildouts. Construction costs have skyrocketed, primarily after COVID. Prospective tenants are not aware of these rising costs, while landlords are. Building owners are constantly reminding us to utilize existing conditions to the greatest extent possible, to work around or to utilize existing plumbing locations to minimize construction costs, particularly in short term lease deals. Tenants are typically very surprised after receiving the costs from an initial conceptual design based solely on creativity alone, thus requiring multiple plan revisions to get the project cost within their initial budget. To bridge the gap between owners and tenants, we try to incorporate all the expensive components as alternates so that the General Contractor can break out those costs separately, allowing the tenant to weigh options as to what is most important to them.
What are one or two workplace design trends your firm has implemented in the past 12 months that are directly tied to how employees use the office today? Can you share a brief example or outcome from a recent project?
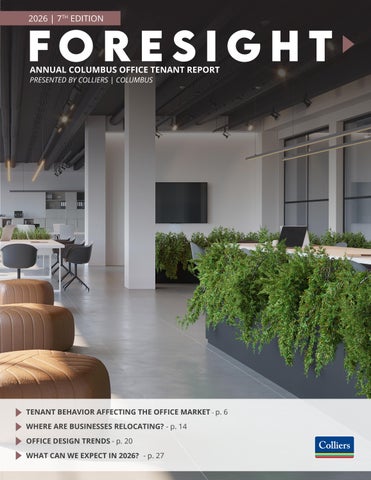
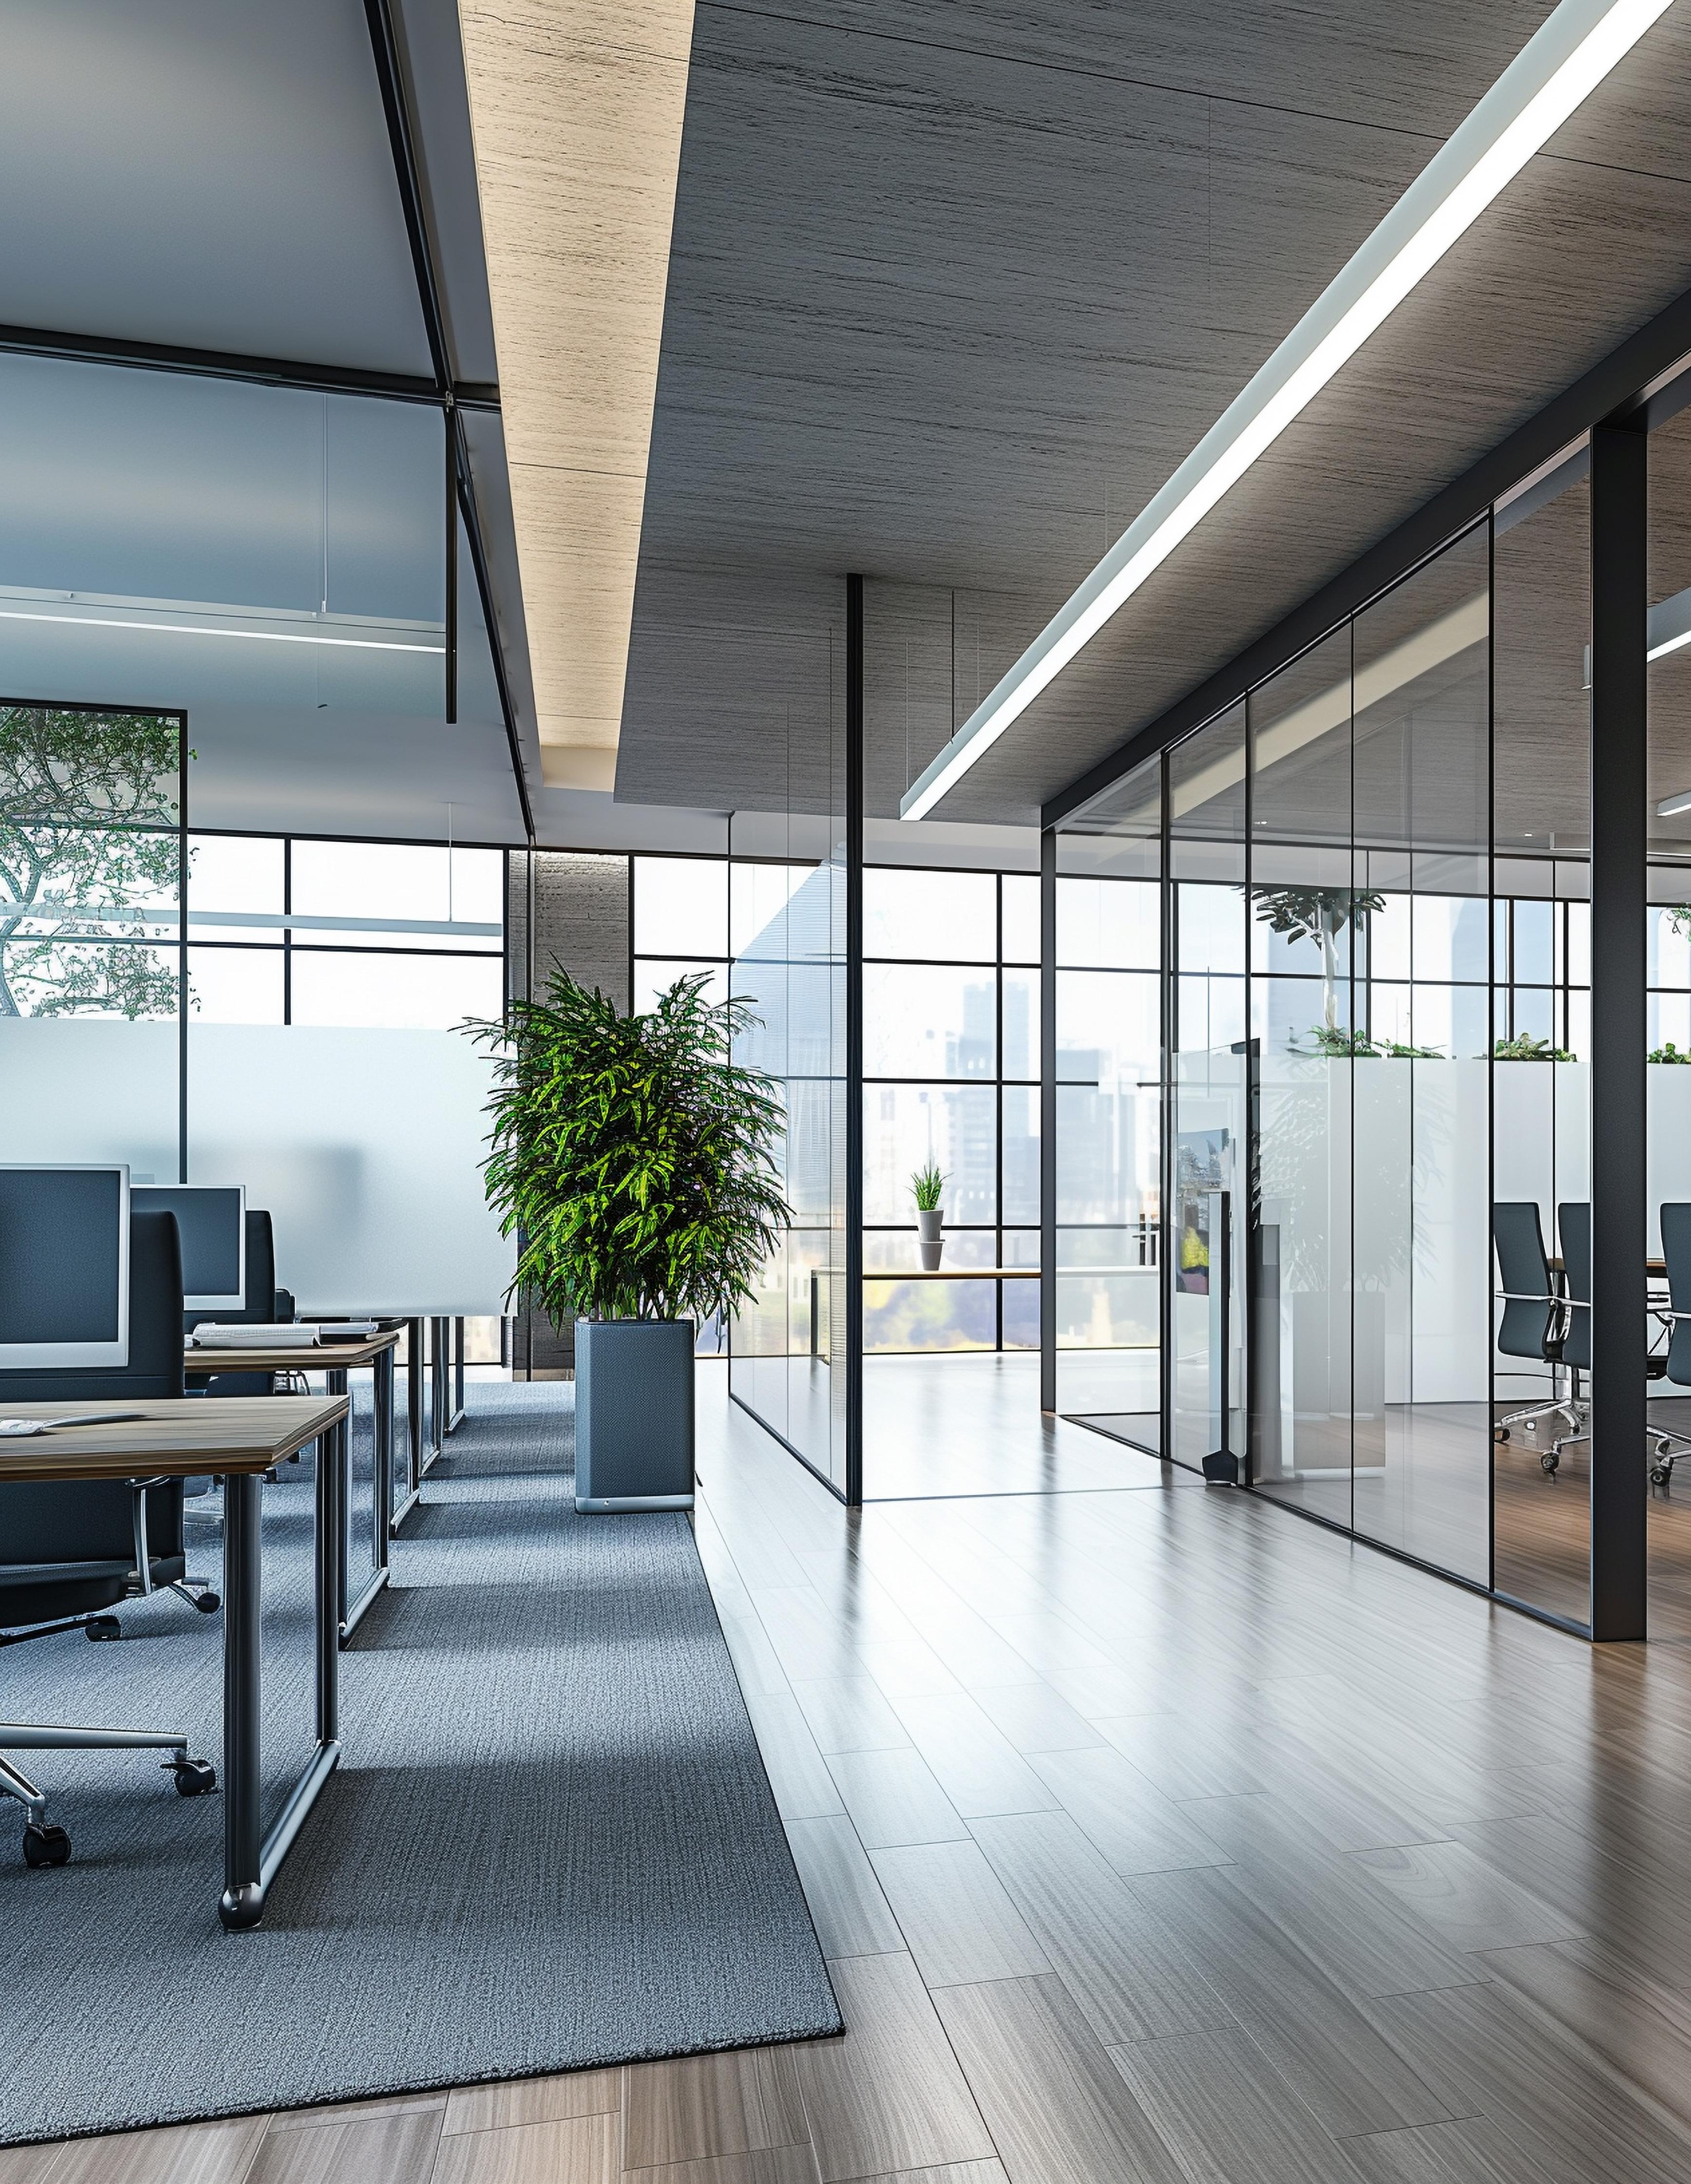
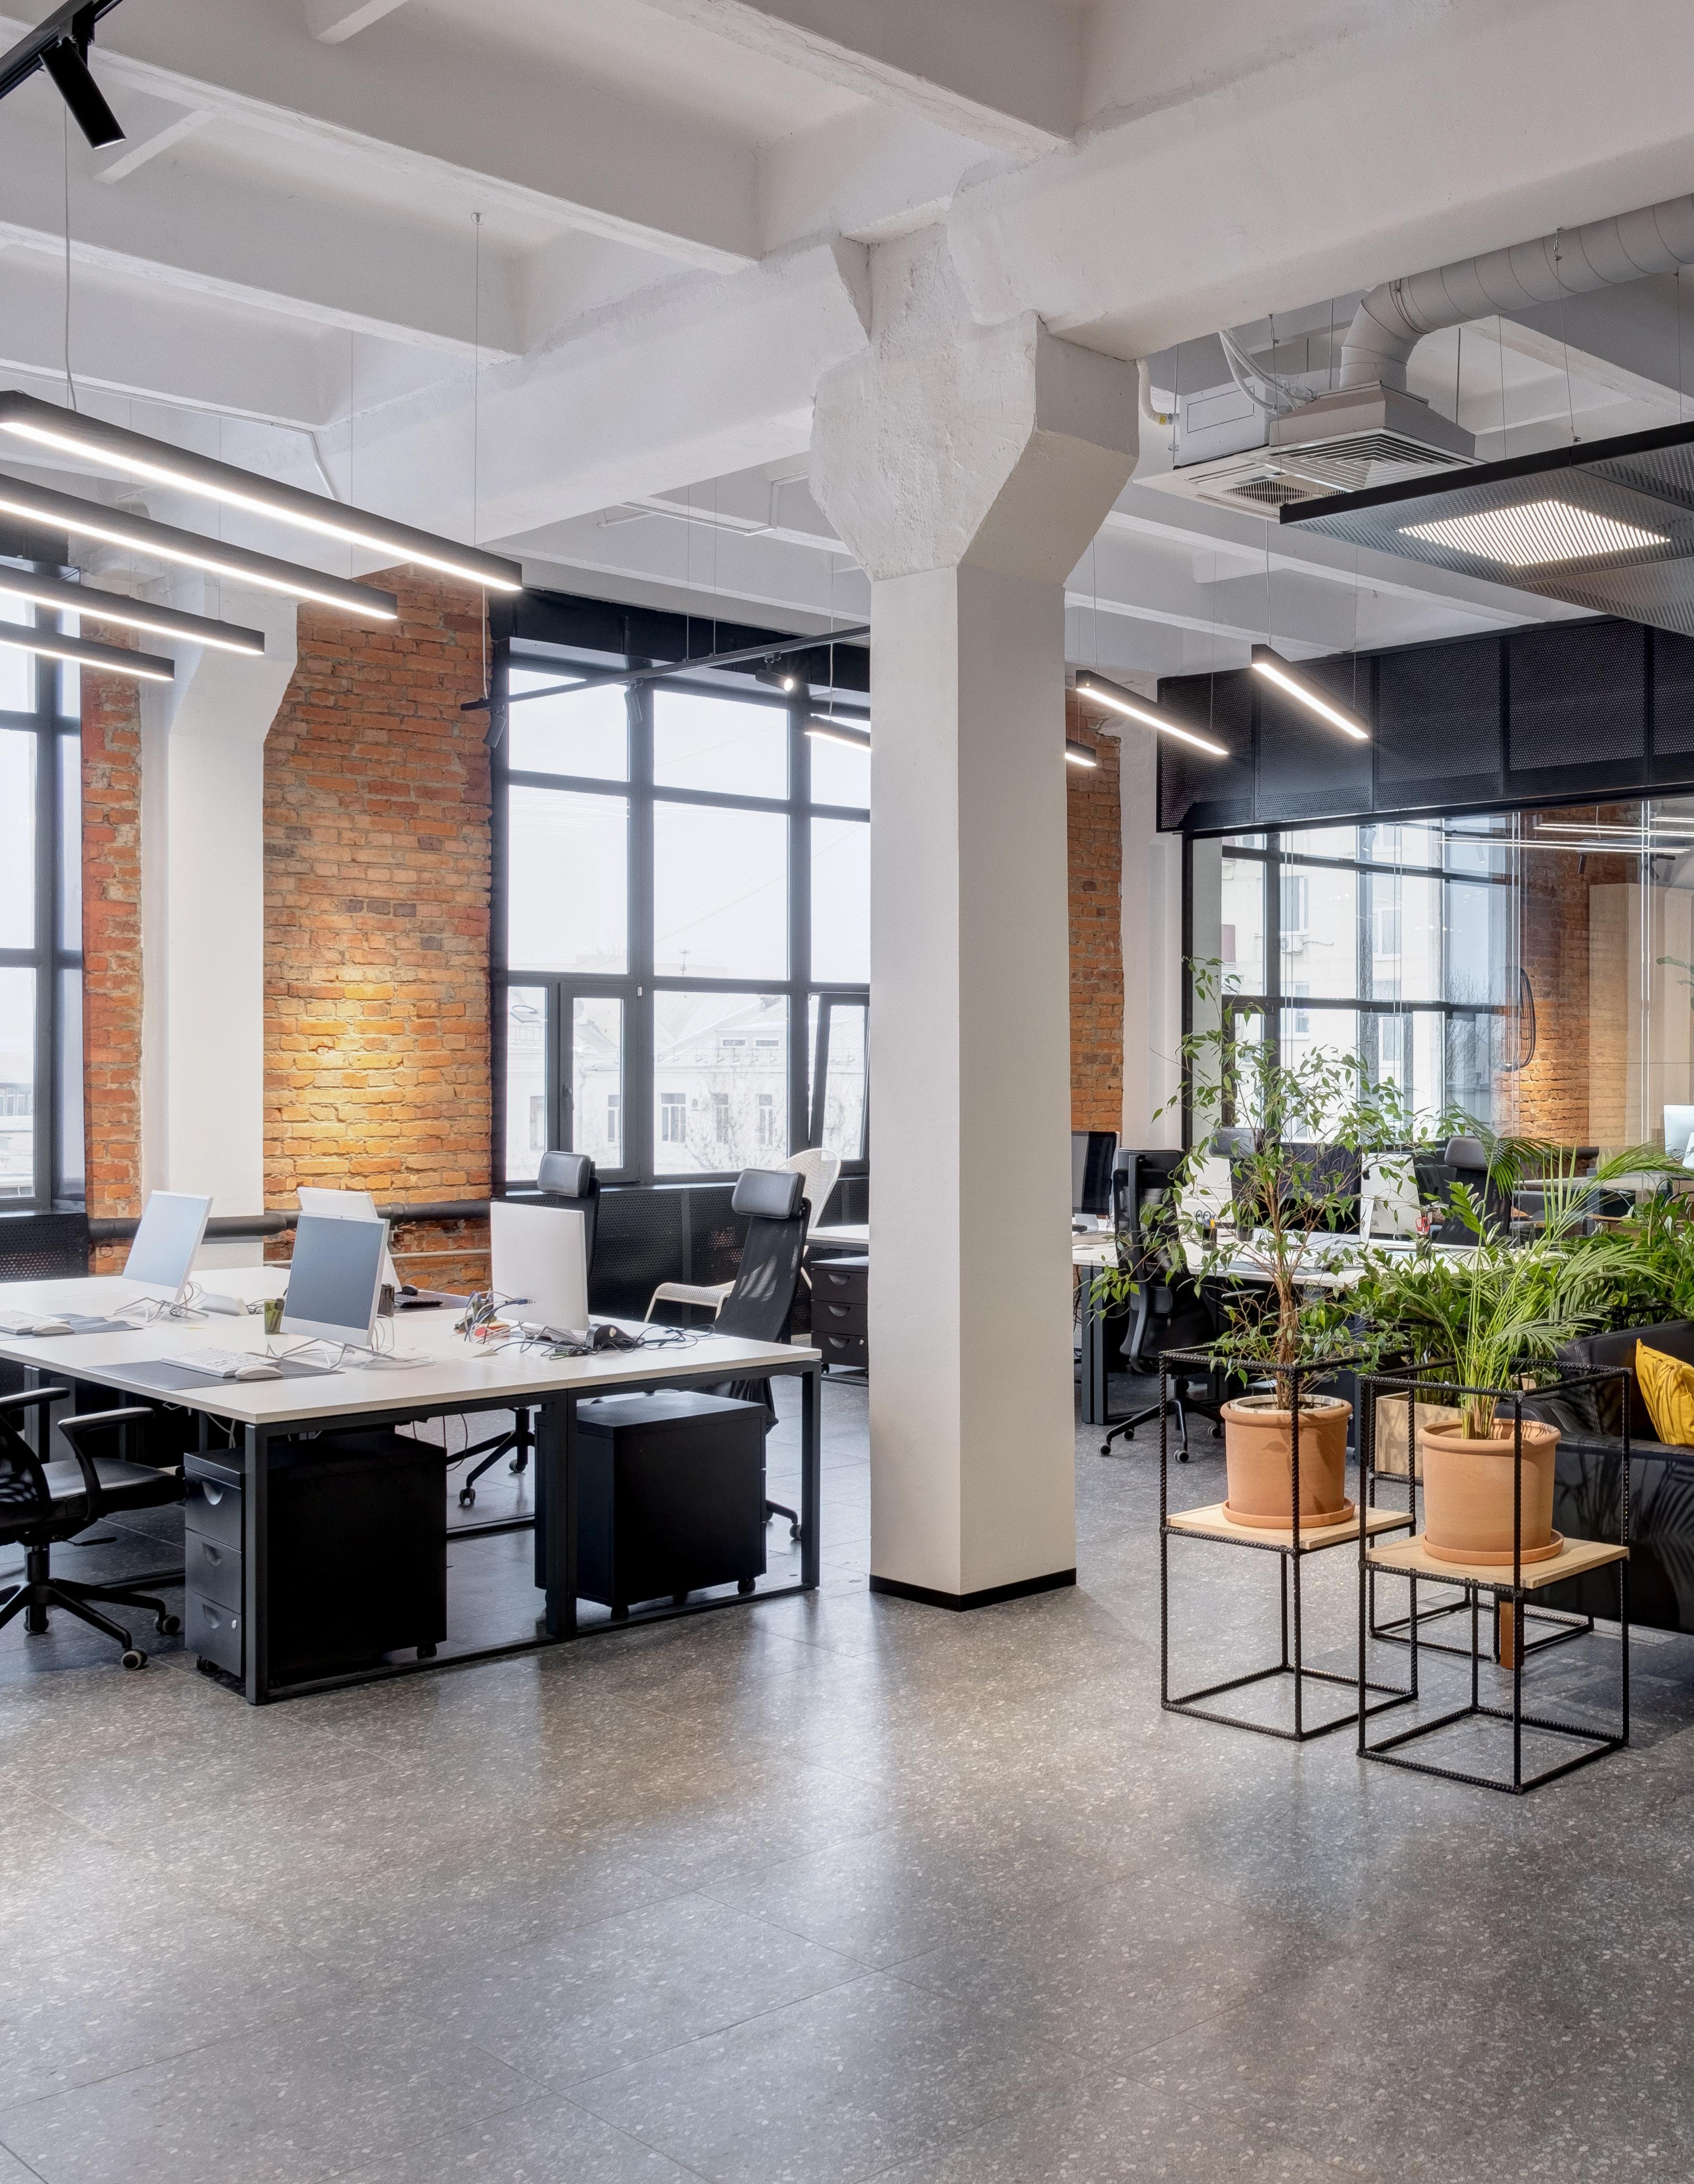
A few design trends that come to mind all stem from business owners wanting their employees to physically come back to work in the office. We are implementing more amenity spaces such as lounges, exercise and gaming rooms, more open collaborative spaces with seating areas, as well as large open breakroom/café areas. We are also adding more natural light into the tenant spaces (rooms) by adding more glass, allowing more natural light to flow into the space. We are seeing more offices with glass fronts on the interior of the space with the more open modular work environment on the building perimeter maximizing natural light into the core of their space. We are also seeing an increase in higher end finishes, making the space more inviting and appealing. A space where employees want to come to work. Businesses with large leases are desperately trying to get their employees back in the office. This also comes into play when recruiting new hires. The new generation of prospective hires seem to be more impressed with the way an office looks, as opposed to how it functions.
From your recent landlord-driven projects, what investments are resonating most with tenants: building amenities, flexible floor plates, shared collaboration space or something else? Where are landlords still over- or under-investing?
In our recent experience, building spaces that resonate the most with tenants are large meeting or training spaces. Many tenants need access to these areas on a weekly or monthly basis. Having access to these spaces as a building amenity allows them to lease a bit less square footage and to spend more of the tenant allowances on other upgrades within their proposed space. This is a huge win for the tenant when they have access to a large room they don’t have to account for in their leasable square footage. Landlords are over investing in providing new building amenity spaces such as fitness centers, particularly in older buildings, to compete with the newer buildings that are currently being built with those amenities being provided. All prospective tenants would like one, specifically a fitness center, to check a box when touring buildings, but we are seeing that they are underutilized.
How is the open-office model being recalibrated in your recent projects? What elements are being pulled back and what is replacing them - focus rooms, team rooms, hoteling or hybrid collaboration zones?
The open office concept is being recalibrated in a few different ways. There is a trend to go back to more of an enclosed office environment due to sound concerns. With that, we are seeing the request for more cozy collaborative seating areas spread out throughout the
space for relief from the privacy. Pre-COVID was a huge want for a shared desk, benching type workstation approach. During COVID, we had to try and space people out much more, even to the point of designating a certain square footage to each person.
Are tenants allocating a higher percentage of their footprint to shared or collaborative spaces today? How are those spaces being programmed differently than pre-pandemic, both within tenant suites and at the building level?
We are seeing tenants allocate a higher percentage of their footprints to shared collaborative spaces, both formal and informal. We believe this evolution is mostly related to a new view of workspace from the incoming generation of workers. Work is evolving into more of a group effort in lieu of an individual effort. That requires different areas within a space to meet those needs. The function of the workplace is also changing. With technology being so mobile, many businesses no longer require a person to be “tethered’ to a single desk all day. This new way of working allows employees to take their work to different areas within the office. They may commence the day working at their desk, then move to a lounge area to collaborate with a co-worker and finish the day in a huddle room for necessary privacy. Employees are also taking their laptop to a building café area for a change of scenery, utilizing the building owners’ amenities spaces. This new way of working is very appealing to new hires, and we incorporate all of this into our designs with tenants and building owners.
Are you seeing tenants shrink footprints but invest more heavily in quality, or are they taking a different approach?
We are seeing tenants shrink footprints as well as invest in quality fun spaces. Some businesses are combining or consolidating multiple locations into a single larger location for efficiencies, while others that have allowed their employees to work hybrid, maybe working in the office a few days per week, consolidating their space by offering shared workspaces or hoteling workstations requiring much less square footage. We have also seen an increase of full floor or single tenant buildings being converted to multi-tenant floors due to businesses downsizing. I can say that at a minimum, regardless of size, tenants are really making the effort to spend more on finishes, to showcase certain areas mainly for employee recruitment and employee retention. To end on a good note, since the first of the year, we have seen a dramatic increase with respect to space planning for prospective tenants. There is a lot of activity out there and if that’s an indication of how the year is going to be architecturally, it’s looking good so far!
Our Medical Office experts at Colliers | Columbus specializes in the leasing and sale of medical office properties across Central Ohio. Healthcare providers, practice groups, owners and investors rely on our team for in-depth market knowledge and strategic guidance tailored to the unique needs of the healthcare real estate sector.
What differentiates medical office brokerage from other commercial real estate service lines, and how do those differences influence the space needs, design considerations and operational requirements of medical office tenants?
Medical office brokerage differs from other commercial real estate service lines due to the specialized nature of healthcare users and their operational requirements. Medical tenants typically require highly customized buildouts, often involving significant upfront capital for infrastructure, regulatory compliance and clinical functionality. As a result, these users tend to favor longer lease terms to amortize their investment and are generally less mobile than traditional office tenants. While this often requires greater initial capital from landlords and investors, it is typically offset by lower rollover risk and more stable, long-term tenancy.
- Corey Taber, Vice President
How do macroeconomic factors, such as changes in insurance legislation, impact your business and influence tenants’ expectations?
Macroeconomic factors play a significant role in shaping both tenant behavior and real estate strategy in the healthcare sector. Over the past year, uncertainty around Medicaid reimbursement has materially slowed growth among providers in the behavioral health and addiction treatment sectors.
Additionally, state-level reimbursement structures heavily influence site selection decisions for regional and national healthcare operators, particularly in sectors such as autism therapy. These variations can meaningfully impact provider expansion strategies and have contributed to uneven access to care across state lines.
- Corey Taber, Vice President
How are rising construction costs affecting leasing decisions and space requirements for medical office users?
The tenants are needing to either extend lease term to amortize the construction cost over a longer period, or they contribute their own TI funds to make it work. Lease terms are trending longer, with 7–10 year deals now more common than the prior 5–7 year range.
- Chris Potts, Senior Vice President
As Columbus’ major healthcare systems continue to expand, how has that growth influenced speculative medical office construction, if at all?
While healthcare system investment and expansion in Columbus remains strong, it has not translated into a meaningful increase in speculative medical office development. Unlike general office, medical office space is highly specialized and often designed for specific clinical users, which makes speculative development more difficult to underwrite. That said, in Columbus and other major metropolitan markets, we have seen successful examples of multi-tenant medical buildings delivered with flexible infrastructure and competitive tenant improvement allowances. When paired with an anchor tenant that has a meaningful footprint, this approach can be an effective strategy for developers while still accommodating a broad range of medical users.
- Corey Taber, Vice President
Revitalization across Central Ohio has shifted from isolated projects to a coordinated, region-wide effort reshaping how residents live, work and commute. Public and private investments are redefining office location strategies by emphasizing walkability, safety and amenity-rich environments. While many of these projects do not directly add office space, they influence where office demand is most competitive.
Downtown Columbus: Developing Infrastructure as Economic Development Downtown Columbus is undergoing a transformation driven by large-scale infrastructure investment and public placemaking initiatives aimed at improving connectivity, safety and street-level activation.
The Capital Line, a planned two-mile pedestrian loop connecting the Scioto Peninsula, Scioto Mile, Capitol Square, Gay Street and Columbus Commons, represents a significant step toward improving downtown walkability. Construction is expected to begin in mid-2026, with completion targeted for 2027. A central component of the project is the redesign of Gay Street into a pedestrian-oriented retail corridor, featuring curbless sidewalks, flexible public space and active storefronts.

These improvements are intended to increase foot traffic, support small businesses, and enhance overall employee experience, addressing challenges that have constrained downtown office demand.
Downtown’s redevelopment momentum is further reinforced by Ramp Up Columbus, a $1.4 billion reconstruction of the I-70/71 corridor through the urban core. The multiphase project will improve safety and traffic flow, reduce lane changes, eliminate free-flow ramps at downtown intersections and replace aging bridges with pedestrianfriendly structures that reconnect neighborhoods historically divided by highway infrastructure.
Together, the Capital Line and Ramp Up Columbus signal a fundamental shift in how downtown is positioned as a more connected and livable neighborhood. Through adaptive reuse, property reinvestment and activation of street-level space, Downtown Columbus continues to strengthen its long-term competitiveness as an office location.
Dublin’s Bridge Park illustrates a clear pattern shaping office demand in Central Ohio: Class A office development is increasingly following dense, mixed-use environments that offer walkability and lifestyle amenities.
Bridge Park has evolved through a block-by-block development strategy, allowing office space to be delivered alongside residential, hospitality and retail components. This phased approach has reduced leasing risk and supported sustained demand for office users seeking an amenity-rich setting.
Upcoming projects reinforce this momentum. The approved Y Block development will include a hotel, condominiums, event space, retail, structured parking and a four-story, 96,000-square-foot office building integrated into the walkable Bridge Park core. To the north, Bridge North will add approximately 75,000 square feet of Class A office space, 280 multifamily units, retail, a 150-room hotel and expanded public green space further extending the district’s employment base.
Additional development within Bridge Park, including J Block, will deliver a 108,000-square-foot office building anchored by Cenovus Energy’s regional headquarters relocation. Collectively, Bridge Park and Bridge North demonstrate how phased mixed-use development can create a self-sustaining ecosystem that supports long-term office demand.
Revitalization efforts across Central Ohio are reshaping the office market by creating workplaces that are safer, more connected and increasingly supported by a wide range of amenities. Investments in infrastructure, placemaking and mixed-use development are enhancing the environments surrounding office buildings, allowing employees to better engage with one another on site and improving overall in-office experience.


Sustained demand for Class A space has clarified where value creation opportunities exist across the broader market. As tenants prioritize quality and experience, Class B assets are entering a new cycle of revitalization. With limited new construction underway, investors who modernize well-located properties can deliver competitive, experiencedriven environments at a more attainable price point, positioning these assets to capture the next wave of demand.
- Paul Krimm President, Colliers | Columbus
“

The 2026 outlook points to a market defined less by headline transactions and more by disciplined, steady deal flow. Large, highly visible Class A commitments will continue to shape perception, but underlying activity will be driven by smaller users making precise, experience-focused decisions. Tenants will continue to prioritize well-located, amenitized environments with footprints that reflect stabilized hybrid policies and measured hiring plans.
Deal volume, rather than single-tenant absorption, will shape momentum. With nearly two-thirds of 2025 leases signed under 5,000 square feet, 2026 is positioned to reward owners who can efficiently accommodate smaller users. Flexible floor plates, spec suites and speed-to-market strategies will become increasingly important competitive advantages, particularly for Class A assets seeking to maintain lease velocity without relying on infrequent large commitments.
Geographically, competition will remain concentrated in Dublin and the CBD. Dublin is expected to lead suburban activity, supported by continued interest from healthcare and financial services users. Ongoing revitalization projects and central connectivity, bolstered by highway improvements, will keep the CBD in the conversation. Layered onto this dynamic, revitalization efforts across Central Ohio are reshaping the broader office landscape. Public and private investment in infrastructure, placemaking and mixed-use development is elevating the environments surrounding office assets, strengthening walkability, safety and access to retail and hospitality. These improvements enhance the daily employee experience and reinforce the competitive positioning of well-located properties.
In 2026, success will hinge on alignment. Owners who calibrate product, pricing and leasing strategy to a market driven by smaller, deliberate decisions will be best positioned to outperform. For tenants, the environment offers optionality and leverage but also increasing competition for high-quality space in proven districts. The market is no longer defined by broad recovery narratives; it is shaped by precision, infrastructure investment and strategic positioning.