Office Market Snapshot
Stock
4,426k sqm -0.8% yoy
Avg. Vacancy
Net Take-up
13.4%
60,615 sqm
-0.6 pps. yoy
YTD: 161,541 sqm
Q3 2025
Completion
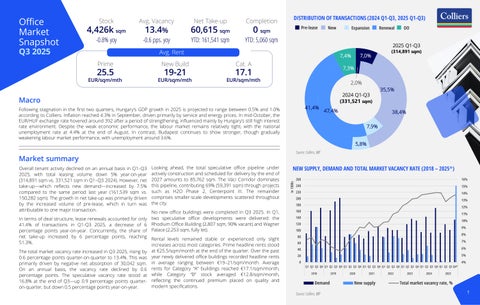
DISTRIBUTION OF TRANSACTIONS (2024 Q1-Q3, 2025 Q1-Q3)
0 sqm
Pre-lease
New
YTD: 5,060 sqm
New Build
EUR/sqm/mth
EUR/sqm/mth
25.5
19-21
7,0%
7,4%
Cat. A
OO
(314,891 sqm)
7,3%
17.1
EUR/sqm/mth
2,0%
Macro
41,4%
Following stagnation in the first two quarters, Hungary’s GDP growth in 2025 is projected to range between 0.5% and 1.0% according to Colliers. Inflation reached 4.3% in September, driven primarily by service and energy prices. In mid-October, the EUR/HUF exchange rate hovered around 392 after a period of strengthening, influenced mainly by Hungary’s still high interest rate environment. Despite the weak economic performance, the labour market remains relatively tight, with the national unemployment rate at 4.4% at the end of August. In contrast, Budapest continues to show stronger, though gradually weakening labour market performance, with unemployment around 3.6%.
2024 Q1-Q3 (331,521 sqm) 47,4%
35,5%
38,4% 7,9% 5,8%
Source: Colliers, BRF
Market summary Looking ahead, the total speculative office pipeline under actively construction and scheduled for delivery by the end of 2027 amounts to 85,762 sqm. The Váci Corridor dominates this pipeline, contributing 69% (59,391 sqm) through projects such as H2O Phase 2, Centerpoint III. The remainder comprises smaller-scale developments scattered throughout the city.
No new office buildings were completed in Q3 2025. In Q1, In terms of deal structure, lease renewals accounted for only two speculative office developments were delivered: the 41.4% of transactions in Q1-Q3 2025, a decrease of 6 Rhodium Office Building (2,807 sqm, 90% vacant) and Wagner percentage points year-on-year. Concurrently, the share of Palace (2,253 sqm, fully let). net take-up increased by 6 percentage points, reaching Rental levels remained stable or experienced only slight 51.3%. increases across most categories. Prime headline rents stood The total market vacancy rate increased in Q3 2025, rising by at €25.5/sqm/month at the end of the quarter. Over the past 0.6 percentage points quarter-on-quarter to 13.4%. This was year newly delivered office buildings recorded headline rents primarily driven by negative net absorption of 30,042 sqm. in average ranging between €19–21/sqm/month. Average On an annual basis, the vacancy rate declined by 0.6 rents for Category “A” buildings reached €17.1/sqm/month, percentage points. The speculative vacancy rate stood at while Category “B” stock averaged €12.8/sqm/month, 16.8% at the end of Q3—up 0.9 percentage points quarter- reflecting the continued premium placed on quality and modern specifications. on-quarter, but down 0.5 percentage points year-on-year.
NEW SUPPLY, DEMAND AND TOTAL MARKET VACANCY RATE (2018 – 2025*) In 1000s
Overall tenant activity declined on an annual basis in Q1–Q3 2025, with total leasing volume down 5% year-on-year (314,891 sqm vs. 331,521 sqm in Q1–Q3 2024). However, net take-up—which reflects new demand—increased by 7.5% compared to the same period last year (161,539 sqm vs. 150,282 sqm). The growth in net take-up was primarily driven by the increased volume of pre-lease, which in turn was attributable to one major transaction.
Renewal
2025 Q1-Q3
Avg. Rent
Prime
Expansion
260
16%
240
15%
220
14%
200
13%
180
12%
160
11%
140
10%
120
9%
100
8%
80 60
7%
40
6%
20
5%
0
4% Q1 Q2 Q3 Q4 Q1 Q2 Q3 Q4 Q1 Q2 Q3 Q4 Q1 Q2 Q3 Q4 Q1 Q2 Q3 Q4 Q1 Q2 Q3 Q4 Q1 Q2 Q3 Q4 Q1 Q2 Q3 Q4* 2018
Demand Source: Colliers, BRF
2019
2020
2021
New supply
2022
2023
2024
2025
Total market vacancy rate, % 1