Office Market Snapshot
Stock
4,426k sqm -0.33% yoy
Avg. Vacancy
Net Take-up
12.8%
49,956 sqm
-1.2 pp yoy
YTD: 100,925 sqm
Q2 2025
Completion
0 sqm
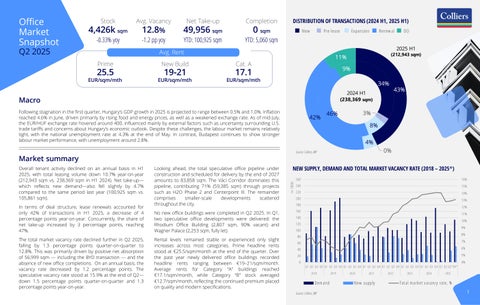
DISTRIBUTION OF TRANSACTIONS (2024 H1, 2025 H1) Pre-lease
New
New Build
EUR/sqm/mth
EUR/sqm/mth
25.5
19-21
OO
2025 H1
(212,943 sqm)
11%
Cat. A
9%
17.1
EUR/sqm/mth
34% 2024 H1 (238,369 sqm)
Macro Following stagnation in the first quarter, Hungary’s GDP growth in 2025 is projected to range between 0.5% and 1.0%. Inflation reached 4.6% in June, driven primarily by rising food and energy prices, as well as a weakened exchange rate. As of mid-July, the EUR/HUF exchange rate hovered around 400, influenced mainly by external factors such as uncertainty surrounding U.S. trade tariffs and concerns about Hungary’s economic outlook. Despite these challenges, the labour market remains relatively tight, with the national unemployment rate at 4.3% at the end of May. In contrast, Budapest continues to show stronger labour market performance, with unemployment around 2.8%.
42%
3%
46%
4% 0%
Source: Colliers, BRF
In terms of deal structure, lease renewals accounted for only 42% of transactions in H1 2025, a decrease of 4 percentage points year-on-year. Concurrently, the share of net take-up increased by 3 percentage points, reaching 47%.
No new office buildings were completed in Q2 2025. In Q1, two speculative office developments were delivered: the Rhodium Office Building (2,807 sqm, 90% vacant) and Wagner Palace (2,253 sqm, fully let).
The total market vacancy rate declined further in Q2 2025, falling by 1.3 percentage points quarter-on-quarter to 12.8%. This was primarily driven by positive net absorption of 56,999 sqm — including the BYD transaction — and the absence of new office completions. On an annual basis, the vacancy rate decreased by 1.2 percentage points. The speculative vacancy rate stood at 15.9% at the end of Q2— down 1.5 percentage points quarter-on-quarter and 1.3 percentage points year-on-year.
Rental levels remained stable or experienced only slight increases across most categories. Prime headline rents stood at €25.5/sqm/month at the end of the quarter. Over the past year newly delivered office buildings recorded headline rents ranging between €19–21/sqm/month. Average rents for Category “A” buildings reached €17.1/sqm/month, while Category “B” stock averaged €12.7/sqm/month, reflecting the continued premium placed on quality and modern specifications.
NEW SUPPLY, DEMAND AND TOTAL MARKET VACANCY RATE (2018 – 2025*) In 1000s
Looking ahead, the total speculative office pipeline under construction and scheduled for delivery by the end of 2027 amounts to 83,858 sqm. The Váci Corridor dominates this pipeline, contributing 71% (59,385 sqm) through projects such as H2O Phase 2 and Centerpoint III. The remainder comprises smaller-scale developments scattered throughout the city.
43%
8%
Market summary Overall tenant activity declined on an annual basis in H1 2025, with total leasing volume down 10.7% year-on-year (212,943 sqm vs. 238,369 sqm in H1 2024). Net take-up— which reflects new demand—also fell slightly by 4.7% compared to the same period last year (100,925 sqm vs. 105,861 sqm).
Renew al
YTD: 5,060 sqm
Avg. Rent Prime
Ex pansion
260
16%
240
15%
220
14%
200
13%
180
12%
160
11%
140
10%
120
9%
100
8%
80 60
7%
40
6%
20
5% 4%
0 Q1 Q2 Q3 Q4 Q1 Q2 Q3 Q4 Q1 Q2 Q3 Q4 Q1 Q2 Q3 Q4 Q1 Q2 Q3 Q4 Q1 Q2 Q3 Q4 Q1 Q2 Q3 Q4 Q1 Q2 Q3* Q4* 2018
Dem and Source: Colliers, BRF
2019
2020
2021
New supply
2022
2023
2024
2025
Tot al m ark et v acancy rat e, % 1