Office Market Snapshot Q3 2024
Stock
4,463k sqm +3 yoy
Avg. Vacancy
14.0%
+1.05 pp yoy
Net Take-up
44,421 sqm YTD: 150,282 sqm
Completion
23,205 sqm
DISTRIBUTION OF TRANSACTIONS (Q1-Q3 2023, Q1-Q3 2024) Pre-lease
New
YTD: 101,486 sqm
Avg. Rent Prime
25.5 EUR/sqm/mth
New Build
19 EUR/sqm/mth
Expansion
2.0%
7.3% Cat. A
1.1%
16.8 EUR/sqm/mth
After a 1.3% growth in the national economy in H1 2024, with the decrease in inflation and interest rates, a GDP growth rate of around 1.5-2% is likely for the whole year. Domestic inflation, which decreased to 3.0% in September, is forecasted to reach 3.54.0% in 2024. As of mid-October, the EUR/HUF exchange rate remains above the 400 level, primarily influenced by both internal factors, such as the decreasing base rate, and the continued absence of EU funds, as well as external factors like the Middle Eastern crisis, the U.S. elections, and the base rates set by the Fed and ECB. Despite these challenges, the labour market remains tight, resulting in a decrease in the unemployment rate, which reached 4.2% at the end of August. In Budapest, the unemployment rate is even lower, around 2%.
47.4%
47.0%
OO
Q1-Q3 2024
(331,522 sqm)
1.4%
Q1-Q3 2023
Macro
Renewal
(329,516 sqm)
4.4%
35.5% 46.1%
7.9% Source: Colliers, BRF
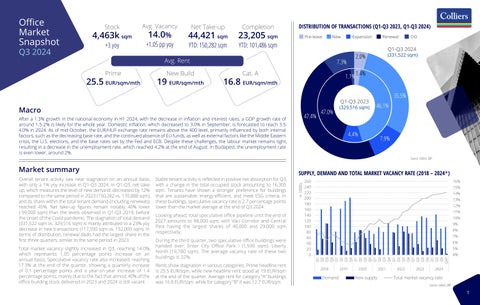
Market summary Overall tenant activity saw near stagnation on an annual basis, Stable tenant activity is reflected in positive net absorption for Q3, with only a 1% yoy increase in Q1-Q3 2024. In Q1-Q3, net take- with a change in the total occupied stock amounting to 16,305 up, which measures the level of new demand, decreased by 12% sqm. Tenants have shown a stronger preference for buildings compared to the same period in 2023 (150,282 vs. 170,888 sqm), that are sustainable, energy-efficient, and meet ESG criteria. In and its share within the total tenant demand (including renewals) these buildings, speculative vacancy rate is 2.7 percentage points reached 45%. Net take-up figures remain notably 40% lower lower than the market average at the end of Q3 2024. (-99,000 sqm) than the levels observed in Q1-Q3 2019, before Looking ahead, total speculative office pipeline until the end of the onset of the Covid pandemic. The stagnation of total demand 2027 amounts to 98,000 sqm, with Váci Corridor and Central (331,522 sqm vs. 329,516 sqm) is mainly attributed to a 23% yoy Pest having the largest shares of 40,000 and 29,000 sqm, decrease in new transactions (117,590 sqm vs. 152,009 sqm). In respectively. terms of distribution, renewal deals had the largest share in the first three quarters, similar to the same period in 2023. During the third quarter, two speculative office buildings were handed over: Enter City Office Park I (1,930 sqm), Liberty Total market vacancy slightly increased in Q3, reaching 14.0%, North (19,780 sqm). The average vacancy rate of these two which represents 1.05 percentage points increase on an buildings is 32%. annual basis. Speculative vacancy rate also increased, reaching 17.3% at the end of the quarter, showing a quarterly increase Rents show stagnation in various categories. Prime headline rent of 0.1 percentage points and a year-on-year increase of 1.4 is 25.5 EUR/sqm, while new headline rent stood at 19 EUR/sqm percentage points, mainly due to the fact that almost 40% of the at the end of the quarter. Average rent for category “A” buildings office building stock delivered in 2023 and 2024 is still vacant. was 16.8 EUR/sqm, while for category “B” it was 12.7 EUR/sqm.
SUPPLY, DEMAND AND TOTAL MARKET VACANCY RATE (2018 – 2024*)
Source: Colliers, BRF
1