
RESEARCHPAPER
2025U.S.GeologicalSurveyNationalSeismicHazard ModelforPuertoRicoandtheU.S.VirginIslands:
OverviewofModelandHazardResults
AllisonM.Shumway1 | KevinR.Milner2 | PeterM.Powers1 | MorganP.Moschetti1 | JasonM.Altekruse1 | JulieA.Herrick1 | AndreaL.Llenos1 | KyleB.Withers1 | EdwardH.Field1 | BradT.Aagaard1 | RichardW.Briggs1 | AlexandraE.Hatem1 | KirstieL.Haynie1 | AndrewJ.Michael3 | JessicaA.ThompsonJobe1 | KishorS.Jaiswal1 | BrandonS.Clayton1 | NicolasLuco1 | MarkD.Petersen1 | SanazRezaeian1 | ThomasL.Pratt4 | YuehuaZeng1
1U.S.GeologicalSurvey,Golden,Colorado,USA | 2U.S.GeologicalSurvey,Pasadena,California,USA | 3U.S.GeologicalSurvey,Moffett Field,California,USA | 4U.S.GeologicalSurvey,Reston,Virginia,USA
Correspondence: AllisonM.Shumway(ashumway@usgs.gov)
Received: 28February2025 | Revised: 4February2026 | Accepted: 8February2026
ABSTRACT
TheU.S.GeologicalSurveyrecentlyupdatedtheNationalSeismicHazardModel(NSHM)forPuertoRicoandthe U.S.VirginIslands(PRVI).ThefirstversionofthePRVINSHMwasreleasedin2003,andthereforethis2025update includesover20yearsofnewgeologic,geophysical,andengineeringdata,methods,andmodels.Updatesfollow similareffortsperformedintherecent202350-stateNSHM.However,thisisthefirstNSHMinwhichwe:(1)apply aninversionmethodologytosubductioninterfacefaultsourcesintheearthquakeruptureforecast(ERF)model;(2) developscaledbackbonemedianground-motionmodelsandindependentaleatoryvariabilitymodelsthatare appliedintheground-motioncharacterization(GMC)model;and(3)calculateepistemicuncertaintyrelatedtoalternativescenariosintheERFandGMCmodelsforallgridpointsinthestudyregion.Long-termtime-independent meanhazardcalculationswereperformedforpeakgroundaccelerationand5%-dampedpseudospectralacceleration at21spectralperiodsfrom0.01-to10.0-s,foreightNationalEarthquakeHazardsReductionProgramsiteconditions rangingfrom VS30 = 150to1500m/s,andfor2%,5%,and10%in50-yearprobabilitiesofexceedance(returnperiods of2475,975,and475years,respectively).Epistemicuncertainty,intheformofselectedpercentiles,isalsoprovided forasuiteoftestsitesandallgridpointsinthestudyregionforlimitedperiods,siteconditions,andprobabilitiesof exceedance.Selectedresults,includingcomparisonswiththe2003PRVINSHM,areshownanddiscussedfor selectedperiods,siteconditions,andprobabilitiesofexceedance.Whencomparingthe2025PRVINSHMwith the2003PRVINSHM,hazardisgenerallyhigheratshorterperiodsandloweratlongerperiods,asaresultofupdates inbothERFandGMCmodels.The2025PRVINSHMisapplicableforreturnperiodsgreaterthan 475orless than 10,000years.
Thisisanopenaccessarticleunderthetermsofthe CreativeCommonsAttribution License,whichpermitsuse,distributionandreproductioninany medium,providedtheoriginalworkisproperlycited.
Published2026.ThisarticleisaU.S.GovernmentworkandisinthepublicdomainintheUSA. EarthquakeSpectra publishedbyWileyPeriodicals LLConbehalfofEarthquakeEngineeringResearchInstitute.
EarthquakeSpectra,2026;42:e70055 1of43 https://doi.org/10.1002/esp4.70055
PuertoRicoandtheU.S.VirginIslands(PRVI)aresituatedinaseismicallyactiveandtectonicallycomplexregionnear theobliquelyconvergingCaribbeanandNorthAmericantectonicplateboundary,causingsignificanthazardandriskto the 3.3millionU.S.citizenslivingontheseislands(WorldBankGroup2025).Overthepastfourcenturies,majorearthquakesthathavecauseddamageacrossthisregionhavebeennotedinthehistoricalrecord(McCannetal.2010; Puerto RicoSeismicNetwork(PRSN)2025; tenBrinketal.2011).ExistingbuildingsinPuertoRicocanbehighlysusceptibleto damageandcollapsefromearthquakes,asthevastmajoritywerebuiltpriorto1987whenthebuildingcodewasupdated withmodernseismicprovisions,andmanyhouseshavebeenbuiltinformally(R.Herrera,SanJuan,PuertoRico,written commun.,April18,2025; Mirandaetal.2020; Murryetal.2022).Ofthe1.4millionstructuresinPuertoRico,nearly42% areunreinforcedmasonry,28%arereinforcedmasonry,andsomebuildingsdatebacktothe16thcenturyinOldSanJuan (FederalEmergencyManagementAgency(FEMA)2024).ThevulnerabilityofPuertoRico’sinfrastructurewasrecently demonstratedbydamagecausedduringthe2019–2020SouthwestPuertoRicoearthquakesequence.FromDecember28, 2019,toJanuary11,2020,aseriesofmoderatemagnitudeearthquakes(momentmagnitude[M] ≥ M 5),includingthe January7,2020, M 6.4mainshock(Vi ˇ ci ˇ cetal.2022),occurredinsouthwesternPuertoRico(Mirandaetal.2020).Damage fromtheseeventscaused:(1)completecollapseofatleast80structures,mostofwhichweresingle-familyresidentialunits (Mirandaetal.2020);(2)partialcollapseofathree-storypublicschool(Mirandaetal.2020);(3)structuraldamagein 280buildings(includingmultistoryresidential,office,andmanyotherbuildingtypes)(Mirandaetal.2020);(4)extensiveroadwaydamagefromlandslidesandlandsubsidence(Allstadtetal.2020);(5)disruptionsofpotablewaterand wastewaterfacilities(Mirandaetal.2020);(6)lossofpowerformonths(Mirandaetal.2020);(7)estimatedlossesin excessof3.1billiondollars(U.S.GovernmentAccountabilityOffice2024);and(8)atleastonefatality(Reuters 2020).IndevelopingtheriskassessmentdocumentFederalEmergencyManagementAgency(FEMA)P-366,the DepartmentofHomelandSecurity,theNationalEarthquakeHazardsReductionProgram(NEHRP),andtheU.S. GeologicalSurvey(USGS)calculatedanaverageannualizedearthquakelossof$340M/yrforPuertoRico,whichplaces theislandwithinthetopfiveregions(orstates)acrosstheUnitedStatesforearthquakelosses(Jaiswaletal.2023). ModelingandforecastingseismichazardistheprimaryobjectiveoftheUSGSNationalSeismicHazardModels(NSHMs), whichprovideseismichazardassessmentsforthe50UnitedStatesandtheinhabitedU.Sterritories(Algermissenand Perkins1976; Frankeletal.1996, 2002; Kleinetal.2001; Muelleretal.2003, 2010, 2012; Petersenetal. 2008, 2012, 2014, 2015, 2020, 2022, 2024; Powersetal.2024; Wessonetal.1999, 2007).Theseassessmentsforecastwhere, howmuch,andhowoftenthegroundcouldshakefromfutureearthquakes,providinginformationthatcanbeusedto informpublicpolicyandhelpcommunitiesbemoreresilienttoearthquakes.
TheUSGSreleasedthefirstPRVINSHMin2003(Muelleretal.2003, 2010,hereaftercalledthe2003PRVINSHM).The 2003PRVINSHMincludedthreeactivecrustalfaults,twofault-zonepolygons(alsocalledareasources,arealsources,or arealzonesources),asubductionsource,andshallowanddeepbackgroundgriddedseismicitysources(refertoFigure ES-1).Ground-motionmodels(GMMs)includedpre-NextGenerationAttenuation(NGA)modelsdevelopedforactive crustalandsubductionregions,aswellasaPuertoRico-specificGMM(refertoTableES-1).Groundmotionswere forecasttobehighest(1–1.5g,wheregisthestandardaccelerationduetoearth’sgravity)for0.2-spseudospectralacceleration(hereafterdesignatedspectralaccelerationorSA)for2%in50-yearprobabilityofexceedance(PE)andNEHRP siteclassBC(VS30 = 760m/s,where VS30 isthetime-averagedshear-wavevelocityintheupper30m)onthewesternside ofPuertoRicoandontheU.S.VirginIslandsofSt.ThomasandSt.John.ThiswaslargelybecauseofthenearbyMona Passageextensionalarealzonesource(offthewesterncoastofPuertoRico)andclustersofseismicityinthebackground griddedseismicitysourcesnearandnorthoftheU.S.VirginIslands,respectively(Muelleretal.2003, 2010).Forecast groundmotionsonthenorthernsideofPuertoRicowerelargelyinfluencedbythePuertoRicosectionofthePuertoRico Trenchsubductionsourcetothenorth,whiletheeasternsideofPuertoRicowaslargelyinfluencedbythenearby AnegadaPassageextensionalarealzonesource(Muelleretal.2003, 2010).
Forthe2025updateofthePRVINSHM,wehaveconsiderednewgeologic,geophysical,andengineeringdata,methods, andmodelsavailablesincethefirstversionofthePRVINSHMwaspublishedover20yearsago.Updatesinthe2025PRVI NSHMinclude:
1.newactivecrustalfaultandgeologicdeformationmodels; 2.updatedmodelingofsubductionzonegeometry,interfacefaults,andinterfacedeformation; 3.newmagnitude-area(M-A)scalingrelationships; 4.improvedfault-sourcerupturemodels,includingaccommodatingmultifaultruptures; 5.anupdatedseismicitycatalogincludingreviseddatafromthePuertoRicoSeismicNetwork(PRSN); 6.anewearthquakecatalogseparationprocessthatassignsearthquakestoatectonicregime;
7.reviseddeclusteringmethods(todistinguishmainshocksfromforeshocksandaftershocks),smoothingalgorithms, andseismicityratemodels;
8.amorecompleterepresentationofepistemicuncertainties(uncertaintyresultingfromalackofknowledgeorinformation,whichcantheoreticallybereducedbymoreinformation)intheearthquakeruptureforecast(ERF)model;
9.adoptionofmorerecentGMMsforbothactivecrustalandsubductionsources(interfaceandintraslab),withadjustmentsmadebasedonPRVI-specificdata;and
10.developmentofGMMepistemicuncertaintyandaleatoryvariability(natural,randomuncertaintythatcannotbe eliminated,evenwithmoreinformation)modelsspecifictoPRVIintheground-motioncharacterization(GMC) model.
Theseupdatesfollowsimilareffortsperformedintherecent202350-stateNSHM(Fieldetal.2023; Moschettietal. 2024; Petersenetal.2022, 2024; Powersetal.2024)andalsointroducesomenewmethodologies.Forexample,this isthefirstNSHMinwhichwe:(1)applyaninversionmethodologytosubductioninterfacefaultsourcesintheERF model;(2)developscaledbackbonemedianGMMsandindependentaleatoryvariabilitymodelsthatareappliedin theGMCmodel;and(3)calculateepistemicuncertaintyrelatedtoalternativescenariosintheERFandGMCmodels forallgridpointsinthestudyarea.Long-termtime-independentmeanhazardforpeakgroundacceleration(PGA)and21 spectralperiodsfrom0.01-to10.0-sSAwitha5%-dampedresponse,foreightNEHRPsiteconditionsfrom VS30 = 150to 1500m/s(definedbythe2020NEHRPRecommendedSeismicProvisionsforNewBuildingsandOtherStructures [BuildingSeismicSafetyCouncil(BSSC)2020]),and2%,5%,and10%PEareavailable(correspondingtoreturnperiods of2475,975,and475years,respectively).Inadditiontomeanhazardresults,epistemicuncertainty,intheformof selectedpercentiles(alsocalledfractiles),isalsoprovidedforasuiteof86testsitesandallgridpointsinthestudyregion forlimitedspectralperiods,siteconditions,andPEs.
The2025PRVINSHMisalong-termtime-independentmodel,meaningitforecaststheaveragerateofearthquakesover longtimeperiods(decadesorcenturies),assumingearthquakesoccurrandomlyintime,andthateventoccurrenceis independentofpastearthquakes(i.e.,thePoissonmodel).Long-termtime-independentmodelsprovidestableseismic hazardforecaststhatdonotfluctuatewithshort-termchangesinseismicity,whicharetheprimaryinterestforbuilding codesandlong-termriskassessments.However,seismicitycatalogsexhibitspatiotemporalclustering(aftershocksand otherwisetriggeredevents),whichcaninfluenceshorter-termhazardandriskassessments(e.g., Field,Milner,andLuco 2021, Field,Milner,andPorter2025).Whilewegenerallysaythatourtime-independentmodelsareapplicableforreturn periodsgreaterthan 475years(andlessthan 10,000years),thereisnowell-definedcutoffthatappliestoallapplications,souserscanattempttoevaluateapplicabilityonacase-by-casebasis.Thiscanbedifficultwithouthavingan alternativefullytime-dependentforecast(e.g., Field,Milner,Pageetal.2021).Developingsuchmodelsnationwideisa targetofongoingresearchanddevelopmentefforts(e.g., Field,Hatem,Shawetal.2025).
TheNSHMsarecommunity-andconsensus-basedmodelsthatstrivetomeetthegoalofincorporatingthelatestdata, methods,andmodelscurrentlyavailableandevaluatedtobetechnicallyacceptable(Jordanetal.2023).Publicworkshops,apubliccommentperiod,peerreview,andtechnicalevaluationbythreereviewpanelshelpedusmeetthisgoalfor the2025PRVINSHM.Publicworkshopsthroughouttheupdateprocessallowedthescientificcommunity,users,andthe publictoevaluateinputmodelsanddrafthazardresults,providingvaluablefeedbackasthemodelwasdevelopedand finalized.Thisincludeda2-daypublicworkshopheldinSanJuan,PuertoRico,August28–29,2024,which 40people attendedinpersonand 100peopleparticipatedonline.ApubliccommentperiodwasheldMarch18–April18,2025. Commentsreceivedduringthistimeweretakenintoconsiderationwhenfinalizingthemodel.Peerreviewofmodel documentationwasperformedbyjournalandUSGSreviewers,providingconstructivefeedbackandstrengthening thedocumentation.TheNSHMProjectSteeringCommittee(NSHMP-SC),whichconsistsofninesubjectmatterexperts, oversawthetechnicalreviewofthe2025PRVINSHMthroughouttheupdateprocessandweretaskedtodecideif:(1)the modelwasadequatelyreviewed;(2)werespondedappropriatelytoreviewcommentsandrecommendations;and(3)the modelwassuitableforreleasetoserveasthebasisforhazardmitigation.TohelpanswerthesequestionstheNSHMP-SC chargeditstwosubcommittees,theERFandGMCreviewpanels,withevaluatingtheirrespectivecomponentsofthe model.Bothpanelswereinvitedtoparticipateinthepublicworkshop,andtheywereprovidedwithbriefingsanddocumentationonspecifictopicsrelatedtoERFandGMCmodelcomponentsofthe2025PRVINSHM.Basedonthepublic workshop,briefings,anddocumentationofmodelcomponents,eachreviewpanelprovidedwrittenrecommendationsfor theauthorstoconsiderwhenfinalizingthe2025PRVINSHM(i.e.,ERFReviewPanelReportandAddendum Jordanetal. 2026 andGMCReviewPanelReport[Stewartetal.2025]).Basedontheoverallmodeldevelopmentprocess,andour responsestopeerreviewandreviewpanelrecommendationswhenfinalizingthemodel,theNSHMP-SCconcludedthat: (1)the2025PRVINSHMwasadequatelyreviewed;(2)thatwerespondedappropriatelytothereviewcommentsand
recommendations;and(3)thatthemodelissuitableforreleasetoserveasthebasisforhazardmitigation(NSHMP-SC ReviewReport[Stewartetal.2026]).
Inthisarticle,weprovideanoverviewofthe2025PRVINSHMmodelcomponentsbutmainlypresentasubsetofseismic hazardresultscomparedwiththe2003PRVINSHManddiscussdifferencesbetweentheNSHMsthatresultinmeaningfulhazardchanges.Severalcompanionarticlesprovidemuchgreaterdetailsofthedata,methods,andmodels includedinthe2025PRVINSHM.Theseincludearticlesrelatedtotheseismicitycatalogandbackgroundgridded seismicitymodel(Haynieetal.2025; Llenosetal.2025; MichaelandLlenos2025),activecrustalfaultandgeologicdeformationmodels(Hatemetal.2026; ThompsonJobeetal.2024b),overviewoftheERFmodel(Milneretal.2026),groundmotiondataevaluationandadjustments(Aagaardetal.2026),GMMevaluationandselection(Withersetal.2026), ground-motionaleatoryvariabilitymodels(Moschetti2026),andoverviewoftheGMCmodel(Moschettietal.2026).
2 | StudyRegion
PuertoRico(self-titledmainislandandseveralsmallerislandsincludingVieques,Culebra,andMona)andthethreeU.S. VirginIslandsofSt.Thomas,St.John,andSt.CroixsitwithinthePuertoRico-VirginIslandsmicroplate,oneofseveral microplatesthatcomprisethecomplextectonicplateboundarybetweentheNorthAmericanplatetothenorthandthe Caribbeanplatetothesouth(Jansmaetal.2000 andFigure 1).IntheNorthernCaribbean,theNorthAmericanCaribbeanplateboundaryprimarilyaccommodatesleft-lateral,strike-slipmotion,withtheNorthAmericanplatemoving west-southwesterlyintheareawest-northwestofPuertoRico,butdirectlynorth–northeastofPuertoRico,theplateis slowlyobliquelysubductingbeneaththeCaribbeanplateatthePuertoRicoTrench(DeMetsetal.2000).Geodeticdata andmodelingshowtheCaribbeanplatemovingeast-northeastrelativetotheNorthAmericanplateatarateof15–20mm/yr(Calaisetal.2016).TothesouthofPuertoRico,theMuertosTrough(alsocalledtheMuertosThrust)acts asthesouthernboundaryofthePuertoRico-VirginIslandsmicroplate.Mostoftheseismicityintheregionisattributedto highlyobliquesubductionoftheNorthAmericanplatebeneaththeCaribbeanplateandtheinteractionsofseveralmicroplatesthataredistributingdeformationwithinthisboundaryzone(Figure 1a).
ThePRVIregionhasalonghistoricalseismicityrecord(400+ years)thatincludesatleastadozenmajorearthquakes ( magnitude7+).Figure 1 showsthelocationsof M ≥ 6earthquakesinthePRVIregion,includingseveneventswith reporteddamaginggroundshakinginPuertoRicoand/ortheU.S.VirginIslandsin1615,1690,1787,1842,1867,1918, and1946(McCannetal.2010; PuertoRicoSeismicNetwork(PRSN)2025; tenBrinketal.2011,andrefertoTableES-2for asummaryoftheseevents).The1867and1918eventsalsoproducedtsunamis(Landeretal.2002).TheJanuary7,2020, M 6.4mainshock(Vi ˇ ci ˇ cetal.2022),partofthe2019–2020SouthwestPuertoRicoearthquakesequence,isanexampleofa strongcontemporaryeventintheregionthatcausedsubstantialdamage.
3 | Methodology
Weperformedalong-termtime-independentprobabilisticseismichazardanalysis(PSHA)forPRVI,whichupdatesthe firstUSGSNSHMfortheregionthatwasreleasedin2003(Muelleretal.2003, 2010).ThisPSHAfollowsstandardmethodology(e.g., Bakeretal.2021; Cornell1968; KramerandStewart2024; McGuire2004; Reiter1990),whichconsiderstwo maininputs,anERFmodelandaGMCmodel,tocalculateprobabilisticseismichazardgroundmotions.Belowwe provideanoverviewofthedata,methods,andmodelsthatcomprisethesetwomaininputstothePSHAforthe 2025PRVINSHM.
3.1 | EarthquakeRuptureForecastModel
AnERFmodel(alsocalledaseismicsourcemodelorseismicsourcecharacterizationmodel)givestheprobabilityofall expecteddamagingeventsfrommodeledseismicsourcesinaregionoveraspecifiedtimeperiod(e.g.,50years).Forthe 2025PRVINSHM,theERFmodelincludesactivecrustalandsubductioninterfacefaultsources,aswellasactivecrustal, subductioninterface,andsubductionintraslabbackgroundgriddedseismicitysources.Theprocessusedtodevelopthe ERFmodelforthe2025PRVINSHMgenerallyfollowedthesamemethodologyusedinthe2023NSHMforthewestern UnitedStates(WUS)(Fieldetal.2023; MilnerandField2023).Figure 2 showstheregioninwhichseismicsourceswere consideredforthisstudy.Allactivecrustalsourcesandsubductionintraslabsourceswereconsideredoutto300kmfrom asiteatwhichseismichazardiscalculated,andallsubductioninterfacesourceswereconsideredoutto1000km.Sources











FIGURE1 | PuertoRicoandtheU.S.VirginIslands(PRVI)region.(a)PRVIsitwithinoneofseveralmicroplatesthatcomprisethe complextectonicplateboundarybetweentheNorthAmericanplatetothenorthandtheCaribbeanplatetothesouth.TheNorthAmerican plateisobliquelysubductingbeneaththeCaribbeanplate,withtheCaribbeanplatemovingeast-northeastrelativetoNorthAmericaatarate of15–20mm/yr(Calaisetal.2016),asindicatedbytheblackarrow.Themicroplatesareboundedbytwosubductionzones:thePuertoRico TrenchtothenorthandtheMuertosTroughtothesouth.Thesesubductionzonesareshownassolidblacklineswithtrianglesindicatingthe directionofsubduction.Thefilled “sawteeth” indicatethePuertoRicoTrenchisamorematuresubductionzone.Theunfilledsawteeth indicatetheMuertosTroughisalessmaturesubductionzonewithsomeuncertaintyonitsoriginandactivity.Locationsofmicroplates (indicatedbydashedbrownlines)arefrom Benfordetal.(2012).Momentmagnitude(M) ≥ 6earthquakesfromtheseismicitycatalog developedforthisstudy(Llenosetal.2025)areshownasblackoutlinedcircles,scaledbymagnitude.Seveneventswithreporteddamaging groundshakinginPuertoRicoand/ortheU.S.VirginIslandsin1615,1690,1787,1842,1867,1918,and1946arehighlightedinredand discussedinthetext(McCannetal.2010; PuertoRicoSeismicNetwork(PRSN)2025; tenBrinketal.2011).Theorangepolygondefinesthe areaofresponsibilityofthePuertoRicoSeismicNetwork.Theredpolygondefineswhereseismichazardiscalculatedforthisstudyand definestheboundingboxofFigure 1b.(b)EnlargedviewoftheregionshowingPuertoRicoandthethreeU.S.VirginIslandsofSt.Thomas, St.John,andSt.Croix.Sixselectedtestsites,shownbysolidblacksquares,indicatewherehazardresultsaredescribedinthetext. B.V.I. = BritishVirginIslands;NSHM = NationalSeismicHazardModel;U.S.V.I. = U.S.VirginIslands.

FIGURE2 | Seismicsourcesconsideredforthisstudy.(a)Activecrustalfaultsources(fault-sectionsshownassolidblacklinesand fault-zonepolygonsshownasblackoutlinedpolygonswithblackpolkadots),subductioninterfacefaultsources(graypolygonswith thingreenandorangesubpolygonsdefinethePuertoRicoTrench[Caribbean]andMuertosTrough[Muertos],respectively),subductioninterfacebackgroundgriddedseismicitysources(thickgreenandorangepolygonsdefinethePuertoRicoTrenchandMuertos Trough,respectively),subductionintraslabbackgroundgriddedseismicitysources(greenandorangefilledpolygonsdefinethePuerto RicoTrenchandMuertosTrough,respectively),andtheactivecrustalbackgroundgriddedseismicitysource,whichencompassesboth thegreenandorangefilledpolygons.S1andS2areSeptentrionalfaultsections,B1–B8areBuncefaultsections,andB-Misthe Bouillante-Montserratfaultsection.NorthernHispaniola(NH),PR1–PR6,andLesserAntilles(LA)arethefaultsectionpolygonsthat makeupthelargefaultmodelforthePuertoRicoTrenchandMT1–MT3arethefaultsectionpolygonsthatmakeupthesinglefault modelfortheMuertosTrough.Theredpolygondefineswhereseismichazardiscalculatedforthisstudyanddefinestheboundingbox ofFigure 2b.(b)EnlargedviewofPRVIandtheimmediateseismicsourcesincludedinthemodel.FZ = faultzone;GSPRF = Great SouthernPuertoRicoFault;SW = southwest.
beyondthesedistancelimitsareunlikelytocontrolhazardgiventhepresenceofmoreimmediatesources.Thedistance limitsoftheGMMsalsoreducetheirapplicabilityatlargedistances,whichwillbediscussedlater.
3.1.1 | ActiveCrustalFaultandDeformationModels
ThompsonJobeetal.(2024a) compiledthreegeologicdatabasesthatincludesourceinformation(geometry,faultingparameters,seismogenicdepth,andactivityrate)forallonshoreandoffshorefaultsourceslocatedwithinthePRVIstudyregion basedonasetofselectioncriteriausedinrecentNSHMs(Hatemetal.2021, 2022; ThompsonJobeetal.2022a, 2022b).All knownQuaternaryactivecrustalfaults(2.58Matopresent)withalengthgreaterthan7km(asfull-faultruptureoffault sectionsshorterthanthisareunlikelytohaveaminimummagnitude(Mmin)reach M 6.5,whichisafeatureinthefault model)documentedinpubliclyavailable,peer-reviewedpublicationswereincludedinthedatabases.Thisresultedin35 faultsectionsand6fault-zonepolygons(regionsthathaveknownQuaternaryactivecrustalfaulting,butwheretheexact geometryofthefault[s]is[are]poorlyconstrained)thatwereadoptedforthe2025PRVINSHMactivecrustalfault model. ThompsonJobeetal.(2024b) alsoconsidered14additionalactivecrustalfaultsources,butthesesourceswere excludedduetonotmeetingalltheselectioncriteria;specifically,thecriteriarequiringpubliclyavailable,peer-reviewed documentation.Concernsduringthetechnicalreviewprocesswereraisedabouttheactivecrustalfaultmodelpotentially missingsomeactivecrustalfaultsourcesduetotheirexclusionbasedonlackofpubliclyavailable,peer-revieweddocumentation.Wearguethatseismicityassociatedwithanypotentiallymissingactivecrustalfaultsismodeledaspartofthe backgroundgriddedseismicitymodel.DiscussionrelatedtothistopiccanbefoundintheERFReviewPanelReportand Addendum(Jordanetal.2026)andtheNSHMP-SCReviewReport(Stewartetal.2026).
Only2ofthe35faultsectionshavepublishedslipratesthatcanbeusedtoinformfaultactivityrates(i.e.,Septentrional1and Bouillante-Montserrat,refertoFigure 2a).Therefore,categoricalslipratebins(<0.5mm/yr,0.5–1mm/yr,1–5mm/yr, and >5mm/yr,withamaxsliprateof7.5mm/yr)wereassignedtothefaultsourceswithoutslipratesbasedon geomorphicexpression,inferredordirectlydatedoffsetdeposits,andmagnitudeoftheoffsetsurface(Thompson Jobeetal.2024b).Tobettermodeltheepistemicuncertaintyonthesebroadslip-ratebins, Hatemetal.(2026) developed asyntheticepistemicuncertaintydistributionfordeformationrateoneachoftheactivecrustalfaults,supplementingthe earthquakegeologydatabaseprovidedby ThompsonJobeetal.(2024a).Forthefault-basedsourcesthatusethecategoricalslip-ratebins,fourdistributionswereselected(uniform,Gaussian,lowtriangular,hightriangular),weight-averaged, andsampledtodetermineuncertaintydistributionsforthesliprateestimates.Forthetwofaultsectionswithpublished sliprates,theSeptentrional1faultsectionusedatriangulardistributiontoestimateitsuncertaintydistribution,butthe Bouillante-Montserratfault-sectionwasassignedaslip-ratebinwithaweighteddistribution(likethefaultsectionswithoutpublishedsliprates)duetoitspoorlyconstrainedestimateduncertainty(Hatemetal.2026).
3.1.2 | SubductionInterfaceFaultandDeformationModels
Twosubductionzonesaremodeledinthe2025PRVINSHM:thePuertoRicoTrenchandtheMuertosTrough.TheUSGS SubductionWorkingGroupdevelopedasubductioninterfacefaultmodelthatincludedgeometryanddeformationcomponentsforbothsubductionzones.ThePuertoRicoTrenchinterfacefaultgeometryisbasedonSlab2(Hayes 2018; Hayesetal.2018),withthedeformationfrontmodifiedfrom GeistandtenBrink(2021).Twoalternativemodels wereproposedtocapturetheuncertaintiesinseismogenicdepthandtheroleoftheBuncefault(Figure 2a).Thelarge faultmodelrupturesfromtheseafloorto50kmdepth,andthesmallfaultmodelrupturesfromtheBuncefaultto40km depth.FortheMuertosTroughinterfacegeometry,theshallowportionwasgeneralizedfromworkdoneby GranjaBruna etal.(2015),whilethedeeperportion(whichislessconstrained)isbasedonSlab2(Hayes2018; Hayesetal.2018)aswell asobservationsfromthe2019–2020SouthwestPuertoRicoearthquakesequence(Cromwelletal.2021; tenBrinketal. 2022; Vi ˇ ci ˇ cetal.2022; Yoonetal.2023).OnlyonefaultmodelisproposedfortheMuertosTroughinwhichruptureoccurs fromtheseafloorto26-kmdepth(Figure 2a).
ConvergenceratesforboththePuertoRicoTrenchandMuertosTroughwereinformedbythegeodeticblockmodel of Symitheetal.(2015),whichincorporatestheconvergenceratesoftheNorthAmericanandCaribbeanplatesandalso considerscounterclockwiserotationofthePuertoRico-VirginIslandsmicroplate.TheUSGSPRVISubductionWorking Groupconsideredwhetherstrainispartitionedontheinterfaceinthetrench-normal(perpendiculartothedirectionofthe trench)orplateconvergence(paralleltothedirectionofthetrench)direction,providingtwoalternativemodels:trenchnormalandfull,respectively.Estimatesforseismiccoupling(measuredbytheratioofseismicsliptototalslip[seismicand aseismic]onafault)weregeneralizedfromgeodeticmodelsby Manakeretal.(2008), tenBrinkandLópez-Venegas (2012), Symitheetal.(2015),and Calaisetal.(2016).Thesemodelsindicatethat:(1)tothewestofPuertoRicotheplates arewell-couplednorthoftheislandofHispaniola;(2)tothenorthofPuertoRicothereisfairlylowcouplingonthePuerto RicoTrenchinterface(1%to51%);and(3)totheeastofPuertoRicotherearesomeminorincreasesincouplingonthe
LesserAntillessectionoftheCaribbeansubductionzone.TheUSGSPRVISubductionWorkingGrouprecommendapplyinganaveragecouplingvalueof1to28%and1%to51%forfaultsectionpolygonsPR2–PR6andPR1,respectively,forthe PuertoRicoTrench(Figure 2a).FortheMuertosTrough,theUSGSPRVISubductionWorkingGroupsuggested50% coupling,asthereisnostrongevidenceofcouplingeitherway,sothisvalueisappliedtothethreefaultsectionpolygons MT1–MT3(Figure 2a).Finally,slipdeficitratesanduncertainties(i.e.,plateconvergencemultipliedbyseismiccoupling) werethencalculated.TheERFReviewPanelnotedconcernsabouttheseismiccouplingmodel,andafewiterationswere madetoreachthefinalmodeladoptedforthe2025PRVINSHM(Jordanetal.2026).Theseismiccouplingmodelincludes verylowvalues,andweacknowledgethatthemodelisveryuncertain,butwebelievethisepistemicuncertaintyhasbeen capturedbytheERFlogictree.
AlthoughtheMuertosTroughhasbeenmodeledasasubductionsourceinsomestudies(Dolanetal.1998; Frankeletal. 2011; LaForgeandMcCann2005),thereisdebateinthescientificcommunityastowhetherthissourceisanactive subductioninterfaceorwhetheritisaactivecrustalretroarcthrust(tenBrinketal.2009).Thereisagreatdealofuncertaintyregardingitssourceactivity,andthelackofobservedlarge,deepearthquakesmakesthedebatearounditssource typechallengingtoresolve.However,bothinterpretations(subductioninterfaceoractivecrustalretroactivethrust)are consistentwithourtreatmentofthesourceasapartiallycoupled,low-anglethrust.AttherequestoftheERFReview Panel,weperformedasensitivitystudywherewemodeledtheMuertosTroughaseitherasubductioninterfacesourceor aactivecrustalsourceandfoundthatwhenmodeledasaactivecrustalsource,hazardwoulddecreaseslightlyinPuerto Rico(generally < 5%),exceptforasmallincreasealongthesoutherncoastofPuertoRicoatsomespectralperiodsdueto thehangingwalltermintheactivecrustalGMMs(Milneretal.2026).WeultimatelydecidedtomodeltheMuertos Troughasasubductioninterfacesourceforconsistencywiththebackgroundgriddedseismicitymodelcomponents butacknowledgetheuncertaintyandongoingdebateaboutthissource.
3.1.3 | BackgroundGriddedSeismicityModel
Historicalseismicityisusedtomodelthelocationsandratesofpotentialfutureearthquakeswhenlocationsareunableto bemodeledbyfaultsectionsorfault-zonepolygonsinthemodelduetoalackofgeologicconstraints.ThisallowstheERF modeltoaccountforoff-faultandsmallernear-faultseismicitythatisnotaccountedfordirectlywithinthefaultmodel. Thismodelingprocessinvolvescompilingaseismicitycatalogforthestudyregion,separatingeventsbytectonicregime intosubcatalogs,declusteringdependentevents(i.e.,removingforeshocksandaftershocks),spatiallysmoothingthesubcatalogs,anddevelopingseismicityratemodels.Weusethegriddedseismicitymethodologyfromthe2023conterminous UnitedStates(CONUS)andAlaskaNSHMs(Llenosetal.2024; Powersetal.2024),whichseparatesthemodelintotwo components:(1)aspatialkernel,orprobabilitydensityfunction(PDF),thatprovidesalong-termforecastoftherelative spatialdistributionofearthquakesintheregionbasedonthedeclusteredcatalog;and(2)thetotalratemodeldefinedbya Gutenberg-Richter b-valueandtherateofearthquakesthatoccuratmagnitudesabovetheMminthatisusedtocompute hazardinthemodelbasedonthefullcatalog.Usingthedeclusteredcatalogtodeterminelong-termspatialdistributions ofearthquakesandthefullcatalogtodetermineratesofearthquakeswasamethodologyintroducedinthe202350-state NSHM(Fieldetal.2023; Petersenetal.2024; Powersetal.2024).Thisisachangefromthe2003PRVINSHMthatused thedeclusteredcatalogtodeterminelong-termspatialdistributionsandratesofearthquakes.Moredetailsaboutthe2025 PRVINSHMgriddedseismicitymodelcanbefoundin Llenosetal.(2025) and MichaelandLlenos(2025)
3.1.3.1 | SeismicityCatalog. Theseismicitycatalogusedforthe2025PRVINSHMwasdevelopedfollowingthesame methodologyusedinpreviousNSHMcatalogs(Mueller2018).Twoinputcatalogswereused:(1)theAdvancedNational SeismicSystemComprehensiveEarthquakeCatalog(ComCat; U.S.GeologicalSurvey(USGS)2017);and(2)arevised catalogfromthePRSN(HuérfanoandLin2022).Inaddition,depthsofafewoldereventsthatwereassignedfixeddepths (defaultdepthsassignedwhentheavailableseismicdataareinsufficienttocalculateareliabledepth)inComCatwere replacedwithdepthsdeterminedby Doseretal.(2005) and RussoandVillase ˜ nor(1995).Theinputcatalogscontaineda mixtureofmagnitudetypes,soeventswithouta M wereconvertedto M usingmagnitudeconversionequations.This includedadurationmagnitude(Md)conversionequationdevelopedbyPRSN(HuérfanoandLin2022)basedonregressionanalysesofeventswithbotha Md magnitudeinthePRSNcataloganda M magnitudeintheComCatcatalog(Llenos etal.2025).Duplicatesandnontectoniceventswereremovedfromeachinputcatalog,andthetwoinputcatalogswere thencombined.WeconsideredthePRSNcatalogtobeauthoritativewithinitsareaofresponsibility(AOR)sincethe PRSNistheauthoritativeseismicnetworkintheregion(Mueller2018).Forsituationswhereduplicateeventswere identifiedwithinthePRSNAORfrombothcatalogs,theeventparametersfromthePRSNcatalogwereused. Parametersforcomputingunbiasedseismicityrateswerealsoincludedaspartofthecombinedcatalogoutput,asthis informationisrequiredforfurtherprocessing,asdiscussedlater.Thefinalfullcatalogcontains81,410 M 2+ eventsfrom September8,1615,throughDecember31,2023(Llenosetal.2025).
3.1.3.2 | CatalogSeparation. Oncethefullcatalogwascompiled,eventswithinthecatalogwereseparatedintosubcatalogsbasedontheirtectonicregimes(Haynie2024; Haynieetal.2025)followingthemethodologyintroducedinthe 2023AlaskaNSHM(Powersetal.2024),withafewmodifications.Slab2(Hayes2018; Hayesetal.2018)subductionzone geometries,aswellasearthquakelocations,depths,andfaultingstyles(i.e.,momenttensors),wereusedtocompute plausibilityscoresthatreflectwhethertheeventsweremorelikelytobelongtoactivecrustal,subductioninterface,subductionintraslab,orouterrisesubcatalogs(similartowhatwasdoneaspartoftheNGA-SubductionProject; Contreras etal.2022).ClassificationsaresensitivetothedepthoftheeventrelativetotheSlab2surface.Fixed-deptheventscomprised51%of M ≥ 6eventsfrom1900to1973and14%of M ≥ 5eventsfrom1973to2023(Milneretal.2026).Therefore, twoadditionalmodificationswereaddedtothesortingprocesstodealwithfixed-deptheventsinthecatalog:(1)probabilisticdepthswereassignedtotheseeventsbasedonnearbyeventswithestimateddepths;and(2)theplausibility scoresthemselveswereincorporatedinlatermodelingstepstoreflectthisadditionalsourceofuncertainty(Haynie etal.2025; Llenosetal.2025).Thefinalfivesubcatalogsincluded:(1)activecrustal;(2)Caribbeaninterface;(3) Muertosinterface;(4)Caribbeanintraslab;and(5)Muertosintraslab.
Thelimitednumberofouterriseeventsthatfelloutsidethegeometryofthetwosubductionzonesweremergedintothe subductionintraslabsubcatalogs.WhiletheNGA-SubductionGMMs(Bozorgniaetal.2022)werenotdesignedtobeused withouterriseevents,wedidnotobserveanymeaningfultrendsduringaresidualanalysisoftheseeventswiththeNGASubductionintraslabGMMs(Aagaardetal.2026).Wealsoinvestigatedthepossibleneedforanouterrisesourcezone,to thenorthofthePuertoRicoTrench,assuggestedby Weietal.(2024).However,weperformedasensitivitystudyand determinedthatourbackgroundgriddedseismicitymodelsaccountedforthesepotentialearthquakes,andthereforea separatesourcewasnotneeded.
3.1.3.3 | DeclusteringandSmoothing.
Wedeclusteredeachsubcatalogforthefivetectonicregimestoremove dependentevents,asthisallowedustodeterminealong-termestimateofearthquakelocationsthatisnotbiasedby short-termforeshocksoraftershocks.Weusedthesamedeclusteringmethodsasthe2023CONUSand2023Alaska NSHMs(Llenosetal.2024; Powersetal.2024),whichincludedthewindow-based(GardnerandKnopoff1974; GK74),link-based(Reasenberg1985;R85),andstochasticnearest-neighbor(ZaliapinandBen-Zion2020;NN) methods.TheGK74andR85methodsusedefaultspace-timeparameterstoidentifyandremovedependentevents. FortheNNmethod,earthquakesareprobabilisticallyseparatedintodependentandindependenteventsbasedona bimodaldistributionofnearestneighborspace-timedistances.Thisresultsinmultiplerealizationsofadeclusteredcatalog.Hereweused500realizationsofdeclusteredcatalogsthatwereeachgriddedandspatiallysmoothedseparatelyand thenaveragedtogethertogetameanNNspatialdistribution.Moreinformationonthisprocesscanbefoundin Llenos etal.(2025).
Tospatiallysmootheachdeclusteredcatalog,wepreviouslycountedthenumberofearthquakesineachgridcellto estimatethespatialdistributionofeventsineachgridandsmoothedtheearthquakecounts(Llenosetal.2024). However,theuseofplausibilityscoresallowsoneearthquaketocontributefractionallytomultipletectonicregimes. Wethereforesummeduptheplausibilityscoresthateacheventcontributedtoaparticulargridcellandsmoothed thegriddedfractionalcounts.Thesmoothingmethodsusedarethesameasthoseinthe2023CONUSand2023 AlaskaNSHMs(Llenosetal.2024; Powersetal.2024),bothofwhichinvolvetwo-dimensionalisotropicGaussiansmoothing,andareasfollows:(1)fixedsmoothing(Frankeletal.1996),whichusesaconstantcorrelationlengthof50km (equivalenttoasmoothingdistanceof34km);and(2)adaptivesmoothing(Helmstetteretal.2007; Moschetti2015), whichusessmoothingdistancesthatvarywitheachearthquakeandareequaltothedistancetoits Nthnearestneighbor. Weoptimizedthe N valueforeachdeclusteredandsmoothedsubcatalog.Wenormalizedeachsmoothedgridbythe numberofeventsineachgrid,creatingaspatialPDFforeachdeclustering/smoothingmethodpair.ThespatialPDFs weredevelopedusingeventsfrom1986to2023.EventdetectionisspatiallyvariableacrosstheentirePRVIregion,with smallermagnitudesmorecompletelydetectedwithinthePRSNAOR.Tocounteractthisspatialvariabilitywhiletaking advantageofthehigherresolutionprovidedbysmallermagnitudeevents,weappliedascalingfactortothespatialPDFs withinthePRSNAORtoensuretheratiosof M 4+ to M 5+ eventswerethesamebothinsideandoutsidethePRSNAOR. Weusedlog-likelihoodtestswithatestingcatalogof M 5+ eventspriorto1986tocomparespatialforecastsderivedfrom multipleoptionsofmagnitudethresholds(M 3+ to M 4.5+)andscaledversusunscaledPDFs.Basedonthesetests,the preferredmodelwasthe M 4+ scaledmodel.Referto Llenosetal.(2025) formoredetails.
3.1.3.4 | RateModel. Ratemodeldevelopment,whichismorefullydescribedin MichaelandLlenos(2025),began withanalyzingthefullseismicitycatalog.UsingthefullcatalogasaPoissonprocessisvalidforthelowprobabilitiesof exceedance(e.g.,2%in50year)ofprimaryinterestforbuildingcodes,asdiscussedintheIntroductionsection.Two
distinctbreaksinmagnitudeandeventdetectionwereobservedinthecatalog:(1)1973whentheNationalEarthquake InformationCentercatalogbegan;and(2)1986whenthePRSNcatalogbegan.Thefirststepwastocalculatea b-valuefor thefullcatalog,butbeginninginthemiddleof2004themagnitude-frequencydistribution(MFD)isnonlinear,withan excessofeventswith M < 4.5,particularlywithinthePRSNAOR.Thisresultedinahigh b-valuethatdidnotaccurately predicttheobservednumberoflargermagnitudeeventsduetotheexcessofsmallerearthquakes.Whenlookingatthe fullcatalogfrom1900to2023andamagnitudeofcompleteness(Mc) = 6.0,wecalculateda b-valueof0.97 ± 0.12,whichis abettermatchwiththelargermagnitudeeventsintheregion.BecauseofthisbettermatchwiththerateoflargerearthquakesandthelackofaphysicalreasontoexpectabilinearMFD,weusedthis b-valueasthemeanofanormaldistributionforthenextsteps.
Thesecondstepwastocomputethejointdistributionof b-valueandrate.Weselectedthedataassociatedwithatectonic regime(activecrustal,interface,orintraslab)andanepoch(1900to1973with Mc = 6or1973–2023with Mc = 5).Foreach epoch,weusedaMonteCarloprocesstocomputeajointdistributionwith100,000samples.Foreachsample,weuseda b-valuedrawnfromthenormaldistributioninstep1andthenperturbedtheeventmagnitudesusinganormaldistribution(toincluderandomuncertaintyintheeventmagnitudes).Wealsoperturbedthe Mc withaone-sidednormaldistributionwithastandarddeviationof0.2(perturbed Mc ≥ Mc).Foreventswithperturbedmagnitudes > perturbed Mc,we randomlyselectedearthquakesproportionaltotheirplausabilityscoreforthattectinicclassificationandsummedtheir N* values(acountingmetricthathelpstoaccountforcatalogincompleteness, U.S.DepartmentofEnergy,ElectricPower ResearchInstitute,andU.S.NuclearRegulatoryCommission2012).Foragivensumof N*,werandomlyselectedarate perepochfor M ≥ Mc perturbedbasedonthePoissonlikelihood.Wethenextrapolatedtheratefromtheperturbed Mc to M1 (where M1 = 5istheMminusedtocalculatehazard)usingthe b-valueandscaledtotherateperyear.Thisresultedin 100,000sampleswith b-valueandrateofeventswith M ≥ M1 peryear.Thedistributionsof b-valueandrateforthetwo epochswereaveragedwithweightsproportionaltothedurationsoftheepochs.Wechosethreeratebranchesbasedon themeanand ±2sigmaratesoftheaveragejointdistribution.Thismethodworkedverywelltodescribethejointdistributioninthe2023CONUSand2023AlaskaNSHMs(MichaelandLlenos2025),butnotaswellinPRVI,wherethe branchesexceededtherangeofthejointdistributionathighermagnitudes.Tominimizethisdiscrepancy,weusedalternativehighandlowbranchessothattheymatchthejointdistributionatM1 (griddedseismicityMmin)andmaximum magnitude(Mmax).Asimplehazardsensitivityshowedthatthechoiceofbranchesdidnotsignificantlyimpactmean hazardbutwillimpacthazardpercentiles.Moredetailedinformationisprovidedin MichaelandLlenos(2025).
ThethirdandfinalstepwastomultiplythespatialPDFbytheratemodeltoproducethefullbackgroundgriddedseismicitymodelinwhichbothindependenteventsfromthedeclusteredcatalogsanddependenteventsinthefullcatalog havethesamespatialdistribution.
3.1.4
| ERFImplementation
Thesourcesdescribedabovewereimplementedusingthe OpenSHA PSHAsoftware(Fieldetal.2003).Thefollowing sectionsprovideageneraloverviewoftheERFmodelimplementation,includingtheinversionmethodology(Milnerand Field2023)appliedtoactivecrustalandsubductioninterfacefaultsourcesinthe2025PRVINSHM.TheERFmodel implementationispresentedingreaterdetailin Milneretal.(2026)
3.1.4.1
| ActiveCrustalSources.
Foractivecrustalfaultsources,weusedthesameinversionmethodology(Milner andField2023)andasimilarlogictreeasusedforactivecrustalfaultsourcesinthe2023NSHMfortheWUS(Fieldetal. 2023).Theinversionmethodologyinvolvesbreakingfaultsectionsintoshorter,equal-lengthsubsections(approximately halfaslongasthedown-dipwidthforactivecrustalfaults)andthendeterminingasetofplausibleruptures,including multifaultrupturessubjecttophysicalcompatibilitycriteria(Milneretal.2022)andsegmentationconstraints(Milner andField2023).Ruptureratesaredeterminedthroughasimulatedannealinginversionconstrainedtofitfaultsliprates andvariousassumptions(expressedonanepistemiclogictree)onfaultconnectivityandon-faultGutenberg-Richter b-value(MilnerandField2023).Thelogictreeforactivecrustalfaultsourcesinthe2025PRVINSHMisshownin Figure 3a.Thebranchesandweightsinthelogictreearethesameasthoseusedinthe2023NSHMfortheWUSactive crustalfaultsources(Fieldetal.2023)withtwoexceptions:(1)the b-valuebranch(whichwassimplifiedfrom5to3 values);and(2)thegeologicdeformationbranch.Unlikeinthe2023NSHMfortheWUSwhenwehadasuiteofgeologic deformationmodels(Fieldetal.2023),the2025PRVINSHMlacksalternativemodels.Therefore,werandomlysampled slipratesforeachofthefaultsfromthegeologicallyestimateddistribution(asdiscussedaboveintheActiveCrustalFault andDeformationModelssection)toprovideadditionalepistemicuncertainty(Hatemetal.2026).Wealsointroduced newtreatmentforproxyfaults,whichareusedtorepresentthefault-zonepolygonsourcesintheinversion.Theoriginal
FIGURE3 | Logictreesforthe(a)activecrustalfaultsources,(b)activecrustalbackgroundgriddedseismicitysource,(c)subduction interfacefaultsources,and(d)subductioninterfaceandintraslabbackgroundgriddedseismicitysources.A = area;CSD = constantstress drop;GK = GardnerandKnopoff(1974);L = length;Mmax = maximummagnitude;NN = nearest-neighbor(ZaliapinandBen-Zion 2020);Reasenberg = Reasenberg(1985);Sqrt-Len = square-rootoflength;W = width;Width-Lmtd = width-limited.
proxyfaultswereprovidedby ThompsonJobeetal.(2024a) andrepresentasingle,representativestructuregenerally goingthroughthecenterofthefault-zonepolygon.Wethenspreadthoseproxyfaultsacrossthefault-zonepolygontofill itinamannerlikethestrictboundarycasefrom Bommeretal.(2023),exceptthatourvirtualrupturesfollowthestrikeof theoriginalproxyfaultandfault-zonepolygonratherthanusingrandomorientations(Milneretal.2026).Becausethese proxyfaultsaresimplifiedsurfacesandnotintendedtorepresentindividualknownfaultgeometries(likeafaultsection source),theyarenotallowedtoparticipateinmultifaultruptures,andtheyuseataperedtargetMFDtoapproximatethe segmentationpenaltiesappliedtoexplicitlymodeledfaults(Milneretal.2026).Themagnituderangeconsideredoneach activecrustalfaultdependsonthe M-Ascalingrelationshipchoice,thegeometryofthefault,andconnectivitywithother nearbyfaults.Inaggregate,Mminis M 5.5andMmaxis M 7.8acrossthefullsetofactivecrustalfaultsourcesbasedon theaveragescalingrelationshipsfrom Shaw(2023)
Fortheactivecrustalbackgroundgriddedseismicitysource,weusedthesamemethodologyandlogictreeinthe2025 PRVINSHMaswasusedfortheactivecrustalgriddedseismicitysourceinthe2023NSHMfortheWUS(Fieldetal.2023). Thelogictreefortheactivecrustalbackgroundgriddedseismicitysourceinthe2025PRVINSHMisshowninFigure 3b Theonlychangesmadeforthe2025PRVINSHMwereto:(1)addanewratemodelepochbranch(threealternatives,all equallyweighted);(2)revisethemethodologyfordetermininglowandhighregionalseismicityratesasdescribedinthe RateModelsection;and(3)theweightsonthesmoothingkernelbranch(weusedequalweightforthetwosmoothing methodsaswehadnoinformationonwhetheronemethodworksbetterthantheotherinthePRVIregion).Therate balancingbetweentheactivecrustalfaultsandactiveactivecrustalbackgroundgriddedseismicitysourcewasalso disabled(Milneretal.2026).Fortheactivecrustalbackgroundgriddedseismicitysource,Mminis M 5andMmax isrepresentedasalogictreebranch(off-faultMmax)withvalues(andweights)of M 7.3(0.1), M 7.6(0.8),or M 7.9(0.1).Ratesoflargeeventsinthissourcearecarved-outnearmodeledactivecrustalfaultstoavoiddouble-counting. Moredetailedinformationisprovidedin Milneretal.(2026)
3.1.4.2 | SubductionSources. Liketheactivecrustalfaultsources,weusedtheinversionmethodologyof Milnerand Field(2023) todetermineasetofplausiblerupturesandratesforthesubductioninterfacefaultsources.Thisisthefirst timewehaveusedasubductionsourceinversionmethodologyinaNSHM,followingtheprecedentofthe2022New
ZealandNSHM,whichwasthefirsttousetheinversionmethodologytomodelsubductioninterfacefaults(Gerstenberger etal.2023).Thelogictreeforsubductioninterfacefaultsourcesinthe2025PRVINSHMisshowninFigure 3c.The interfacefaultgeometryanddeformationmodel,representedbythefaultmodel,coupling,andslippartitioningbranches inthelogictree,werediscussedaboveintheSubductionInterfaceFaultandDeformationModelssection.The b-value branchisthesameasforactivecrustalfaults.Asdiscussedin Milneretal.(2026),duetothelargedown-dipwidthsand along-strikevariations,theinterfacefaultsectionsweresplitintosmallersubsections(30kmlength),butinsteadofthese subsectionsbeinghalfaslongasthedown-dipwidthliketheactivecrustalfaults,werequiredthatrupturesbeatleast2/3 longasthedown-dipwidth(Figure 2a).Mminforinterfaceruptureswascalculatedusingtheaverageofthe Shaw(2023) M-Ascalingrelationships.Mminisvariablealongstrikeasafunctionoftrenchwidthandtheaspectratioconstraint. Therefore,forthePuertoRicoTrench,Mminisbetween M 7.5(twosubsections)and M 8.4(fivesubsections)forthelarge faultmodeland M 7.5(twosubsection)and M 8.1(fivesubsection)forthesmallfaultmodel.SincetheMuertosTrough hasonlyonefaultmodel,Mministhesameforboththelargeandsmallfaultmodelandrangesfrom M 7.6to M 8.0, dependingonthewidth.Rupturesbelowthesemagnitudesareincludedintheinterfacebackgroundgriddedseismicity model.RuptureareasassociatedwithMmaxrepresentthefull-trenchruptureofeachsubductioninterfacemodel.Mmax is M 9.1forthePuertoRicoTrenchlargefaultmodeland M 9.0forthesmallfaultmodel.SincetheMuertosTroughhas onlyonefaultmodel,Mmaxis M 8.7forboththelargeandsmallfaultmodel,usingtheaverageofthe Shaw(2023) M-A scalingrelationships(Milneretal.2026).
Forsubductionbackgroundgriddedseismicitysources(interfaceandintraslab),thelogictree(Figure 3d)issimilartothe activecrustalbackgroundgriddedseismicitylogictree(Figure 3b),exceptthatthereare:(1)separatebranchesforthe PuertoRicoTrench(calledtheCaribbeanTrenchinthelogictree)andMuertosTroughseismicityrates;and(2)thereisa subductionintraslabMmaxbranch.Mminis M 5forbothinterfaceandintraslabbackgroundgriddedseismicitysources. Asdiscussedin Milneretal.(2026),forinterfacebackgroundgriddedseismicitysources,Mmaxvariesspatiallytobeset justbelowtheinterfacefaultsinversionMmin(whichvarieswithtrench-width)andrangedfrom M 7.4to M 8.3.For intraslabbackgroundgriddedseismicitysources,wehavetwoalternativesforMmax(M 7.5and M 8.0)withequal weight.Thisisachangefromthe2003PRVINSHMinwhichoneMmax(M 7.2)wasused,buta2007large (M 7.4)intraslabeventintheregioninvalidatedtheoldvalueof M 7.2(Milneretal.2026).Takingthe M 7.4event intoaccount,andconsideringtheuncertaintyofMmaxinthisregion,wedecidedonalogictreewith M 7.5and M 8.0.AnMmaxof M 8.0isconsistentwithintraslabsourcesusedinotherUSGSNSHMs(Petersenetal. 2024; Powersetal.2024).Inourimplementation,theinterfaceandintraslabbackgroundgriddedseismicitysourcerate brancheswithineachsubductionzonewereassumedtobecorrelated,butthesubductionzonesthemselves(PuertoRico TrenchandMuertosTrough)werenot(Milneretal.2026).Theinterfacerupturesarerepresentedasdippingsquaresand aregenerallycenteredhorizontallyaroundthegridcellthattheyrepresent,exceptforthecasewherecenteringwould haveextendedtheruptureup-ordown-dipbeyondtheinterfacebackgroundgriddedseismicitypolygons(Figure 2a).In thatcase,theruptureswereassumedtonucleateatthegridcentercellbutremainconfinedwithinthedown-dipextents oftheinterface(i.e.,strictboundary).Additionally,theinterfaceseismicityregions(Figure 2a)aretrimmedtoonlyconsidergridnodeswithdepths ≤ 50kmfromtheSlab2model(Hayes2018; Hayesetal.2018),withtheintraslabrupturesare treatedaspointsourcesconstrainedatSlab2depths.Moredetailedinformationisprovidedin Milneretal.(2026)
3.2 | Ground-MotionCharacterizationModel
TheGMCmodeldefinestheprobabilitydistributionofgroundmotionsthatcouldoccurataspecificsite,consideringthe rangeofsourceparametersintheERFmodel,propagationpaths,andsitecharacteristics.Forthe2025PRVINSHM,the GMCmodeldevelopmentincluded:(1)evaluationandadjustmentofpubliclyavailable,peerreviewedGMMsusing groundmotiondatafromaPRVIdataset(Aagaardetal.2025, 2026);(2)comparisonandselectionofGMMs (Withersetal.2026);(3)combiningmedianGMMsinscaled-backbonemodelsthatcaptureepistemicuncertainty (Moschettietal.2026);and(4)developmentofindependentaleatoryvariabilitymodelsfromexistingmodelsandfrom regionalground-motiondata(Moschetti2026).ThedetailsoftheGMCmodeldescribedbelowarepresentedingreater detailin Moschettietal.(2026)
TheGMCmodelusedGMMsapplicablefortherelevanttectonicregionsofPRVI(i.e.,activecrustalandsubduction interfaceandintraslab)andcombinedthemusingknowledgeandapproachesthathavebeenrecognizedanddeveloped sincethe2003PRVINSHM.Animportantcontributiontothe2025PRVINSHMistheincorporationofmodernGMMs, whichare:(1)developedfromlargerdatasets;(2)usemorerecentregressionmethods;(3)areconditionedonmorerecent parameterizationsoftheseismicsource,source-to-sitepaths,andsiteconditions;and(4)provideintensitymetrictypes (e.g.,PGA,peakvelocity,andSAsforarangeofoscillatorperiods)requiredforcurrentbuildingcodes,comparedtowhat 12of43
wasusedinthe2003PRVINSHM.TheupdatedGMCmodelincludesGMMsfromtheNGA-West2(Bozorgniaetal.2014) andNGA-SubductionProjects(Bozorgniaetal.2022),alongwithPRVIregionallyadjustedGMMs(Aagaardetal.2026).
Epistemicuncertaintyofthemediangroundmotionsdescribestheuncertaintyingroundmotionthatarisesfromlackof knowledgeorinformation;forexample,thesparsityofrecordsoflarge-magnitudeearthquakesatclosedistancesleadsto higheruncertaintyintheground-motionforecast.Asdescribedin Moschettietal.(2026),forthe2025PRVINSHM,ourgoal wastorepresenttherangeofallpossiblemodels(ratherthantherangeofavailablemodels)andforthebranchesofthelogic treetobemutuallyexclusive(i.e.,eachbranchisadistinctscenario).Thisallowedformoreaccurateandtransparent weightingofalternativemodels.WeimplementedmedianGMCmodeluncertaintythroughascaledbackbonemodel, wherethebackbonemodelwasdevelopedbyweightingcombinationsofsemi-empiricalGMMs.MultipleinputGMMs wereusedforeachtectonicregionandcombinedwithadditionalaleatoryvariabilitytocapturetheepistemicuncertainty inforecastedgroundmotions.WeusedelementsoftheNGA-EastProject(Gouletetal.2021),whichrepresentedmean groundmotionsthroughacontinuous,multivariatenormaldistribution,todefineepistemicuncertaintyandincorporatethe resultinguncertaintiesthroughmagnitude-anddistance-dependentscalingfactorsinthebackbonemodels.
AsecondarygoaloftheGMCmodeldevelopmentwastouseindependentaleatoryvariabilitymodels(alsocalledthe standarddeviationorsigma),whichrepresenttheunmodeledandnaturalvariabilityofgroundmotions.Variancein groundmotions(σ 2 )canbebrokenintocontributionsfrombetween-event(τ 2 )andwithin-eventvariability(ϕ2 ). Thewithin-eventvariabilitycanbefurtherbrokendownintosite-to-site(ϕ2 S2S )andsingle-sitevariability(ϕ2 SS ). PreviousNSHMupdatesusingmultimodelepistemicuncertaintyhavemadeuseofthealeatoryvariabilitymodelsof eachGMM(Petersenetal.2014, 2015, 2020, 2022, 2024; Powersetal.2024).Forthe2025PRVINSHM,wedeveloped independentaleatoryvariabilitymodelsthatwereappliedtoallmediangroundmotions.Thebenefitofthisapproachisa moretransparentselectionoffeaturesandtrendsinthealeatoryvariabilitymodels.Weusedexistingmodelsandmodelingapproachestocomputethecomponentsofaleatoryvariability,allowingfordirectincorporationofobservationsfrom regionaldata.Referto Moschetti(2026) formoredetails.
3.2.1 | EvaluationandSelectionofGround-MotionModels
WhenevaluatingandselectingGMMs,wewanttoselectmodelsthatarenotonlyappropriatefortheregion’ssourcetectonics(e.g.,activecrustal,stablecrustal,subductioninterfaceorintraslab,volcanic)butalsoperformwellwhenground motiondatafromtheregionarecomparedtotheGMM.ThereareveryfewGMMsthathavebeendevelopedspecificallyfor thePRVIregion;therefore,weneededtoconsidermodelsdevelopedforsimilartectonicregions,evaluatehowthosemodels performwhencomparedtoPRVI-specificdata,andthenmodifythosemodels,ifnecessary.TheNSHMPalsohasspecific GMMselectioncriteria(Petersenetal.2014; Rezaeianetal.2021)thatensurethatselectedGMMsareconsistentwith currentscientificunderstandinganddataavailabilityaswellasfitcriteriarelatedtocalculatingvariousNSHMendproducts (e.g.,GMMsmustproducemedianvaluesforPGAand0.01-to10.0-sSAaswellasbevalidforall VS30 siteconditionsusedin theNSHMs).InthecaseofPRVI,weevaluatedtheNGA-West2GMMs(Bozorgniaetal.2014)foractivecrustalsourcesand theglobalversionsoftheNGA-SubductionGMMs(Bozorgniaetal.2022)forsubductioninterfaceandintraslabsources. WhileotheractivecrustalandsubductionGMMsareavailable,theNGAsuitesofGMMsare:(1)formulatedinasemiempiricalmannerthatkeeptrendsfromsimulationsandfundamentalphysicalprinciples;(2)thoroughlyvettedinternally byNGAteammembers,peer-reviewed,andpubliclyavailable;and(3)arethemostrecentlypublishedGMMswidelyused inotherPSHAstudiesintheregion(Frankeletal.2011; Johnsonetal.2024; Salgado-Gálvezetal.2023; TorpeyZimmerman etal.2022).WealsoevaluatedfouradditionalGMMsdevelopedforactivecrustalregionsandtwoGMMsdeveloped specificallyforPuertoRico,asdiscussedbelow.
3.2.1.1 | ActiveCrustalGround-MotionModels. TheGMMsevaluatedforactivecrustalearthquakesincluded fouractivecrustalGMMsfromtheNGA-West2Project(Bozorgniaetal.2014),whichhavebeenusedforearthquakes inactivecrustalregionsintheNSHMssincethe2014NSHM(Petersenetal.2014, 2015).Alsoincludedforevaluation werefouralternativeGMMsdevelopedforactivecrustalregions(Akkaretal.2014; Bindietal.2014; Cauzzietal. 2015; Kothaetal.2020)andtwoGMMsdevelopedusingregionaldataforPuertoRico(ClarosGómez, 2022; MotazedianandAtkinson2005).Inaddition,wedevelopedandevaluatedPRVI-adjustedversionsofthefour NGA-West2GMMs,whichadjustedtheabsolutegroundmotionlevelandslopeofthelinear VS30-scalingterm (Aagaardetal.2026).WecalltheseGMMs “data-adjusted,” whiletheoriginalfourNGA-West2GMMs(Bozorgnia etal.2014)arecalled “as-provided” Withersetal.(2026) comparedthese14GMMstoassessvariationsinamplitudes, spectralshapes,magnitude,anddistancescaling.TheNGA-West2as-provided(Bozorgniaetal.2014)andNGA-West2 data-adjusted(Aagaardetal.2026)GMMswereultimatelyselectedforuseintheGMCmodeldevelopment,asthedataadjustedGMMshavereducedmisfitsandbetterreproduce VS30 trends,buttheas-providedGMMsconsideraglobal
ground-motiondatasetthathaslargermagnitudeevents,whichthePRVIground-motiondatasetislacking(Moschetti etal.2026).The Akkaretal.(2014), Bindietal.(2014),and Kothaetal.(2020) GMMswerenotincludedduetothe absenceoflongerperiodsrequiredbytheNSHMPGMMselectioncriteria(Petersenetal.2014; Rezaeianetal. 2021).The Cauzzietal.(2015) GMMwasexcludedbecauseitfellwithintherangeofmedianGMMsfromthe NGA-West2GMMs(bothasprovidedanddataadjusted)andthereforewasalreadybeingaccountedforwithintheepistemicuncertaintyoftheselectedGMMs.ThePuertoRico-specificGMMfrom ClarosGómez(2022) wasexcludeddueto poormagnitudescalingforeventswith M > 6.5(ourGMMselectioncriteriarequiresactivecrustalGMMstobevalidor reasonablyextractedoutto M 8.2),andtheGMMfrom MotazedianandAtkinson(2005) wasexcludedduetopoordatafit atlargedistances(>80km)andbecauseofmorerecentguidanceby AtkinsonandMotazedian(2013).TheGMMsconsideredforevaluation,includingthosethatwereultimatelyselected,arelistedinTable 1.ThefinalsetofselectedGMMs wereusedforallactivecrustalsourcesintheERFmodeloutto300km.Thisdistancelimitwasimposedbasedonthe applicabilityoftheselectedGMMs.
TABLE1 | Medianground-motionmodelsconsideredforthe2025PuertoRicoandtheU.S.VirginIslandsNationalSeismic HazardModelground-motioncharacterizationmodeldevelopment.NGA = Nextgenerationattenuation.
Inputground-motionmodelCategory/RegionBackbonemodel Activecrustal
Abrahamsonetal.2014
NGA-West2As-provided Booreetal.2014 NGA-West2
CampbellandBozorgnia2014 NGA-West2
ChiouandYoungs2014
Abrahamsonetal.2014
NGA-West2
NGA-West2Data-adjusted Booreetal.2014
CampbellandBozorgnia2014
ChiouandYoungs2014
NGA-West2
NGA-West2
NGA-West2
Akkaretal.2014 EuropeandtheMiddleEastNotselected Bindietal.2014 Pan-EuropeanNotselected Cauzzietal.2015 GlobalNotselected Kothaetal.2020 EuropeNotselected ClarosGómez(2022) PuertoRicoNotselected MotazedianandAtkinson(2005) PuertoRicoNotselected
Subductioninterface
AbrahamsonandGülerce(2022)
NGA-SubductionGlobalAs-provided Parkeretal.(2022) NGA-SubductionGlobal
Kuehnetal.(2023)
AbrahamsonandGülerce(2022)
NGA-SubductionGlobal
NGA-SubductionGlobalData-adjusted Parkeretal.(2022) NGA-SubductionGlobal
Kuehnetal.(2023) NGA-SubductionGlobal
SubductionIntraslab
AbrahamsonandGülerce(2022)
NGA-SubductionGlobalAs-provided Parkeretal.(2022) NGA-SubductionGlobal Kuehnetal.(2023) NGA-SubductionGlobal
AbrahamsonandGülerce(2022)
NGA-SubductionGlobalData-adjusted Parkeretal.(2022) NGA-SubductionGlobal Kuehnetal.(2023)
NGA-SubductionGlobal
AfterselectingthetwosetsofNGA-West2GMMs(as-providedanddata-adjusted),wedevelopedtwobackbonemodels (Figure 4a);onebackbonemodelwascomputedfromthefourequallyweighted(0.25)as-providedNGA-West2GMMs (Bozorgniaetal.2014),andonebackbonemodelwascomputedfromthefourequallyweighted(0.25)data-adjustedNGAWest2GMMsdevelopedby Aagaardetal.(2026).Bothbackbonemodelswereassignedequalweight(0.5)becauseeven thoughthedata-adjustedmisfitwaslower,thisdataset(Aagaardetal.2025)lacksmanylarge-magnitudegroundmotions presentinthedatasetusedtodeveloptheas-providedGMMs(Anchetaetal.2014).
WhenassessingepistemicuncertaintyforactivecrustalGMMs,wefollowedtheproceduredescribedabove.Onlythefour as-providedNGA-West2GMMs(Bozorgniaetal.2014)wereusedasinput,however,asmodificationsmadetothedataadjustedGMMs(Aagaardetal.2026)resultedinabsoluteamplitudesoftheGMMsthataffectedthecorrelationstructure oftheGMMs(i.e.,howtheintensitymeasuresarerelatedtoeachotheratdifferentlocations).Thetargetvariancemodel selected(Rezaeianetal.2014)isonethathasbeenusedforactivecrustalregionsintheNSHMssincethe2014NSHM (Petersenetal.2014, 2015).Thismodelaccountsfordatalimitationsandprovidesaperiod-independentsetofvaluesfor threemagnitudebinsanddistancebins(Moschettietal.2026).Figure 4e showstheepistemicuncertaintymodelforactive crustalGMMsinthe2025PRVINSHM.
TodevelopthealeatoryvariabilitymodelforactivecrustalGMMs,wefollowedtheproceduredescribedaboveandwere alsoguidedbythemethodologyusedfortheNGA-EastProject(AlAtik2015).Becausetheground-motiondatasetdevelopedforthePRVIregion(Aagaardetal.2025)haslimitedwell-constrainedmetadataandtherearequestionsaboutsome eventmagnitudes,wedecidedtodevelopindependentaleatoryvariabilitymodelsfromexistingmodelsanddatasetsand onlydevelopmodelsfromthePRVI-specificdatasetsifsignificantregionaleffectswereidentified.Ground-motionvariabilityofthebetween-(τ )andwithin-event(ϕ)termsfromPRVIwaslargerthanwhatwasobservedintheNGA-West2 dataset(Anchetaetal.2014)andwhatwaspredictedbytheas-providedNGA-West2GMMs(Bozorgniaetal.2014).The τ modelwasdevelopedfromtheas-providedNGA-West2GMMs(Bozorgniaetal.2014),usingafive-segmentanalytical functionfromNGA-East(AlAtik2015).Weidentifiedamagnitude-dependanceofthePRVIsingle-stationwithin-event variability(ϕ2 SS )valuesthatwereverysimilartothoseweobservedintheNGA-West2dataset(Anchetaetal.2014),sowe estimatedthisparameterusingtheNGA-West2datasetandthemagnitude-dependentfunctionalformfromNGA-East (AlAtik2015).Estimatesofsite-to-sitewithin-eventvariability(ϕ2 S2S )fromthePRVIdatasetidentifiedgreatersite-to-site variabilityintheregionthanweobservedintheNGA-West2dataset(Anchetaetal.2014),sowedevelopedseparate modelsof ϕ2 S2S fromthesetwodatasets.Moreinformationisprovidedin Moschetti(2026).Figure 4d showsthealeatory variabilitymodelforactivecrustalGMMs.
ThelogictreeforactivecrustalGMMsusedinthe2025PRVINSHMisshowninFigure 5a.Asdiscussedabove,two backbonemodelswereused(developedfromtheNGA-West2as-provided(Bozorgniaetal.2014)anddata-adjusted GMMs(Aagaardetal.2026)),bothwithequalweight(0.5).Theweightsontheepistemicuncertaintybranchofthe logictreecamefrom KeeferandBodily(1983) andwereusedinthe202350-stateNSHM(Moschettietal.2024). Foraleatoryvariability,eachlogictreebranchreceivedequalweight(0.5)andvariedonlyintheir ϕ2 S2S components. AcomparisonoftheweightedmeansofmedianGMMsandaleatoryvariabilitymodelsusedinthe2025and2003 PRVINSHMsforactivecrustalearthquakesisshowninFigure 4a,d,respectively.
3.2.1.2 | SubductionGround-MotionModels. TheselectionofGMMsforsubductionearthquakes(interfaceand intraslab)followedthesamemethodsasforactivecrustalearthquakesdescribedabove.TheGMMsevaluatedforsubductionearthquakesincludedglobalversionsoftheGMMsfromtheNGA-SubductionProject(Bozorgniaetal.2022), whichhavebeenusedrecentlyinNSHMsforsubductionearthquakesintheWUSandAlaska(Petersenetal. 2024; Powersetal.2024).Likewiththeas-providedNGA-West2activecrustalGMMs(Bozorgniaetal. 2014), Aagaardetal.(2026) identifiedmisfitsintheas-providedNGA-SubductionGMMs(Bozorgniaetal.2022)when comparingthemwithPRVIdataandcomputedadjustmentstotheabsoluteamplitudesandlinear VS30-scalingmodelsto developdata-adjustedGMMs. Withersetal.(2026) comparedthesesixsubductioninterfaceandsixsubductionintraslab GMMstoassessvariationsinamplitudes,spectralshapes,andmagnitudeanddistancescaling.TheNGA-Subductionasprovided(Bozorgniaetal.2022)anddata-adjusted(Aagaardetal.2026)GMMswereselectedforuseintheGMCmodel development(refertoTable 1).ThefinalsetofselectedinterfaceGMMswereusedforallinterfacesourcesintheERF modeloutto1000km.The AbrahamsonandGülerce(2022) GMMforinterfaceearthquakesisvalidoutto500kmbut wasextrapolatedto1000kmasrequiredbyourGMMselectioncriteria(Petersenetal.2014; Rezaeianetal.2021).Ground motionsinthe AbrahamsonandGülerce(2022) GMMarealsolowatlargedistances,andwefavoredconsistencywiththe setofinterfaceGMMsusedinthe2023NSHMforCONUSfortheCascadiasubductionzonesource(Petersenetal.2024). ThefinalsetofselectedintraslabGMMswereusedforallsubductionintraslabsourcesintheERFmodeloutto300km. The AbrahamsonandGülerce(2022) GMMforintraslabearthquakesisvalidoutto500km,whilethe Kuehnetal.(2023)
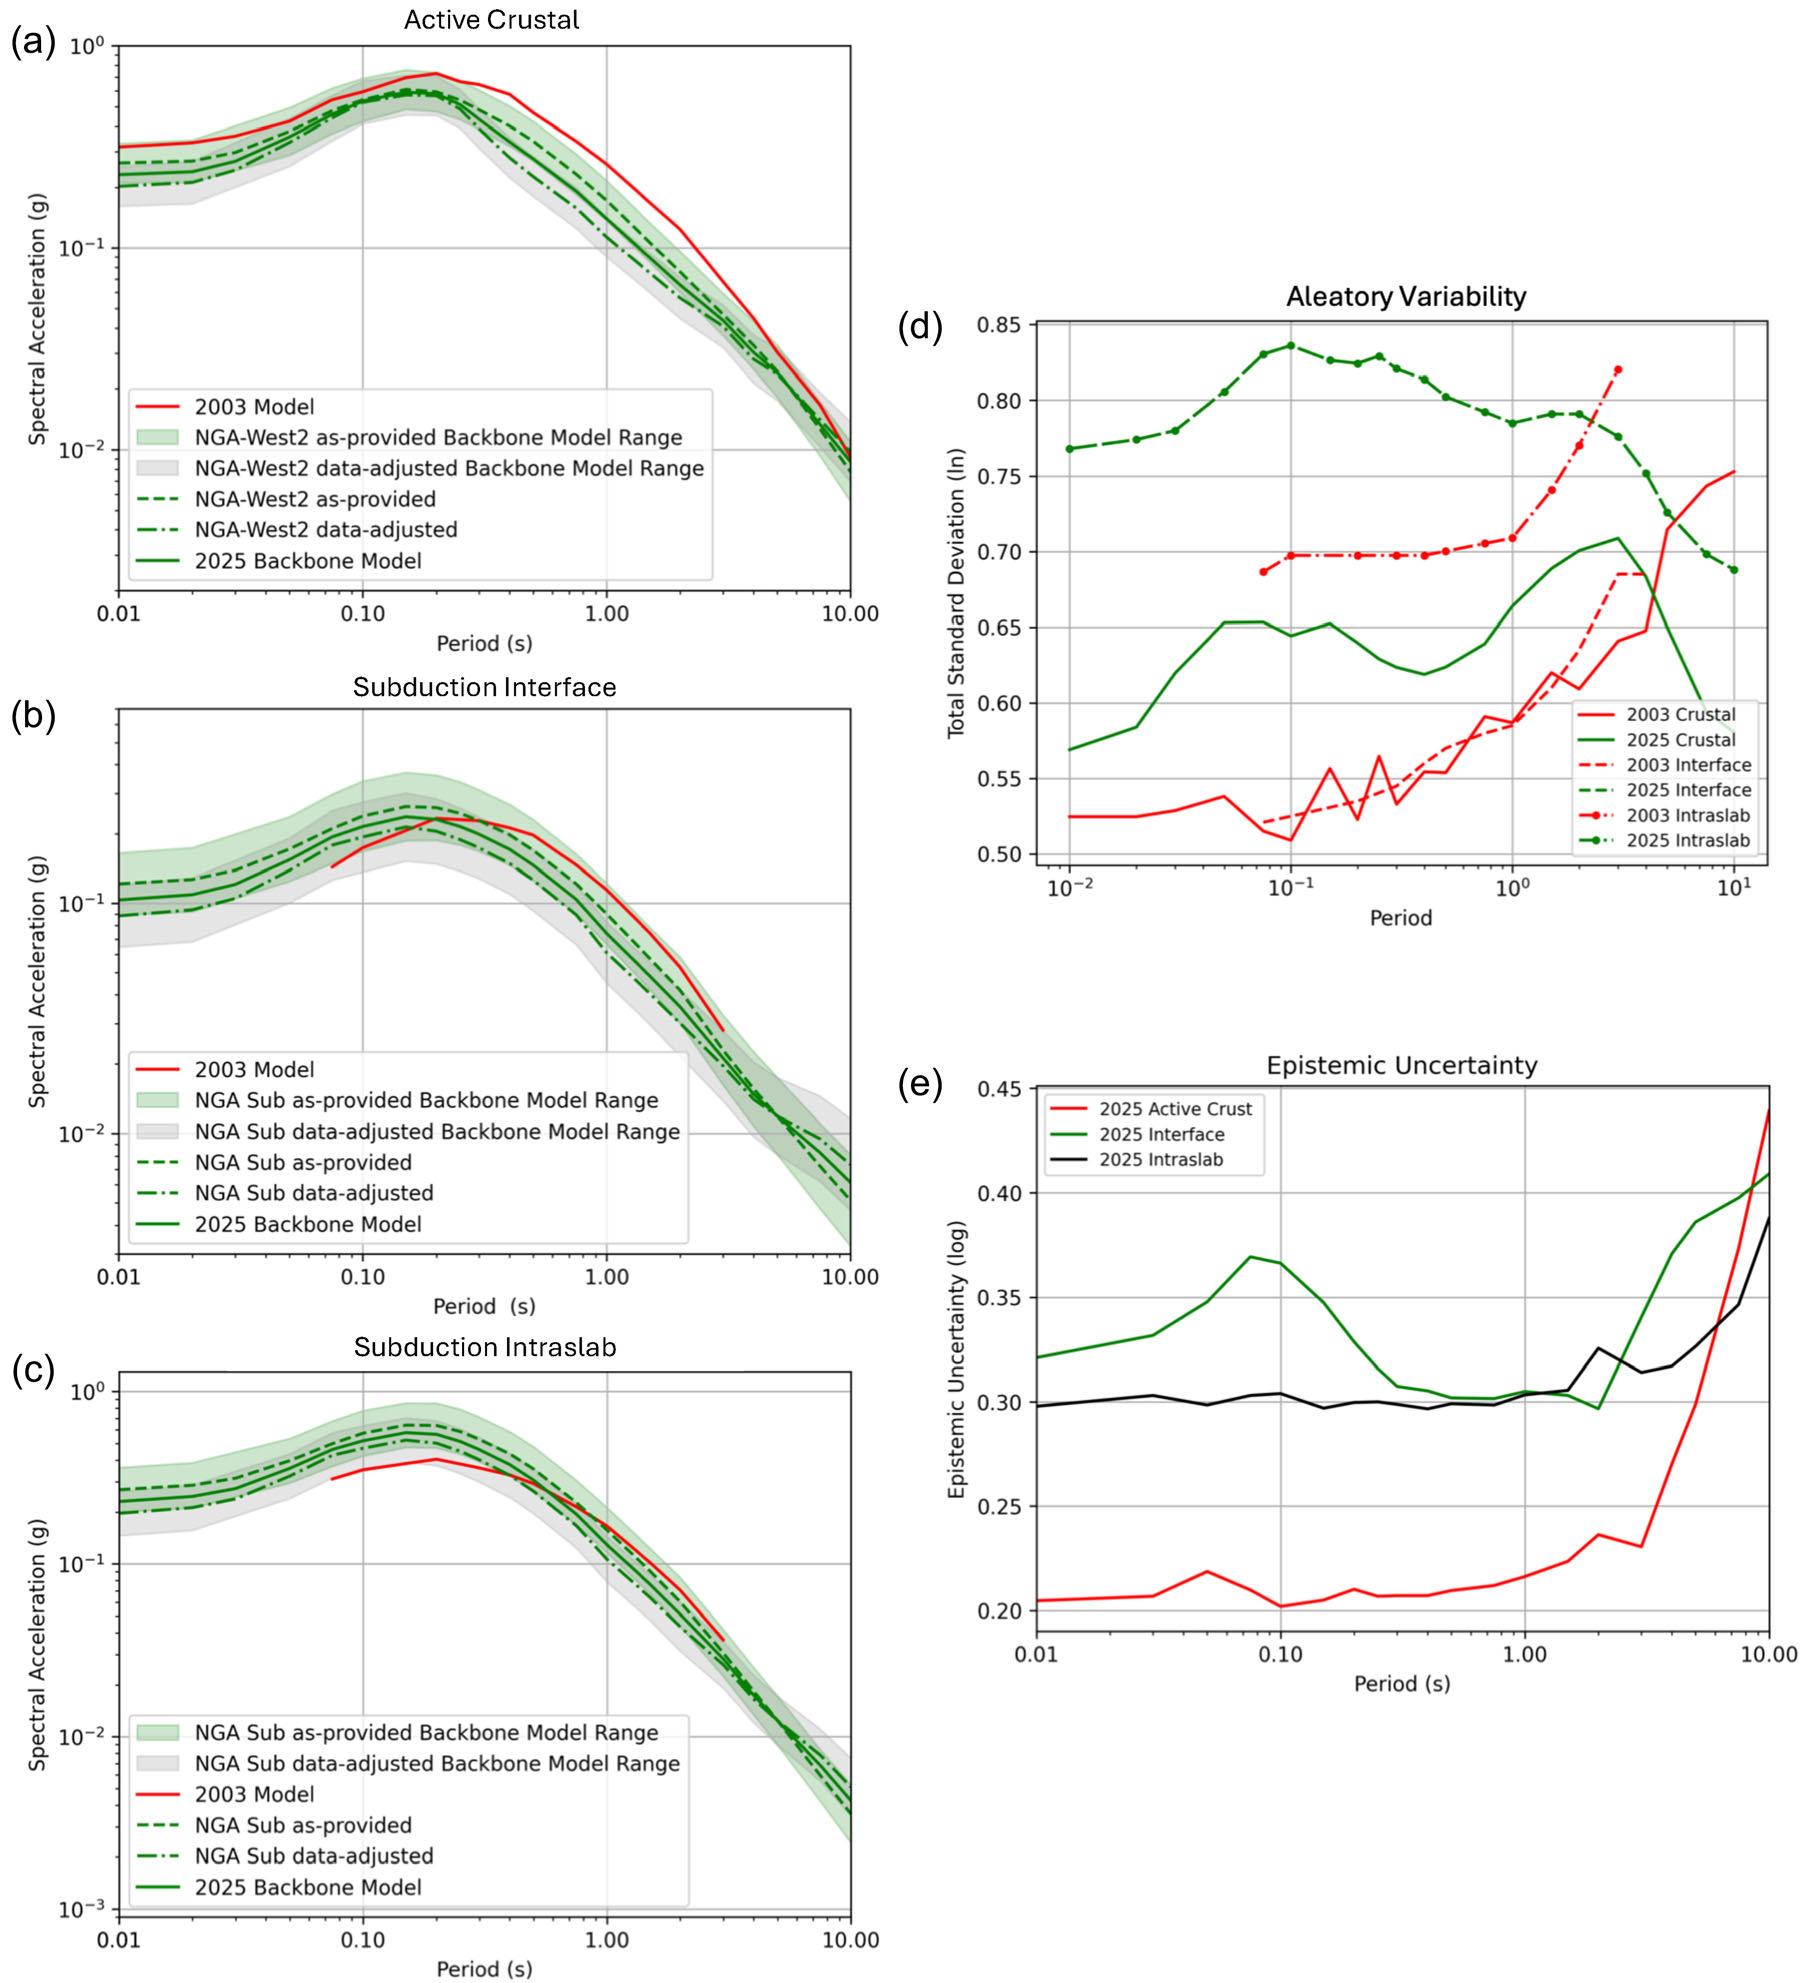
FIGURE4 | Comparisonofmedianspectralacceleration(SA;g)versusperiod(s)betweenthe2025PuertoRicoandU.S.Virgin Islands(PRVI)NationalSeismicHazardModel(NSHM)weightedmeanmedianbackbonemodels(greenlines)andthe2003PRVI weightedmeanmedianground-motionmodels(GMMs;redlines)forthreeearthquaketypes:(a)activecrust,(b)subductioninterface, and(c)subductionintraslab.Therangeofepistemicuncertaintyfortheas-providedbackbonemodelisshownwithgreenshadingandthe rangeofepistemicuncertaintyforthedata-adjustedbackbonemodelisshownwithgrayshading.Panel(d)showsthetotalaleatory variability(i.e.,standarddeviationorsigma)asafunctionofperiodforthe2025PRVINSHM(greenlines)comparedwiththe2003 PRVINSHM(redlines)acrossthethreeearthquaketypes.Panel(e)presentstheperiod-dependentepistemicuncertaintyforthethree earthquaketypesinthe2025PRVINSHM,withcurvesrepresentingtheaverageoftheupperandlowerbranches.GMMparametersfor eventsthatdominatehazardforeachearthquaketype,forpanels(d,e),aresettothoseusedinpanels(a–c).GMMparametersforactive crustalearthquakesaremomentmagnitude(M) = 7,closestdistancetorupture(RRUP) = 10km,rake = 180°,width = 20km,dip = 90°, thetime-averagedshear-wavevelocityintheupper30m(VS30) = 760m/s,depthtotopofrupture(ZTOR) = 0.5km,depthtoashear-wave velocityof1km/s(Z1.0) = 41m,anddepthtoashear-wavevelocityof2.5km/s(Z2.5) = 0.6km.GMMparametersforsubductioninterface earthquakesare M = 8, RRUP = 75km,rake = 90°,width = 20km,dip = 30°, VS30 = 760m/s, ZTOR = 10km, Z1.0 = 41m,and Z2.5 = 0.6km. GMMparametersforsubductionintraslabearthquakesare M = 7.5, RRUP = 75km,rake = 90°,width = 20km,dip = 30°, VS30 = 760m/s, ZTOR = 40km, Z1.0 = 41m, Z2.5 = 0.6km,andhypocentraldistance(RHYPO) = 75km.NGA = NextGenerationAttenuation;NGA-(Sub) ductionas-providedGMMs(Bozorgniaetal.2022);NGA-West2as-providedGMMs(Bozorgniaetal.2014).
FIGURE5 | Ground-motionlogictreeforearthquakesin(a)activecrustaland(b,c)subductionregions(interfaceandintraslab) implementedinthe2025PRVINationalSeismicHazardModel.NGA = Nextgenerationattenuation;WUS = westernU.S.
and Parkeretal.(2022) GMMsarevalidoutto1000km;however,wefavoredconsistencywiththeintraslabsource distancelimitusedinthe2023NSHMforCONUSfortheCascadiasubductionzone(i.e.,300km, Petersenetal. 2024).ThisdistancelimitmaybereevaluatedinfutureNSHMs.
AswiththeactivecrustalGMMs,wechosetousethetwosetsofNGA-SubductionGMMs(as-provided[Bozorgniaetal. 2022]anddata-adjusted[Aagaardetal.2026])asalternativemodelsintheGMCmodeldevelopment,andwedidthisby developingtwobackbonemodelsforbothinterfaceandintraslabearthquakes(Figure 4b,c).Onebackbonemodelwas computedfromtheequallyweighted(0.333)as-providedNGA-SubductionGMMs(Bozorgniaetal.2022),andonebackbonemodelwascomputedfromtheequallyweighted(0.333)data-adjustedNGA-SubductionGMMsof Aagaardetal. (2026).Bothbackbonemodelswereassignedequalweight(0.5).
Toassessepistemicuncertaintyforsubductionearthquakes,wefollowedtheproceduredescribedabove.Aswithactive crustalGMMs,onlytheas-providedNGA-SubductionGMMs(Bozorgniaetal.2022)wereusedasinput,asmodifications madetothedata-adjustedGMMsresultedinabsoluteamplitudesoftheGMMsthataffectedthecorrelationstructureof theGMMs.Thetargetvariancemodelselectedwasaperiod-independentmodelforthetargetuncertaintiesforsubductionzoneearthquakes.Moreinformationisprovidedin Moschettietal.(2026).Figure 4e showstheepistemicuncertainty modelforsubductionGMMsinthe2025PRVINSHM.
Todevelopthealeatoryvariabilitymodelforsubductionearthquakes,wefollowedtheproceduredescribedabovethat wasalsousedforactivecrustalearthquakes.Ground-motionvariabilityfromsubductionearthquakesinthePRVIspecificground-motiondataset(Aagaardetal.2025)wasanalyzedandcomparedtoexistingNGA-Subduction GMMs(Bozorgniaetal.2022).LiketheNGA-SubductionProject(Bozorgniaetal.2022),wecombinedground-motion residualsfrombothinterfaceandintraslabearthquakeswhenanalyzingvariabilitybecausethereareveryfew M > 5 interfaceevents,whichlimitedourabilitytodevelopaseparatemodelforinterfaceandintraslab.Wechosetomodel τ usingtheNGA-Subductionmodels(Bozorgniaetal.2022)evaluatedatadistance,magnitude,and VS30 valuethatdonot producenonlineareffects,andthemeanofthethreeestimatesof τ fromtheNGA-SubductionGMMsiscomputedateach periodforalltheGMMs.Two ϕ modelsweredeveloped,onethatmodelstheaveragetrendoftheNGA-Subduction GMMs(Bozorgniaetal.2022)andonethatincorporatedelevatedsite-to-sitevariabilityobservedinthePRVI ground-motiondataset(Aagaardetal.2025).Moreinformationisprovidedin Moschetti(2026).Figure 4d showsthe aleatoryvariabilitymodelforsubductionGMMsinthe2025PRVINSHM.
ThelogictreesforsubductionGMMs(interfaceandintraslab)usedinthe2025PRVINSHMareshowninFigure 5b,c.As discussedabove,twosetsofbackbonemodels(oneforinterfaceandoneforintraslab)consistingoftheNGA-Subduction as-provided(Bozorgniaetal.2022)anddata-adjusted(Aagaardetal.2026)GMMswereused,bothwithequalweight (0.5).Theweightsontheepistemicuncertaintybranchofthelogictreecamefrom KeeferandBodily(1983) andwereused inthe202350-stateNSHM(Moschettietal.2024).Foraleatoryvariability,eachlogictreebranchgotequalweight(0.5) andvariedonlyintheir ϕ2 S2S components.AcomparisonoftheweightedmeansofmedianGMMsandaleatoryvariability modelsusedinthe2025and2003PRVINSHMsforsubductionearthquakesisshowninFigure 4a,c,d,respectively.
3.2.2 | Near-SurfaceGeologicStructure
TosupporttheGMCmodeldevelopmentforPRVI,weassessednear-surfacegeologicstructuresbasedonavailabledatasetsthatincludedgeologicmaps,sedimentthickness,welldata,and VS30 profiles(Herricketal.2024).Thisinformation helpedtodetermineiftheremightbeareasofdeepsedimentsintheregionthatcouldneedspecialtreatmentinthe seismichazardmodel.Forexample,pastNSHMshaveaccountedfordeepsedimentarybasins(hundredsoreventhousandsofmetersdeep)bymodelingpossiblelong-periodamplificationofgroundmotionthatcouldincreaserisktolongperiod(≥1-sSA)structuresliketallbuildingsandlongbridges(Petersenetal.2020, 2024).Ouranalysisoftheavailable datasetsledustoconcludethat 15%ofPRVImayhavepotentialbasins,butwedidnotfindevidenceofdeep,unconsolidatedsediments.Onlythreesiteshaddepthsgreaterthan100m,withthegreatestdepthbeing459mintheareaof ToaBaja, 20kmwestofSanJuan,PuertoRico(Herricketal.2024).However,theavailabledatasetswerelimited,not onlyinnumber,butalsointheareasinwhichtheyprovideddata.Therefore,furtherinvestigationsintonear-surface geologicstructureinthePRVIregioncouldleadtospecialtreatmentofspecificregionsinapotentialfutureNSHM.We foundthatrecent VS30 measurements(from137sites, VS30 valuesfrom113to1694m/s[Lindbergetal.2025; McPhillips etal.2020])aregenerallyconsistentwithpredictionsfromthe WaldandAllen(2007) globalmodelthatpredictsmean VS30 conditionalontopographicslope.Asaconsequence,weusedthismodelwhencalculatingriskproducts(e.g.,Chance ofDamagingShakingmapavailablein Shumwayetal.2025).Thoseperformingsite-specificstudiesmaywanttoconsider measuring VS30 toaccountforlocalsiteconditions,orifthesiteconditionsrequireit,measure VS todepthsthatare sufficienttoperformsiteresponseanalyses.
4 | HazardResults,Comparisons,andDiscussion
The2025PRVINSHMwasimplementedandruninthePSHAsoftwarecodes OpenSHA (Fieldetal.2003)and nshmp-haz (Powersetal.2022a, 2022b, 2026).TheERFmodelwasimplementedin,andepistemicuncertaintycalculationswererun in, OpenSHA (Milneretal.2026).Thefullmodel(bothERFandGMCmodels)wasimplementedin,andmeanhazard calculationswererunin, nshmp-haz (Powersetal.2022a, 2022b, 2026).Long-termtime-independentmeanhazardcalculationswereperformedona0.01°by0.01°gridforallpointsinthestudyregion(definedby 68.0°– 64.5°Wlongitude and17.5°–19.0°Nlatitude)forPGAand21spectralperiodsfrom0.1-to10.0-sSAwitha5%-dampedresponse,foreight NEHRPsiteconditionsrangingfrom VS30 = 150to1500m/s,and2%,5%,and10%in50-yearPE(returnperiodsof2475, 975,and475years,respectively).Inaddition,epistemicuncertainty,intheformofselectedpercentiles,wascalculatedfor asuiteof86testsitesaswellasforacoarsergrid(0.025°by0.025°)ofallpointsinthestudyregionforlimitedperiods,site conditions,andPEs.Thefullsuiteofresultscanbefoundin Shumwayetal.(2025).Results,includingmeanhazard, epistemicuncertainty,andcomparisonswiththe2003PRVINSHM,areshownanddiscussedbelowforselectedperiods, siteconditions,andprobabilitiesofexceedance.
4.1 | 2025PuertoRicoandtheU.S.VirginIslandsNationalSeismicHazardModel
4.1.1 | MeanUniformHazardGround-MotionMaps
For0.2-,1.0-,and5.0-sSA,NEHRPsiteclassBC(VS30 = 760m/s),and2%in50-yearPE,meanhazardishighestin westernPuertoRico(upto1.97,0.42,and0.05gfor0.2-,1.0-,and5.0-sSA,respectively)andlowestinthecentralpart ofPuertoRico(1.10,0.25,and0.03gfor0.2-,1.0-,and5.0-sSA,respectively)(Figure 6a–c).Toputthisintoperspective,the 0.2-sSA,NEHRPsiteclassBC(VS30 = 760m/s),2%in50-yearPEgroundmotionforMayagüez,PuertoRico,is1.69g (Table 2)whichissimilartothe0.2-sSA,NEHRPsiteclassBC(VS30 = 760m/s),2%in50-yearPEgroundmotionforSalt LakeCity,Utah(1.65g;Table 1 of Petersenetal.2024).The0.2-sSA,NEHRPsiteclassBC(VS30 = 760m/s),2%in50-year PEgroundmotionforSanJuan,PuertoRicois1.15g(Table 2)whichissimilartothe0.2-sSA,NEHRPsiteclassBC (VS30 = 760m/s),2%in50-yearPEgroundmotionforPortland,Oregon(1.19g;Table 1 of Petersenetal.2024).The0.2-s SA,NEHRPsiteclassBC(VS30 = 760m/s),2%in50-yearPEgroundmotionforCharlotteAmalie,U.S.VirginIslands,is 1.48g(Table 2)whichisidenticaltothe0.2-sSA,NEHRPsiteclassBC(VS30 = 760m/s),2%in50-yearPEsgroundmotion forCharleston,SouthCarolina(1.48g;Table 1 of Petersenetal.2024).For0.2,1.0,and5.0-sSA,NEHRPsiteclassBC (VS30 = 760m/s),and10%in50-yearPE,meanhazardisalsohighestonthewesternsideofPuertoRico(upto0.95,0.20, and0.03gfor0.2-,1.0-,and5.0-sSA,respectively)(Figure 7a–c).However,at0.2-sSA,hazardislowestinthecentralpart ofPuertoRico(0.52g)(Figure 7a)whileat1.0-and5.0-sSA,hazardislowestontheU.S.VirginIslandofSt.Croix(0.12 and0.01g,respectively)(Figure 7b,c).
FIGURE6 | MeanuniformhazardgroundmotionmapsforPRVIbasedonthe2025PRVINSHM.MapsshowSAwitha2%PEin 50yearsat(a)0.2-s,(b)1.0-s,and(c)5.0-sforNationalEarthquakeHazardsReductionProgramsiteclassBC(VS30 = 760m/s).Six selectedtestsiteswherehazardresultsaredescribedinthetextareshownassolidblacksquares.Groundmotionhazardcontoursare shownwiththingraylines.Minimum(Min)andmaximum(Max)values(onland)arelistedandlabeledforreaderconvenience.
4.1.2 | MeanHazardCurvesandDisaggregations
Meanhazardcurvesforeachsourcetype,alongwithtotalmeanhazardcurves(sumofmeanhazardcurvesforeach sourcetype),areplottedinFigure 8 forthreeselectedtestsites(Mayagüez,PuertoRico,SanJuan,PuertoRico,and Christiansted,U.S.VirginIslands)for0.2-(a–c)and1.0-sSA(d–f),andNEHRPsiteclassBC(VS30 = 760m/s).For
TABLE2 | Comparisonofmeanuniformhazardgroundmotions,differences,andratiosbetweenthe2025and2003PuertoRicoand theU.S.VirginIslands(PRVI)NationalSeismicHazardModels(NSHMs)atsixselectedtestsites.Valuesarefor0.2-and1.0-sspectral acceleration,2%and10%in50-yearprobabilitiesofexceedance(PE),andforNationalEarthquakeHazardsReductionProgramsiteclass BC(VS30 = 760m/s).Lat = latitude,andLon = longitude.Difference = 2025PRVINSHM–2003PRVINSHM,andRatio = 2025PRVI NSHM/2003PRVINSHM.DifferenceandRatiocolumnsindicateanincreaseinhazardwithredtext;decreaseinhazardinbluetext; andnochangeinhazardwithblacktext,whencomparingthechangeinhazardbetweenthe2025and2003PRVINSHMs.
Testsite Lat, °N Lon, °W
Arecibo,Puerto
0.2-sSpectralacceleration (g)
1.0-sSpectralacceleration (
*Differenceandratiovalueslistedinthetablecanbeslightlydifferentthancomputedresultsduetonumericalrounding.
thesamethreeselectedtestsites,disaggregationsofthe2%in50-yearPEgroundmotionfor0.2-and1.0-sSAwith NEHRPsiteclassBC(VS30 = 760m/s)areshowninFigure 9.
Asshowninboththehazardcurves(Figure 8)anddisaggregations(Figure 9),atMayagüez,PuertoRico,for0.2-sand 1.0-sSA(Figure 8a,d andFigure 9a,d),thebackgroundgriddedseismicitysourcesmakingthelargestcontributiontothe
FIGURE7 | MeanuniformhazardgroundmotionmapsforPRVIbasedonthe2025PRVINSHM.MapsshowSAwitha10%PEin 50yearsat(a)0.2-,(b)1.0-,and(c)5.0-sforNationalEarthquakeHazardsReductionProgramsiteclassBC(VS30 = 760m/s).Sixselected testsiteswherehazardresultsaredescribedinthetextareshownassolidblacksquares.Groundmotionhazardareshownwiththin graylines.Minimum(Min)andmaximum(Max)values(onland)arelistedandlabeledforreaderconvenience.
2%in50-yearPEtotalmeanhazardareactivecrustal(44%for0.2-sand32%for1.0-sSA)andintraslab(24%for0.2-sand 24%for1.0-sSA).Activecrustalfaultsourcesalsohavealargecontributionatthissite(23%for0.2-sand32%for1.0-sSA), asthereareafewfaultsectionsandfault-zonepolygonslocatedwithin20kmofthesite(MayagüezBay,CerroGoden, DesecheoRidge,andSouthLajas;Figure 2b).Interfacefaultsourceshavealowcontribution(8%for0.2-sand13%for
FIGURE8 | Totalmean(blacklines)andsource-type hazardcurves(activecrustalfaults = redlines,activecrustalbackgroundgridded seismicity = cyanlines,interfacefaults = purplelines,interfacebackgroundgriddedseismicity = dashedpurplelines,andintraslabbackgroundgriddedseismicity = greenlines)calculatedforthe2025PRVIandU.S.VirginIslandsNSHMforthreeselectedtestsites, Mayagüez,PuertoRico,SanJuan,PuertoRico,and Christiansted,U.S.VirginIslands,for(a–c)0.2-and(d–f)1.0-sSAandNational EarthquakeHazardsReductionProgramsiteclassBC(VS30 = 760m/s).The2%and10%in50-yearPEhorizonsareplottedashorizontal graylinesforreference.
1.0-sSA),asthetwointerfacefaultsources,MuertosTroughandPuertoRicoTrench(Figure 2a),are 30to 90km away,respectively.Interfacebackgroundgriddedseismicitysourceshavethelowestcontribution(<1%for0.2-sand1% for1.0-sSA).AtSanJuan,PuertoRico,for0.2-sand1.0-sSA,thebackgroundgriddedseismicitysourcesmakingthe largestcontributiontothe2%in50-yearPEtotalmeanhazardareintraslab(53%for0.2-sand43%for1.0-sSA)andactive crustal(32%for0.2-sand28%for1.0-sSA)(Figure 8b,e andFigure 9b,e).Interfacefaults(11%at0.2-sand21%at1.0-sSA) andinterfacebackgroundgriddedseismicitysources(4%at0.2-sSAand7%at1.0-sSA)arethenexthighestcontributor, asthePuertoRicoTrenchandMuertosTroughareboth 60kmandgreaterawayfromthesite.Activecrustalfault sourcescontributelessthan1%at0.2-and1.0-sSA,astherearenoactivecrustalfaultsourceswithin 50kmofthis site.AtChristiansted,U.S.VirginIslands,for0.2-and1.0-sSA,intraslabbackgroundgriddedseismicitysources(35%and 30%,respectively)andactivecrustalfaultsources(27%and39%,respectively)arethehighestcontributorstothe2%in50yearPEtotalmeanhazard,asthesiteislocatedabovetheAnegadaPassagefault-zonepolygonsource(Figure 8c,f and Figure 9c,f ).Thenextlargestcontributortototalmeanhazardatthesiteisfrominterfacefaults(11%at0.2-sSAand15% at1.0-sSA)andinterfacebackgroundgriddedseismicitysources(18%at0.2-sSAand10%at1.0-sSA),asthesiteisalso locatedabovetheeasternsideoftheMuertoTroughinterfacefaultandbackgroundgriddedseismicitysources (Figure 2a).Thelowestcontributortototalmeanhazardatthissiteistheactivecrustalbackgroundgriddedseismicity source(8%for0.2-sand6%for1.0-sSA).Meanhazardcurvesforeachsourcetype0.2-and1.0-sSA,andNEHRPsiteclass BC([VS30 = 760m/s]),alongwithtotalmeanhazardcurves,areshownforthreeadditionalselectedtestsites(Arecibo, PuertoRico,Ponce,PuertoRicoandCharlotteAmalie,U.S.VirginIslands)inFigureES-2.Disaggregationsofthe2%in 50-yearPEgroundmotionfor0.2-and1.0-sSAwithNEHRPsiteclassBC(VS30 = 760m/s)forthesesamethreetestsites areshowninFigureES-3.Backgroundgriddedseismicitysources(activecrustalandintraslab)arethehighestcontributorstothe2%in50-yearPEtotalmeanhazardatArecibo,PuertoRicoandCharlotteAmalie,U.S.VirginIslandsatboth 0.2-and1.0-sSA.AtPonce,PuertoRico,backgroundgriddedseismicitysources(activecrustalandintraslab)arethe
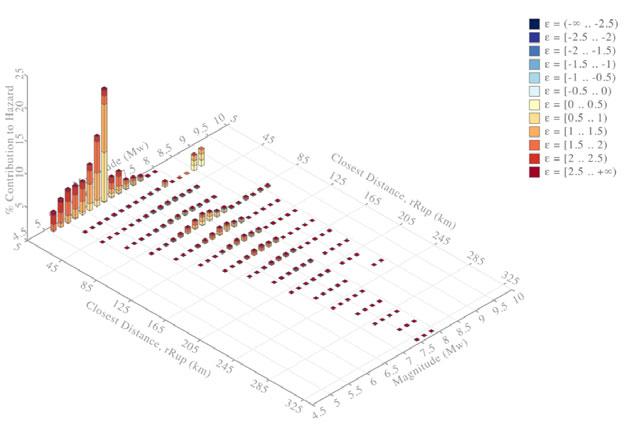

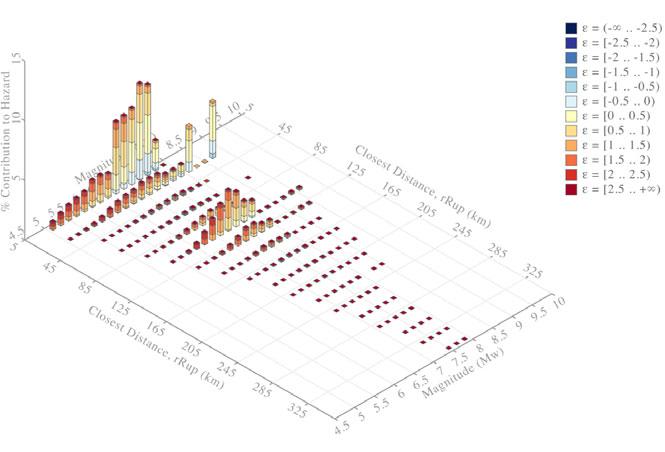
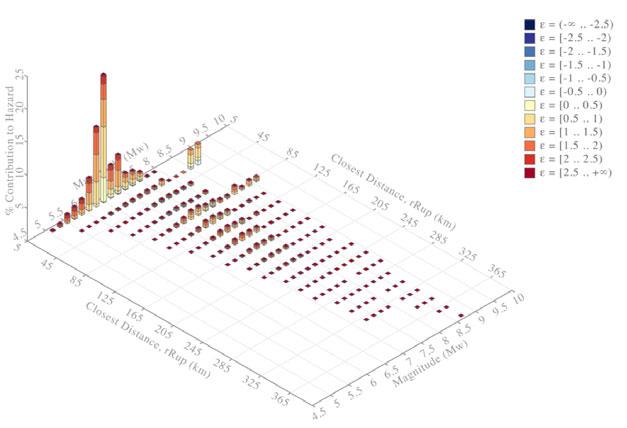


FIGURE9 | Disaggregationof(a–c)0.2-and(d–f)1.0-sSA2%in50-yearPEgroundmotionforNationalEarthquakeHazards ReductionProgramsiteclassBC(Vs30 = 760m/s)for(a,d)Mayagüez,PuertoRico,(b,e)SanJuan,PuertoRico,and (c,f)Christiansted,U.S.VirginIslands.ACF = activecrustalfaultsources,IF = interfacefaultsources,ACG = activecrustalbackgroundgriddedseismciitysource,InterG = interfacebackgroundgriddedseismicitysources,andIntraG = intraslabbackground griddedseismicitysources.Thepercentcontributionofeachsourcetypeisalsolisted(inparentheses),alongwiththemomentmagnitude[M]anddistance(RRUP = closestdistancetorupture)ofthemostlikelyhazardcontrollingeventforeachsourcetype.Epsilon(ε), thenumberofstandarddeviations(i.e.,sigma)thataspecificearthquake’sgroundmotiondeviatesfromthemedianpredictionofa ground-motionmodelforagivenmagnitudeanddistance,isalsoshown.
highestcontributorstothe2%in50-yearPEtotalmeanhazardat0.2-sSA,whileat1.0-sSA,backgroundgridded seismicitysources(activecrustalandintraslab),followedcloselybyinterfacefaultsfromtheMuertosTrough(which is 20kmawayfromthesite)arethehighestcontributorstototalmeanhazard.
4.1.3 | MeanUniformHazardResponseSpectra
Meanuniformhazardresponsespectra(UHRS)weregeneratedforsixselectedtestsites(Arecibo,PuertoRico,Mayagüez, PuertoRico,Ponce,PuertoRico,SanJuan,PuertoRico,CharlotteAmalie,U.S.VirginIslands,andChristiansted,U.S. VirginIslands)for2%in50-yearPEusingeightNEHRPsiteconditionsrangingfrom VS30 = 150to1500m/s(Figure 10). Groundmotionstypicallyincreaseas VS30 decreases,exceptforsoftersiteconditions(VS30 of260m/sandlower)which decreasespectralordinatesatshortperiods(between0.1-and0.25-sSA)andintroduceashiftinthespectralpeakto longerspectralperiods.Forexample,at0.25-sSA,thegroundmotionatMayagüez,PuertoRico,reachesamaximumof 1.99gat VS30 of365m/s(greenline),whilethepeakinthespectradecreaseandshiftstolongerspectralperiodsfor VS30 of 260,185,and150m/s(Figure 10b;cyanline,redline,andbrownline,respectively).Thisdecreaseofshort-periodSAfor softersiteconditionsandshifttolongerperiodspectralpeaksisaresultofnonlinearityinthesiteresponse.
4.1.4 | EpistemicUncertainty
Meanhazardcurves,likethoseshowninFigure 8,consistofweightedaveragesacrossalllogictreebranchesofthe seismichazardmodel(ERFandGMCmodels).Whenreportinghazardresults,itisimportantnotonlytoreportmean hazardbutalsotheepistemicuncertainty,whichisoftenrepresentedbyadistributionofpossiblehazardcurves(i.e., percentiles),asseismichazardassessmentsareinherentlyuncertainduetolimitationsinourunderstandingofearthquakeprocessesanddataavailability.HazardpercentilesarecomputedbyrepeatinghazardanalysesformultiplescenariosrepresentedbydifferentlogictreebranchesintheERFmodelandGMCmodellogictrees.Thedifferentanalyses producedifferenthazardresults,thedistributionofwhichisrepresentedbythepercentiles.Ingeneral,higherepistemic
FIGURE10 | MeanuniformhazardresponsespectraforsixselectedtestsitesinthePuertoRicoandU.S.VirginIslandsregionfor2%in 50-yearPE:(a)Arecibo,PuertoRico,(b)Mayagüez,PuertoRico,(c)Ponce,PuertoRico,(d)SanJuan,PuertoRico,(e)CharlotteAmalie,U.S. VirginIslands,and(f)Christiansted,U.S.VirginIslands.ValuesarecalculatedforNationalEarthquakeHazardsReductionProgramsite classesA(VS30 = 1500m/s,orangelines),B(VS30 = 1080m/s,bluelines),BC(VS30 = 760m/s,blacklines),C(VS30 = 530m/s,magentalines), CD(VS30 = 365m/s,greenlines),D(VS30 = 260m/s,cyanlines),DE(VS30 = 185m/s,redlines),andE(VS30 = 150m/s,brownlines).
uncertaintyisindicatedbyawiderspreadofpercentilesandcanresultinahighermeanhazardvalue,asthemeancanbe pulledupwardbyoutlierlogictreebranches.Reportingtheepistemicuncertaintyprovidesuserswithamorecomplete assessmentofhazardandallowsthemtomakebetterinformeddecisions(Ake2018).PastNSHMshavereportedpercentilesatalimitednumberoftestsites(Petersenetal.2024).The2025PRVINSHMisthefirstNSHMinwhichwehave calculatedpercentilesnotonlyatafullsuiteoftestsitesbutforallgridpointsinthestudyregion.
Asoneexample,fortheSanJuan,PuertoRico,testsite,meanaswellasselectedpercentilehazardcurves(2.5th,16th, 50th[median],84th,and97.5th)areplottedfor0.2-s(Figure 11a)and1.0-sSA(Figure 11d).Thedifferencebetweenthe meanandmediancurves,forbothperiods,isverysmallatshorterreturnperiods(e.g.,475yearsor10%in50-yearPE),but startstodivergeatlongerreturnperiods(e.g.,2475yearsor2%in50-yearPE),asdoesthespreadofthepercentiles. Epistemicuncertaintyat0.2-sSAspansarangefrom0.67g(2.5thpercentile)to1.76g(97.5thpercentile)at2%in 50-yearPE(Figure 11b)andarangeof0.31g(2.5thpercentile)to0.84g(97.5thpercentile)at10%in50-yearPE (Figure 11c).At1.0-sSA,epistemicuncertaintyspansarangeof0.13g(2.5thpercentile)to0.41g(97.5thpercentile) at2%in50-yearPE(Figure 11e)andarangeof0.06g(2.5thpercentile)to0.20g(97.5thpercentile)at10%in50-year PE(Figure 11f ).For0.2-sand1.0-sSA,themeanhazardat2%and10%in50-yearPEfromthe2025PRVINSHMiswithin the50th–84thpercentiles.ThesameplotsforfiveotherselectedtestsitesareprovidedintheElectronicSupplement (FiguresES-4toES-8),andsimilartrendsareobserved.
Asmentionedabove,meanhazardcanbedominatedbyoutlierbranchesinthelogictree.InFigure 12a,thepercentileat whichthemeanhazardatsitesinthemaplieswithintheepistemicuncertaintydistributionisshownfor0.2-sSA, NEHRPsiteclassBC(VS30 = 760m/s),and2%in50-yearPE.Themeanhazardvaluesrangebetweenthe58thto
FIGURE11 | PercentilehazardcurvesareshownfortheSanJuan,PuertoRico,testsitefor(a)0.2-sSAand(d)1.0-sSAforNational EarthquakeHazardsReductionProgramsiteclassBC(VS30 = 760m/s).Mean(darkredlines),median(50thpercentile,redlines),and selectedpercentiles(2.5th,16th,84th,and97.5th,lighterredlines)areshown.Theminimum(0)andmaximum(100)ofthedistribution arealsoshowninlightestredlines.The2%and10%in50-yearPEhorizonsareplottedashorizontalgreylinesforreference.Histograms ofthefulldistributionofepistemicuncertaintyfor2%in50-year(b,e)and10%in50-year(c,f)PEgroundmotionsarealsoshown,with verticalredlinesindictingthemean(darkred)andselectedpercentiles(2.5th,16th,50th,84th,and97.5th,lighterred).

FIGURE12 | Mapsshowing0.2-sSAepistemicuncertaintyresultsinthe2025PuertoRicoandU.S.VirginIslandsNSHM: (a)branch-averagedpercentile,(b)mean-to-medianratio,(c)standarddeviation,and(d)coefficientofvariationforNational EarthquakeHazardsReductionProgramsiteclassBC(VS30 = 760m/s)and2%in50-yearPE.Sixselectedtestsiteswherehazard resultsaredescribedinthetextareshownassolidblacksquares.Uncertaintymeasurecontoursareshownwiththingraylines. Minimum(Min)andmaximum(Max)values(onland)arelistedandlabeledforreaderconvenience.
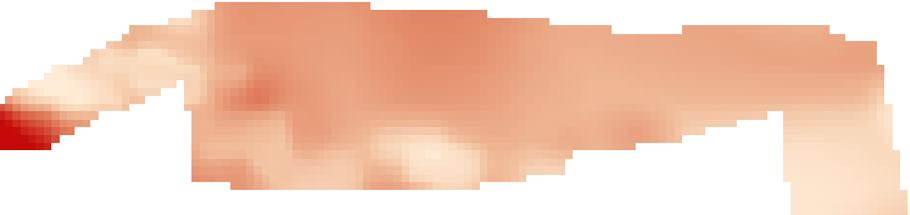


FIGURE13 | Mapsshowing1.0-sSAepistemicuncertaintyresultsinthe2025PuertoRicoandU.S.VirginIslandsNSHM: (a)branch-averagedpercentile,(b)mean-to-medianratio,(c)standarddeviation,and(d)coefficientofvariationforNational EarthquakeHazardsReductionProgramsiteclassBC(VS30 = 760m/s)and2%in50-yearPE.Sixselectedtestsiteswherehazard resultsaredescribedinthetextareshownassolidblacksquares.Uncertaintymeasurecontoursareshownwiththingraylines. Minimum(Min)andmaximum(Max)values(onland)arelistedandlabeledforreaderconvenience.
67thpercentiles.Figure 12b showstheratioofmean-to-medianhazard,withvaluesrangingfrom1.04to1.14(4%to14%). Figure 12c showsthestandarddeviationofvaluesacrossalllogictreebranches(ERFandGMCmodels),andFigure 12d showsthecoefficientofvariation(COV = standarddeviation/mean).Thestandarddeviationvariesfrom0.25to0.59,and theCOVvariesfrom0.20to0.30forthefullhazardmodel(ERFCOV = 0.12,GMCCOV = 0.19).Asidefromthehighest valuesonIsladeMona(refertoFigure 1b forlocation)andwesternPuertoRico,allofthesemeasuresof0.2-sSA epistemicuncertaintyarerelativelyuniformacrossthePRVIregion.Figure 13 isthesameasFigure 12 butfor1.0-s SA.Themeanhazardvaluesfor1.0-sSArangebetweenthe59thto66thpercentiles;theratiosofmean-to-medianhazard rangefrom1.07to1.14(7%to14%);standarddeviationsvaryfrom0.07to0.12;andtheCOVrangesfrom0.25to0.30(ERF COV = 0.13,GMCCOV = 0.21).Thesamefiguresfor10%in50-yearPEareavailableintheElectronicSupplement (FiguresES-9andFigureES-10).Similarspatialpatternsareobservedat10%in50-yearPEasareobservedin2%in 50-yearPE.
4.2 | Comparisonwiththe2003PuertoRicoandU.S.VirginIslandsNationalSeismic HazardModel
4.2.1 | MeanUniformHazardGround-MotionMaps
Whencomparingthemeanhazardbetweenthe2025and2003PRVINSHMs(difference = 2025minus2003,andratio = 2025dividedby2003)for2%in50-yearPEandNEHRPsiteclassBC(VS30 = 760m/s),hazardisgenerallyhigherinthe2025 PRVINSHMatshorterperiods(e.g.,increasesofupto0.60gandaratioof1.82(82%increase)at0.2-sSA,Figure 14a,b).At longerperiods,thechangeinhazardisnotashigh(e.g.,increasesofupto0.06gandaratioof1.24(24%increase)at1.0-sSA, Figure 14c,d).At10%in50-yearPE,hazardincreasesarealsogenerallyhigheratshorterperiodsthanlongerperiods, withincreasesupto0.41gandaratioof1.61(61%increase)at0.2-sSA(Figure 15a,b)andincreasesupto0.001g andaratioof1.01(1%increase)at1.0-sSA(Figure 15c,d).Table 2 lists2%and10%in50-yearPEgroundmotionsfor sixselectedtestsitescalculatedfromthe2025and2003PRVINSHMs,aswellasdifferences(2025PRVINSHM–2003 PRVINSHM)andratios(2025PRVINSHM/2003PRVINSHM).
FIGURE14 | Meanuniformhazardgroundmotiondifference(a,c)andratio(b,d)mapscomparingthe2025and2003versionsof thePuertoRicoandU.S.VirginIslands(PRVI)NSHM.Mapscompare(a,b)0.2-sand(c,d)1.0-sSAgroundmotionswitha2%in50-year PEandforNationalEarthquakeHazardsReductionProgramsiteclassBC(VS30 = 760m/s).Minimum(Min)andmaximum(Max) values(onland)arelistedandlabeledforreaderconvenience.Thewesternextentofcalculatedhazardinthe2003PRVINSHM was 67.5°Wlongitude,andtherefore,therearenovaluestocomparewestofthisline.
FIGURE15 | Meanuniformhazardgroundmotiondifference(a,c)andratio(b,d)mapscomparingthe2025and2003versionsof thePuertoRicoandU.S.VirginIslands(PRVI)NSHM.Mapscompare(a,b)0.2-sand(c,d)1.0-sSAgroundmotionswitha10%in 50-yearPEandforNationalEarthquakeHazardsReductionProgramsiteclassBC(VS30 = 760m/s).Minimum(Min)andmaximum (Max)values(onland)arelistedandlabeledforreaderconvenience.Thewesternextentofcalculatedhazardinthe2003PRVINSHM was 67.5°Wlongitude,andtherefore,therearenovaluestocomparewestofthisline.
4.2.2 | MeanHazardCurves
ComparisonsofmeanhazardcurvesforsixselectedtestsitesareshowninFigure 16 for0.2-(plottedinblack)and1.0-s SA(plottedinblue)andNEHRPsiteclassBC(VS30 = 760m/s).The2025PRVINSHMhazardcurvesareshownwithsolid
FIGURE16 | Comparisonofmeanhazardcurvescalculatedatsixselectedtestsitesusingthe2025PRVINSHM(solidlines)and 2003PRVINSHM(dashedlines):(a)Arecibo,PuertoRico,(b)Mayagüez,PuertoRico,(c)Ponce,PuertoRico,(d)SanJuan,PuertoRico, (e)CharlotteAmalie,U.S.VirginIslands,and(f)Christiansted,U.S.VirginIslands.Meanhazardcurvesareplottedfor0.2-(blacklines) and1.0-s(bluelines)SAandNationalEarthquakeHazardsReductionProgramsiteclassBC(VS30 = 760m/s).The2%and10%in50yearPEhorizonsareplottedashorizontalgraylinesforreference.
lines,andthe2003PRVINSHMhazardcurvesareshownwithdashedlines.At0.2-sSA,hazardishigherinthe2025 PRVINSHMthaninthe2003PRVINSHMforallsixselectedtestsitesat2%and10%in50-yearPE.At1.0-sSA,hazardis lowerat2%and10%in50-yearPEinthe2025PRVINSHMatArecibo,PuertoRico,Ponce,PuertoRico,andSanJuan, PuertoRico.ForCharlotteAmalie,U.S.VirginIslands,the1.0-sSA2%in50-yearPEhazardinthe2025PRVINSHMis thesameasinthe2003PRVINSHM,butthe10%in50-yearPEhazardislowerinthe2025PRVINSHMthaninthe2003 PRVINSHM.ForMayagüez,PuertoRico,the1.0-sSA2%and10%in50-yearPEinthe2025PRVINSHMisthesameasin the2003PRVINSHM.ForChristiansted,U.S.VirginIslands,the1.0-sSA2%in50-yearPEisgreaterinthe2025PRVI NSHMthaninthe2003PRVINSHM,butthe10%in50-yearPEisthesame(refertoTable 2 forexactvaluesateachsite). Overall,the2003PRVINSHMmeanhazardcurvesaresteeperthanthecurvesforthe2025PRVINSHM.Thisdifference inslopeistheresultofthehigheraleatoryvariabilitymodelsinthe2025PRVINSHMthaninthe2003PRVINSHMat bothshortandlongperiods.
4.2.3 | EpistemicUncertainty
Aswasshownabove(Figure 11a,d),percentilehazardcurveswerecalculatedforthefullsuiteof86testsitesinthe PRVIregionforselectedperiods(PGA,0.2,1.0,and5.0-sSA)andNEHRPsiteclassesBC(VS30 = 760m/s)and D(VS30 = 260m/s).Meanandselectedpercentilehazardcurves(2.5th,16th,50th[median],84th,and97.5th)forthree oftheselectedtestsites(Mayagüez,PuertoRico,SanJuan,PuertoRico,andChristiansted,U.S.VirginIslands)areplotted for0.2-sSAandNEHRPsiteclassBC(VS30 = 760m/s)inFigure 17a–c.Themeanhazardcurveforthe2003PRVINSHM isplottedinblueforcomparison,aswellasthe2%and10%in50-yearPEhorizonsforreference.Thepercentileatwhich the2003PRVINSHMmeanhazardlieswithinthe2025PRVINSHM’sepistemicuncertaintydistributionat2%in50-year PEand10%in50-yearPEforthefullPRVIregionisshowninFigure 17d,e,respectively.For2%in50-yearPE,the


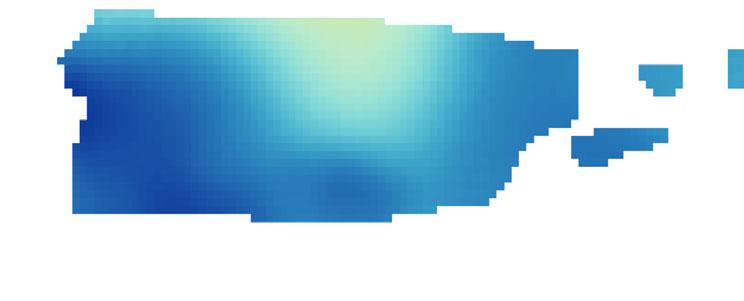

FIGURE17 | 0.2-sSApercentilehazardcurvesshownfor(a)Mayagüez,PuertoRico,(b)SanJuan,PuertoRico,and (c)Christiansted,U.S.VirginIslandstestsites.Mean(darkredlines),median(50thpercentile,redlines),andselectedpercentiles (2.5th,16th,84th,and97.5th,lighterredlines)areshownwhilethemean2003PuertoRicoandU.S.VirginIslands(PRVI) NSHMhazardcurve(labeledComparisonMean)isshownasablueline.Theminimum(0)andmaximum(100)ofthedistribution isalsoshown.The2%and10%in50-yearPEhorizonsareplottedashorizontalgraylinesforreference.Thepercentileatwhichthe2003 PRVINSHM’smeanhazardlieswithinthe2025PRVINSHM’sepistemicuncertaintydistributionforthefullPRVIregionat(d)2%in 50-yearPEand(e)10%in50-yearPEisalsoshown.Thetestsites(a–c)areshownonthemaps(d,e)usingwhitestars(withthetestsites locatedwesttoeast).
percentileinwhichthe2003PRVINSHMmeanhazardlieswithinthe2025PRVINSHM’sepistemicuncertaintydistributionisbetweenthe1stand35thpercentile,withthemeanbeingthe14thpercentile.Thisisalsoapparentwhenlooking atwherethe2003PRVINSHMmeanhazardcurvelieswithinthe2025PRVINSHMepistemicuncertaintydistributionat 2%in50-yearPEonthehazardcurvesforthethreetestsites(Figure 17a–c).Mayagüez,PuertoRico,liesatthe6th percentile,SanJuan,PuertoRico,liesatthe24thpercentile,andChristiansted,U.S.VirginIslands,liesatthe1stpercentile.For10%in50-yearPE,thepercentileinwhichthe2003PRVINSHMmeanhazardlieswithinthe2025PRVI NSHM’sepistemicuncertaintydistributionisbetweenthe1stand54thpercentile,withthemeanbeingthe22ndpercentile(Figure 17e).Mayagüez,PuertoRico,liesatthe4thpercentile,SanJuan,PuertoRico,liesatthe46thpercentile, andChristianstedU.S.VirginIslands,liesatthe10thpercentile.
Figure 18 showsthesameplots,butfor1.0-sSA.Thepercentileatwhichthe2003PRVINSHMmeanhazardlieswithin the2025PRVINSHM’sepistemicuncertaintydistributionat2%in50-yearPEand10%in50-yearPEforthefullPRVI regionisshowninFigure 18d,e,respectively.For2%in50-yearPE,thepercentileinwhichthe2003PRVINSHMtotal hazardlieswithinthe2025PRVINSHM’sepistemicuncertaintydistributionisbetweenthe30thandthe90thpercentile, withthemeanbeingthe67thpercentile(Figure 18d).Thisisalsoapparentwhenlookingatwherethe2003PRVINSHM meancurvelieswithinthe2025PRVINSHMepistemicuncertaintydistributionat2%and10%in50-yearPEonthe hazardcurvesforthethreetestsites(Figure 18a–c).Mayagüez,PuertoRico,liesatthe64thpercentile,SanJuan,Puerto Rico,liesatthe85thpercentile,andChristiansted,U.S.VirginIslands,liesatthe31stpercentile.For10%in50-yearPE, thepercentileinwhichthe2003PRVINSHMtotalhazardlieswithinthe2025PRVINSHM’sepistemicuncertainty distributionisbetweenthe48thandthe94thpercentile,withthemeanbeingthe79thpercentile(Figure 18e). Mayagüez,PuertoRico,liesatthe64thpercentile,SanJuan,PuertoRico,liesatthe92ndpercentile,and Christiansted,U.S.VirginIslands,liesatthe63rdpercentile.TheseresultsshowthatforthefullPRVIregion,the 2003PRVINSHMmeanhazardisfullycontainedwithinthe2025PRVINSHM’sepistemicuncertaintydistribution. Meaning,the2025PRVINSHMfullycapturestheresultsofthe2003PRVINSHM.




FIGURE18 | 1.0-sSApercentilehazardcurvesshownfor(a)Mayagüez,PuertoRico,PuertoRico,(b)SanJuan,PuertoRico,and (c)Christiansted,U.S.VirginIslandstestsites.Mean(darkredlines),median(50thpercentile,redlines),andselectedpercentiles(2.5th, 16th,84th,and97.5th,lighterredlines)areshownwhilethemean2003PRVINSHMhazardcurve(labeledComparisonMean)is shownasablueline.Theminimum(0)andmaximum(100)ofthedistributionisalsoshown.The2%and10%in50-yearPEhorizons areplottedashorizontalgreylinesforreference.Thepercentileatwhichthe2003PRVINSHM’smeanhazardlieswithinthe2025 PRVINSHM’sepistemicuncertaintydistributionforthefullPRVIregionat(d)2%in50-yearPEand(e)10%in50-yearPEisalso shown.Thetestsites(a–c)areshownonthemaps(d,e)usingwhitestars(withthetestsiteslocatedwesttoeast).
4.2.4
| ChangesfromtheEarthquakeRuptureForecastModel
ToquantifychangesinmeanhazardthatresultfromchangestotheERFmodelonly,wecomparedthe2025PRVINSHM ERFmodeltothe2003PRVINSHMERFmodelbyrunningeachNSHMwiththe2025PRVINSHMGMCmodel(therefore,theGMCmodelswouldcanceloutleavingdifferencesonlyfromtheERFmodels).Figure 19 showsdifferenceand ratiomapsfor0.2-and1.0-sSA,2%in50-yearPE,andNEHRPsiteclassBC(VS30 = 760m/s).Atbothperiods,hazard changesfromthe2025PRVINSHMERFmodelgenerallyincreaseoverthesouthernpartofthePRVIregionanddecrease inthenorth.Hazardincreasesupto1.03g(+147%)at0.2-sSA(0.62g(+73%)onland)andupto0.21g(+88%)at1.0-sSA (0.12g(+59%)onland).
Decreasesinthenorthernpartsofthemaps( 18.5°Nlatitude)areduetoupdatesmadetointerfacefaultrupturesonthe PuertoRicoTrenchinthe2025PRVINSHMERFmodel.Inthe2003PRVINSHMERFmodel,thePuertoRicoTrench wasrepresentedbysinglefloatingrupturesontheHispaniolasection(M 8,200-yearrecurrencetimes,and 80%seismic coupling)andthePuertoRicosection(M 7.9,190-yearrecurrencetimes,and 20%seismiccoupling).Inthe2025PRVI NSHMERFmodel,themagnitudedistributiononthePuertoRicoTrenchrangesfrom M 7.5upto M 9.1,slipratesare reduceddownfrom 3.5to 1.8mm/yr,andseismiccouplingandslippartitioningaremodeledwithalternative branchesinalogictree(refertoFigure 3).Theslipratedecrease,alongwiththeincreasedMmax,leadstodecreases inthisarea.Furthermore,theupdated2025PRVINSHMERFmodelPuertoRicoTrenchgeometryfromSlab2(Hayes 2018; Hayesetal.2018)placesthesouthernedgeoftheinterfaceat50-kmdepthinsteadofat40kmasinthe2003PRVI NSHMERFmodel,therebyincreasingthesource-to-sitedistanceanddecreasingmediangroundmotions.Updatesand additionstotheactivecrustalfaults,bothonshoreandoffshore,causehazardincreasesinlocalizedareasacrossthe southernandwesternpartsofPuertoRico.Forexample,updatesandadditionsoffaultsectionsandfault-zonepolygons intheMonaPassageandthewesterncoastofPuertoRico,additionoftheGreatSouthernPuertoRicofaultandSalinas faulttotheeastofPonce,PuertoRico,andadditionoftheSouthwestPuertoRicofault-zonepolygonoffshoretothe southwestofPonce,PuertoRico,causelocalizedhazardincreases.Thebroadincreasesinhazardatthesouthern andwesternedgesofthemapsareduetoincludingtheMuertosTroughasasubductionsourceinthe2025PRVI


























4.2.5 | ChangesfromtheGround-MotionCharacterizationModel
















FIGURE19 | Difference(a,c)andratio(b,d)mapscomparingthemeanhazardfromthe2025and2003PRVINSHMearthquake ruptureforecast(ERF)models.Mapscompare(a,b)0.2-sand(c,d)1.0-sSAuniform-hazardgroundmotionswitha2%in50-yearPEand NationalEarthquakeHazardsReductionProgramsiteclassBC(VS30 = 760m/s).SeismicsourcesaredefinedinFigure 2.FZ = fault zone;GSPRF = GreatSouthernPuertoRicoFaultZone;MP = MonaPassage;PM = PuntaMontalva;SW= southwest; SWPR = SouthwestPuertoRico.
NSHMERFmodel(versusmodelingthisareaasbackgroundgriddedseismicitysourcesinthe2003PRVINSHMERF model),whichincludesainterfacefaultsourceandimprovedmodelingofanassociatedinterfaceandintraslabbackgroundgriddedseismicitysource.Theuseofthenewcatalogseparationalgorithm(Haynieetal.2025)inthe2025PRVI NSHMERFmodeldistributedmoreoftheshallow(<50km)griddedseismicitymodelearthquakeratetointraslab griddedsourcesthaninthe2003PRVINSHMERFmodel,andtheintraslabMmaxincreasedfrom M 7.2toalogic treewith M 7.5and M 8branches,eachequallyweighted.
ToquantifychangesinmeanhazardthatresultfromchangestotheGMCmodelonly,wecomparedthe2025PRVI NSHMGMCmodeltothe2003PRVINSHMGMCmodelbycomparingthepublishedhazardresultsfromthe2003 PRVINSHM(Shumway2019;2003PRVINSHMERFandGMCmodels)tohazardcomputedfromthe2003PRVI NSHMERFmodelwiththe2025PRVINSHMGMCmodel(therefore,theERFmodelswouldcanceloutleavingdifferencesonlyfromtheGMCmodels).Figure 20 showsdifferenceandratiomapsfor0.2-and1.0-sSA,2%in50-yearPE,and NEHRPsiteclassBC(VS30 = 760m/s).At0.2-sSA,hazardincreasesupto0.53g(+46%)(0.24g(+22%)onland),andat 1.0-sSA,hazarddecreasesbyupto0.14g( 16%)(0.13g( 29%)onland).
Hazardincreasesareduetohigheraleatoryvariabilitymodelsinthe2025PRVINSHMversusthe2003PRVINSHM acrossallperiods(Figure 4d).Hazardincreasesanddecreasesareduetoperiod-specificincreasesanddecreasesinthe mediangroundmotionsfromtheGMMsinthe2025PRVINSHMversusthe2003PRVINSHM(Figure 4a–c).Hazard decreasesatlongperiodsareduetostrongerdistanceattenuationintheNGA-SubductionGMMsatlongerperiods (Figure 4b,c).Theincreaseinhazardatshorterperiodsanddecreaseinhazardatlongerperiodsobservedfromthe NGA-SubductionGMMsareconsistentwithwhatwasobservedinthe2023NSHMforAlaska(Powersetal.2024).
4.2.6 | SelectedTestSites
Forthreeoftheselectedtestsites(Mayagüez,PuertoRico,SanJuan,PuertoRico,andChristiansted,U.S.VirginIslands), weinvestigated2%in50-yearPE,NEHRPsiteclassBC(VS30 = 760m/s),hazardchangesbetweenthe2025PRVINSHM and2003PRVINSHMbylookingatsource-typehazardcurves,disaggregations,anddeterministicresponsespectra



















FIGURE20 | Difference(a,c)andratio(b,d)mapscomparingthemeanhazardfromthe2025and2003PRVINSHMgroundmotioncharacterization(GMC)models.Mapscompare(a,b)0.2-sand(c,d)1.0-sSAuniform-hazardgroundmotionswitha2% in50-yearPEandNationalEarthquakeHazardsReductionProgramsiteclassBC(VS30 = 760m/s).Novaluesarereportedwest of 67.5°Wlongitude,asthisisthewesternextentofthe2003PRVINSHMreportingregion.Seismicsourcesaredefinedin Figure 2.FZ = faultzone;GSPRF = GreatSouthernPuertoRicoFaultZone;MP = MonaPassage;PM = PuntaMontalva; SW = southwest;SWPR = SouthwestPuertoRico.
(mediangroundmotionsandassociatedstandarddeviations)forthemostlikelymagnitudesanddistancesofhazard controllingsources.Basedonthesefigures,andtheupdatesmadeinthe2025PRVINSHM,wecanexplainthechanges inhazardatthesetestsites.
4.2.6.1 | Mayagüez,PuertoRico. Totalmeanandsource-typehazardcurvesforboththe2025and2003PRVI NSHMareplottedfor0.2and1.0-sSAinFigure 21 fortheMayagüez,PuertoRico,testsite.Forthe2025PRVI NSHM,forboth0.2-and1.0-sSA,activecrustalsources(faultsandbackgroundgriddedseismicity)andintraslabbackgroundgriddedseismicitysourcesmakeup91%and86%,respectively,ofthe2%in50-yearPEtotalmeanhazardatthe site.Forthe2003PRVINSHM,at0.2and1.0-sSA,activecrustalsources(faultsandbackgroundgriddedseismicity)make up93%and85%,respectively,ofthe2%in50-yearPEtotalmeanhazardatthesite.Basedonthe2025PRVINSHM2%in 50-yearPEdisaggregationsforboththeseperiodsatthissite,themostlikelyhazardcontrollingactivecrustal(faultsand backgroundgriddedseismicity)eventisa M 6.3at10kmdistance,andthemostlikelyhazardcontrollingintraslab backgroundseismicityeventisa M 7.4at90kmdistance(Figure 9a,d).Plottingthedeterministicresponsespectrafor thesetwoeventsshowsacomparisonbetweentheweightedmeanofthemediangroundmotionsforeachNSHMaswell asacomparisonbetweenthealeatoryvariabilitymodels(standarddeviations)(refertoFigureES-11).
At0.2-sSA,the20252%in50-yearPEgroundmotionincreasedby48%comparedtothesamegroundmotionin2003 (Table 1).Hazardhasincreasedinthe2025PRVINSHMatshortperiodsatthissiteduetothehighercontributionofthe activecrustalbackgroundgriddedseismicitysource(44%vs.27%),withitshigheraleatoryvariability(+16%;asnotedbythe steeperslopesofthe2025hazardcurvesversustheslopesofthe2003hazardcurves,Figure 21)andhigherseismicityrates, aswellasthehighercontributionoftheintraslabbackgroundgriddedsources(24%vs.3%),withtheirhighermedian groundmotions(+44%)andaleatoryvariability(+21%)andhigherseismicityratesandMmaxcomparedto2003(asdiscussedaboveintheChangesfromtheERFModelsection).At1.0-sSA,the20252%in50-yearPEgroundmotionstayedthe same(0%)comparedtothesamegroundmotionin2003(Table 1).Eventhoughtheactivecrustalbackgroundgridded seismicitysource,withitshigheraleatoryvariability(+6%)andseismicityrates,hasahighercontributionin2025thanin 2003(32%vs.10%),itsmediangroundmotionsarelower( 37%).Inaddition,eventhoughtheintraslabbackgroundgridded sources,withtheirhigheraleatoryvariability(+14%),seismicityrates,andMmax,haveahighercontributionin2025thanin 2003(24%vs.3%),theirmedianGMMsarelower( 18%)andthe2025intraslabbackgroundseismicitysources’ median
(a) (b)
FIGURE21 | Comparisonoftotalmean(blackline)andsource-typehazardcurves(coloredlines)forthe2025PRVINSHMandthe 2003PRVINSHMatMayagüez,PuertoRico,for(a)0.2-sand(b)1.0-sSAandNationalEarthquakeHazardsReductionProgramsite classBC(VS30 = 760m/s).The2%and10%in50-yearPEhorizonsareplottedashorizontalgraylinesforreference.Percentcontribution foreachsourcetypeisalsolistedinthelegend.
groundmotionshavestrongdistancescalingatlongerperiods,whichtendstodrivedownhazardwherelargemagnitude intraslabsourcesatlargerdistancestendtocontrol,whichisthecaseforthissite.
4.2.6.2 | SanJuan,PuertoRico. Totalmeanandsource-typehazardcurvesforboththe2025PRVINSHMand2003 PRVINSHMareplottedfor0.2-and1.0-sSAinFigure 22 forSanJuan,PuertoRico.Forthe2025PRVINSHM,for0.2and1.0-sSA,theactivecrustalbackgroundgriddedseismicitysourceandintraslabbackgroundgriddedseismicitysources makeup85%and71%,respectively,ofthe2%in50-yearPEtotalmeanhazardatthesite.Forthe2003PRVINSHM,at 0.2-and1.0-sSA,theactivecrustalbackgroundgriddedseismicitysourceandinterfacefaultsandbackgroundgridded seismicitysourcemakeup85%and87%,respectively,ofthe2%in50-yearPEtotalmeanhazardatthesite.Basedonthe 2025PRVINSHM2%in50-yearPEgroundmotiondisaggregationsforboththeseperiodsatthissite,themostlikely hazardcontrollingactivecrustalbackgroundgriddedseismicityeventisa M 6.3at10kmdistanceandthemostlikely hazardcontrollingintraslabbackgroundgriddedseismicityeventisa M 7.3at70kmdistance(Figure 9b,e).ThedeterministicresponsespectraforthesetwoeventsareshowninFigureES-12.
At0.2-sSA,the20252%in50-yearPEgroundmotionincreasedby29%comparedtothesamegroundmotionin2003 (Table 1).Eventhoughthe2025activecrustalbackgroundgriddedseismicitysourcemediangroundmotionsarelower thanin2003( 36%),the2025aleatoryvariabilityishigherthanin2003(+16%;notedbythesteeperslopesofthe2025 hazardcurvesvs.theslopesofthe2003hazardcurves,Figure 22).The2025intraslabbackgroundgriddedseismicity sources’ mediangroundmotionsandaleatoryvariabilityarebothhigherthanin2025thanin2003(+53%and21%, respectively).Inaddition,the2025intraslabbackgroundgriddedseismicitysourceshavehigherseismicityratesand Mmaxthanin2003(asdiscussedintheChangesfromtheERFModelsectionabove)andcontributemoretototalhazard in2025thanin2003(53%vs.11%).However,the2025interfacefaultsandbackgroundgriddedseismicitysourcescontributelesstototalhazardthanin2003(15%vs.33%),andtheyarethenexthighestcontributingsourceatthissite.At 1.0-sSA,the20252%in50-yearPEgroundmotiondecreasedby16%comparedtothesamegroundmotionin2003 (Table 1).Eventhoughthe2025activecrustalbackgroundgriddedseismicitysourcemediangroundmotionsarelower thanin2003( 37%),the2025aleatoryvariabilityishigher(+6%).The2025intraslabbackgroundgriddedseismicity sources’ mediangroundmotionsarelowerthanin2003( 15%),butthealeatoryvariabilityishigher(+14%).Inaddition, the2025intraslabGMMshavestrongerdistancescalingatlongperiods,whichtendstodrivedownhazardwherelarger magnitudeintraslabeventsatlargerdistancestendtocontrolhazard,asisthecaseatthissite.The2025interfacefaults andbackgroundgriddedseismicitysources,thenexthighestcontributingsources,alsocontributelesstototalhazardthan in2003(28%vs.66%).
(a)(b)
FIGURE22 | Comparisonoftotalmean(blackline)andsource-typehazardcurves(coloredlines)forthe2025PRVINSHMandthe 2003PRVINSHMatSanJuan,PuertoRico,for(a)0.2-sand(b)1.0-sSAandNationalEarthquakeHazardsReductionProgramsite classBC(VS30 = 760m/s).The2%and10%in50-yearPEhorizonsareplottedashorizontalgraylinesforreference.Percentcontribution foreachsourcetypeisalsolistedinthelegend.
4.2.6.3 | Christiansted,U.S.VirginIslands. Totalmeanandsource-typehazardcurvesforboththe2025PRVI NSHMand2003PRVINSHMareplottedfor0.2-and1.0-sSAinFigure 23 forChristiansted,U.S.VirginIslands. Forthe2025PRVINSHM,for0.2-and1.0-sSA,theactivecrustalfaultsourceandintraslabbackgroundgriddedsources (a)(b)
FIGURE23 | Comparisonoftotalmean(blackline)andsource-typehazardcurves(coloredlines)forthe2025PRVINSHMandthe 2003PRVINSHMatChristiansted,U.S.VirginIslands,for(a)0.2-sand(b)1.0-sSAandNationalEarthquakeHazardsReduction ProgramsiteclassBC(VS30 = 760m/s).The2%and10%in50-yearPEhorizonsareplottedashorizontalgraylinesforreference.Percent contributionforeachsourcetypeisalsolistedinthelegend.
makeup62%and69%,respectively,ofthe2%in50-yearPEtotalmeanhazardatthesite.Forthe2003PRVINSHM,at 0.2-and1.0-sSA,activecrustalsources(faultsandbackgroundgriddedseismicity)andintraslabbackgroundgridded sourcesmakeup96%and86%,respectively,ofthe2%in50-yearPEtotalmeanhazardatthesite.Basedonthe2025PRVI NSHM2%in50-yearPEgroundmotiondisaggregationsforboththeseperiodsatthissite,themostlikelyhazardcontrollingactivecrustaleventfaulteventisa M 7.4at10kmdistance,andthemostlikelyhazardcontrollingintraslab backgroundseismicityeventisa M 7.3at110kmdistance(Figure 9c,f ).Thedeterministicresponsespectraforthesetwo eventsareshowninFigureES-13.
At0.2-sSA,the20252%in50-yearPEgroundmotionincreasedby77%comparedtothesamegroundmotionin2003 (Table 1).Hazardhasincreasedatshortperiodsatthissiteduetoahighcontributionofactivecrustalfaultsources(27%), specifically,theAnegadaPassagefault-zonepolygonsource,inwhichthesitesitsabove(refertoFigure 19b).Therecurrencerateonthissourceishigherin2025thanin2003(190yearsvs. 300years),andthealeatoryvariabilityishigherfor activecrustalfaultgroundmotions(+31%;asnotedbythesteeperslopesofthe2025hazardcurvesversustheslopesofthe 2003hazardcurves,Figure 23).Intraslabbackgroundgriddedseismicitysources,withtheirhighermedianground motions(+29%),aleatoryvariability(+21%),andhigherseismicityratesandMmax(asdiscussedaboveinthe ChangesfromtheERFModelsection)alsocontributemoretototalmeanhazardatthissitein2025thanin2003 (35%vs.17%).Inaddition,theinterfacesources(faultsandbackgroundgriddedseismicity),thenexthighestcontributor tototalmeanhazardatthesite,haveahighercontributionatthissitein2005thanin2003(29%vs.2%),andthefull contributioniscomingfromtheMuertosTrough,anewinterfacesourcefor2025.ThesitesitsabovetheMuertosTrough interfacesources(faultsandbackgroundgriddedseismicity).Largemagnitude,closedistanceeventsfrominterfacefaults (suchasan M 8.730kmeventindicatedbythedisaggregationinFigure 9c)causelargernear-sourceeffectsfromthe interfacemediangroundmotions.At1.0-sSA,the20252%in50-yearPEgroundmotionincreasedby26%comparedto thesamegroundmotionin2003(Table 1).Likeatshortperiods,thehighcontributionofactivecrustalfaultsourcesat thissite(39%),specificallyfromtheAnegadaPassagewithitshigherrecurrencerate,andtheirhigheraleatoryvariability (+20%),increasehazardatlongperiods.Theintraslabbackgroundgriddedseismicitysourceisthesecondlargestcontributortototalmeanhazardatthissitein2025(30%),butitwasalsothesecondhighestcontributortothissitein2003 (22%).Althoughthealeatoryvariabilityishigherin2025(+14%),themedianintraslabgroundmotionsarelower( 14%), andashasbeennotedbefore,theintraslabgroundmotionshavestrongdistancescalingatlongerperiods,whichtendsto drivedownhazard.However,theinterfacesources(faultsandbackgroundgriddedseismicity)haveahighercontribution atthissitein2025thanin2003(25%vs.13%),sothenearbyMuertosTrough,whichisanewinterfacesourcefor2025,is contributingtotheincreasinghazardatlongerperiodsatthissite.
5 | Conclusion
The2025PRVINSHMupdatestheprevious2003PRVINSHMwithover20yearsofnewgeologic,geophysical,and engineeringdata,methods,andmodels.TheseincludeupdatestoboththeERFandGMCmodelsandfollowsimilar methodologiesusedintherecent202350-stateNSHM(Fieldetal.2023; Moschettietal.2024; Petersenetal. 2022, 2024; Powersetal.2024).However,thisisthefirstNSHMinwhichwe:(1)applyaninversionmethodology tosubductioninterfacefaultsourcesintheERFmodel;(2)developscaledbackbonemedianGMMsandindependent aleatoryvariabilitymodelsthatareappliedintheGMCmodel;and(3)calculateepistemicuncertaintyrelatedtoalternativescenariosintheERFandGMCmodelsforallgridpointsinthestudyarea.Long-termtime-independentmean hazardcalculationswereperformedforPGAand21spectralperiodsfrom0.01-to10.0-sSAwitha5%-dampedresponse, foreightNEHRPsiteconditionsrangingfrom VS30 = 150to1500m/s,and2%,5%,and10%in50-yearPE(returnperiods of2475,975,and475years,respectively).Epistemicuncertainty,intheformofselectedpercentiles,isalsoprovidedfora suiteoftestsitesandallgridpointsinthestudyregionforlimitedperiods,siteconditions,andPEs.
Whencomparingthe2025PRVINSHMwiththe2003PRVINSHM,hazardisgenerallyhigheratshorterperiodsand loweratlongerperiods.Formostareas,backgroundgriddedseismicitysources(bothactivecrustalandintraslab)control andcontributetohazardincreasesinthe2025PRVINSHM,bothatshortandlongperiods.Theexceptionisforsitesright nexttoanexplicitlymodeledactivecrustalfaultsourcethatwasnotincludedinthe2003PRVINSHM,inwhichcasethe activecrustalfaultsourcetendstobethemaincontrollingsourceandcontributortohazardincreases.Newaleatory variabilitymodels,period-specificmediangroundmotions,andtheNGA-SubductionGMMsinthe2025PRVI NSHMalsocontributetoincreasesatshorterperiodsanddecreasesatlongerperiods.Resultsalsoshowthatforthe fullPRVIregion,the2003PRVINSHMtotalmeanhazardisfullycontainedwithinthe2025PRVINSHM’sepistemic uncertaintydistribution.Meaning,the2025PRVINSHMfullycapturestheresultsofthe2003PRVINSHM.
Continueddatacollectionandimprovedaccuracyofinputmodelscanhelpreduceuncertaintiesforpotentialfuture NHSMs.TheNSHMsarecommunity-andconsensus-basedmodelsthatstrivetomeetthegoalofincorporatingthelatest data,methods,andmodelscurrentlyavailableandevaluatedtobetechnicallyacceptable(Jordanetal.2023).Public workshops,apubliccommentperiod,peerreview,andtechnicalevaluationbythreereviewpanelshelpedusmeetthis goalforthe2025PRVINSHM.Whilewegenerallyindicatethatourtime-independentmodelsareapplicableforreturn periodsgreaterthan 475years(andlessthan 10,000years),thereisnowell-definedcutoffthatappliestoallapplicationssouserscanattempttoevaluateapplicabilityonacase-by-casebasis.
Acknowledgments
TheauthorswishtothanktheU.S.GeologicalSurvey(USGS)EarthquakeHazardsProgramforfundingthisstudy.WethankDemi GirotforhelpingwithliteraturesearchesandcomputerscriptsandChuckMuellerforassistancewiththeearthquakecatalogcodes. TheauthorsthankOliverBoydforprovidingsedimentthicknessdatasetsandfeedbacktoaidintheanalysisofnear-surfacegeologic structureinthePuertoRicoandU.S.VirginIslands(PRVI)region.TheauthorsthanktheEarthquakeGeologyWorkingGroupmembers(ChrisDuRoss,NadineReitman,SylviaNicovich,CamilleCollet,UritenBrink,KatherineScharer,StephenDeLong,andStephen Hughes)andPRVISubductionWorkingGroupmemberUritenBrinkfortheirdevelopmentofmodelinputs.TheauthorsthankVictor Huérfano,AlbertoLópez-Venegas,JoséMartínez-Cruzado,andElizabethVanacoreattheUniversityofPuertoRicoatMayagüezfor theirclosecollaborationwiththeNationalSeismicHazardModel(NSHM)Projectduringthedevelopmentofthe2025PRVINSHM. Theauthorsthankthemanyparticipantsofthepublicworkshopsthatwereheldthroughoutthe2025PRVINSHMupdateprocess,and theColegiodeIngenierosyAgrimensoresdePuertoRicoforhostingtheAugust28 29,2024,workshopinSanJuan,PuertoRico.The authorsthankthosewhoprovidedpublicreviewcomments,AECOM,Dr.JamesHengeshofInterfaceGeohazardConsulting,and RicardoHerrera.Theauthorsthankthead-hocPRVIEarthquakeRuptureForecast(ERF)ReviewPanelmembers(TomJordan[chair], NormAbrahamson,JohnAnderson,KenCampbell,HeatherDeShon,RuthHarris,ChristavonHillebrandt-Andrade,SusanHough, RolandLaForge,AlbertoLópez-Venegas,AndrewMakdisi,WarnerMarzocchi,GabrielToro,JessicaVelasquez,andIvanWong)for helpfulfeedbackontheERFmodel.TheauthorsthanktheGround-MotionCharacterization(GMC)ReviewPanelmembers(Jon Stewart[chair],NickGregor[vice-chair],NormAbrahamson,LindaAlAtik,AshlyCabas,KenCampbell,JoséMartínez-Cruzado, ShahramPezeshk,andEmelSeyhan)forhelpfulfeedbackontheGMCmodel.TheauthorsthanktheNSHMProjectSteering Committeemembers(JonStewart[chair],JohnAnderson[formerchair],GailAtkinson,JackBaker,KenCampbell[formermember], HeatherDeShon,NickGregor,TomJordan,KeithKelson,JanieleMaffei,NileshShome[formermember],andIvanWong)forreview ofthe2025PRVINSHM,includingprovidinginsightfulcommentsandsuggestionswhichstrengthenedthemanuscript’sclarityand argument.TheauthorsthankOliverBoydandArtFrankelforalsoprovidinghelpfulfeedbackonthemanuscript.Finally,theauthors wishtothankthereviewersandeditorsof EarthquakeSpectra (includingBrendonBradley,MarcoPagani,andaanonymousreviewer) andUSGSreviewersRyanGold,BrianShiro,andKristenMarraforreviewingthismanuscriptandprovidinghelpfulcommentsand suggestions.Anyuseoftrade,firm,orproductnamesisfordescriptivepurposesonlyanddoesnotimplyendorsementbytheU.S. Government.
Funding
ThisstudywassupportedbyU.S.GeologicalSurveyEarthquakeHazardsProgram.
ConflictsofInterest
Theauthorsdeclarenoconflictsofinterest.
DataAvailabilityStatement
Alldatapresentedinthisarticleareavailablefrompublishedsourceslistedinthereferences.Meanhazardcurvesanduniform-hazard groundmotionsforthe2003PuertoRicoandU.S.Virgin Islands(PRVI)NationalSeismicHazardModel(NSHM)(Shumwayetal., 2019)areavailableatdoi:10.5066/P9JYH45T.Theearthquakegeologyinputs(ThompsonJobeetal.2024a)areavailableat doi:10.5066/P9ONHNOD.Theground-motionrecordsandsiteinformation(Aagaardetal.2025)areavailableatdoi:10.5066/ P14E4GXW.Thecatalogseparationcode(Haynie2024)isavailableatdoi:10.5066/P13E7CAY.ThePSHAcomputercodesandsource models(OpenSHA, Fieldetal.2003; nshmp-haz and nshmp-lib, Powersetal.2022a, 2022b; nshm-prvi, Powersetal.2026)areavailable publiclyonGitHubat https://github.com/opensha/ (lastaccessedApril2026)andGitLabat https://doi.org/10.5066/P9STF5GK, https://doi. org/10.5066/P9DKFJ5V,and https://doi.org/10.5066/P1QBHGB3,respectively.Disaggregationandresponsespectraresultsandplotswere generatedusingtheUSGSEarthquakeHazardToolbox(ClaytonandPowers2023)atdoi:10.5066/P9UAIISFand https://earthquake.usgs. gov/nshmp/ (lastaccessedApril2026).Fullepistemicuncertaintyresults,aswellasfiguresforthefullsuiteof86testsites,andforallgrid pointsinthestudyregion,areavailableat: https://data.opensha.org/nshm25-prvi/ (lastaccessedApril2026).Selectsupportingmodeldata, andmodelresults,includingseismicitycatalogs,smoothedseismicityspatialPDFs,smoothedseismicityrates,subductioninterfacefault geometryandgeologicdeformationmodelparameters,fault-systemsolutionsfortheERF(branch-averagedandepistemic),meanhazard curvesanduniform-hazardgroundmotions,epistemicuncertaintydata,andhazardandriskmapsareavailablein Shumwayetal.(2025) at https://doi.org/10.5066/P14ATJLJ.SupportingInformationforthisarticleincludesadditionaltablesandfiguresthatcanbefoundinthefile esp470055-sup-0001-SuppData-S1.pdf.
36of43 EarthquakeSpectra,2026
References
Aagaard,B.T.,M.P.Moschetti,andK.B.Withers.2026. “SuitabilityofWesternUnitedStatesGround-MotionModelsforuseinPuerto RicoandtheU.S.VirginIslands.” EarthquakeSpectra https://doi.org/10.1002/esp4.70047
Aagaard,B.T.,W.J.Stephenson,S.K.Ahdi,andJ.A.Herrick.2025.Ground-MotionRecordsandSiteInformationforPuertoRicoand theU.S.VirginIslands,2006-2024.CenterforEngineeringStrongMotionData(CESMD).
Abrahamson,N.A.,andZ.Gülerce.2022. “SummaryoftheAbrahamsonandGulerceNGA-SUBGround-MotionModelforSubduction Earthquakes.” EarthquakeSpectra 38,no.4:2638–2681. https://doi.org/10.1177/87552930221114374. Abrahamson,N.A.,W.J.Silva,andR.Kamai.2014. “SummaryoftheASK14GroundMotionRelationforActiveCrustalRegions.” EarthquakeSpectra 30,no.3:1025–1055. https://doi.org/10.1193/070913EQS198M.
Ake,J.2018. “UncertaintiesinProbabilisticSeismicHazardAnalysesforRegionsofLow-to-ModerateSeismicPotential:TheNeedfora StructuredApproach.” U.S.NuclearRegulatoryCommissionNUREG-SeriesML080870337.18.LastaccessedApril2026.Available at: https://www.nrc.gov/docs/ML0808/ML080870337.pdf
Akkar,S.,M.A.Sandikkaya,andJ.J.Bommer.2014. “EmpiricalGround-MotionModelsforPoint-andExtended-SourceCrustal EarthquakeScenariosinEuropeandtheMiddleEast.” BulletinofEarthquakeEngineering 12:359–387. https://doi.org/10.1007/ s10518-013-9461-4
AlAtik,L.2015. “NGA-East:Ground-MotionStandardDeviationModelsforCentralandEasternNorthAmerica.” PacificEarthquake EngineeringResearchCenterPEERReportNo.2015/07.181.LastaccessedApril2026. https://peer.berkeley.edu/sites/default/files/ webpeer-2015-07-linda_al_atik.pdf
Algermissen,S.T.,andD.M.Perkins.1976. “AProbabilisticEstimateoftheMaximumAccelerationinRockintheContiguousUnited States.” U.S.GeologicalSurveyOpen-FileReport76-416.45. https://doi.org/10.3133/ofr76416
Allstadt,K.E.,E.M.Thompson,D.BayouthGarcía,etal.2020. “FieldObservationsofGroundFailureTriggeredbythe2020PuertoRico EarthquakeSequence. ” U.S.GeologicalSurveyDataRelease. https://doi.org/10.5066/P96QNFMB.
Ancheta,T.D.,R.B.Darragh,J.P.Stewart,etal.2014. “NGA-West2Database.” EarthquakeSpectra 30,no.3:989–1005. https://doi.org/ 10.1193/070913EQS197M.
Atkinson,G.M.,andD.Motazedian.2013. “Ground-MotionAmplitudesforEarthquakesinPuertoRico.” BulletinoftheSeismological SocietyofAmerica 103,no.3:1846–1859. https://doi.org/10.1785/0120120130
Baker,J.W.,B.A.Bradley,andP.J.Stafford.2021. SeismicHazardandRiskAnalysis.581.CambridgeUniversityPress. Benford,B.,C.DeMets,andE.Calais.2012. “GPSEstimatesofMicroplateMotions,NorthernCaribbean:EvidenceforaHispaniola MicroplateandImplicationsforEarthquakeHazard.” GeophysicalJournalInternational 191,no.2:481–490. https://doi.org/10. 1111/j.1365-246X.2012.05662.x.
Bindi,D.,M.Massa,L.Luzi,etal.2014. “Pan-EuropeanGround-MotionPredicationEquationsfortheAverageHorizontalComponent ofPGA,PGV,and5%-DampedPSAatSpectralPeriodsupto3.0sUsingtheRESORCEDataset.” BulletinofEarthquakeEngineering 12:391–430. https://doi.org/10.1007/s10518-013-9525-5.
Bommer,J.J.,J.P.Ake,andC.G.Munson.2023. “SeismicSourceZonesforSite-SpecificProbabilisticSeismicHazardAnalysis:The VeryRealQuestionsRaisedbyVirtualFaultRuptures.” SeismologicalResearchLetters 94,no.4:1900–1911. https://doi.org/10.1785/ 0220230037
Boore,D.M.,J.P.Stewart,E.Seyhan,andG.M.Atkinson.2014. “NGA-West2EquationsforPredictingPGA,PGV,and5%Damped PSAforShallowCrustalEarthquakes.” EarthquakeSpectra 30,no.3:1057–1085. https://doi.org/10.1193/070113EQS184M
Bozorgnia,Y.,N.A.Abrahamson,S.K.Ahdi,etal.2022, “NGA-SubductionResearchProgram,” EarthquakeSpectra 38,no.2:783–798. https://doi.org/10.1177/87552930211056081
Bozorgnia,Y.,N.A.Abrahamson,L.A.Atik,etal.2014. “NGA-West2ResearchProject.” EarthquakeSpectra 30,no.3:973–987. https:// doi.org/10.1193/072113EQS209M.
BuildingSeismicSafetyCouncil(BSSC).2020. “NEHRPRecommendedSeismicProvisionsforNewBuildingsandOtherStructures.” FederalEmergencyManagementAgency(FEMA)ReportP-2082-1.555.LastaccessedApril2026.Availableat: https://www.fema. gov/sites/default/files/2020-10/fema_2020-nehrp-provisions_part-1-and-part-2.pdf. Calais,É.,S.J.Symithe,B.M.deLépinay,andC.Prépetit.2016. “PlateBoundarySegmentationintheNortheasternCaribbeanfrom GeodeticMeasurementsandNeogeneGeologicalObservations.” ComptesRendusGéoscience 348,no.1:42–51. https://doi.org/10. 1016/j.crte.2015.10.007.
Campbell,K.W.,andY.Bozorgnia.2014. “NGA-West2GroundMotionModelfortheAverageHorizontalComponentsofPGA,PGV, and5%DampedLinearAccelerationResponseSpectra.” EarthquakeSpectra 30,no.3:1087–1115. https://doi.org/10.1193/ 062913EQS175M
Cauzzi,C.,E.Faccioli,M.Vanini,andA.Bianchini.2015. “UpdatedPredictiveEquationsforBroadband(0.01-10s)Horizontal ResponseSpectraandPeakGroundMotions,BasedonaGlobalDatasetofDigitalAccelerationRecords.” Bulletinof EarthquakeEngineering 13,no.6:1587–1612. https://doi.org/10.1007/s10518-014-9685-y
Chiou,B.S.J.,andR.R.Youngs.2014. “UpdateoftheChiouandYoungsNGAModelfortheAverageHorizontalComponentofPeak GroundMotionandResponseSpectra.” EarthquakeSpectra 30,no.3:1117–1153. https://doi.org/10.1193/072813EQS219M.
ClarosGómez,D.F.2022. “GroundMotionPredictionEquationsforPuertoRico.” DoctorofPhilosophyinCivilEngineering, UniversityofPuertoRico.171.LastaccessedApril2026.Availableat: https://hdl.handle.net/20.500.11801/2874
Clayton,B.S.andP.M.Powers.2023. “USGSEarthquakeHazardToolbox:Nshmp-Apps.” U.S.GeologicalSurveySoftwareRelease. https://doi.org/10.5066/P9UAIISF
Contreras,V.,J.P.Stewart,T.Kishida,etal.2022. “NGA-SubSourceandPathDatabase.” EarthquakeSpectra 38,no.2:799–840. https://doi.org/10.1177/87552930211065054
Cornell,C.A.1968. “EngineeringSeismicRiskAnalysis.” BulletinoftheSeismologicalSocietyofAmerica 58,no.5:1583–1606. https:// doi.org/10.1785/BSSA0580051583.
Cromwell,C.W.,K.P.Furlong,E.A.Bergman,H.M.Benz,W.L.Yeck,andM.Herman.2021. “SeismotectonicAnalysisofthe20192020PuertoRicoSequence:TheValueofAbsoluteEarthquakeRelocationsinImprovedInterpretationsofActiveTectonics.” SeismologicalResearchLetters 93,no.2A:544–554. https://doi.org/10.1785/0220210238.
DeMets,C.,P.E.Jansma,G.S.Mattioli,etal.2000. “GPSGeodeticConstraintsonCaribbean-NorthAmericaPlateMotion.” Geophysics ResearchLetters 27,no.3:437–440. https://doi.org/10.1029/1999GL005436
Dolan,J.F.,H.T.Mullins,andD.J.Wald.1998. “ActiveTectonicsoftheNorth-CentralCaribbean:ObliqueCollision,Strain Partitioning,andOpposingSubductedSlabs.” InActiveStrike-SlipandCollisionalTectonicsoftheNorthernCaribbeanPlate BoundaryZone.editedbyJ.F.DolanandP.Mann.1–61.GeologicalSurveyofAmericaSpecialPaper326.
Doser,D.I.,C.M.Rodriguez,andC.Flores.2005. “HistoricalEarthquakesofthePuertoRico-VirginIslandsRegion(1915-1963).” In ActiveTectonicsandSeismicHazardsofPuertoRico,theVirginIslands,andOffshoreAreas.editedbyP.Mann.103–114.Geological SocietyofAmericaSpecialPaper385. FederalEmergencyManagementAgency(FEMA).2024. “HazusEarthquakeModelTechnicalManual(Hazus6.1).” 477.Lastaccessed April2026.Availableat: https://www.fema.gov/sites/default/files/documents/fema_hazus-earthquake-model-technical-manual-61.pdf
Field,E.H.,A.E.Hatem,B.E.Shaw,etal.2025. “AScientificVisionandRoadmapforEarthquakeRuptureForecastDevelopments,a USGSPerspective.” BulletinoftheSeismologicalSocietyofAmerica 115,no.6:2523–2552. https://doi.org/10.1785/0120240217.
Field,E.H.,T.H.Jordan,andC.A.Cornell.2003. “OpenSHA:ADevelopingCommunity-ModelingEnvironmentforSeismicHazard Analysis.” SeismologicalResearchLetters 74,no.4:406–419. https://doi.org/10.1785/gssrl.74.4.406.
Field,E.H.,K.R.Milner,A.E.Hatem,etal.2023. “TheUSGS.2023ConterminousU.S.Time-IndependentEarthquakeRupture Forecast.” BulletinoftheSeismologicalSocietyofAmerica 114,no.1:523–571. https://doi.org/10.1785/0120230120
Field,E.H.,K.R.Milner,andN.Luco.2021. “TheSeismicHazardImplicationsofDeclusteringandPoissonAssumptionsInferredfrom aFullyTime-DependentModel.” BulletinoftheSeismologicalSocietyofAmerica 112,no.1:527–537. https://doi.org/10.1785/ 0120210027
Field,E.H.,K.R.Milner,M.T.Page,W.H.Savran,andN.vanderElst.2021. “ImprovementstotheThirdUniformCalifornia EarthquakeRuptureForecastETASModel(UCERF3-ETAS).” TheSeismicRecord 1,no.2:117–125. https://doi.org/10.1785/ 0320210017
Field,E.H.,K.R.Milner,andK.A.Porter.2025. “RiskImplicationsofPoissonAssumptionsandDeclusteringInferredfromaFully Time-DependentEarthquakeForecast.” EarthquakeSpectra 41,no.3:1977–1997. https://doi.org/10.1177/87552930251340677
Frankel,A.,S.Harmsen,C.Mueller,E.Calais,andJ.Haase.2011. “SeismicHazardMapsforHaiti.” EarthquakeSpectra 27,no.1S1:23–41. https://doi.org/10.1193/1.3631016.
Frankel,A.D.,C.S.Mueller,T.P.Barnhard,etal.1996. “NationalSeismic-HazardMaps:DocumentationJune1996.” U.S.Geological SurveyOpen-FileReport96-532.110. https://doi.org/10.3133/ofr96532
Frankel,A.D.,M.D.Petersen,C.S.Mueller,etal.2002. “Documentationforthe2002UpdateoftheNationalSeismicHazardMaps ” U.S. GeologicalSurveyOpen-FileReport2002-420.33. https://doi.org/10.3133/ofr02420.2002
Gardner,J.K.,andL.Knopoff.1974. “IstheSequenceofEarthquakesinSouthernCalifornia,withAftershocksRemoved,Poissonian?.” BulletinoftheSeismologicalSocietyofAmerica 64,no.5:1363–1367. https://doi.org/10.1785/BSSA0640051363
Geist,E.L.,andU.S.tenBrink.2021. “EarthquakeMagnitudeDistributionsonNorthernCaribbeanFaultsfromCombinatorial OptimizationModels.” JournalofGeophysicalResearch:SolidEarth 126,no.10:e2021JB022050. https://doi.org/10.1029/ 2021JB022050
Gerstenberger,M.C.,S.Bora,B.A.Bradley,etal.2023. “The2022AotearoaNewZealandNationalSeismicHazardModel:Process, Overview,andResults.” BulletinoftheSeismologicalSocietyofAmerica 114,no.1:7–36. https://doi.org/10.1785/0120230182.
Goulet,C.A.,Y.Bozorgnia,N.Kuehn,etal.2021. “NGA-EastGround-MotionCharacterizationModelPart1:SummaryofProducts andModelDevelopment.” EarthquakeSpectra 37,no.1S:1231–1282. https://doi.org/10.1177/87552930211018723.
Granja-Bruna,J.L.,U.S.tenBrink,A.Munoz-Martín,A.Carbó-Gorosabel,andP.LlanesEstrada.2015. “ShallowerStructureand GeomorphologyoftheSouthernPuertoRicoOffshoreMargin.” MarineandPetroleumGeology 67:30–56. https://doi.org/10.1016/j. marpetgeo.2015.04.014
Hatem,E.H.,C.M.Collett,R.W.Briggs,etal.2022. “SimplifyingComplexFaultDataforSystems-LevelAnalysis:EarthquakeGeology InputsforU.S.NSHM2023.” ScientificData 9:506. https://doi.org/10.1038/s41597-022-01609-7 2023.
Hatem,E.H.,C.M.Collett,R.D.Gold,etal.2021. “EarthquakeGeologyInputsfortheU.S.NationalSeismicHazardModel(NSHM) 2023,version1.0.” U.S.GeologicalSurveyDataRelease. https://doi.org/10.5066/P918XCUU
Hatem,A.H.,K.R.Milner,R.W.Briggs,andJ.A.ThompsonJobe.2026. “MakingManyOutofOne:SyntheticGeologicDeformation ModelDistributionsforuseinUSGSNSHM25PuertoRico-VirginIslandsUpdate.” SeismologicalResearchLetters. https://doi.org/ 10.1785/0220250094
Hayes,G.2018. “Slab2-AComprehensiveSubductionZoneGeometryModel.” U.S.GeologicalSurveyDataRelease. https://doi.org/10. 5066/F7PV6JNV.
Hayes,G.P.,Moore,G.L.,Portner,D.E.,etal.2018.Slab2,AComprehensiveSubductionZoneGeometryModelScience. Science 362 no.6410:58–61. https://doi.org/10.1126/science.aat4723
Haynie,K.L.2024. “SubductionZoneEarthquakeCatalogSeparationCode,version1.0.” U.S.GeologicalSurveySoftwareRelease. https://doi.org/10.5066/P13E7CAY
Haynie,K.L.,E.M.Thompson,M.Hearne,etal.2025. “SubductionZoneEarthquakeCatalogSeparationTool:Implementationinthe USGS2025PuertoRicoandU.S.VirginIslandsNationalSeismicHazardModel.” SeismologicalResearchLetters 97:1191–1200. https://doi.org/10.1785/0220250078
Helmstetter,A.,Y.Y.Kagan,andD.D.Jackson.2007. “High-ResolutionTime-IndependentGrid-BasedForecastforM ≥ 5Earthquakes inCalifornia.” SeismologicalResearchLetters 78,no.1:78–86. https://doi.org/10.1785/gssrl.78.1.78.
Herrick,J.A.,M.D.Petersen,O.S.Boyd,B.T.Aagaard,andM.P.Moschetti.2024. “AmplificationModelComponentsforPuertoRico andtheU.S.VirginIslands..” InLatinAmericanandCaribbeanSeismologicalCommission5thAssembly.
Huérfano,V.A.,andG.Lin.2022. “CharacteristicsofseismicityinPuertoRicoandtheU.S.VirginIslands:Collaborativeresearchwith UniversityofMiamiandUniversityofPuertoRicoMayagüez,FinalTechnicalReport(September12,2022).” ExternalGrantAward NumbersG21AP10251andG21AP10252.60.LastaccessedApril2026.Availableat: https://earthquake.usgs.gov/cfusion/ external_grants/reports/G21AP10252.pdf.
Jaiswal,K.,J.Rozelle,M.Tong,etal.2023. “HazusEstimatedAnnualizedEarthquakeLossesfortheUnitedStates.” FederalEmergency ManagementAgency(FEMA)ReportP-366.88.LastaccessedApril2026.Availableat:https://www.fema.gov/sites/default/files/ documents/fema_p-366-hazus-estimated-annualized-earthquake-losses-united-states.pdf
Jansma,P.E.,G.S.Mattioli,A.Lopez,etal.2000. “NeotectonicsofPuertoRicoandtheVirginIslands,NortheasternCaribbeanfrom GPSGeodesy.” Tectonics 19,no.6:1021–1037. https://doi.org/10.1029/1999TC001170 Johnson,K.,T.Chartier,M.Pagani,etal.2024. “ProbabilisticSeismicHazardAnalysisfortheDominicanRepublic.” Earthquake Spectra 40,no.4:2504–2544. https://doi.org/10.1177/87552930241263618
Jordan,T.H.,N.Abrahamson,J.G.Anderson,etal.2023. “PanelReviewoftheUSGS.2023ConterminousU.S.Time-Independent EarthquakeRuptureForecast.” BulletinoftheSeismologicalSocietyofAmerica 114,no.1:572–607. https://doi.org/10.1785/ 0120230140
Jordan,T.H.,N.Abrahamson,J.G.Andersonetal.2026. “PanelReviewoftheUSGS2025PuertoRicoandU.S.VirginIslandsTimeIndependentEarthquakeRuptureForecast.” ReporttoUSGSNationalSeismicHazardModelProjectanditsSteeringCommittee. UniversityofCaliforniaE-Scholarshipreport.April21,2026.77. https://doi.org/10.82158/B11599.
Keefer,D.L.,andS.E.Bodily.1983. “Three-PointApproximationsforContinuousRandomVariables.” ManagementScience 29,no.5: 595–609. https://doi.org/10.1287/mnsc.29.5.595.
Klein,F.W.,A.D.Frankel,C.S.Mueller,R.L.Wesson,andP.G.Okubo.2001. “SeismicHazardinHawaii:HighRateofLarge EarthquakesandProbabilisticGround-MotionMaps.” BulletinoftheSeismologicalSocietyofAmerica 91,no.3:479–498. https://doi.org/10.1785/0120000060.
Kotha,S.R.,G.Weatherill,D.Bindi,andF.Cotton.2020. “ARegionally-AdaptableGround-MotionModelforShallowCrustal EarthquakesinEurope.” BulletinofEarthquakeEngineering 18,no.9:4091–4125. https://doi.org/10.1007/s10518-020-00869-1
Kramer,S.L.,andJ.P.Stewart.2024. GeotechnicalEarthquakeEngineering.2nded.1060.CRCPress.
Kuehn,N.M.,Y.Bozorgnia,K.W.Campbell,andN.Gregor.2023. “ARegionalizedPartiallyNonergodicGround-MotionModelfor SubductionEarthquakesUsingtheNGA-SubDatabase.” EarthquakeSpectra 39,no.3:1625–1657. https://doi.org/10.1177/ 87552930231180906
LaForge,R.C.,andW.R.McCann.2005. “ASeismicSourceModelforPuertoRico,foruseinProbabilisticGroundMotionHazard Analysis.” InActiveTectonicsandSeismicHazardsofPuertoRico,theVirginIslands,andOffshoreAreas.editedbyP.Mann. 223–248.GeologicalSocietyofAmericaSpecialPaper385.
Lander,J.F.,L.S.Whiteside,andP.A.Lockridge.2002. “ABriefHistoryofTsunamiintheCaribbeanSea.” InternationalJournalofthe TsunamiSociety 20,no.2:57–94.
Lindberg,N.S.,A.L.Leeds,C.ToroAcosta,andW.J.Stephenson.2025. “Shear-WaveVelocitySurfaceSeismicSiteCharacterization Dataat21SitesinPuertoRico.” U.S.GeologicalSurveyDataRelease. https://doi.org/10.5066/P134BAGK
Llenos,A.L.,A.J.Michael,K.L.Haynie,A.M.Shumway,andJ.A.Herrick.2025. “UsingGriddedSeismicitytoForecasttheLongTermSpatialDistributionofEarthquakesforthe2025PuertoRicoandU.S.VirginIslandsNationalSeismicHazardModel.” SeismologicalResearchLetters https://doi.org/10.1785/0220250043
Llenos,A.L.,A.J.Michael,A.M.Shumway,etal.2024. “ForecastingtheLong-TermSpatialDistributionofEarthquakesforthe 2023U.S.NationalSeismicHazardModelUsingGriddedSeismicity.” BulletinoftheSeismologicalSocietyofAmerica 114, no.4:2028–2053. https://doi.org/10.1785/0120230220
Manaker,D.M.,E.Calais,A.M.Freed,etal.2008. “InterseismicPlateCouplingandStrainPartitioningintheNortheastern Caribbean.” GeophysicalJournalInternational 174,no.3:889–903. https://doi.org/10.1111/j.1365-246X.2008.03819.x McCann,W.,L.Feldman,andM.McCann.2010. “CatalogofFeltEarthquakesforPuertoRicoandNeighboringIslands1493-1899with AdditionalInformationforSome20thCenturyEarthquakes.” RevistaGeofísica 62:141–293. McGuire,R.K.2004. SeismicHazardandRiskAnalysis.221.SecondMonographSeriesMNO-10.EarthquakeEngineeringResearch Institute.
McPhillips,D.F.,J.A.Herrick,S.Ahdi,A.K.Yong,andS.Haefner.2020. “UpdatedCompilationofVS30 DatafortheUnitedStates.” U.S.GeologicalSurveyDataRelease. https://doi.org/10.5066/P9H5QEAC Michael,A.J.,andA.L.Llenos.2025. “CapturingtheUncertaintyofSeismicityObservationsinEarthquakeRateEstimatesand ImplicationsforProbabilisticSeismicHazardAnalysisandtheUSGSNationalSeismicHazardModel.” Bulletinofthe SeismologicalSocietyofAmerica https://doi.org/10.1785/0120240245
Milner,K.R.,andE.H.Field.2023. “AComprehensiveFault-SystemInversionApproach:MethodsandApplicationstoNSHM23.” BulletinoftheSeismologicalSocietyofAmerica 114,no.1:486–522. https://doi.org/10.1785/0120230122.
Milner,K.R.,A.E.Hatem,R.W.Briggs,etal.2026. “USGS2025PuertoRicoandU.S.VirginIslandsTime-IndependentEarthquake RuptureForecast.” BulletinoftheSeismologicalSocietyofAmerica. https://doi.org/10.1785/0120250040.
Milner,K.R.,B.E.Shaw,andE.H.Field.2022. “EnumeratingPlausibleMultifaultRupturesinComplexFaultSystemswith PhysicalConstraints.” BulletinoftheSeismologicalSocietyofAmerica 112,no.4:1806–1824. https://doi.org/10.1785/ 0120210322
Miranda,E.,J.Archbold,P.Heresi,etal.2020. “StEER – PuertoRicoEarthquakeSequenceDecember2019toJanuary2020:Field AssessmentStructuralTeam(FAST)EarlyAccessReconnaissanceReport(EARR).” DesignSafe-CIReportPRJ-2712.173. https:// doi.org/10.17603/ds2-h0kd-5677
Moschetti,M.P.2015. “ALong-TermEarthquakeRateModelfortheCentralandEasternUnitedStatesfromSmoothedSeismicity.” BulletinoftheSeismologicalSocietyofAmerica 105,no.6:2928–2941. https://doi.org/10.1785/0120140370
Moschetti,M.P.2026. “Ground-MotionAleatoryVariabilityModelsforPuertoRicoandtheU.S.VirginIslands,” EarthquakeSpectra. https://doi.org/10.1002/esp4.70026
Moschetti,M.P.,B.T.Aagaard,S.K.Ahdi,etal.2024. “The2023USNationalSeismicHazardModel:Ground-MotionCharacterization fortheConterminousUnitedStates.” EarthquakeSpectra 40,no.2:1158–1190. https://doi.org/10.1177/87552930231223995.
Moschetti,M.P.,B.T.Aagaard,K.B.Withers,etal.2026. “Ground-MotionCharacterizationfortheU.S.NationalSeismicHazard ModelforPuertoRicoandtheU.S.VirginIslands.” EarthquakeSpectra.inpress. Motazedian,D.,andG.Atkinson.2005. “Ground-MotionRelationsforPuertoRico.” InActiveTectonicsandSeismicHazardsofPuerto Rico,theVirginIslands,andOffshoreAreas.editedbyP.Mann,61–80.GeologicalSocietyofAmericaSpecialPaper385. Mueller,C.,A.Frankel,M.Petersen,andE.Leyendecker.2010. “NewSeismicHazardMapsforPuertoRicoandtheU.S.Virgin Islands.” EarthquakeSpectra 26,no.1:169–185. https://doi.org/10.1193/1.3277667
Mueller,C.S.2018. “EarthquakeCatalogsfortheUSGSNationalSeismicHazardMaps.” SeismologicalResearchLetters 90,no.1:251–261. https://doi.org/10.1785/0220170108.
Mueller,C.S.,A.D.Frankel,M.D.Petersen,andE.V.Leyendecker.2003. “Documentationfor2003USGSSeismicHazard MapsforPuertoRicoandtheU.S.VirginIslands.” U.S.GeologicalSurveyOpen-FileReport2003-379.9. https://doi.org/10. 3133/ofr03379
Mueller,C.S.,K.M.Haller,N.Luco,M.D.Petersen,andA.D.Frankel.2012. “SeismicHazardAssessmentforGuamandtheNorthern MarianaIslands.” U.S.GeologicalSurveyOpen-FileReport2012-1015.52. https://doi.org/10.3133/ofr20121015.
Murry,P.B.,D.Feliciano,B.H.Goldwyn,A.B.Liel,O.Arroyo,andA.Javernick-Will.2022. “SeismicSafetyofInformallyConstructed ReinforcedConcreteHousesinPuertoRico.” EarthquakeSpectra 39,no.1:5–33. https://doi.org/10.1177/87552930221123085
Parker,G.A.,J.P.Stewart,D.M.Boore,G.M.Atkinson,andB.Hassani.2022. “NGA-SubductionGlobalGroundMotionModelswith RegionalAdjustmentFactors.” EarthquakeSpectra 38,no.1:456–493. https://doi.org/10.1177/87552930211034889
Petersen,M.D.,A.D.Frankel,S.C.Harmsen,etal.2008. “Documentationforthe2008UpdateoftheUnitedStatesNationalSeismic HazardMaps.” U.S.GeologicalSurveyOpen-FileReport2008-1128.66. https://doi.org/10.3133/ofr20081128
Petersen,M.D.,S.C.Harmsen,K.S.Rukstales,etal.2012. “SeismicHazardofAmericanSamoaandNeighboringSouthPacificIslands Methods,Data,Parameters,andResults.” U.S.GeologicalSurveyOpen-FileReport2012-1087.98. https://doi.org/10.3133/ ofr20121087
Petersen,M.D.,M.P.Moschetti,P.M.Powers,etal.2014. “Documentationforthe2014UpdateoftheUnitedStatesNationalSeismic HazardMaps.” U.S.GeologicalSurveyOpen-FileReport2014-1091.243. https://doi.org/10.3133/ofr20141091.
Petersen,M.D.,M.P.Moschetti,P.M.Powers,etal.2015. “The2014UnitedStatesNationalSeismicHazardModel.” Earthquake Spectra 31,no.1S:S1–S30. https://doi.org/10.1193/120814EQS210M
Petersen,M.D.,A.M.Shumway,P.M.Powers,etal.2020. “The2018UpdateoftheU.S.NationalSeismicHazardModel:Overviewof ModelandImplications.” EarthquakeSpectra 36,no.1:5–41. https://doi.org/10.1177/8755293019878199
Petersen,M.D.,A.M.Shumway,P.M.Powers,etal.2022. “2021USNationalSeismicHazardModelfortheStateofHawaii.” EarthquakeSpectra 38,no.2:865–916. https://doi.org/10.1177/87552930211052061
Petersen,M.D.,A.M.Shumway,P.M.Powers,etal.2024. “The2023U.S.50-StateNationalSeismicHazardModel:Overviewand Implications.” EarthquakeSpectra 40,no.1:5–88. https://doi.org/10.1177/87552930231215428.
Powers,P.M.,J.M.Altekruse,A.L.Llenos,etal.2024. “The2023AlaskaNationalSeismicHazardModel.” EarthquakeSpectra 40,no. 4:2545–2597. https://doi.org/10.1177/87552930241266741
Powers,P.M.,B.S.Clayton,andJ.M.Altekruse.2022a. “nshmp-Haz:NationalSeismicHazardModelProjectHazardApplicationsand WebServices.” U.S.GeologicalSurveySoftwareRelease. https://doi.org/10.5066/P9STF5GK
Powers,P.M.,B.S.Clayton,andJ.M.Altekruse.2022b. “nshmp-Lib:NationalSeismicHazardModelProcessingLibrary.Software Release.” U.S.GeologicalSurveySoftwareRelease. https://doi.org/10.5066/P9DKFJ5V
Powers,P.M.,K.R.Milner,andJ.M.Altekruse.2026. “nshm-Prvi:NationalSeismicHazardModelforPuertoRicoandtheU.S.Virgin Islands.” U.S.GeologicalSurveySoftwareRelease. https://doi.org/10.5066/P1QBHGB3. PuertoRicoSeismicNetwork(PRSN).2025. “SignificantEarthquakesinPuertoRico.” LastaccessedApril2026.Availableat: https:// redsismica.uprm.edu/english/education/earthquakes/significant.php.
Reasenberg,P.1985. “Second-OrderMomentofCentralCaliforniaSeismicity,1969-1982.” JournalofGeophysicalResearch:SolidEarth 90,no.B7:5479–5495. https://doi.org/10.1029/JB090iB07p05479
Reiter,L.1990. EarthquakeHazardAnalysis.254.ColumbiaUniversityPress. Reuters.2020. “‘Everyone’sScared’– PuertoRicoDeclaresEmergencyafterEarthquakes.” LastaccessedJanuary2026.Availableat: https://www.reuters.com/article/us-puertorico-quake/puerto-rico-declares-emergency-activates-national-guard-after-earthquakesidUSKBN1Z60SX/.
Rezaeian,S.,M.D.Petersen,M.P.Moschetti,P.Powers,S.C.Harmsen,andA.D.Frankel.2014. “ImplementationofNGA-West2 GroundMotionModelsinthe2014U.S.NationalSeismicHazardMaps.” EarthquakeSpectra 30,no.3:1319–1333. https://doi.org/ 10.1193/062913EQS177M.
Rezaeian,S.,P.M.Powers,A.M.Shumway,etal.2021. “The2018UpdateoftheUSNationalSeismicHazardModel:GroundMotion ModelsintheCentralandEasternUS.” EarthquakeSpectra 37,no.1S:1354–1390. https://doi.org/10.1177/8755293021993837
Russo,R.M.,andA.Villase ˜ nor.1995. “The1946HispaniolaEarthquakesandtheTectonicsoftheNorthAmerican-CaribbeanPlate BoundaryZone,NortheasternHispaniola.” JournalofGeophysicalResearch:SolidEarth 100,no.B4:6265–6280. https://doi.org/10. 1029/94JB02599
Salgado-Gálvez,M.A.,M.Ordaz,S.K.Singh,etal.2023. “ACaribbeanandCentralAmericaSeismicHazardModelforSovereign ParametricInsuranceCoverage.” BulletinoftheSeismologicalSocietyofAmerica 113,no.1:1–22. https://doi.org/10.1785/ 0120220117
Shaw,B.E.2023. “MagnitudeandSlipScalingRelationsforFault-BasedSeismicHazard.” BulletinoftheSeismologicalSocietyof America 113,no.3:924–947. https://doi.org/10.1785/0120220144.
Shumway,A.M.2019. “DataReleaseforthe2003PuertoRicoandU.S.VirginIslandsSeismicHazardModel.” U.S.GeologicalSurvey DataRelease. https://doi.org/10.5066/P9JYH45T.
Shumway,A.M.,K.R.Milner,J.M.Altekruse,etal.2025. “Datasetsforthe2025USGSNationalSeismicHazardModelforPuertoRico andtheU.S.VirginIslands.” U.S.GeologicalSurveyDataRelease. https://doi.org/10.5066/P14ATJLJ
Stewart,J.P.,N.Gregor,N.Abrahamson,etal.2025.PanelReviewofGroundMotionCharacterizationModelforthe2025Updateof theNSHMforPuertoRicoandtheVirginIslands.14.UniversityofCaliforniaLosAngeles. https://doi.org/10.82158/B14W2T?
Stewart,J.,G.Atkinson,J.W.Baker,etal.2026. “Reviewofthe2025PuertoRicoandVirginIslandsNationalSeismicHazardModel.” ReporttotheNationalSeismicHazardModelProject.UniversityofCaliforniaE-Scholarship.April21,2026. https://doi.org/10. 82158/B1WC7C
Symithe,S.,E.Calais,J.B.deChabalier,R.Roberston,andM.Higgins.2015. “CurrentBlockMotionsandStrainAccumulationon ActiveFaultsintheCaribbean.” JournalofGeophysicalResearch:SolidEarth 120,no.5:3748–3774. https://doi.org/10.1002/ 2014JB011779
tenBrink,U.S.,W.H.Bakun,andC.H.Flores.2011. “HistoricalPerspectiveonSeismicHazardtoHispaniolaandtheNortheast CaribbeanRegion.” JournalofGeophysicalResearchSolidEarth 116,no.B12:B12318. https://doi.org/10.1029/2011JB008497. tenBrink,U.S.,andA.M.López-Venegas.2012. “PlateInteractionintheNECaribbeanSubductionZonefromContinuousGPS Observations.” GeophysicalResearchLetters 39,no.10:L10304. https://doi.org/10.1029/2012GL051485
tenBrink,U.S.,S.Marshak,andJ.-L.G.Bru ˜ na.2009. “BivergentThrustWedgesSurroundingOceanicIslandArcs:Insightfrom ObservationsandSandboxModelsoftheNortheasternCaribbeanPlate.” GSABulletin 121,no.11-12:1522–1536. https://doi. org/10.1130/B26512.1
tenBrink,U.S.,E.A.Vanacore,E.J.Fielding,etal.2022. “MatureDiffuseTectonicBlockBoundaryRevealedbythe2020Southwestern PuertoRicoSeismicSequence.” Tectonics 41,no.3:e2021TC006896. https://doi.org/10.1029/2021TC006896
ThompsonJobe,J.,R.W.Briggs,U.tenBrink,etal.2024a. “EarthquakeGeologyInputsforthe2025PuertoRico-U.S.VirginIslands NationalSeismicHazardModelUpdate:CrustalFaultsComponent(version1.0).” U.S.GeologicalSurveyDataRelease. https://doi. org/10.5066/P9ONHNOD
ThompsonJobe,J.,R.W.Briggs,U.tenBrink,etal.2024b. “GeologicInputDatabasesforthe2025PuertoRico U.S.VirginIslands NationalSeismicHazardModelUpdate:CrustalFaultComponent.” SeismologicalResearchLetters 96,no.2A:1018–1044. https:// doi.org/10.1785/0220230222.
ThompsonJobe,J.A.,A.E.Hatem,R.D.Gold,etal.2022a. “EarthquakeGeologyInputsfortheNationalSeismicHazardModel (NSHM)2023(CentralandEasternUnitedStates),Version1.0.” U.S.GeologicalSurveyDataRelease. https://doi.org/10.5066/ P94HLE5G.
ThompsonJobe,J.A.,A.E.Hatem,R.D.Gold,etal.2022b. “RevisedEarthquakeGeologyInputsfortheCentralandEasternUnited StatesandSoutheastCanadaforthe2023NationalSeismicHazardModel.” SeismologicalResearchLetters 93,no.6:3100–3120. https://doi.org/10.1785/0220220162.
TorpeyZimmerman,M.,B.Shen-Tu,K.Shabestari,andM.Mahdyiar.2022. “AComprehensiveHazardAssessmentoftheCaribbean Region.” BulletinoftheSeismologicalSocietyofAmerica 112,no.2:1120–1148. https://doi.org/10.1785/0120210157
U.S.DepartmentofEnergy,ElectricPowerResearchInstitute,andU.S.NuclearRegulatoryCommission.2012. “CentralandEastern UnitedStatesSeismicSourceCharacterizationforNuclearFacilities:NUREG-2115.” LastaccessedApril2025.Availableat:3798. https://www.nrc.gov/reading-rm/doc-collections/nuregs/staff/sr2115/index.html
U.S.GeologicalSurvey(USGS).2017.AdvancedNationalSeismicSystemComprehensiveCatalogofEarthquakeEventsandProducts. U.S.GeologicalSurveyEarthquakeHazardsProgram.
U.S.GovernmentAccountabilityOffice.2024. “PuertoRicoDisasters:ProgressMade,ButtheRecoveryContinuestoFaceChallenges.” ReportGAO-24-105557.LastaccessedApril2026.56.Availableat: https://www.gao.gov/products/gao-24-105557. Vi ˇ cic,B.,S.Momeni,A.Borghi,A.Lomax,andA.Aoudia.2022. “The2019-2020SouthwestPuertoRicoEarthquakeSequence: SeismicityandFaulting.” SeismologicalResearchLetters 93,no.2A:533–543. https://doi.org/10.1785/0220210113. Wald,D.J.,andT.I.Allen.2007. “TopographicSlopeasaProxyforSeismicSiteConditionsandAmplification.” Bulletinofthe SeismologicalSocietyofAmerica 97,no.5:1379–1395. https://doi.org/10.1785/0120060267 Wei,Y.,U.S.tenBrink,andB.F.Atwater.2024. “ModeledFloodingbyTsunamisandaStormversusObservedExtentofCoralErratics onAnegada,BritishVirginIslands FurtherEvidenceforaGreatCaribbeanEarthquakeSixCenturiesAgo.” JournalofGeophysical ResearchSolidEarth 139,no.3:e2023JB028387. https://doi.org/10.1029/2023JB028387
Wesson,R.L.,O.S.Boyd,C.S.Mueller,C.G.Bufe,A.D.Frankel,andM.D.Petersen.2007. “RevisionofTime-Independent ProbabilisticSeismicHazardMapsforAlaska.” Open-Filereportno.2007-1043.U.S.GeologicalSurvey. https://doi.org/10. 3133/ofr20071043.
Wesson,R.L.,A.D.Frankel,C.S.Mueller,andS.C.Harmsen.1999. “ProbabilisticSeismicHazardMapsofAlaska.” Open-Filereport 99-36.U.S.GeologicalSurvey. https://doi.org/10.3133/ofr9936
Withers,K.B.,M.P.Moschetti,B.T.Aagaard,P.M.Powers,J.M.Altekruse,andS.Rezaeian.2026. “The2025PuertoRicoandVirgin IslandU.S.NationalSeismicHazardModelUpdate:Ground-MotionModelSelectionandComparison.” EarthquakeSpectra. https://doi.org/10.1002/esp4.70059.
WorldBankGroup.2025. “PopulationData.” LastaccessedJanuary2026. https://data.worldbank.org/indicator/SP.POP.TOTL Yoon,C.E.,E.S.Cochran,E.A.Vanacore,etal.2023. “ADetailedViewofthe2020-2023SouthwesternPuertoRicoSeismicSequence withDeepLearning.” BulletinoftheSeismologicalSocietyofAmerica 113,no.6:2377–2415. https://doi.org/10.1785/0120220229. Zaliapin,I.,andY.Ben-Zion.2020. “EarthquakeDeclusteringUsingtheNearest-NeighborApproachinSpace-Time-Magnitude Domain.” JournalofGeophysicalResearch:SolidEarth 125,no.4:e2018JB017120. https://doi.org/10.1029/2018JB017120
SupportingInformation
AdditionalsupportinginformationcanbefoundonlineintheSupportingInformationsection.