THE LATEST ON REGIONAL COST TRENDS
COST INDEX Q4 2025

KURT’S KEY UPDATES
THE LATEST ON REGIONAL COST TRENDS
COST INDEX Q4 2025
KURT’S KEY UPDATES
Kurt Jaeger
Executive
Vice President, Preconstruction
jaegerk@claycorp.com
314.595.6373
In Q4 2025, the U.S. construction market showed uneven performance, with overall spending subdued, while nonresidential activity was bolstered by ongoing investment in advanced manufacturing and data center projects. Large-scale AI-driven data center campuses and semiconductor projects sustained demand for structural steel, electrical equipment, and high-capacity mechanical systems, even as commercial and residential construction lagged. Material availability was generally stable but tight in key categories, particularly copper, switchgear, transformers, and specialized HVAC components, keeping lead times extended for power-intensive projects. Contractors entered 2026 cautiously, prioritizing early procurement, strategic sourcing, and schedule risk management to navigate persistent labor constraints and selective supply chain pressures.
Annual Construction Increase of 2.74%
The Clayco Cost Index Q4 2025 provides an overview of regional construction cost trends, highlighting a moderate annual increase of 2.74%. The report includes detailed insights on material and construction producer price indexes, delivery lead times, and cityspecific cost comparisons across various regions. We would like to extend our sincere thanks to our vendors and trade partners for their invaluable contributions in providing the data and insights that helped shape the Clayco Cost Index Q4 2025.
In October 2025, private construction spending increased 0.6% from September and fell 1.9% year-over-year. For the first ten months, spending declined by 1.2% compared to the same period in 2024.
The material indexes are a quarterly compilation from our suppliers, trade partners, self-perform entities and nationally published commodity indexes. The material cost consist of the following: Concrete, Aggregates, Carbon Steel Pipe, Stainless Steel Pipe, Rebar, Wide Flange Steel, 5/8” Drywall, Copper, Hot Milled Sheet Steel, Lumber, Crude Oil and Hot Liquid Asphalt.
National City Cost Index, reference RSMeans 2025 Fourth Quarter. Shown are six of the main markets in each of the four regions. These are weighted averages, leveraging material and labor across all scopes of work. This chart compares city to city cost based on a national average of 1.
NATIONAL AVERAGE = 1.0 National City Cost Index, reference RSMeans 2025 Third Quarter. Shown are six of the main markets in each of the four regions. These are weighted averages, leveraging material and labor across all scopes of work. This chart compares city to city cost based on a national average of 1.
Northeast
These numbers constitute both union & non-union composite rates, as well as year over year changes for the following trades: Concrete Mason, Carpenter, Electrician, Iron Worker, Laborer and Plumber. Midwest
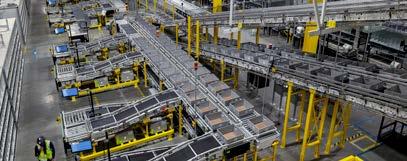
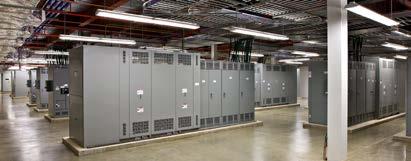
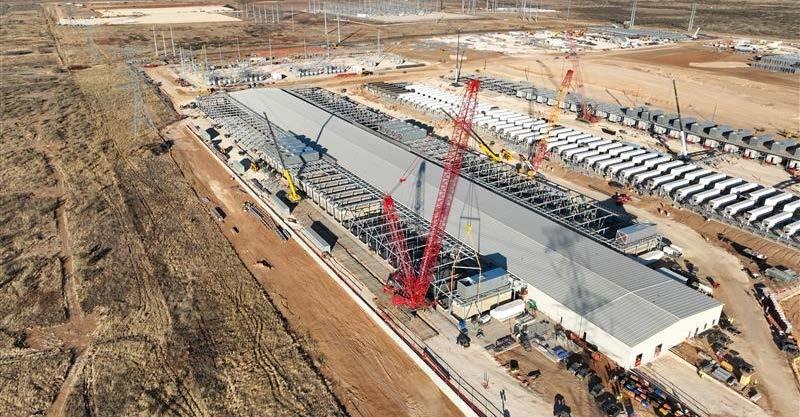
Clayco has partnered with Galaxy Digital to deliver a 133MW liquid-cooled AI infrastructure deployment in Afton, Texas, just outside Lubbock. This initial phase launches a planned gigawattscale build-out at Galaxy’s Helios data center campus. This project demonstrates the full capabilities of Clayco’s integrated enterprise model, with a scope of services including more than 100 integrated power assemblies and more than 90 chillers with associated piping, installation, and use of an on-site batch plant to support massive slab and foundation upgrades, and steel support for structural.
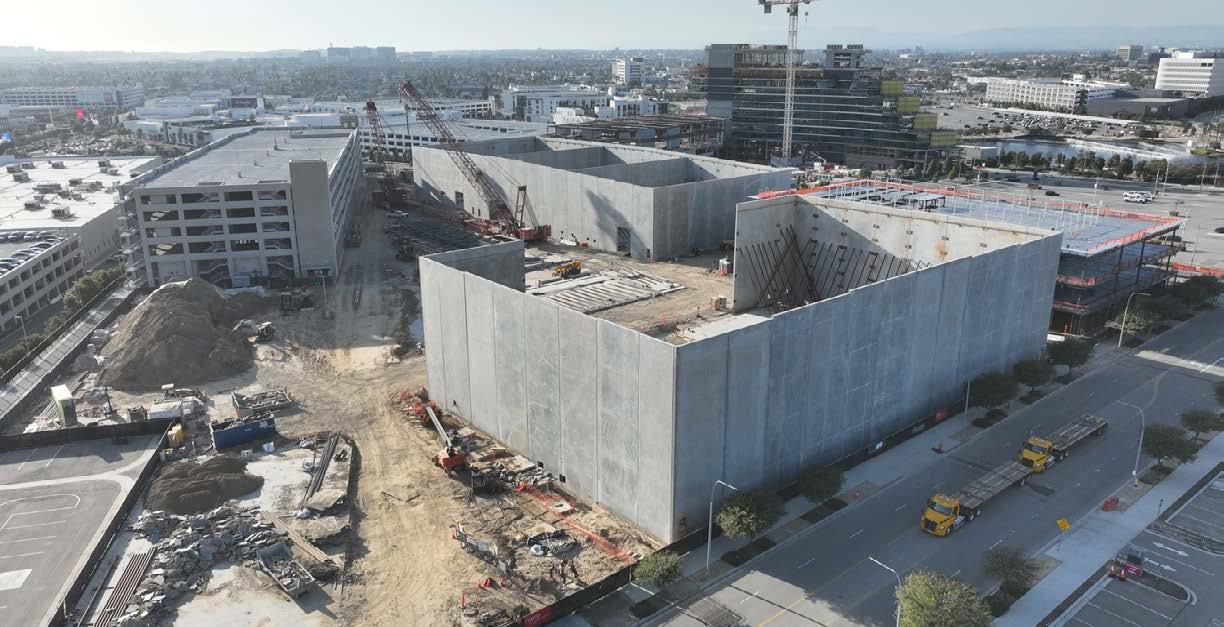
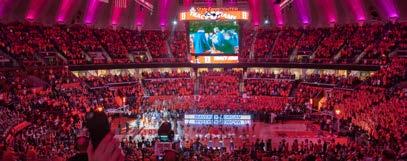
The first phase of Hollywood Park Studios will span 12 acres and feature five 18,000-square-foot sound stages—two of which can combine into a 36,000-square-foot space—along with a three-story, 80,000-square-foot office building and a parking structure for more than 1,000 cars, including space for up to 60 production trailers. The site will initially serve as the International Broadcast Center for the 2028 Olympic and Paralympic Games, hosting global media rights holders and providing offices, studios, and control rooms for around-the-clock coverage.
The following graphs depict material price changes each quarter, with the initial baseline set at Q1 2024. The values represent the percentage change from the initial baseline, offering a clear perspective on quarterly fluctuations in material prices.
STAINLESS STEEL SHEET
STRUCTURAL STEEL
The 2025 Q3 Clayco cost projections for Q4 2025 resulted in a 0.13% variance from the actual Q4 2025 costs.
Atlanta, GA Birmingham, AL Chicago, IL
City, CA
SC
City, MO
AZ
NC
Louis, MO