We acknowledge the Bundjalung, Gumbaynggirr and Yaegl people as the Traditional Owners of the land on which we live and work. We honour the First Nations peoples culture and connection to land, sea and community. We pay our respects to their Elders past, present and emerging
Monitoring and evaluation....................................................................................................................
Introduction
Purpose
Clarence Valley Council’s Workforce Management Strategy (Strategy) outlines how the organisation will build, sustain and develop a capable workforce to deliver services over the next four years. Council is operating in a complex and changing environment, with key challenges including:
an ageing workforce and succession risk
skills shortages in key service areas
increasing workforce costs
changing employee expectations
evolving service delivery and community needs.
This Strategy identifies key workforce gaps and risks and sets out a coordinated program of actions to:
strengthen workforce sustainability and organisational resilience
improve attraction and retention in a constrained labour market
build workforce capability aligned to future demand
foster a high-performance, inclusive and engaged workforce.
Through this Strategy, Council will ensure it has: the right people, with the right skills, in the right roles, at the right time to support service delivery and long-term financial sustainability
Strategic Alignment
The Strategy aligns to Council’s Integrated Planning and Reporting Framework (IP&R). It is part of the Resourcing Strategy as part of the annual Operational Plan and supports:
Community Strategic Plan outcomes
Delivery Program workforce requirements
Long-Term Financial Plan sustainability
It ensures workforce planning is integrated, evidence-based and future-focused.
Strategic Context
Council operates within a dynamic environment influenced by:
demographic change and an ageing population
regional labour market constraints
increasing cost pressures
technological change and digital transformation
climate and environmental challenges
evolving workforce expectations.
These factors require a workforce that is resilient, adaptable and capable of meeting future demands.
Our Values
These values are not only embedded in our workplace culture but also act as guiding principles for how we attract, develop, and support our workforce. They underpin our commitment to fostering a safe, collaborative, inclusive, and high-performing organisation—ensuring we deliver services in a way that reflects both the needs of our community.
Safety
We have a safety focused workplace culture to ensure the wellbeing of our staff and the community
Teamwork
We work together as one council towards shared goals and for the greater good of the community
Respect
Integrity
We behave in a way that is honest, open, and transparent. We will take responsibility for our actions and strive for excellence
Value
We deliver services efficiently, effectively, and in an environmentally and financially sustainable manner
Engagement
We are inclusive, treat people with courtesy and fairness, and ensure each individual is valued and heard
We engage with our staff and community to inform our decision making, and create awareness of our activities
Key LGA / Regional Data for Clarence Valley
Population and demographics
The Clarence Valley LGA had a population of about 54,180 in 2021 NSW Government+1
The median age in Clarence Valley is 49 years, which is significantly older than the NSW and national medians Australian Bureau of Statistics+1
People aged 65 and over make up around 21% of the population
Labour force and employment
The labour force in the area in 2021 was 21,081 people, with 10,608 full-time and 7,734 parttime workers Profile ID
Most resident workers remain in the area: 85% of employed residents live and work in Clarence Valley; 9% commute out to other areas Profile ID
About 92% of people who work in Clarence Valley also live in the area, indicating relatively high workforce local retention
Occupation and industry profile
Among residents of Clarence Valley, the most common occupation groups (2021) are:
• Professionals: 16% Profile ID
• Community & Personal Service Workers: 16% Profile ID
• Technicians & Trades Workers: 14% Profile ID
In terms of industry sectors, the largest employing sectors for Clarence Valley residents include Health Care & Social Assistance (17%), Retail Trade (11%), and Construction (9%)
Education and qualifications
Educational attainment is lower compared to state averages: only 12% of people aged 15+ hold a bachelor’s degree or higher in Clarence Valley, far below NSW proportions
A notable share holds vocational or certificate-level qualifications, and many have completed schooling to Year 10 or Year 12 as highest level.
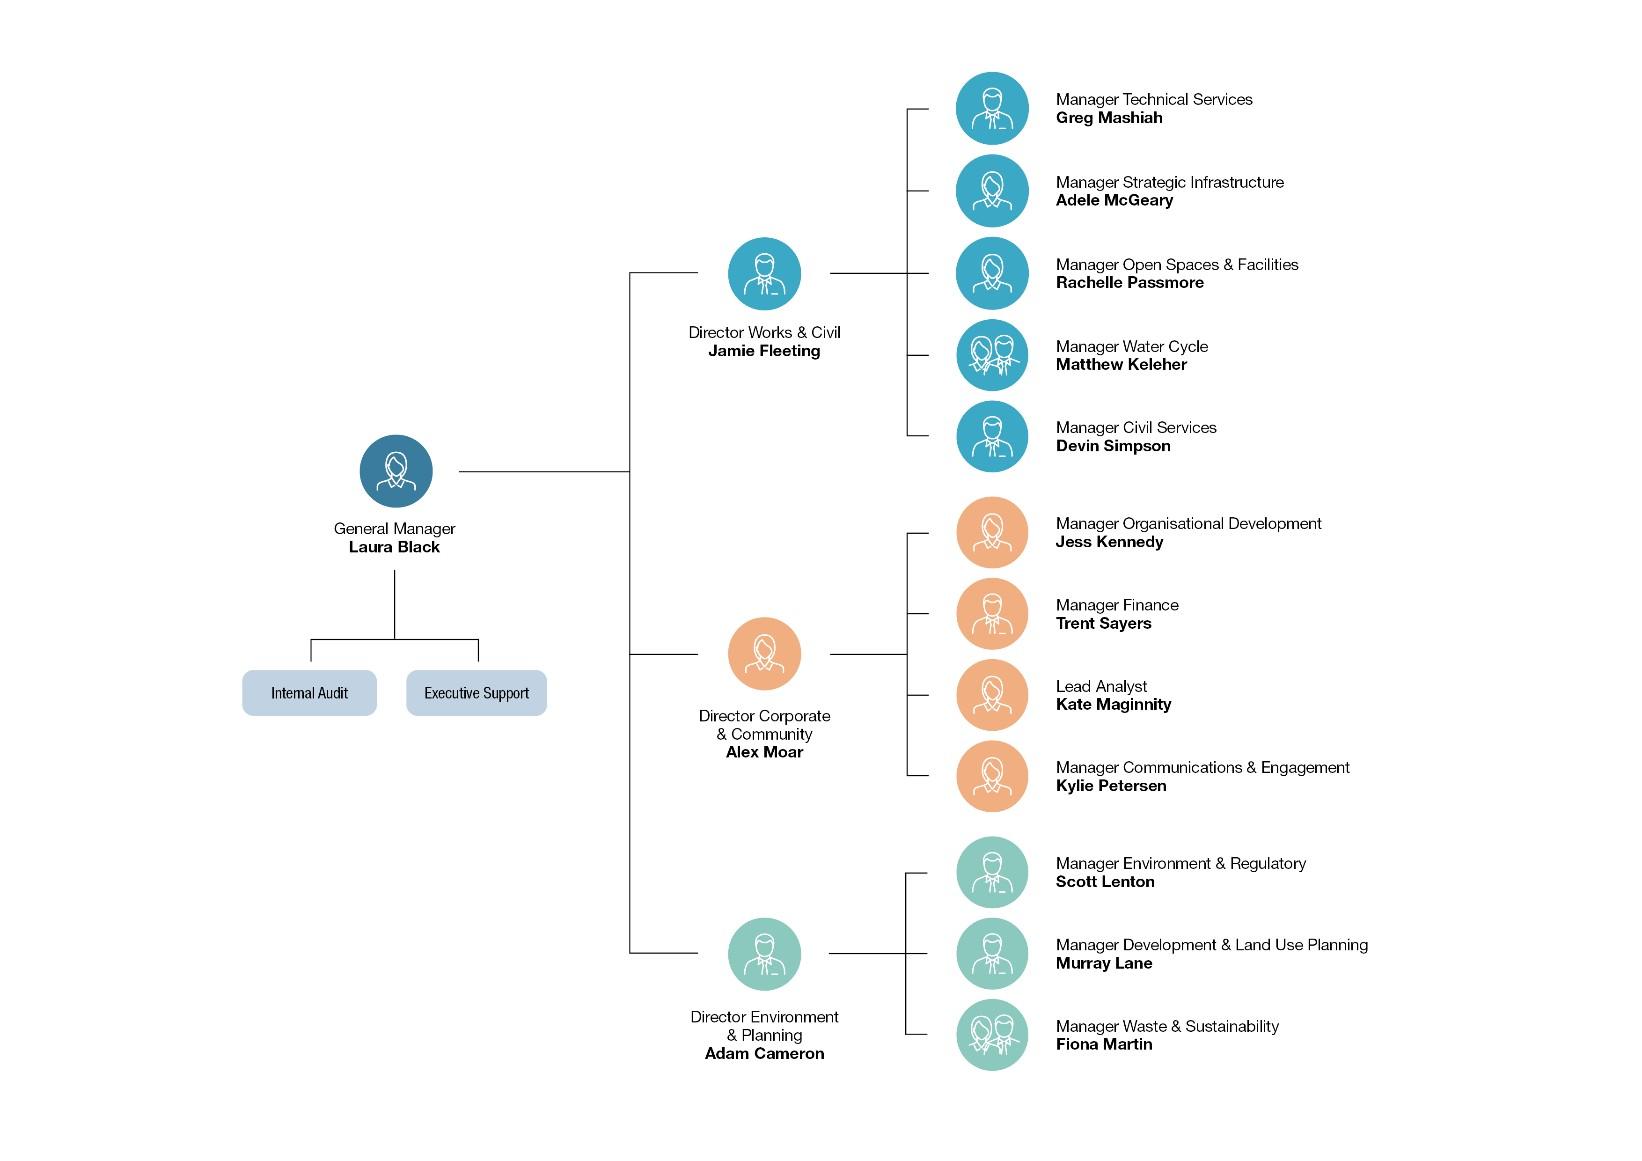
Our Structure
Workforce Profile (2024/2025)
Key Insights
Workforce Sustainability
Ageing workforce
Tenure concentration
Pipeline weakness
Workforce Capability & Risk
Skills shortages
Vacancy pressure
Internal succession gaps
Workforce Structure
Operational workforce dominance
Gender distribution
Workforce Performance & Cost
Turnover concentration
Workforce cost pressure
Multi-skilling demands
Ageing Workforce Profile
Workforce Age Profile
Insight
15-25 years 26-35 years 36-45 years 46-55 years 56-65 years Over 65 years
Council’s workforce is skewed toward older age cohorts, with:
56.47% of employees aged 46 years and over
31.76% aged 56 years and over, representing a significant proportion nearing retirement
A comparatively low proportion of early-career employees (22.74% under 35)
Strategic Implication
This age profile indicates:
A high dependency on experienced employees
Increased risk of workforce exits over the next 5–10 years
Potential loss of critical knowledge and capability
A need to strengthen early-career pipelines and succession pathways Without intervention, this may impact:
Workforce continuity
Service delivery capability
Leadership succession
Strategic Response Council will:
Strengthen succession planning across critical roles
Implement a knowledge continuity framework to retain organisational expertise
Develop leadership and career progression pathways
Introduce flexible workforce models, including phased retirement
Gender Profile
Overall workforce composition is 68% male and 32% female
The indoor workforce is predominantly female (61% female / 39% male)
The outdoor workforce is predominantly male (84% male / 16% female)
Insight
This indicates a significant gender imbalance across different workforce segments, with:
Women concentrated in administrative and indoor roles
Men concentrated in operational and field-based roles
Strategic Implication
This distribution highlights:
An opportunity to increase female participation in operational roles
A need to ensure equitable access to career pathways across all areas
Potential limitations on workforce diversity, capability and innovation
Strategic Response Council will:
Implement targeted initiatives to increase diversity in field-based roles
Promote inclusive recruitment and career pathways across all directorates
Support programs such as “women in the field” initiatives
Ensure workplace practices and conditions support diverse workforce participation
Regional labour constraints
Council operates within a regional labour market with limited access to a broad and specialised talent pool
The local workforce has lower levels of tertiary qualification attainment compared to state averages
Insight
Council’s geographic location significantly influences its ability to attract and retain skilled employees, particularly in:
Engineering and infrastructure roles
Technical and specialist positions
Digital and professional capability areas
The limited availability of highly qualified candidates locally increases reliance on a small and competitive labour pool.
Strategic Implication
This creates a number of workforce challenges:
Difficulty attracting suitably qualified candidates for critical roles
Increased time and cost associated with recruitment
Higher risk of vacancies and re-advertised positions
Greater reliance on internal workforce development
Potential constraints on Council’s ability to deliver complex services
Strategic Response Council will:
Strengthen its Employee Value Proposition (EVP) to improve competitiveness in the labour market
Implement targeted recruitment strategies for critical and hard-to-fill roles
Develop local workforce pipelines, including traineeships, apprenticeships and partnerships with education providers
Invest in internal capability development to reduce reliance on external recruitment
Explore flexible and innovative workforce solutions, including remote work opportunities where appropriate
Workforce Forecast
Over the next four years, Council will require increased capability in:
engineering and infrastructure delivery
digital and technology services
environmental and climate resilience
project and contract management
leadership and organisational capability. Without intervention, workforce supply is unlikely to meet these demands.
Workforce Drivers, Risks and Strategic Response
Workforce Drivers
Council’s workforce is shaped by a range of drivers that directly influence workforce risks and inform strategic priorities. These drivers directly inform workforce risks and underpin Council’s strategic workforce priorities. The table below outlines the key drivers.
Driver Risk Strategic Responses Linked Priority
Ageing workforce Loss of knowledge, service disruption
Skills shortages Inability to fill roles
Rising costs Financial pressure
Service complexity
Capability gaps
Workforce expectations Retention risk
Succession planning, mentoring, phased retirement
Employer Value Proposition, targeted recruitment strategies, talent pipeline