Design of document to be completed while on public exhibition.
Acknowledgement
We acknowledge the Bundjalung, Gumbaynggirr and Yaegl people as the Traditional Owners of the land on which we live and work. We honour the First Nations peoples culture and connection to the land, sea and community. We pay our respect to their Elders past, present and emerging.
The Long-Term Financial Plan and Sustainability Strategy (LTFP&SS) is a 10year rolling plan that informs decision-making.
It demonstrates how the objectives of the Community Strategic Plan (CSP) and commitments of the Delivery Plan (DP) and Operational Plan (OP) will be resourced and funded, including providing possible scenarios to ensure sustainable long term financial performance.
The process is guided by the following council’s financial policies.
• Financial Management Policy
• Financial Sustainability Policy
• Reserves Policy
• Borrowing Policy
And prepared in accordance with the provisions of the Local Government Amendment (Planning and Reporting) Act 2009 and the associated Guidelines and Manual
Purpose
To forecast a path that will ensure robust financial performance and long-term success by defining guiding principles to be considered when evaluating the financial impacts of decisions. Articulate and formalise the financial management and governance practices to be employed by Council over the next 10 years.
This document is not intended to be prescriptive or rigid, nor should it constrain our capacity to make the best decisions for our community both now and into the future. Rather, it is designed to provide a mechanism to ensure that financial implications are considered appropriately, it should forecast scenarios that guide continuous improvement and outline a practical guidance across the organisation’s key financial sustainability objectives. These guiding principles should enable Council to maintain sufficient financial resources to deliver activities in the short, medium and long term, including addressing future service demands. The individual line-item amounts should not be the focus or by that matter balance to the current years internal budget, what is important is the trends, especially the forecast net operating result before capital grants & contributions. i.e. is the bottom line improving or worsening. Is the result a deficit or surplus and is it sustainable?
Content and structure
The document includes possible modelling to reflect:
• implications of asset management and workforce planning
• assumptions for indexing, Service levels impact, Interest rates, Rate Peg and possible future special rate variations
• scenario’s comparing if council continues its existing path or it adopts different strategies that will put it on a different path
• sensitivity analysis, highlighting factors and assumptions most likely to have an impact
• methods of monitoring financial performance
• major capital and additional operational expenditure implications
• Strategies to achieve financial sustainability
Council’s financial structure is divided into three separate funds: General, Water and Sewerage. These funds are subject to legislative restrictions which do not permit monetary transfers between funds. They should be considered as three separate businesses for financial planning purposes, but they are combined to present a single consolidated result for external reporting purposes.
The Long-Term Financial Plan is presented for both consolidated and individual fund/s using the Annual Financial Statements format of: Income statement – presents the operating result and change in net assets from operations for the year. Balance sheet –discloses the assets, liabilities and equity of Council. Cash flow statement – shows the cash flows associated with Council’s operating, financing and investing activities. Performance ratios and charts – shows how council is forecast to perform against suggested benchmarks.
Financial Sustainability
TCorp has defined financial sustainability in the following terms:
‘A local government will be financially sustainable over the long term when it is able to generate sufficient funds to provide the levels of service and infrastructure agreed with its community.’
There is a need to achieve at least a break-even in each of Council’s Funds (General, Water & Sewer) operating position on an ongoing basis. The Council has several key financial objectives to achieve financial sustainability, which need to be considered during the preparation of the LTFP. These are balanced budgets, and sustainable operational and financial efficiencies.
Balanced Budgets
The Council has historically strived to deliver annual ‘Cash-Based balanced budget’ (expenditure matching revenues/reserve funding). But at the same time this has meant that on an accrual basis as reported in the Financial Statements that council historically has been projecting significant net operating losses before capital grants and contributions. This means council is heavily reliant on external funding to renew and expand its asset base. This is a risk that needs to be mitigated. Strategies will now be developed with the intention to transition Councils toward a net operating position that ensures assets renewals can be funded from its own revenue sources when other funding is not available.
The forecast operating positions in the current LTFP term does not necessarily need to be a surplus or even breakeven, but at a minimum a level that mitigates the current risk and a deficit that is less than the minimum projected external funding sources.
From a cash perspective, each individual fund needs to be achieving a surplus which includes via a transfer to reserve, a percentage of depreciation expense to build the required reserves to be able to fund or part fund future asset renewals when other sources of funding are not available. In line with the Reserves Policy council needs to work toward a minimum balance in an Asset Renewal Reserve that is a percentage of the total infrastructure asset gross replacement value (2024/25 Financial Statements reported General Fund $2.4B, Water Fund $732M, Sewer Fund $338M). To further put this in perspective the 2024-25 Report on Infrastructure indicated that the General Fund infrastructure assets rated as condition 5 alone have a replacement value of $16M.
Sustainable Operational and Financial Efficiencies
To be sustainable into the future Council needs to commit to identifying and implementing initiatives which reduce expenditure and/or increase income improving Council’s bottom line and/or its capacity to deliver on the objectives of the Community Strategic Plan.
The Long-Term Financial Plan needs to ensure that any proposed strategies align with the principles agreed upon in Councils Financial Sustainability Policy specifically:
1. Spend money responsibly and sustainably, and align general revenue and expenses over the short, medium and long-term.
2. Invest in responsible and sustainable infrastructure for the benefit of the local community which embodies the ratepayer’s willingness and capacity to pay.
3. Effectively manage their finances and assets and have sound policies and processes for performance management and reporting, asset maintenance and enhancement, funding decisions, and risk management practices
4. Decisions seek to achieve intergenerational equity i.e. the current generation funds the cost of its services. Any new projects and initiatives decisions are not agreed upon without whole of life expenditure and income streams provided and the impact on current and future ratepayers considered. This may also
include the consideration of new borrowings where council has capacity to service and maintain a Debt Service Ratio within the Financial Management Policy benchmark.
Estimates, Assumptions and Forecasts
All Long-Term Financial Plans (LTFP) must be based on a set of assumptions, which generally relate to factors that are most likely to affect the overall outcome. The following assumptions have been considered, discussed, and ultimately used as a basis to forecast the Council’s long-term financial position over the next 10 Years.
Planned Assumptions
Assumptions and factors affecting the budget result have been incorporated into the 2026/2027 budget and 10-Year Plan as follows:
Key Assumptions for the 2026/2027 Budget and LTFP
Scenario 1 – Base Case – Business as Usual
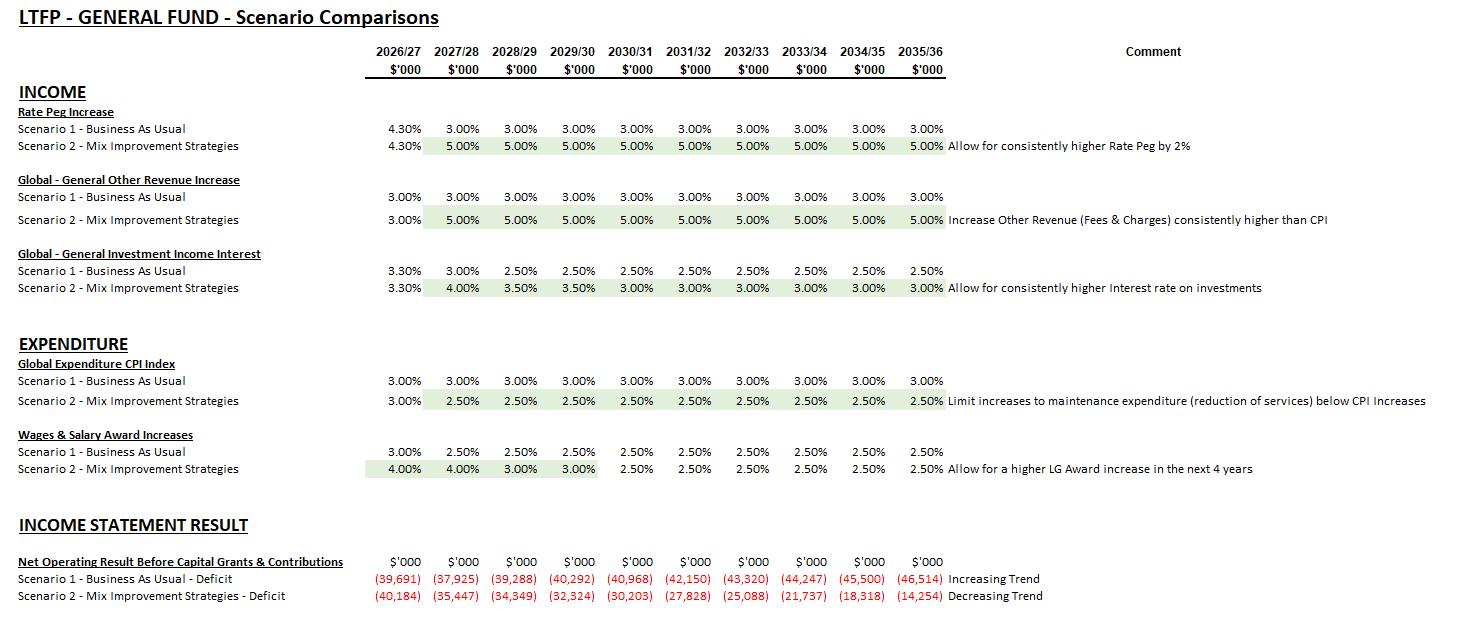
General rate revenue will be increased by 4.3% as per the determined Rate Peg and then 3.5% from 2027/2028 onwards. 2020/2021 saw the completion of the previously approved Infrastructure Renewal Value (IRV) Special Rate Variation (SRV) increase, which means that the standard rate peg now applies. Council will continue to restrict the estimated yield from the now built-in SRV component and subsequently use to improve infrastructure as per the SRV requirements. The estimated yield in 2026/2027 is $6.1m. Council also levies a separate stormwater charge of $25 per property.
Revenue streams and future service requirements will be adjusted for population growth forecasts where a direct relationship can be determined. Population forecasts will be based on the forecasts specifically determined for the Clarence Valley Council (currently + 0.81% p.a.). Historically the impact of population growth on income has been only marginal.
Recurrent operating expenditure for 2026/2027 will be based on the actual 2024/2025 Financial Statement results and then generally indexed by 3% in line with the average RBA forecast. This position will then be further adjusted for contractual obligations or for any predetermined expected spend, as informed through discussion with management.
Recurrent operating revenue for 2026/2027 onwards will initially be increased in line with service deliverables. A possible strategy that could be applied to improve the operating position would be to increase general operating other revenue and user charges say by an additional 1% above the projected operating expenditure indexation.
Interest and investment income is forecast at a conservative average rate of 3.3% for 2026/2027, based on the running yield of Council's investment portfolio (value average $125 million per month) It is then predicted to continue to drop to 3% in 2027/2028 and then settle around 2.5% from there onwards.
Water Charges will be indexed by 10% pa for a further 3 years i.e. 2027/28 to 2028/29 which has been impacted by the recent changes to EPA requirements. It is then anticipated that it can be reduced as follows.
• 4% from 2029/2030 to 2033/2034
• 3.5% from 2035/2036 to 2036/2037
• 3% from 2037/2038 to 2044/2045
• 2% 2045/2046 onwards
Sewer Charges will be indexed by 10% pa for 2026/2027 and then progressively reduced to 3.5% 2027/2029, 3% 30-31 & then 2% from 2031/2032 onwards.
Domestic Waste Management Charges will be calculated based upon the reasonable cost requirements (The specific Domestic Waste Charge income funds the operating and maintenance costs associated with providing the service).
Operating Grants - Council has assumed it will continue to receive operating grants in relation to ongoing operations (where evidenced by management) and that these will generally increase annually in line with estimated indexation of 3%. Operating grants received for specific project related purposes have been included in the year Council anticipates they will be received.
Capital Grants - the capital grants applied in the model will be based on the amounts projected in the LTFP which are based on 5 years historical averages.
The Financial Assistance Grant value is estimated at $15.35 M, which is an increase of approximately 2.5%. This assumes the current prepayment arrangements will stand, however reduced to 25% it is noted that the actual value and payment will be determined by the Federal Government in late May 2026. Council is now assuming that over the next two years the "in advance" tap will be phrased out. The advance payment impacts on the Financial Statements as this income must be reflected when it is received, where as the budget reflects the allocation for the actual year that it relates.
Tax equivalent dividends will be based upon the maximum allowable rate of $3 per assessment (which equates to approximately $75K from the Water Fund and $85K from the Sewer Fund). These figures will be adjusted by each estimated charge increases, and population increases.
All positions on the adopted organisation structure to be funded unless otherwise indicated.
Wage increases are forecast as per the 2023 to 2026 NSW Local Government State Award.
Forecasted at 3% for 2026/2027 then 2.5% each year from 2027/2028 it is predicted that wages will continue to increase by 2% since the wage increase is generally less than the actual CPI which is predicted to be 2-3% from 2026/2027 onwards. In addition, from 2024/2025 the award included a $1,000 bonus each year per employee. This is estimated to total $500K per year.
Leave entitlement accruals estimates assume that all positions in the organisation structure will be filled.
Workers Compensation premiums will be based upon 4.15% of the estimated wages from 2026/2027 onwards which allows for the adjustment to the basic tariff for claims history. The historical Basic Tariff Premiums as a % on wages is as follows:
• 2022/2023 = 2.37%
• 2023/2024 = 2.37%
• 2024/2025 = 3.14%
• 2025/2026 = 3.18%
Over the last three years claims performance history percentage continues to increase, (calculated as the Claims Amount divided by the Basic Tariff) this has more than doubled from a percentage of 6.53% in 2022/2023 to a current YTD 14.52% in 2025/2026. This will have an impact of higher premiums over the next three years especially if this trend continues and even to a greater extent if the trend worsens.
Council historically receives a Work, Health & Safety rebate this is now called the Safety & Wellbeing Incentive. For 26-27 this is estimated to be $130,000
Superannuation – Employees are generally in one of two schemes, which are:
• The Defined Benefits Scheme: calculated as per employee contribution.
• The Super Guarantee Scheme (SG): The Council is legislatively required to contribute 12% of the employee's gross wages for 2026/2027. The SG rate will then remain fixed at this rate into the foreseeable future.
Electricity expenditure varies by Fund and historically have been on an upward trend; therefore, these charges have been indexed at 5% for 2026/2027 onwards
Street lighting charges have historically been up and down based upon the forecast will be based upon the actuals for 2025/2026 index by 3% each year.
Council’s insurers have indicated that the hard insurance market cycle has ended but still recommend council be conservative by forecasting a 5% increase each year in premiums. Final premiums will not be known until next year which will also be impacted by any increase in the asset infrastructure and valuations. This applies to the Property, Public Liability, Councilors & Officers Liabilities, Cyber Liability, Personal Accident & Corporate Travel, Environmental Liability, Motor Fleet and General Insurance policies.
State Emergency Levies and Rural Fire Contributions will be indexed 3% from the 2025/2026 costs.
Surf Life Saving contributions to Minnie and Yamba have been index by CPI of 3%.
Surf Life Saving Contracts have increased by 2.6% for 2026/2027 and then by 2.5% from 2027/2028 onwards.
New Loans: Will be required for Water Cycle Infrastructure and have been based upon an estimated interest rate of 6% over 20 years. The amount required will depend on the success of current grant submissions and final construction costs. At this stage the LTFP has assume Council will not receive any Grants relating to these submissions. The projected new loan borrowings included are for Sewer Fund $26M in 2026/2027 and for Water Fund $20m in 2026/2027 and $30M in 2027/2028.
Bank Charges payment surcharge may cease to be recouped due to changes in the legislation this will have the impact of approximately $65K.
Council may need to consider creating a reserve for potential native land compensation claims associated with future capital works.
Activity Costing Distribution method to remain the same as previous year.
Proposed Key Assumptions for the 2025-2026 LTFP Scenario 2 – Multiple strategies to project a decline net operating position before capital grants and contributions. All assumptions listed in Scenario 1 will be applied to a second scenario for the LTFP, except for specific changes to be identified.
Capital
Expenditure and Service Level Variations for 2026/2027 to 2035/2036
The rolling Capital Works Program for 2026/2027 to 2029/2030 has been developed by the Asset Managers and staff based upon professional judgement. Council’s In-house rolling Infrastructure Assets condition inspection and unit rating process will be funded through the operational budget.
This process will validate, provide confidence and the input data required by the strategic asset management system to facilitate the asset renewal schedules. The overall objective being to move from a rolling Capital Works Program based upon professional judgement to a position where information and decisions are based upon asset data
Sensitivity/Risk Analysis
By their very nature, all LTFPs have risks associated with assumptions and impacts on estimated expenditure and income streams. Some items identified that could potentially impact this plan are:
1. AMP updates and Asset Revaluations can change useful life assumptions, depreciation expenses and whole-of-life costs
2. Council’s agreed service level changes
3. interest rate changes
4. flood events
5. legislative changes
6. pandemics
7. grant funding changes
8. employment costs, changes to rates of pay through the Local Government State Award negotiations
9. indexing applied to recurrent grant income being lower than anticipated
10. population growth
11. global economics
12. joint works.
In predicting certain income streams such as grants and contributions, asset revaluation adjustments and depreciation is very problematic and as such, the estimates for these pose a much higher risk.
In this LTFP, the estimates for grants and contributions have been based on historical averages, excluding anomalies such as major floods or significant programs associated with economic stimuli, including Inflation, recession and pandemics.
It is important to point out that operating grants reported in the Income Statement (in accordance with the Financial Statement accounting legislation) includes the Federal Government’s ‘Roads to Recovery’ funding, even though Council may use this funding for capital purposes. Council is also required through the application of the Financial Accounting standards to recognise revenue when received as opposed to when they are expended.
As the landscape changes each year and the Council’s asset management and other data improves, so too will the LTFP’s projections and outputs to assist strategic decision-making.
The General Fund LTFP includes two scenarios to examine the impacts of continuing to operate Business As Usual (BAU), effectively just applying the standard indexation and historical averages. Whereas Scenario 2 shows the impact of applying a mix of strategies that could impact council to transition to a more sustainable position by projecting a declining net operating loss before capital grants and contributions.
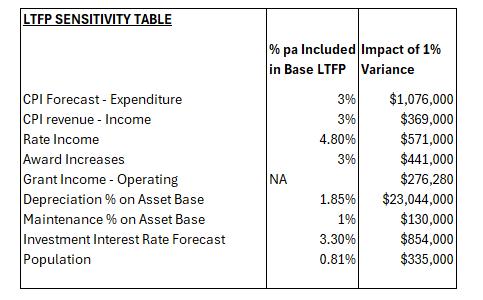
SENSITIVITY ANALYSIS OF INCOME & EXPENDITURE – General Fund Only
The above table shows the impact of a 1% change in the indexes applied to income and expenditure streams. The Council is currently commencing a systematic review of all its services and updating its Financial Management Strategy. This along with the communities accepted service levels, capacity, and willingness to pay may have a major impact on the current distribution of the budget, infrastructure asset base, asset renewals and asset additions that Council adopts into the future.
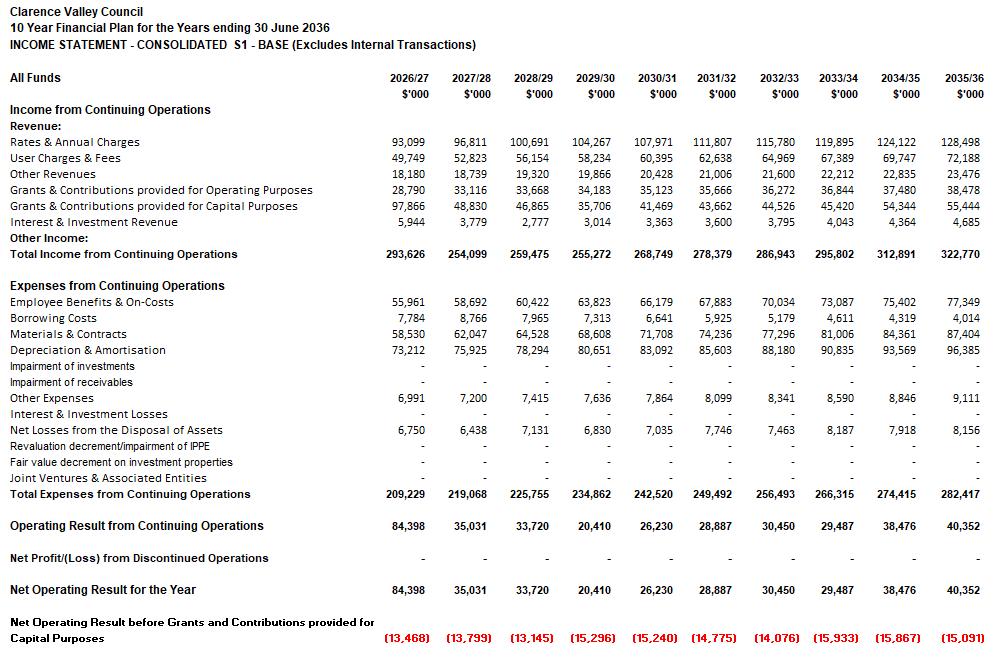
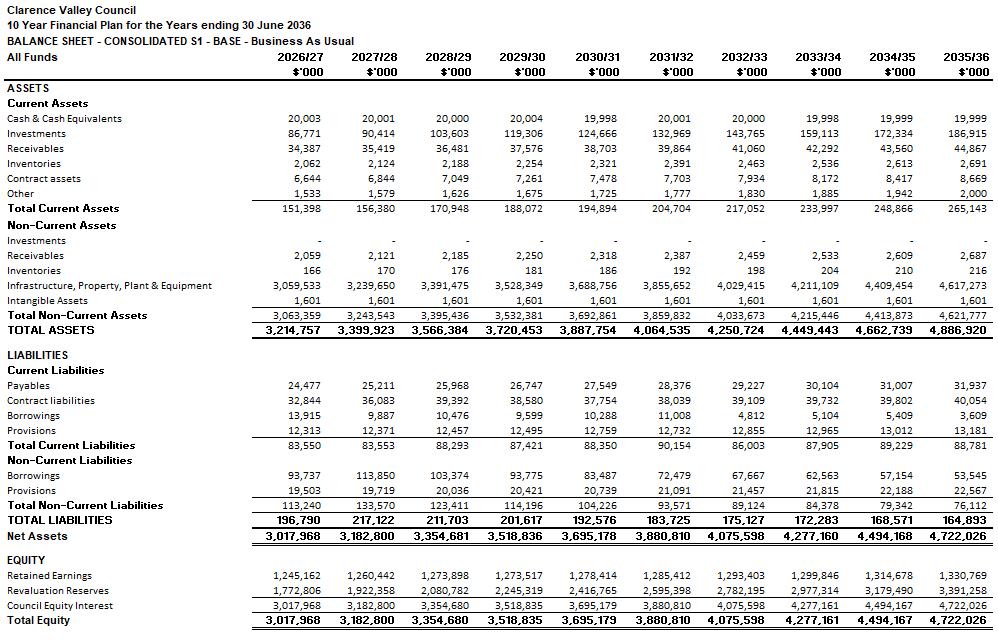
The following tables are the core projected Financial Statements All funds both consolidated and by each specific fund and the extracted financial benchmarks included in the Financial Management Policy.
Consolidated Income Statement
Consolidated Balance Sheet
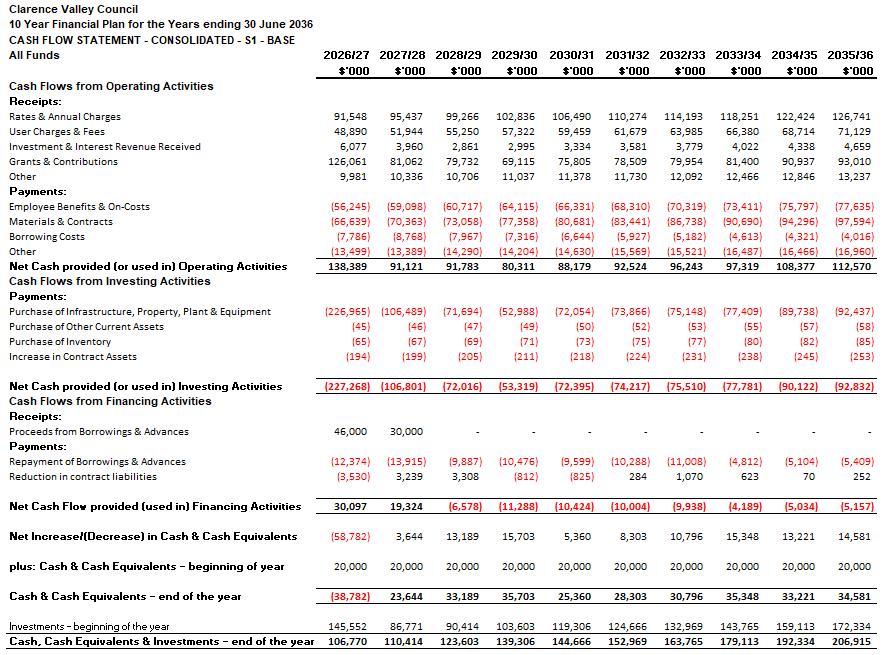
Consolidated Cashflow Statement
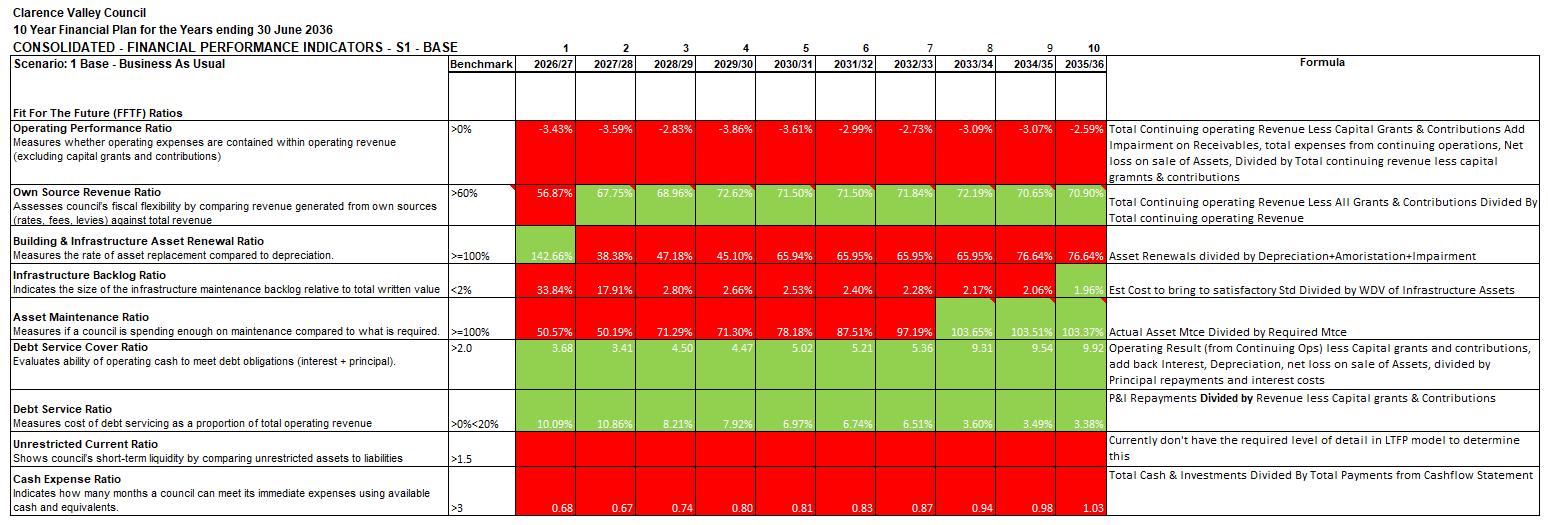
Consolidated Performance Indicators
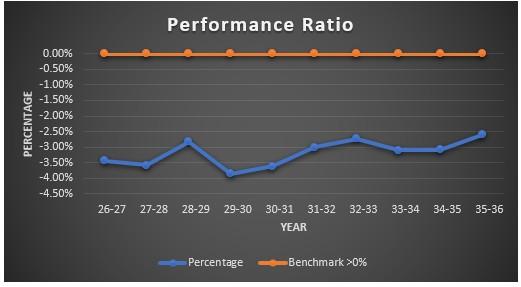
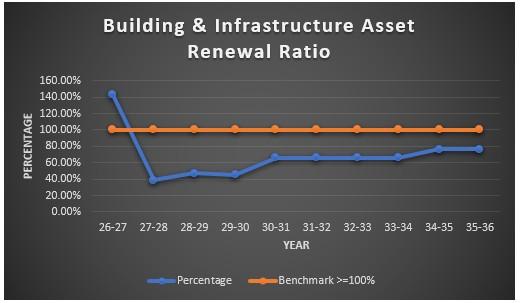
Consolidated Performance Charts
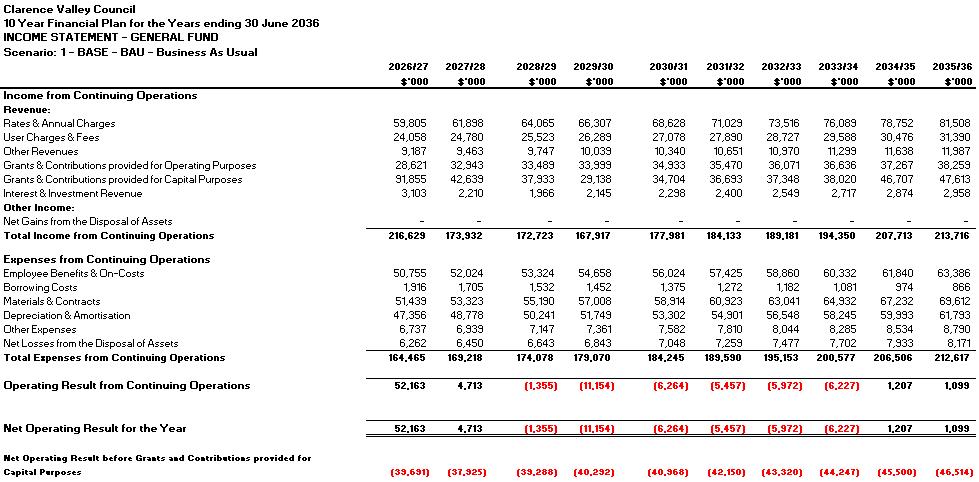
Income Statement – General Fund
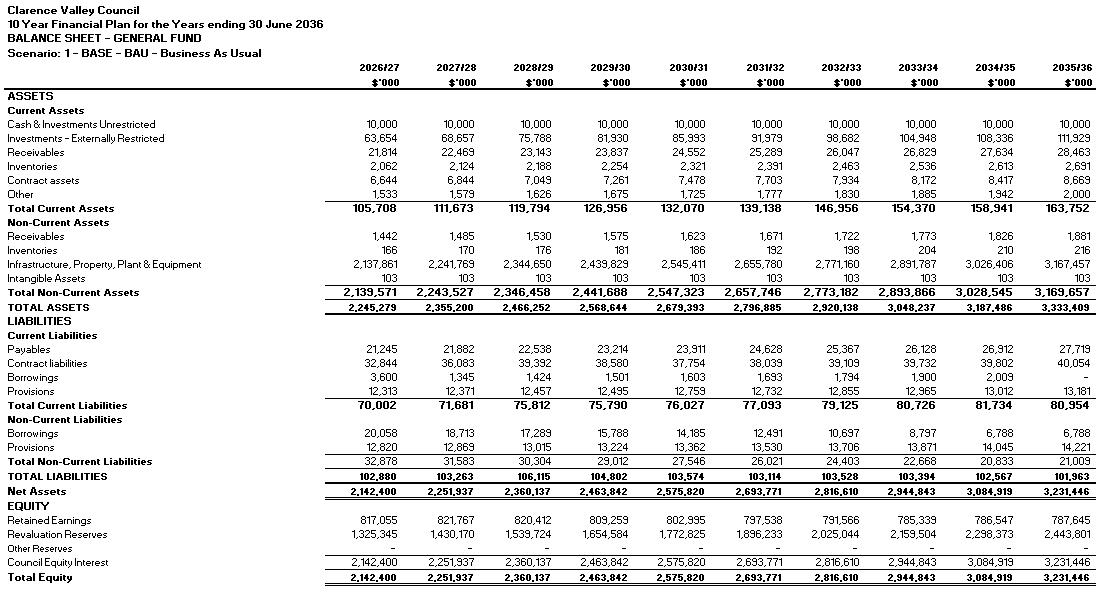
Balance Sheet – General Fund
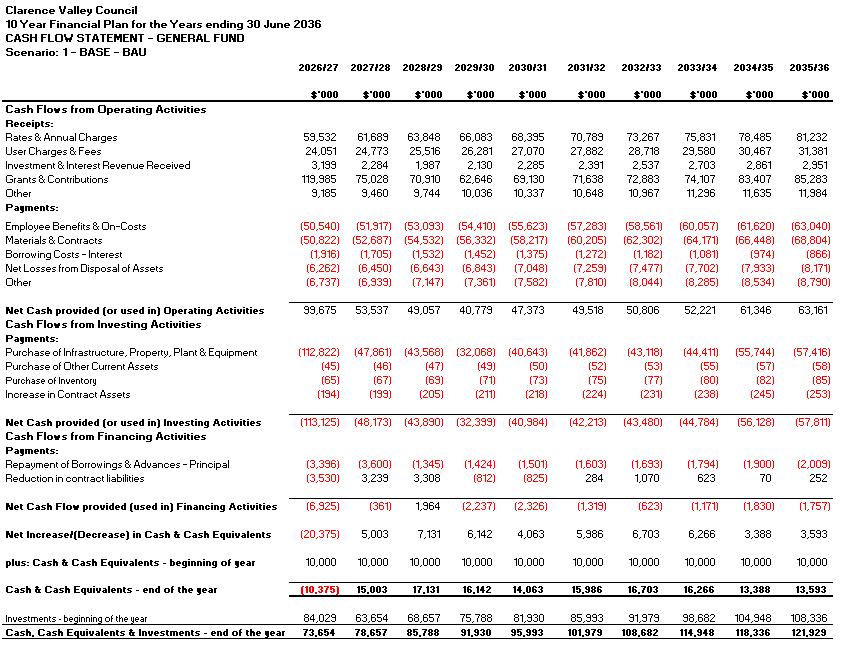
Cashflow Statement – General Fund
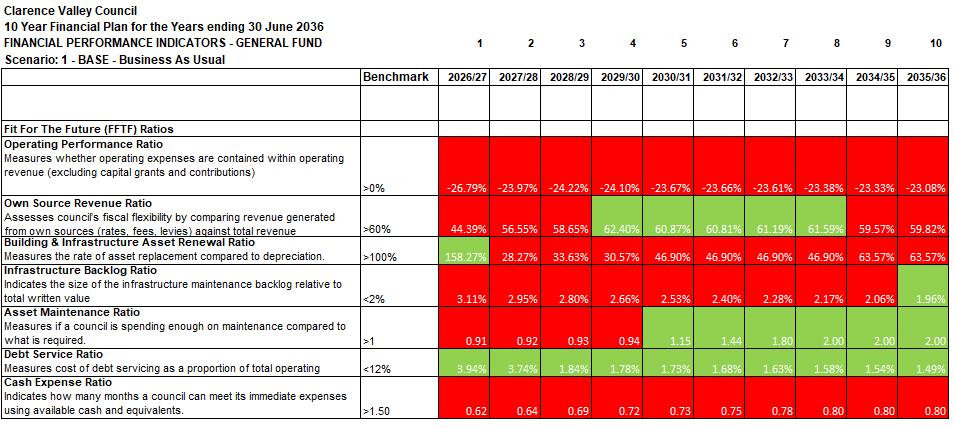
General Fund – Key Financial Performance Indicators
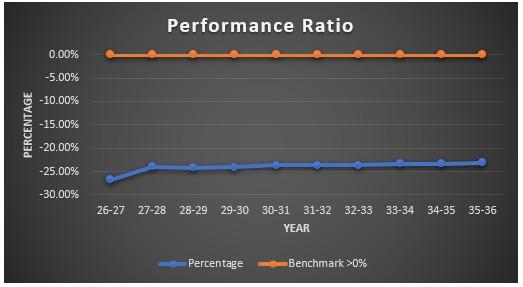
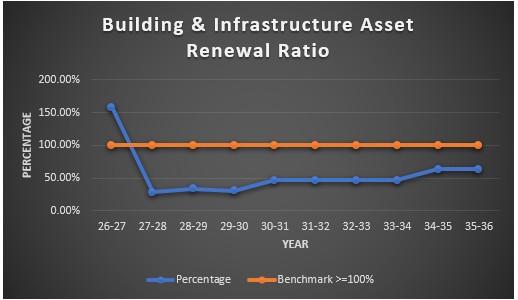
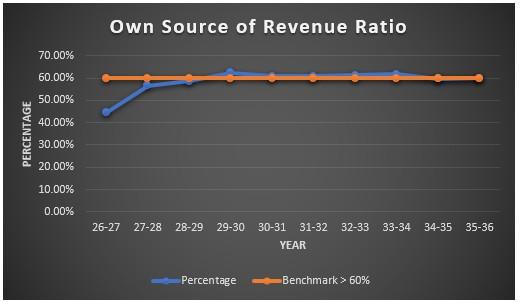
General Fund – Key Financial Performance Charts
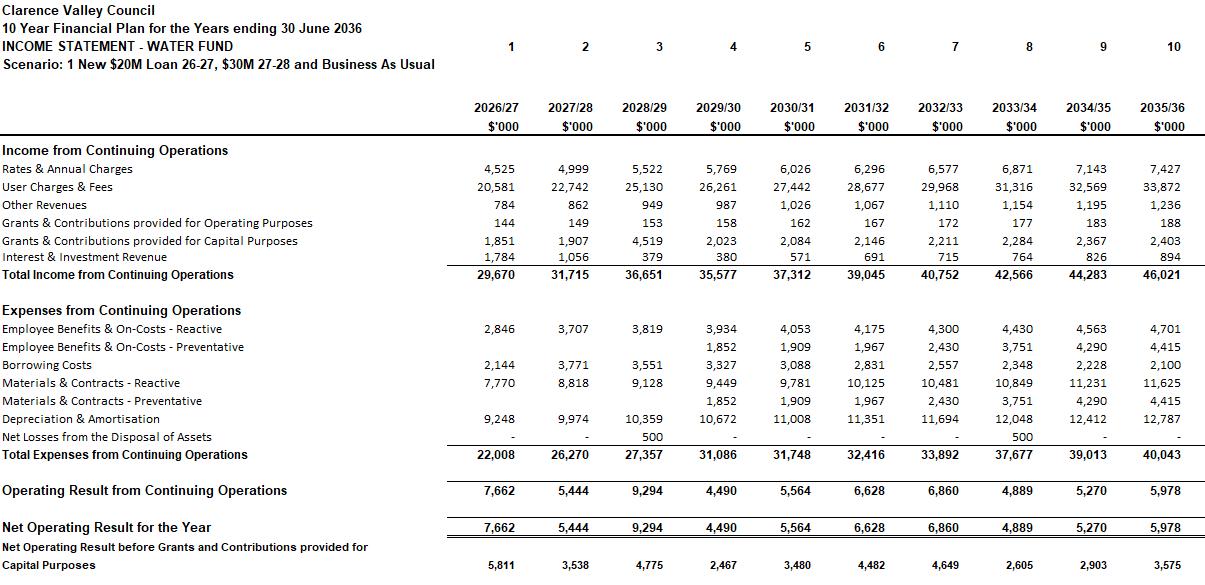
Income Statement – Water Fund
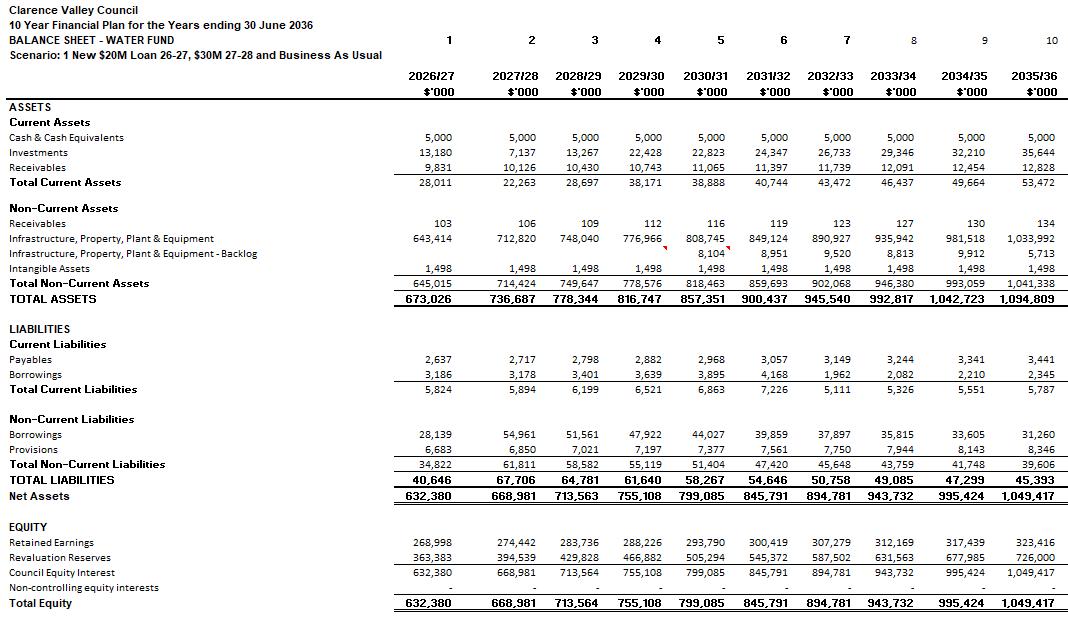
Balance Sheet – Water Fund
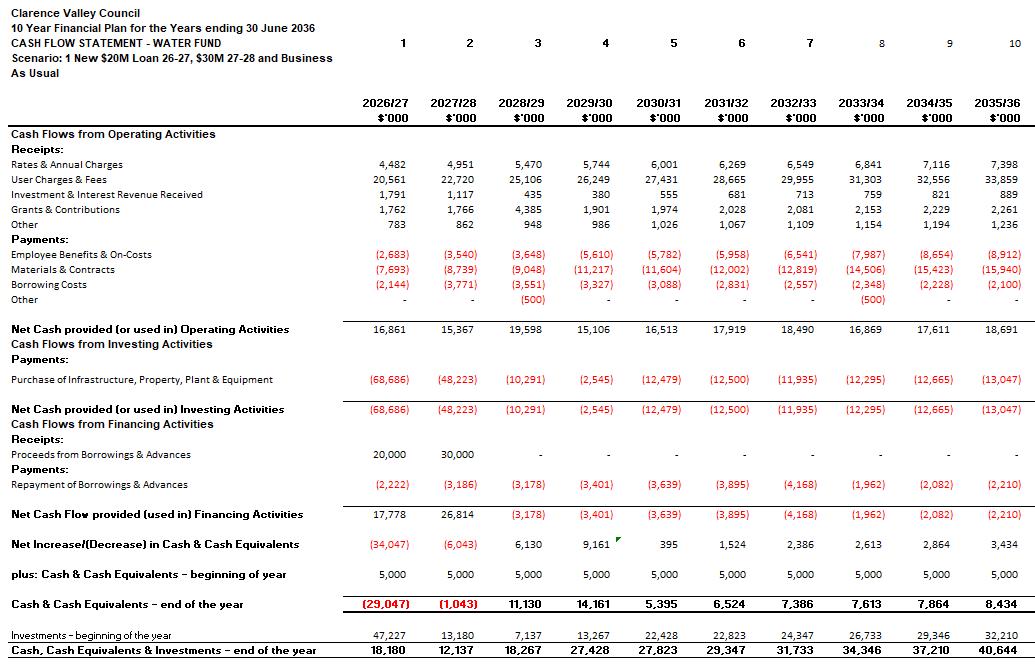
Cashflow Statement – Water Fund
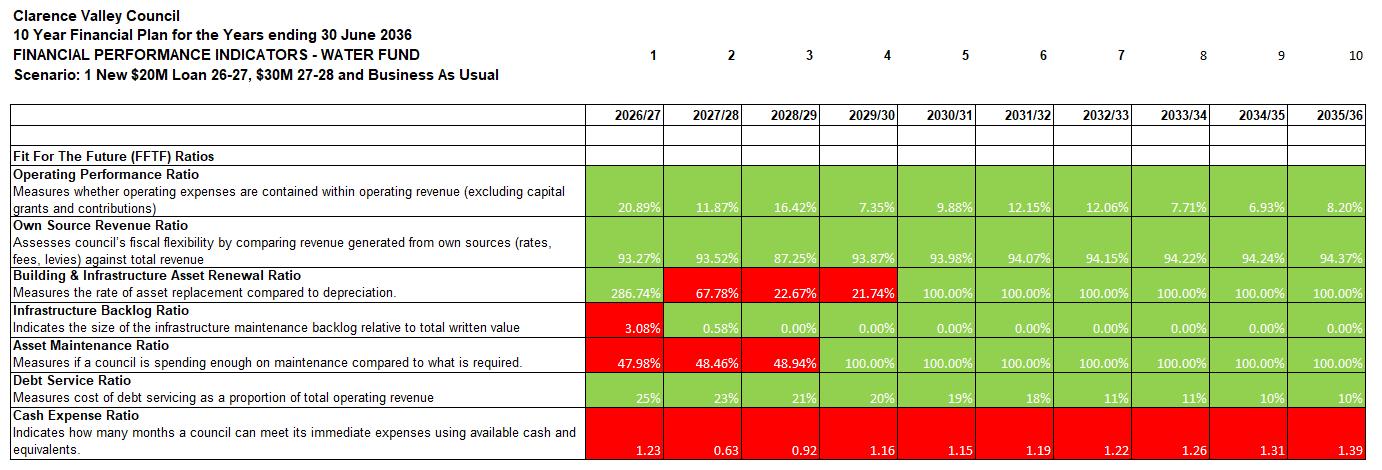
Water Fund – Key Financial Performance Indicators
Water Fund – Key Financial Performance Charts
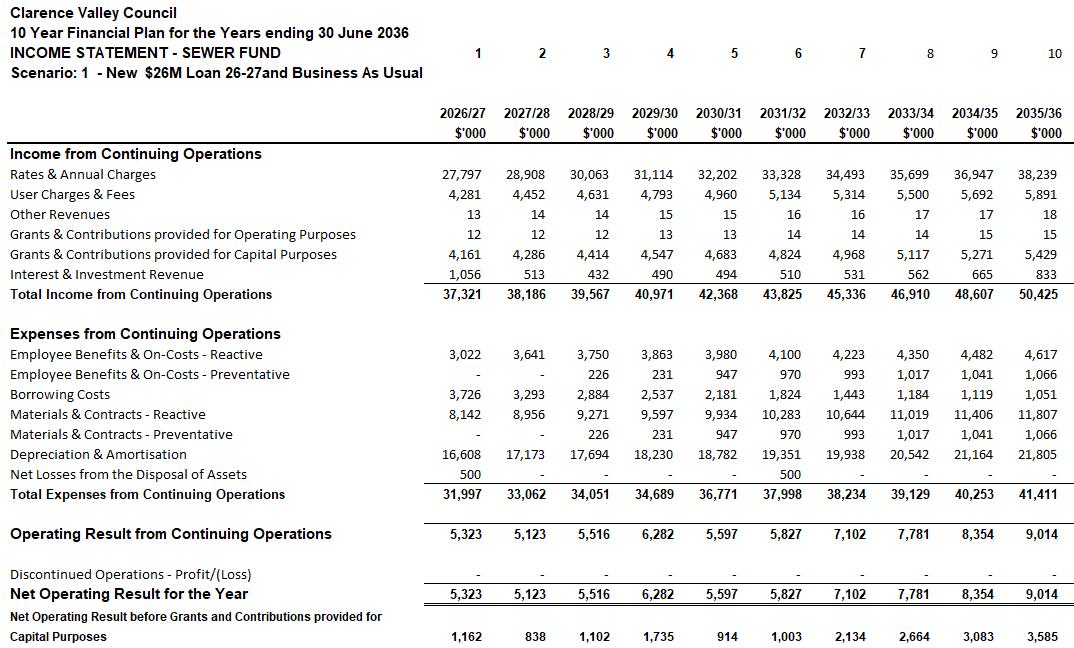
Income Statement – Sewer Fund
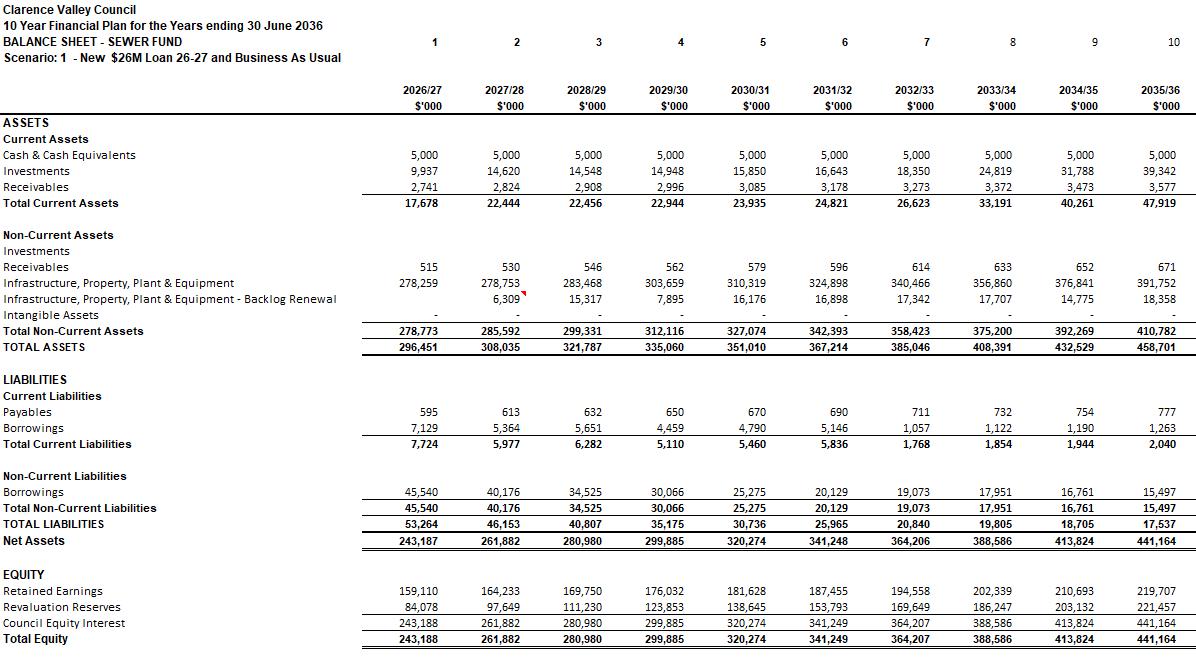
Balance Sheet – Sewer Fund
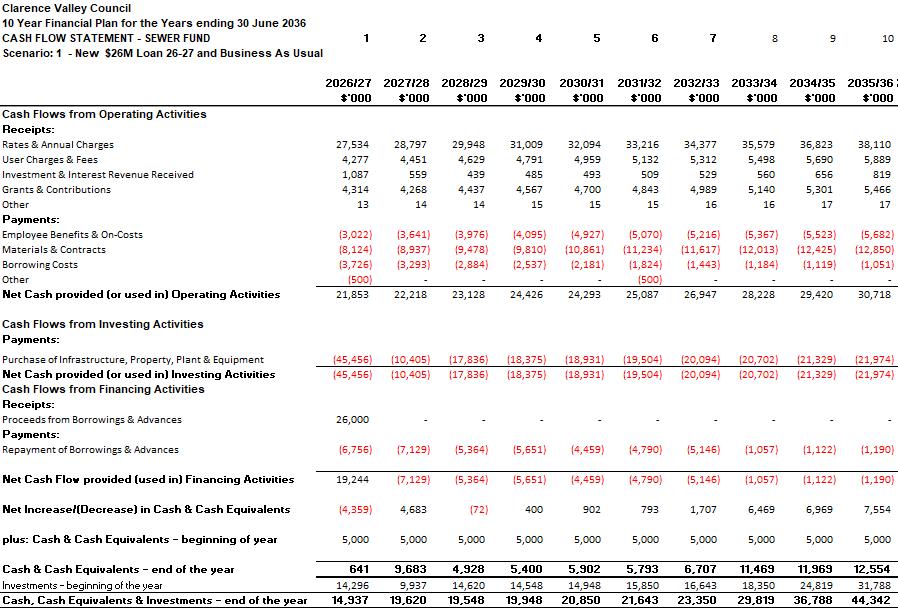
Cashflow Statement - Sewer Fund
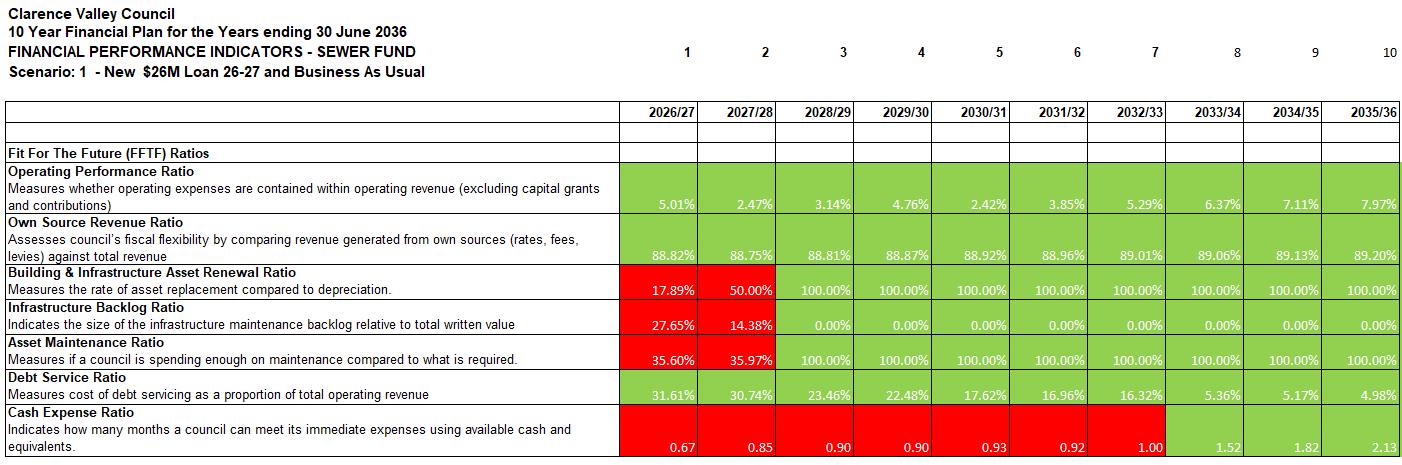
Sewer Fund – Key Financial Performance Indicators
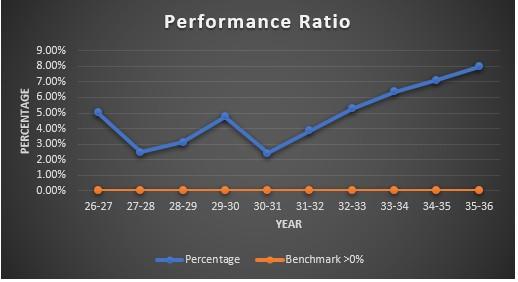
Sewer Fund – Key Financial Performance Charts
Financial Management Policy
Key Financial Indicators (KFI)
the Future’ KFI (General Fund
1. Operational Liquidity (short-term focus)
1.1 Unrestricted Current Ratio – Unrestricted current assets divided by unrestricted current liabilities, as per Note 13 of the Local Government Code of Accounting Practice & Financial Reporting Update 25 –benchmark >1.5:1.
Purpose – This is a measure of the Council’s ability to meet its short-term liabilities with its short-term assets.
1.2 Rates and Annual Charges Outstanding – Rates & annual charges outstanding divided by rates & annual charges collectible, as per Note 13 of the Local Government Code of Accounting Practice & Financial Reporting Update 25 – benchmark <10%.
Purpose – This measure assesses the impact of uncollected rates & annual charges on the Council’s liquidity and the adequacy of the Council’s debt recovery efforts.
1.3
KEY FINANCIAL INDICATORS
Purpose – Similar to the Unrestricted Current Ratio, this is a measure of the Council’s ability to meet short-term financial shocks, whether they be reductions in anticipated revenues or unplanned additional expenditure (measured in $).
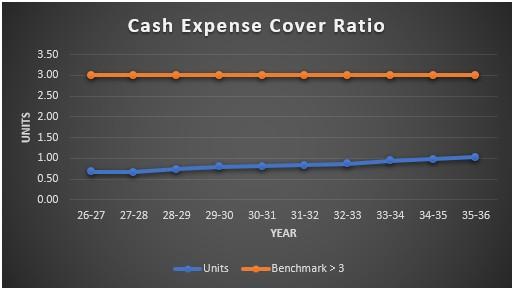
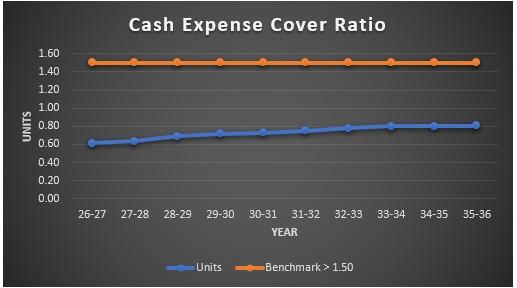
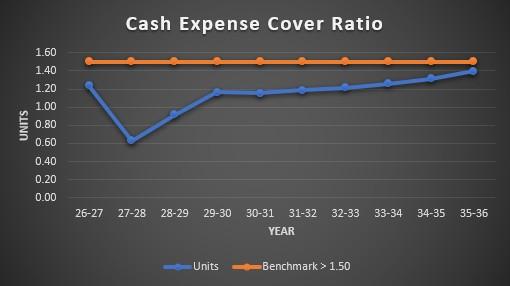
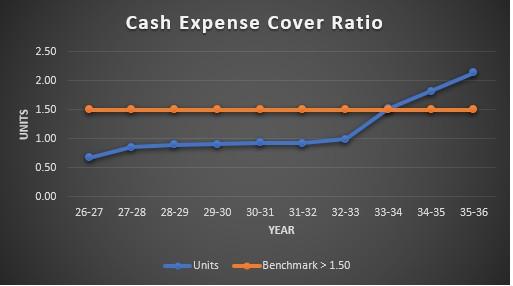
1.4 Cash Expense Cover Ratio – The current year's cash and cash equivalents and all term deposits divided by payments from the cash flow of operating and financing activities, multiplied by 12, as per Note 13 of the Local Government Code of Accounting Practice & Financial Reporting Update 25 – benchmark >3 months.
Purpose – This liquidity ratio indicates the number of months the Council can continue paying for its immediate expenses without additional cash inflow.
COUNCIL’S KFI GOAL
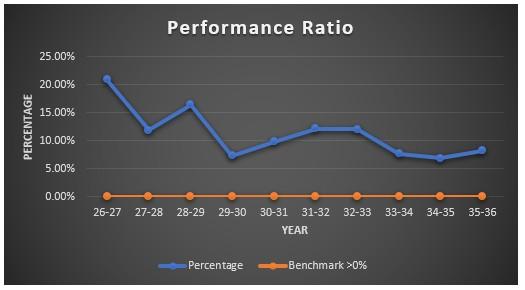
2.1 Operating Performance Ratio – The total continuing operating revenue, excluding capital grants and contributions less operating expenses, divided by the total continuing operating revenue. The total continuing operating revenue excludes fair value adjustments and reversal of revaluation decrements, net gain/(loss) on sale of assets and the net share of interests in joint ventures & associates, as per Note 13 of the Local Government Code of Accounting Practice & Financial Reporting Update 25 –benchmark >0%.
Purpose – This ratio measures the Council’s achievement of containing operating expenditure within operating revenue. The Council should not be recording recurring operating deficits or funding operating results from capital revenues.
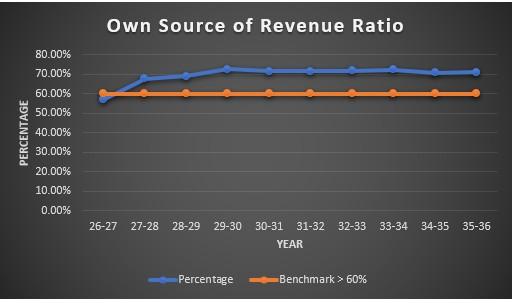
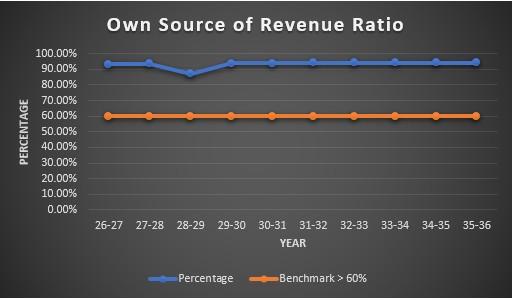
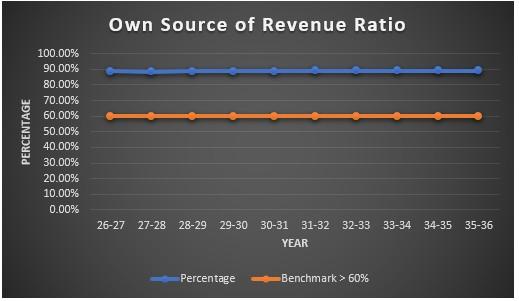
2.2 Own Source Revenue Ratio – The total continuing operating revenue (excluding ALL grants & contributions), divided by the total continuing
operating revenue inclusive of all grants and contributions. The total continuing operating revenue excludes fair value adjustments and reversal of revaluation decrements, net gain/(loss) on sale of assets and the net share of interests in joint ventures & associates, as. As per Note 13 of the Local Government Code of Accounting Practice & Financial Reporting Update 25 – benchmark >60%.
Purpose – This ratio measures fiscal flexibility. It is the degree of reliance on external funding sources such as operating grants & contributions. The Council’s financial flexibility improves as its own source revenue increases.
2.3 Debt Service Cover Ratio – Operating result before capital (excludes fair value adjustments and reversal of revaluation decrements, net gain/(loss) on sale of assets, interest expense, depreciation / impairment / amortisation and the net share of interests in joint ventures & associates), divided by principal repayments (from the Statement of Cash Flows) plus borrowing costs (from the Income Statement), as per Note 13 of the Local Government Code of Accounting Practice & Financial Reporting Update 25 – benchmark >2x.
Purpose – This ratio measures the availability of operating cash to service debt including interest, principal and lease payments.
COUNCIL’S KFI GOAL
‘Fit for the Future’ KFI (General Fund Only)
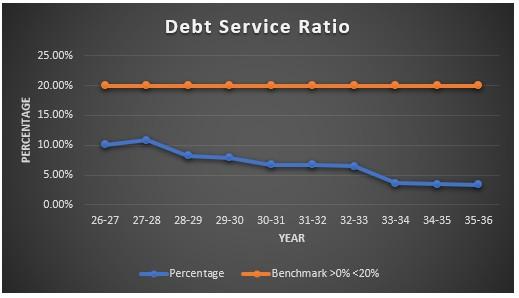
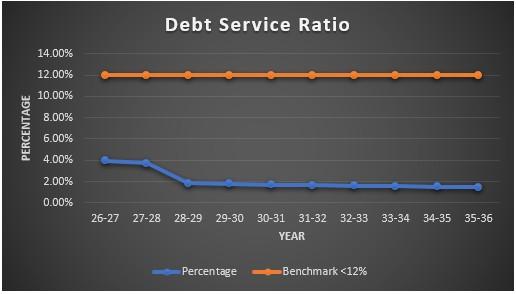
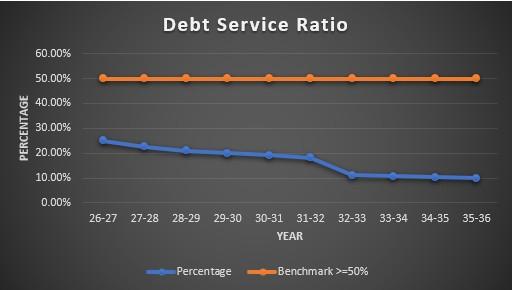
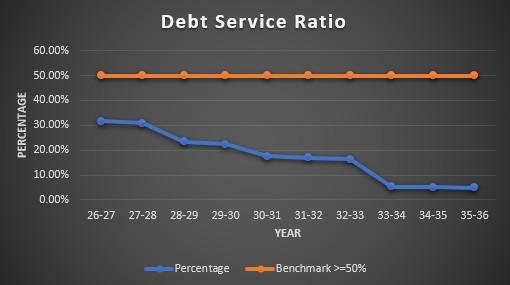
2.4 Debt Service Ratio – Cost of debt service (interest expense & principal repayments) divided by total continuing operating revenue (excluding capital grants and contributions).
KEY FINANCIAL INDICATORS
Purpose – A Council with a low or zero level of debt may incorrectly place the funding burden on current ratepayers when in fact it could be spread across generations, who also benefit from the assets. High levels of debt generally indicate a weakness in financial sustainability and/or poor balance sheet management.
2.5 Real Operating Expenditure Per Capita – Operating expenditure indexed by the Local Government Cost Index, divided by population of the Council area. Per IPART’s ‘Fit for the Future’ (FFTF) requirement, there must be a demonstrated decrease in the ratio over time, i.e. operational savings (net of IP&R supported service improvements) over 5 years
Purpose – Changes in real operating expenditure per capita are considered to assess how effectively the Council:
can realise natural efficiencies as population increases (through lower average costs of service delivery and representation); and
can make necessary adjustments to maintain current efficiency if the population is declining (e.g. appropriate reductions in staffing or other costs)
Assuming that service levels remain constant, a decline in real expenditure per capita indicates efficiency improvements (i.e. the same level of output per capita is achieved with reduced expenditure).
General Fund <12%, Water & Sewer Fund <=50% (per Council’s Borrowing Policy)
>0%<=20%
COUNCIL’S KFI GOAL ‘Fit for the Future’ KFI (General Fund Only)
General Fund only –A decline in ratio
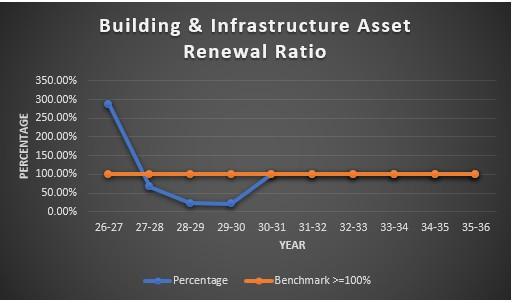
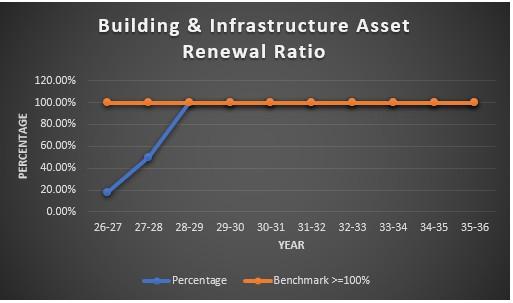
3.1 Building & Asset Renewal Ratio – Expenditure on building and infrastructure asset renewals divided by depreciation, amortisation & impairment for building and infrastructure assets, as per Special Schedule
7 of the Local Government Code of Accounting Practice & Financial Reporting Update 25 – benchmark >100%.
Purpose – This measure assesses the rate at which building & infrastructure assets are being renewed & upgraded against the rate at which they are depreciating.
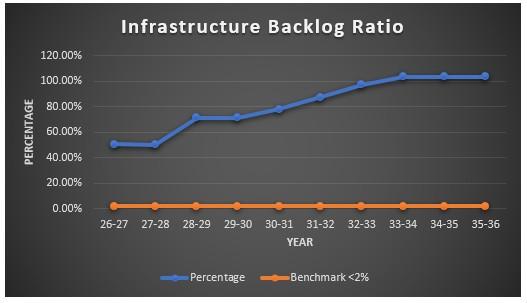
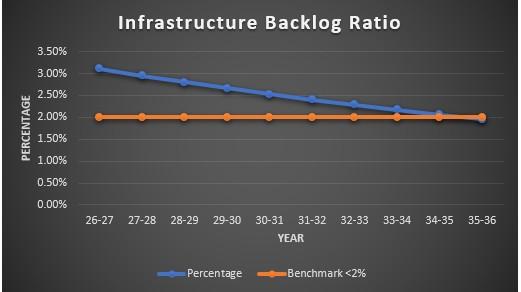
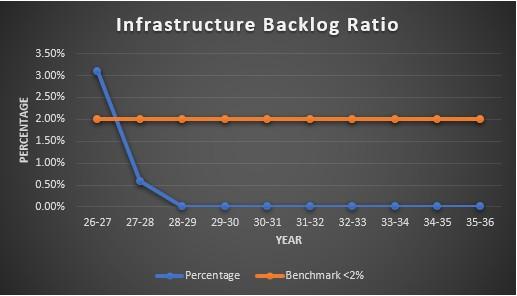
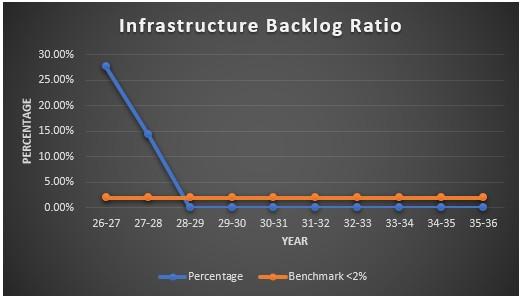
3.2 Infrastructure Backlog Ratio – Estimated cost to bring assets to a satisfactory condition, divided by carrying value of infrastructure, building, other structures and depreciable land improvement assets, as per Special Schedule 7 of the Local Government Code of Accounting Practice & Financial Reporting Update 25 – benchmark <2%.
Purpose – This ratio shows what the proportion of the infrastructure backlog is against the total value of the Council’s infrastructure.
3.3 Cost to bring assets to agreed service level – Estimated cost to bring to an agreed level of service set by the Council, divided by gross replacement cost, as per Special Schedule 7 of the Local Government Code of Accounting Practice & Financial Reporting Update 26. There is no industry benchmark available.
Purpose – To assess the proportion of outstanding renewal works compared to the total suite of assets that the Council has under its care and stewardship.
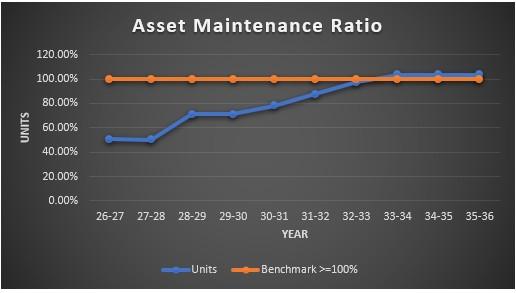
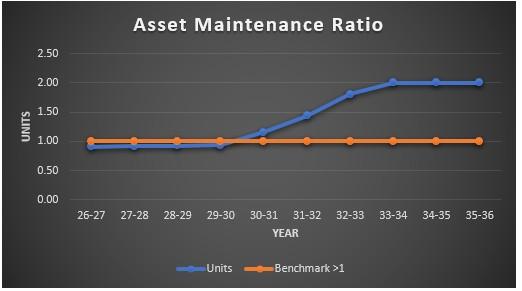
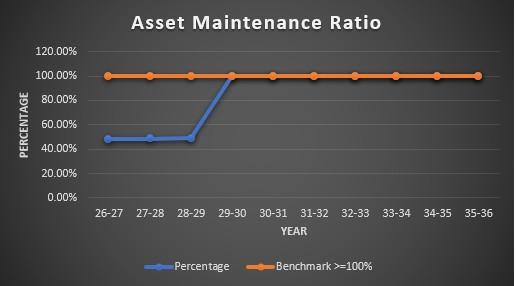
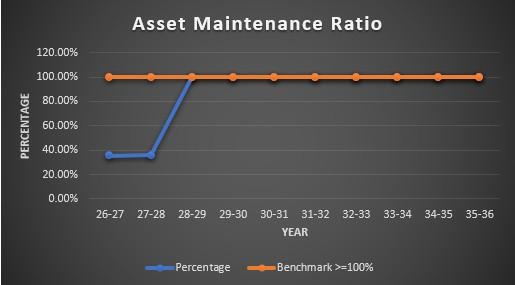
3.4 Asset Maintenance Ratio – Actual asset maintenance divided by required asset maintenance, as per Special Schedule 7 of the Local Government Code of Accounting Practice & Financial Reporting Update 25 – benchmark >100%.
COUNCIL’S KFI GOAL
KEY FINANCIAL INDICATORS
Purpose – Compares actual vs required annual asset maintenance. A ratio above 100% indicates that the Council is investing enough funds that year to halt the growth of the infrastructure backlog.
3.5 Asset Sustainability Ratio – Planned capital expenditure on renewing and replacing existing assets (net of proceeds from sale of replaced assets), divided by the optimal level proposed in the Council’s AMP. Local Government Association South Australia
Financial Sustainability Information Paper No.9: Financial Indicators
– Revised February 2012.
Purpose – Indicates the extent to which existing non-financial assets are being renewed and replaced compared with what is needed to cost-effectively maintain service levels. Achievement of the suggested target would mean that the Council was reasonably optimising the timing of capital outlays on the renewal/replacement of assets.