


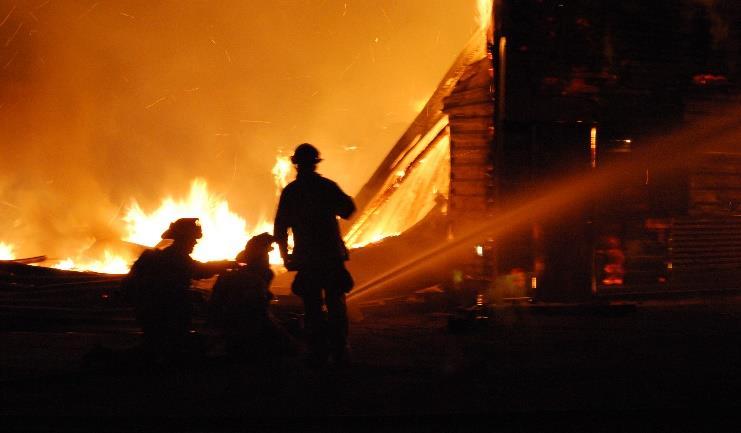


 Photo 1 Front Row, left to right: Craig Faith, Trish Carlyle, Mayor Bill Baird, Diane Forte, Phyllis Edson / Back Row, left to right: Fred DeMoro, Mayor Pro Tem Beto Lopez, Rob Binney, Bob Johnson






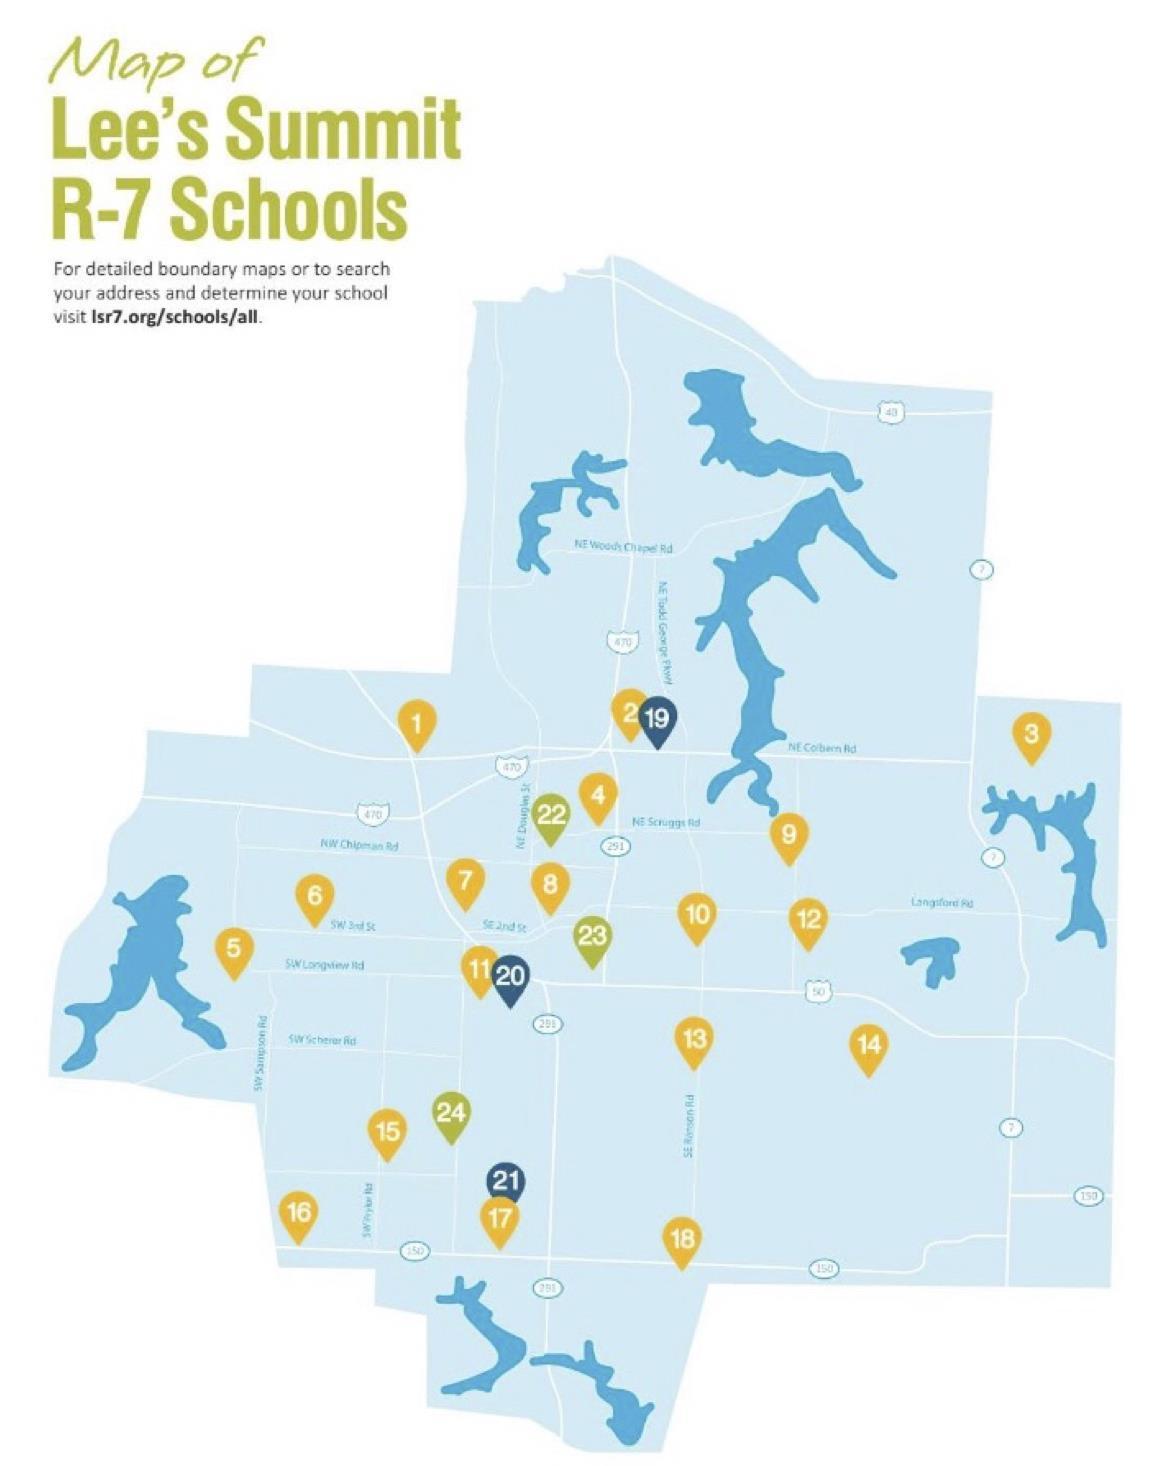 Map 1: Lee's Summit R-7 Schools
(Yellow: Elementary / Blue: Middle / Green: High)

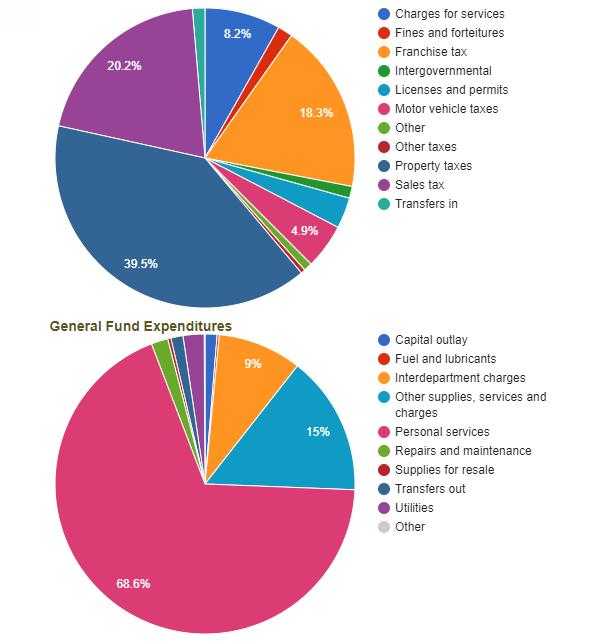 Chart 1: City Revenue and Expenditures

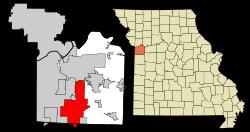
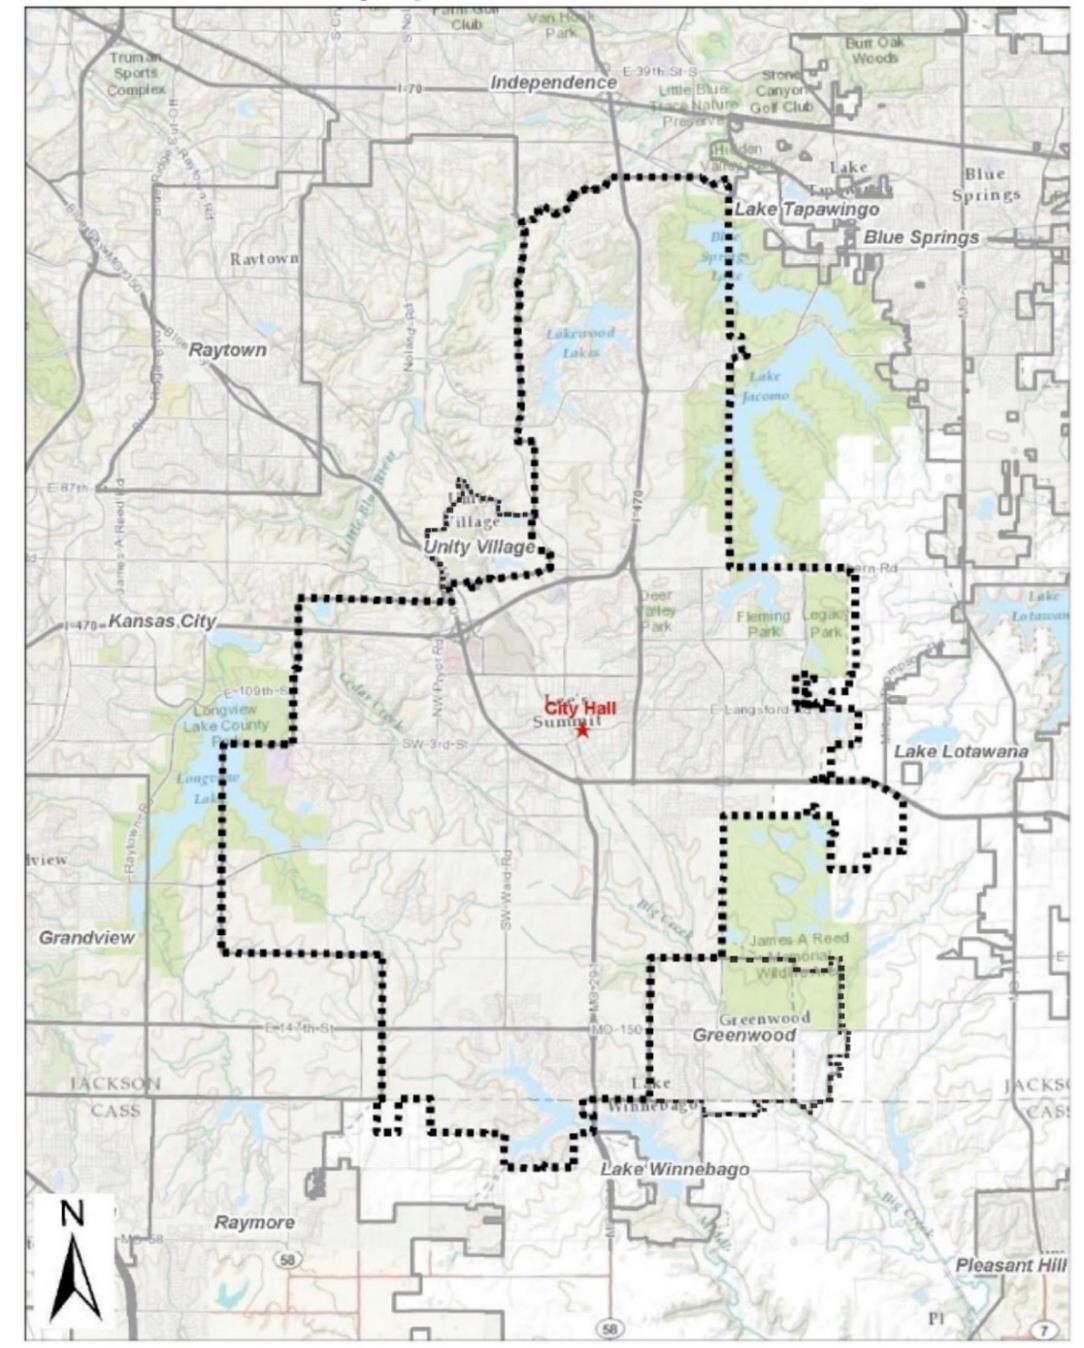 Map 2: Lee's Summit, Missouri

Map 3: Targeted Areas for Development and Redevelopment
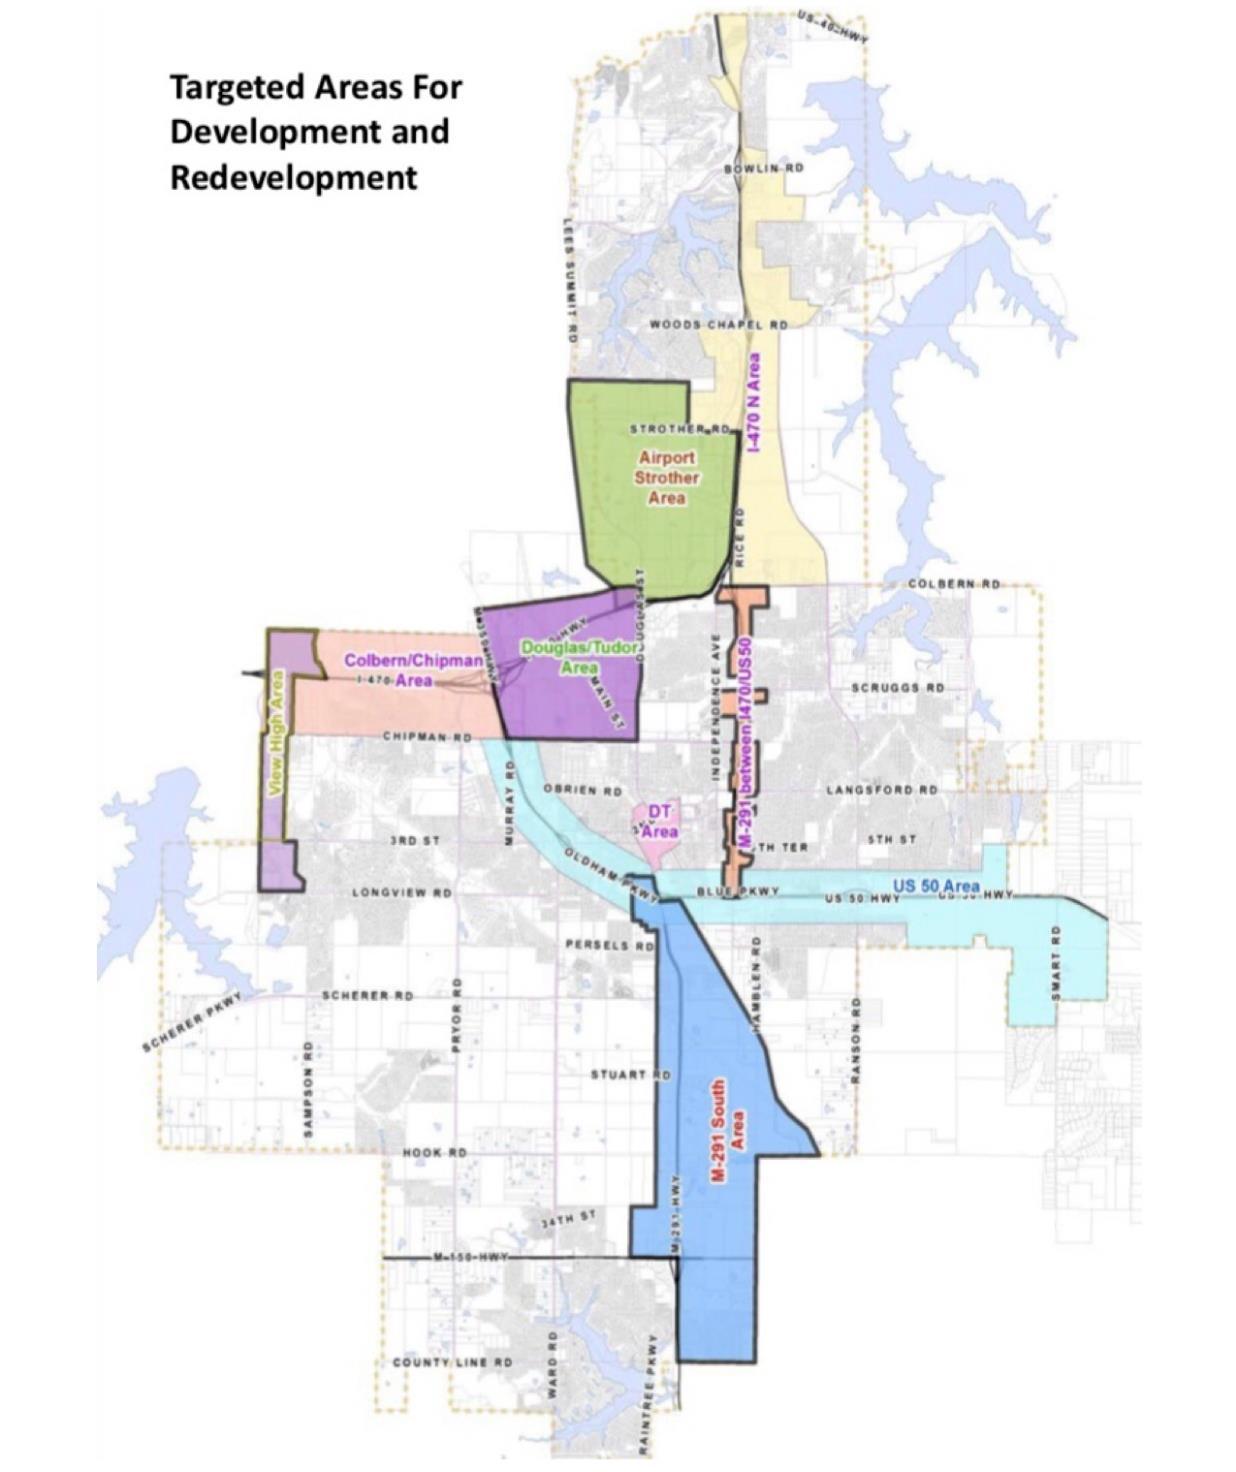


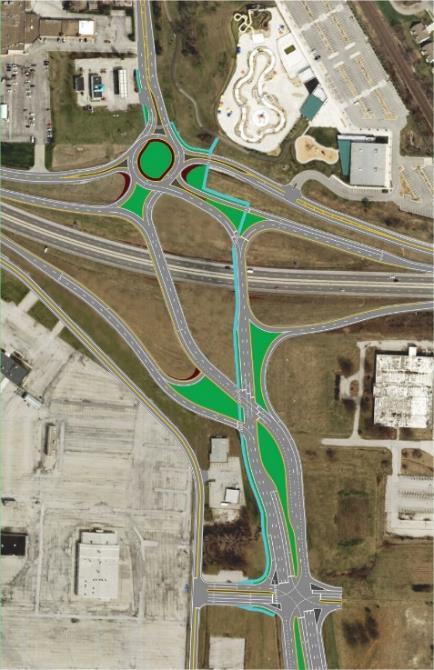

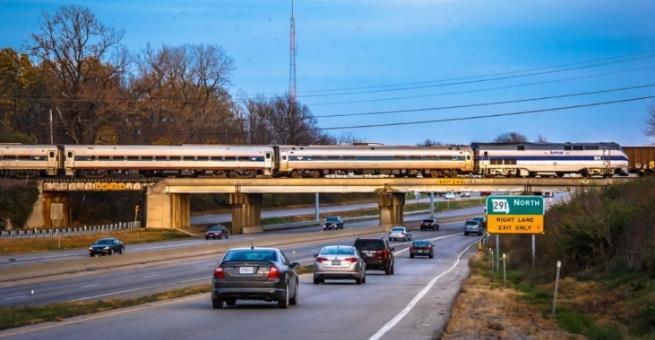


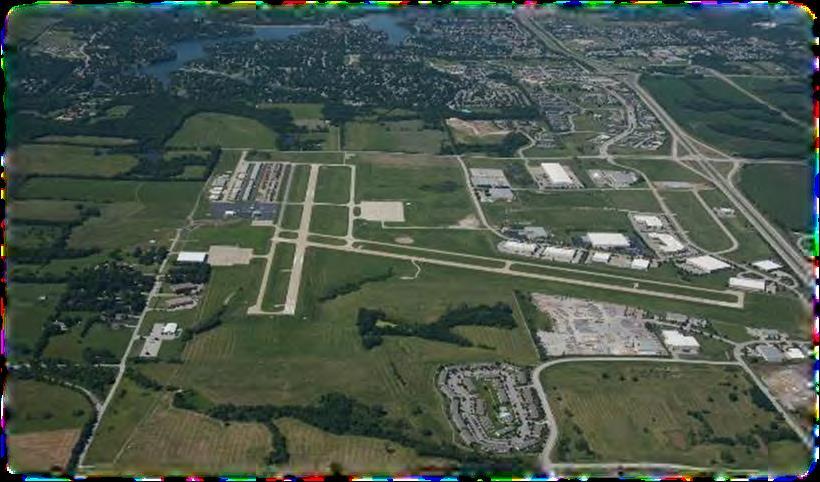




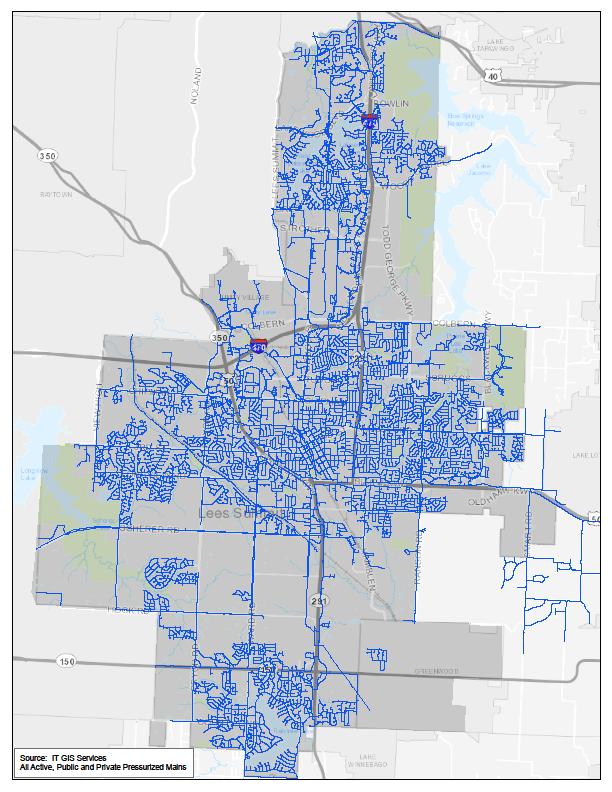 Map 4: Public and Private Pressurized Mains

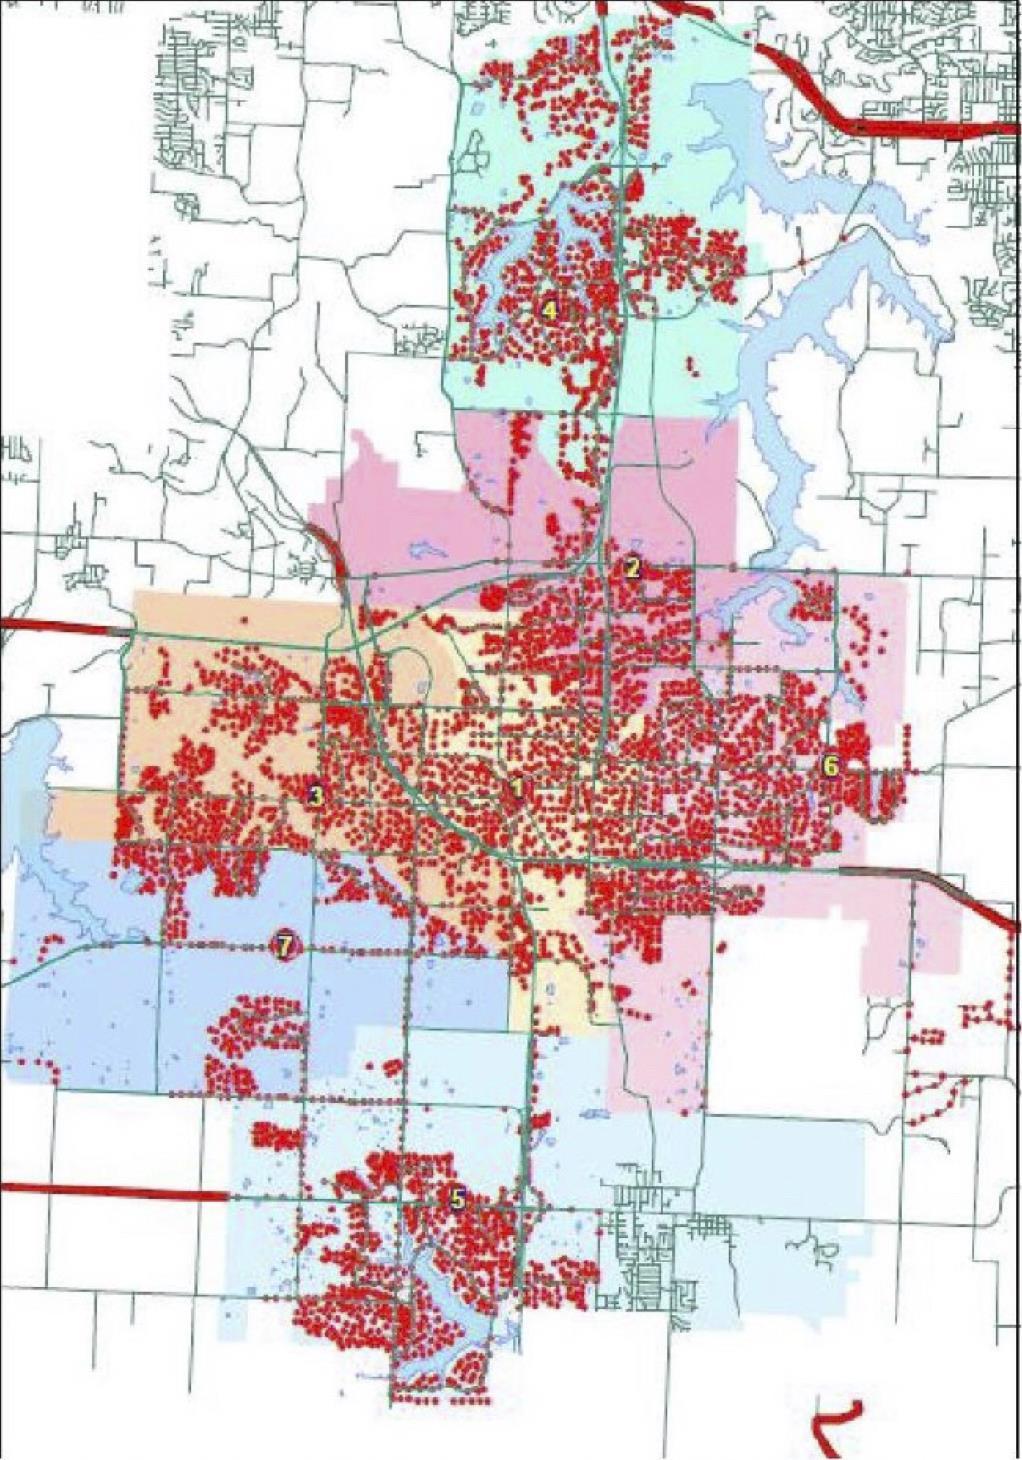 Map 5: Lee's Summit Hydrant Map

 Map 6: Spire Natural Gas Distribution Map: Northern Lee’s Summit

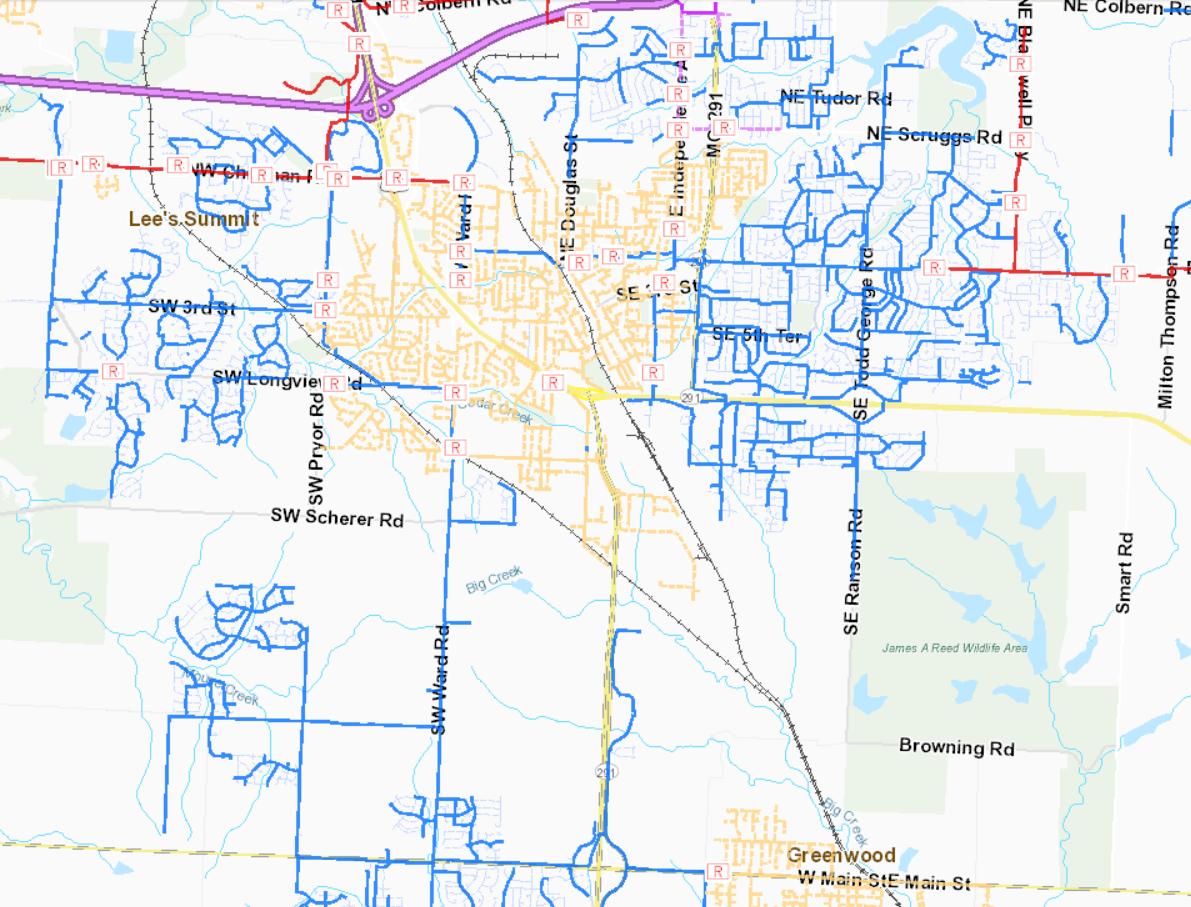
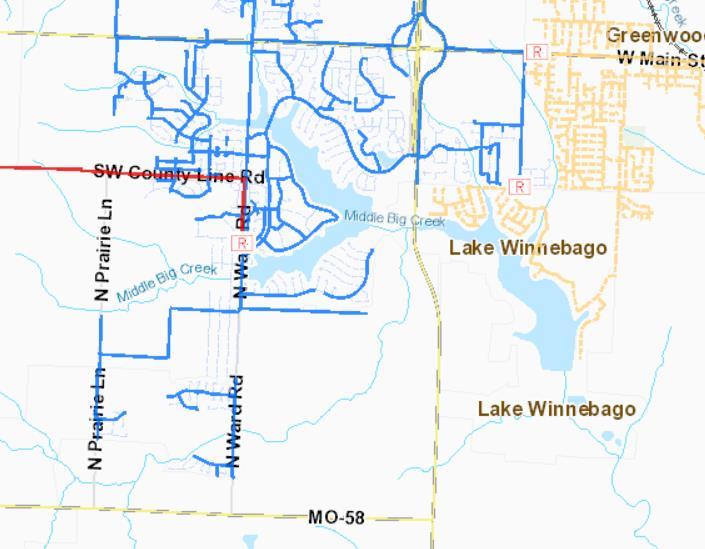 Map 7: Spire Natural Gas Distribution Map: Central Lee’s Summit
Map 8: Spire Natural Gas Distribution Map: Southern Lee’s Summit


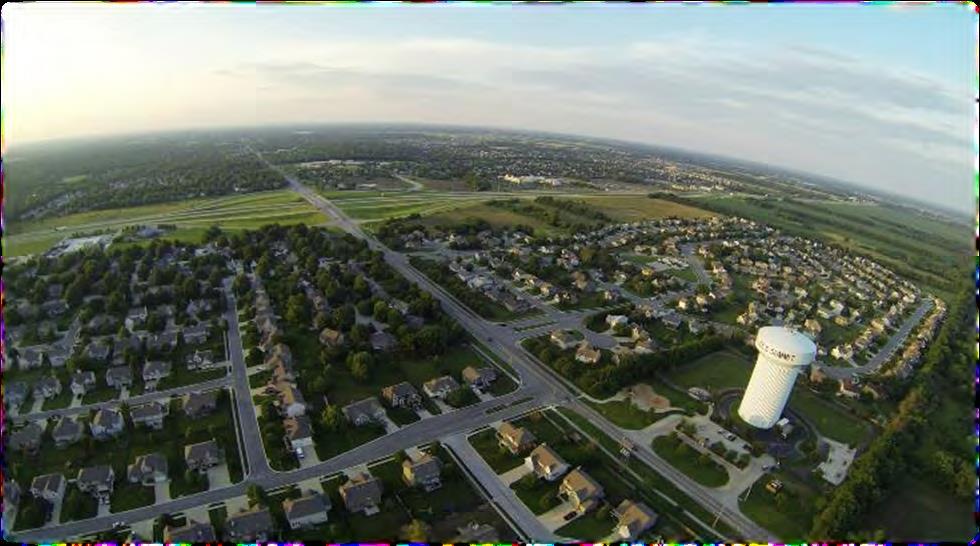

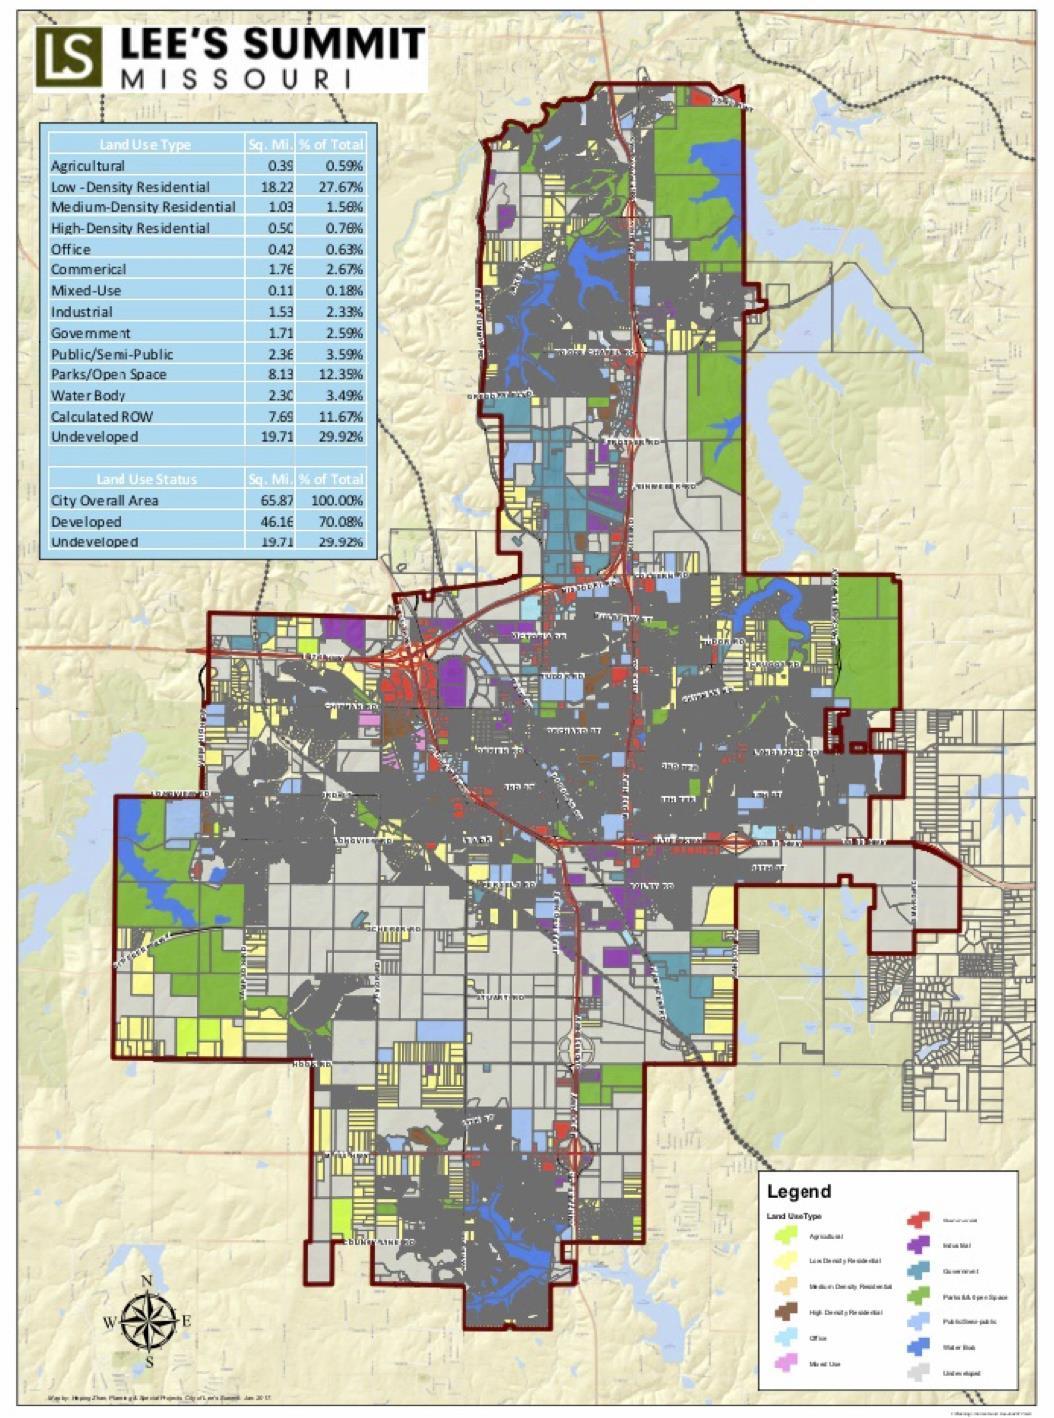 Map 9: Land Use Map (January 2017)

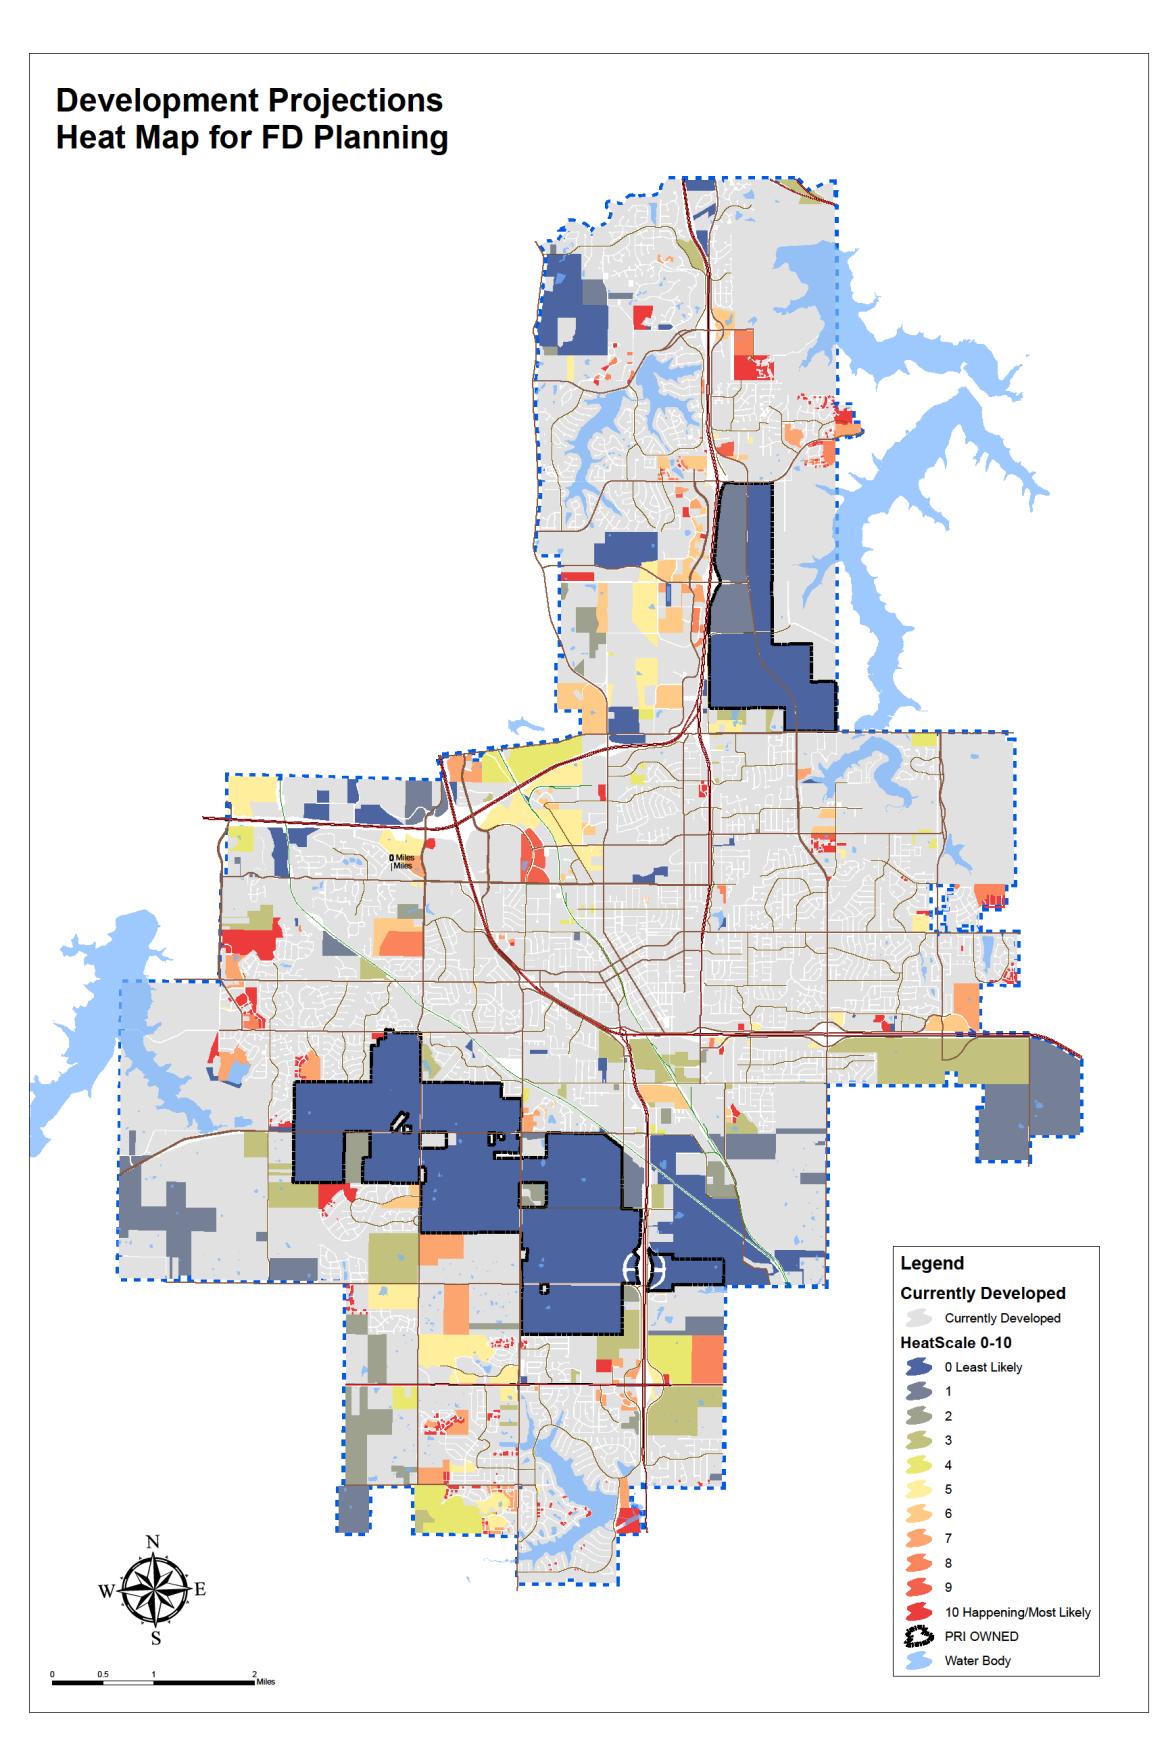






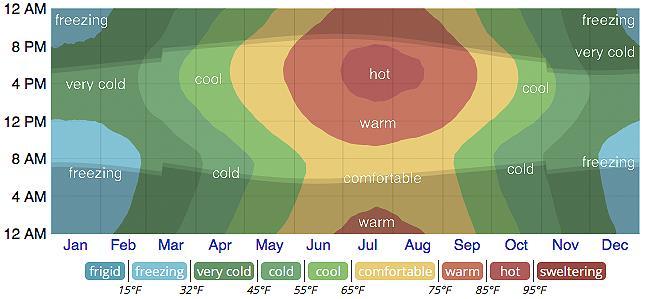 Chart 2: Average Hourly Temperature (January - December)


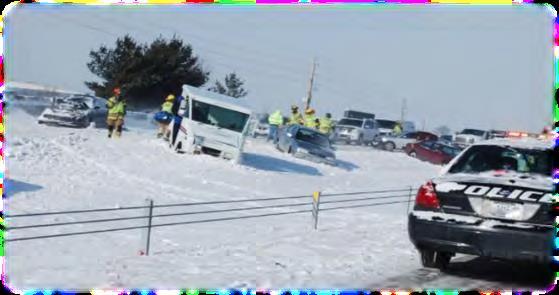 Chart 3: Climate Summary (January - December)

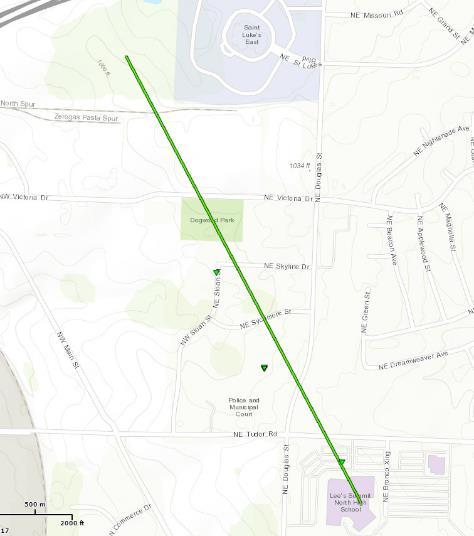

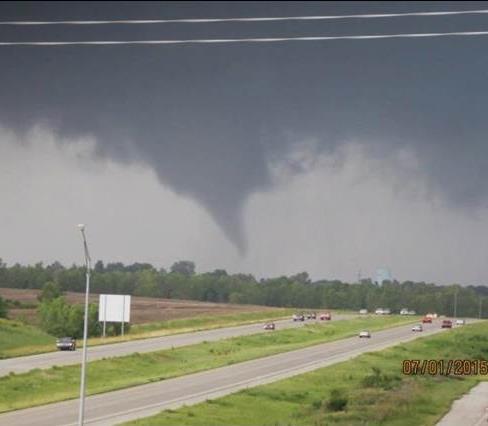
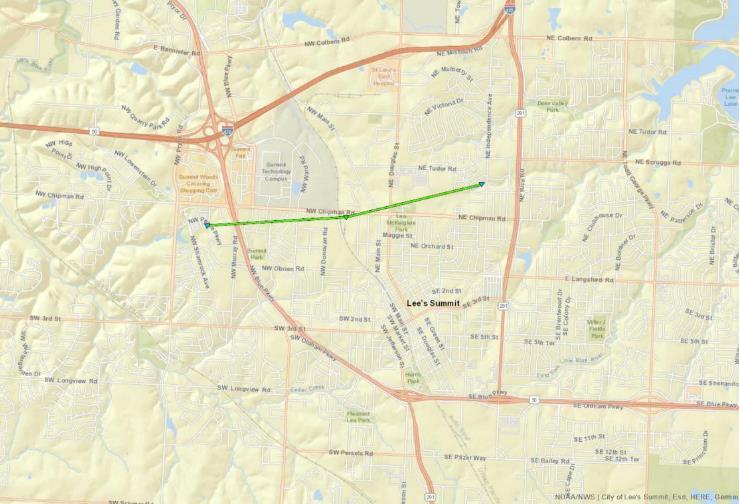 Map 11 Tornado Path - July 1, 2015
Photo 2 EF-1 Tornado (July 1, 2015)
Map 12 EF-0 Tornado Path - March 6, 2017


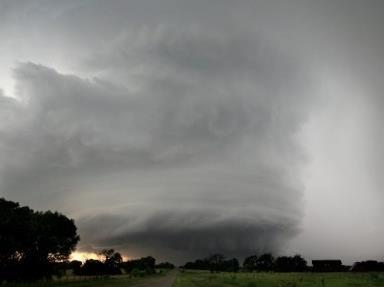

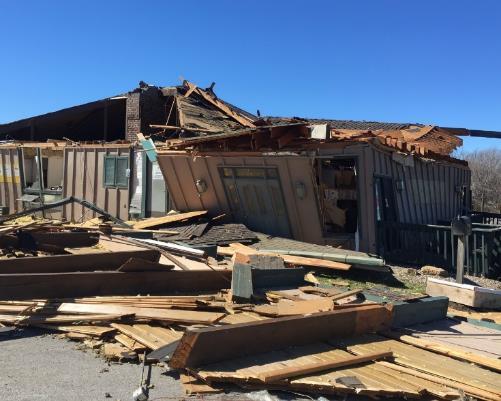

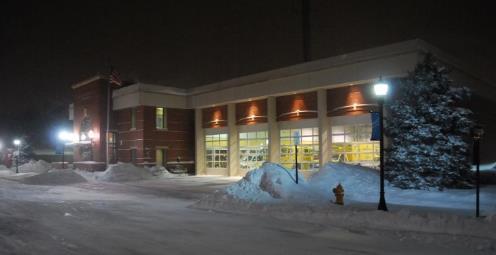 Photo 3: EF-0 Tornado (March 6, 2017)
Photo 4: Damage from EF-0 Tornado (March 6, 2017)


 Map 13: Lee's Summit Council Districts
 Chart 4: Council District 1 Operational Program Demand (2014-2018)


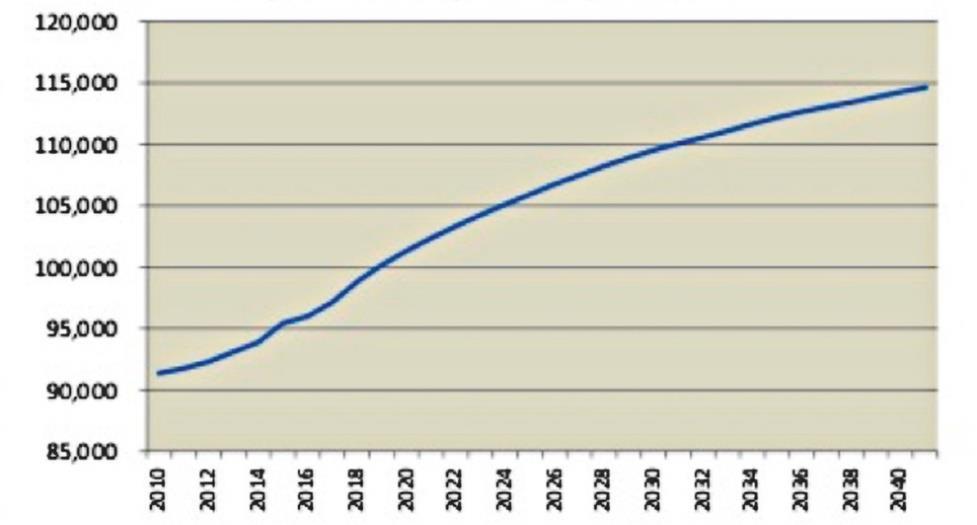
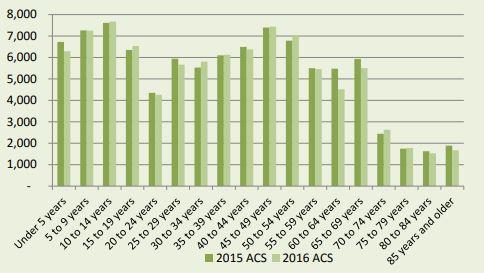 Chart 10: Projected Total Population by the end of the year (2010-2040)
Chart 11: Population by Age

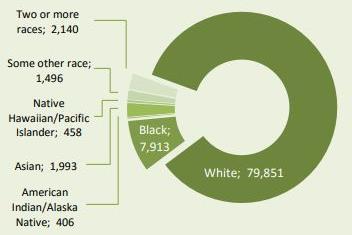
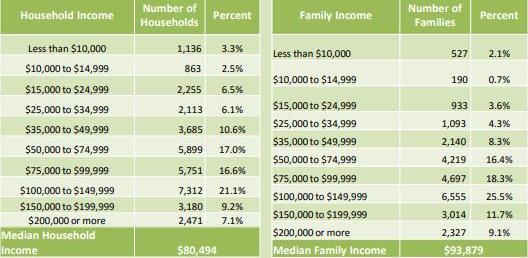 Chart 12: Population by Race
Table 1: Household and Family Income


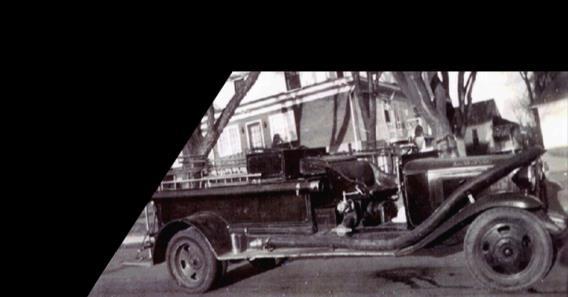

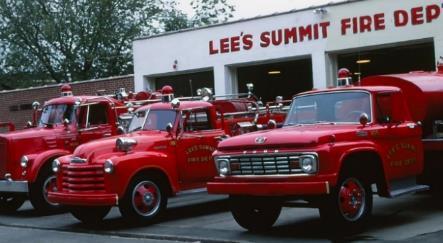


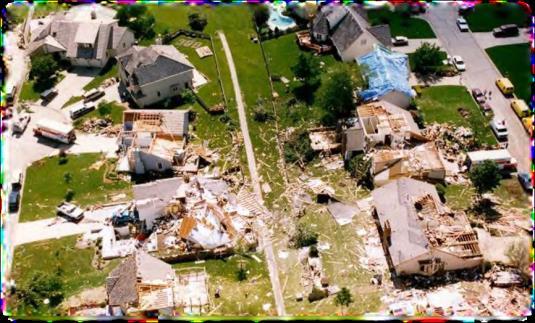


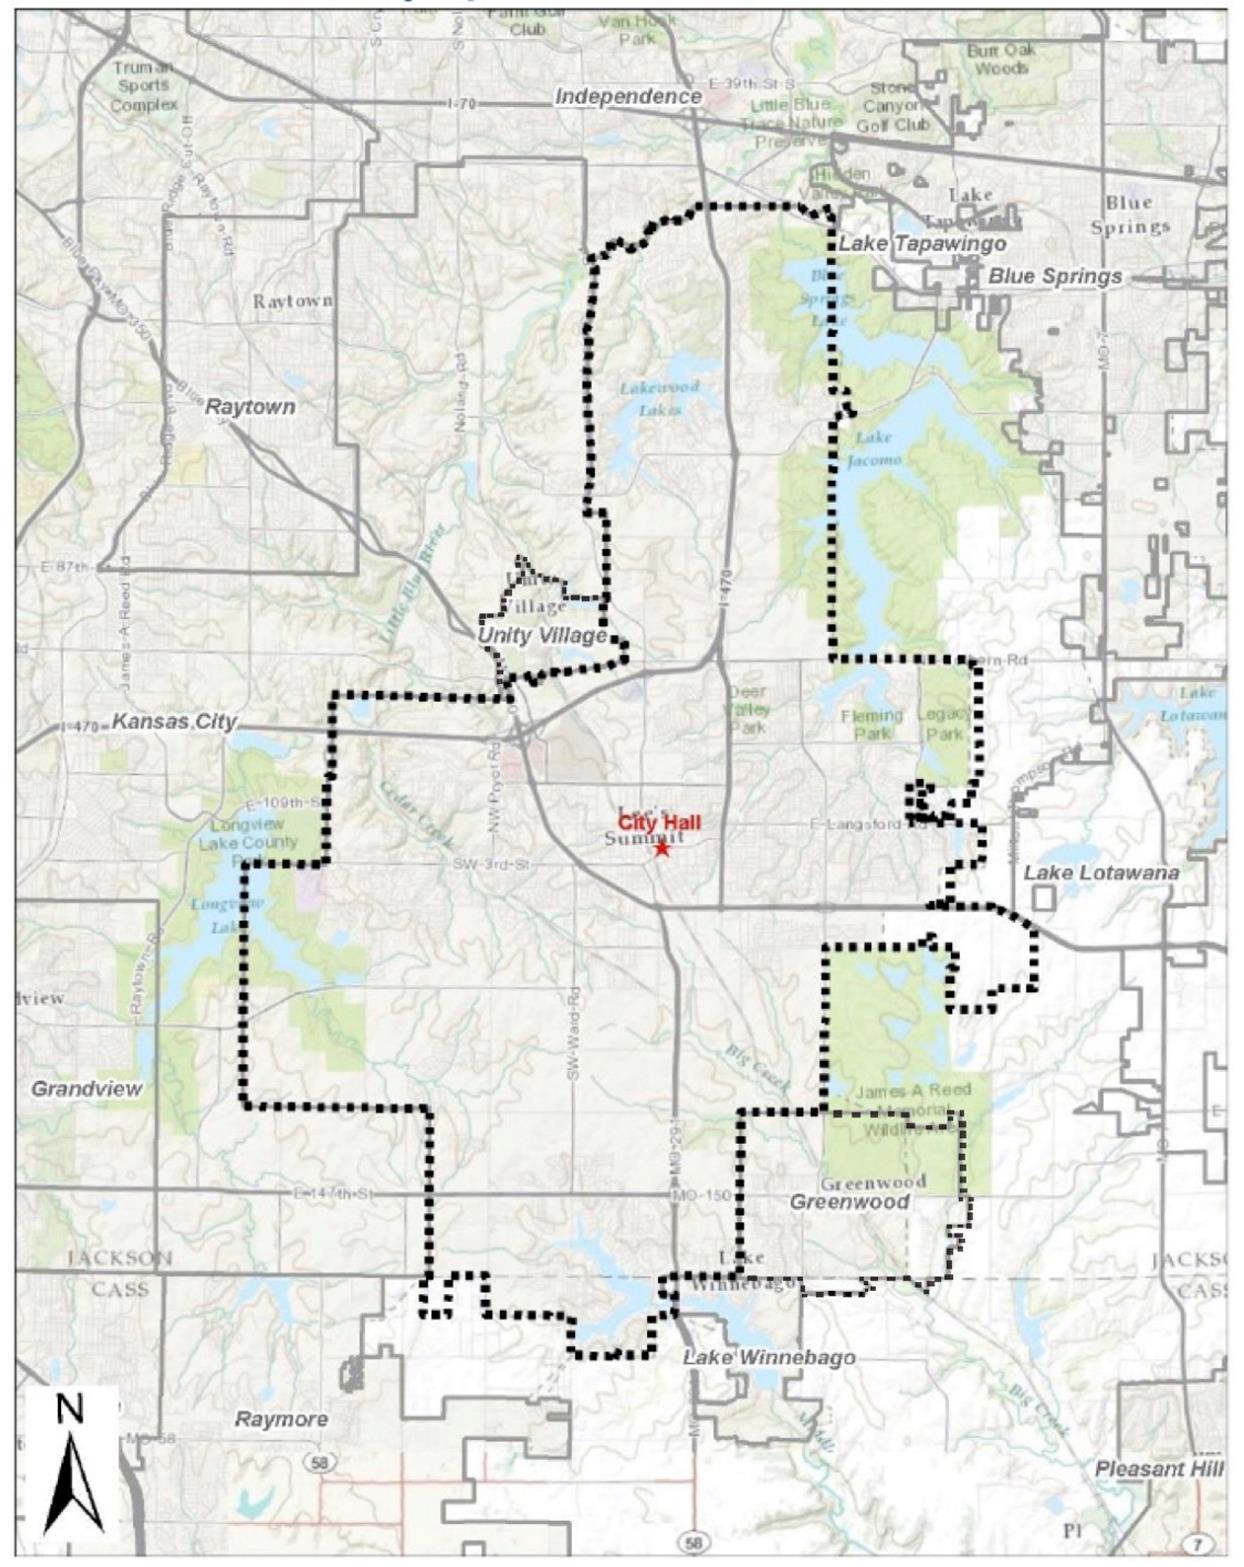 Map 14: Lee's Summit, Missouri

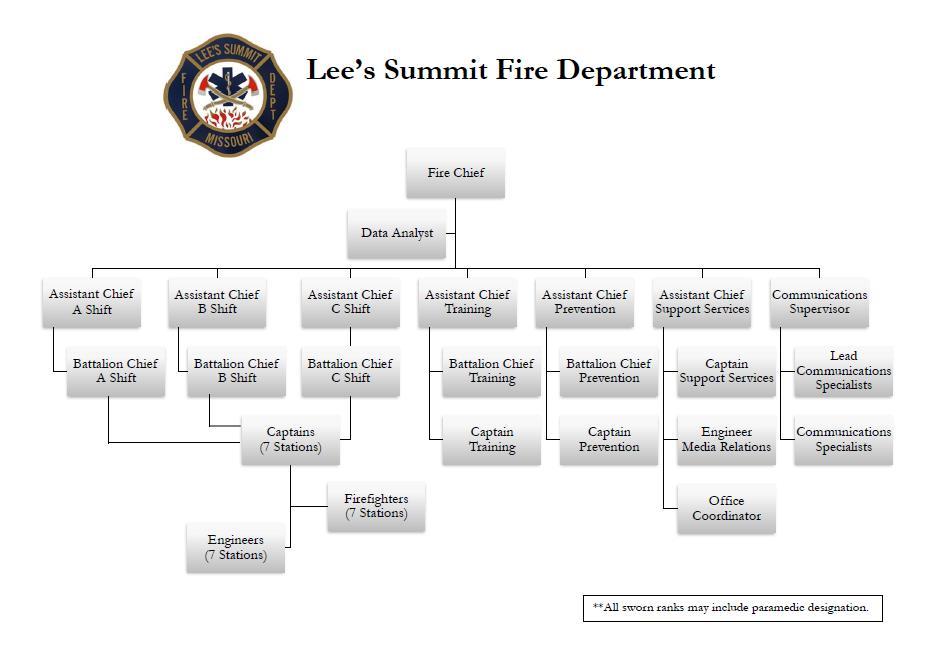


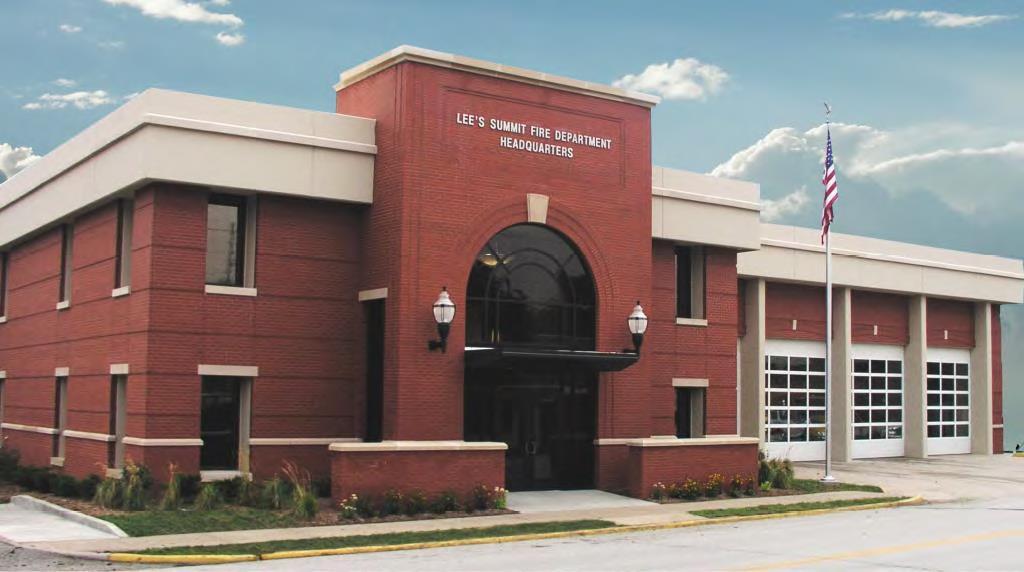

 Photo 5: Headquarters (Station 1)
Photo 6: Station 1 District


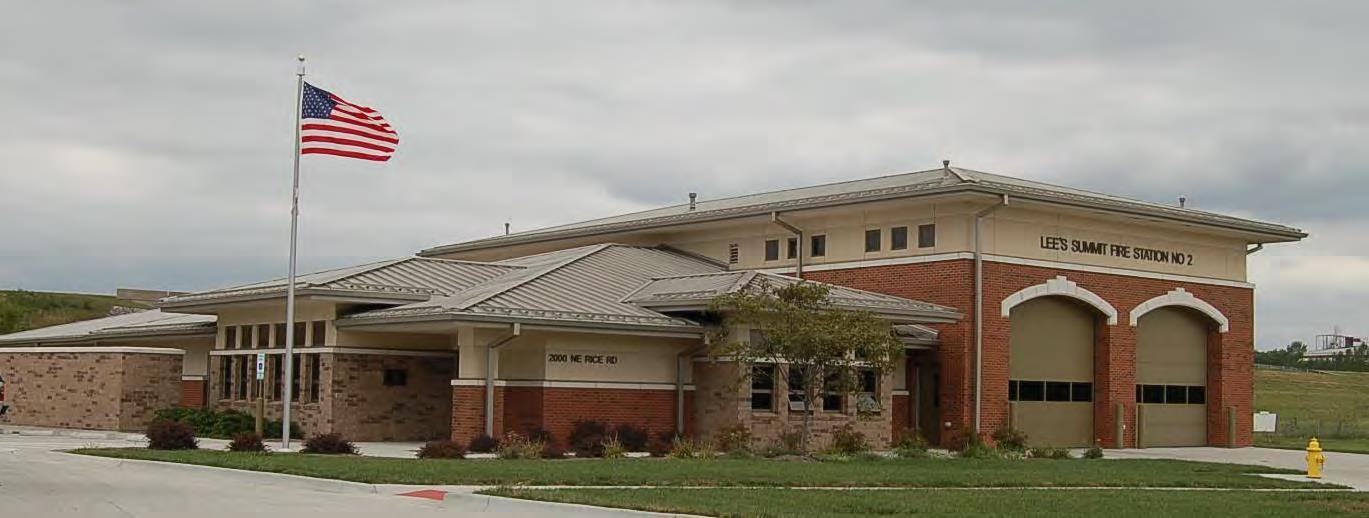

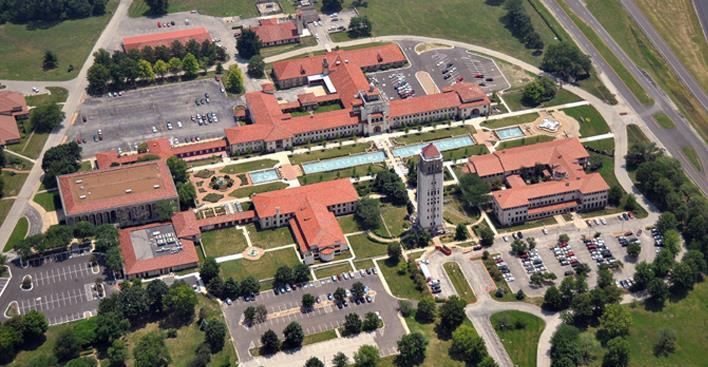 Photo 7: Station 2
Photo 8: Station 2 District (Unity Village)


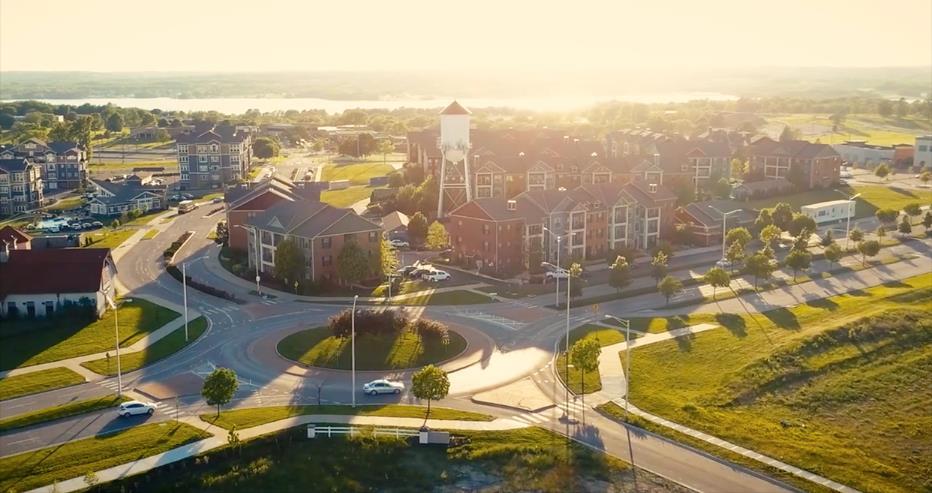 Photo 9: Station 3
Photo 10: Station 3 District


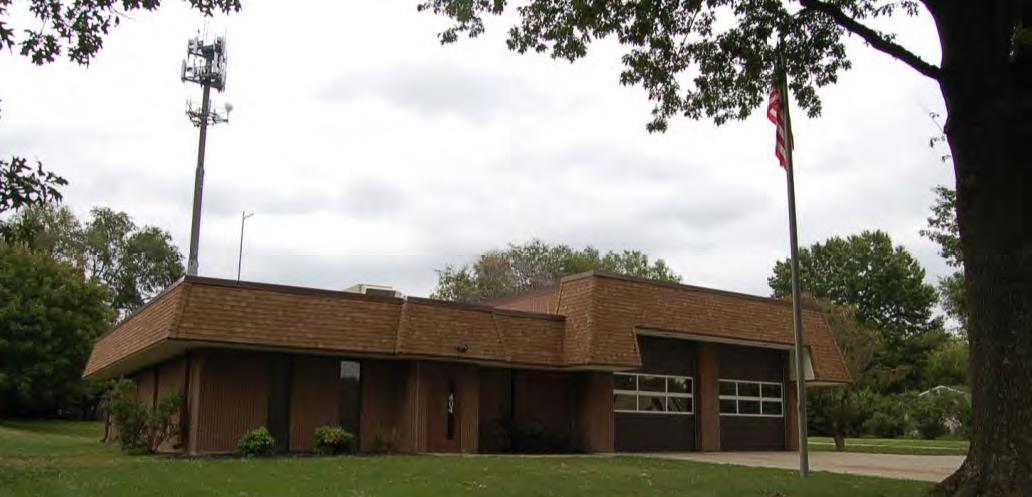

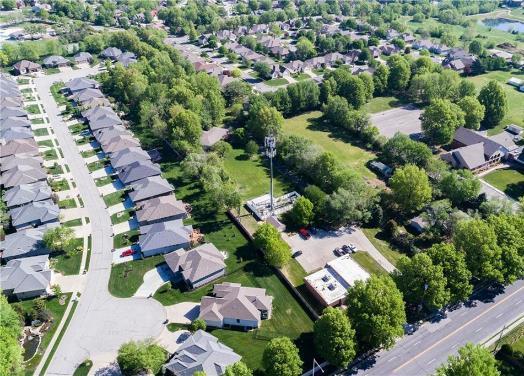

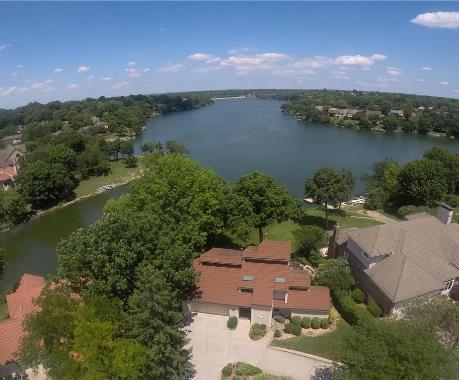 Photo 11: Station 4
Photo 12: Station 4 District


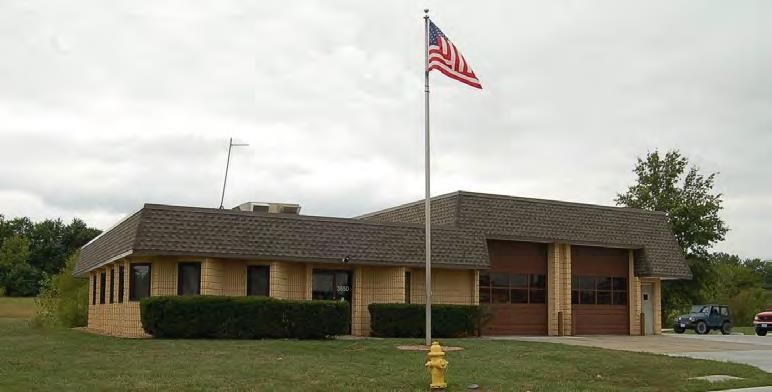

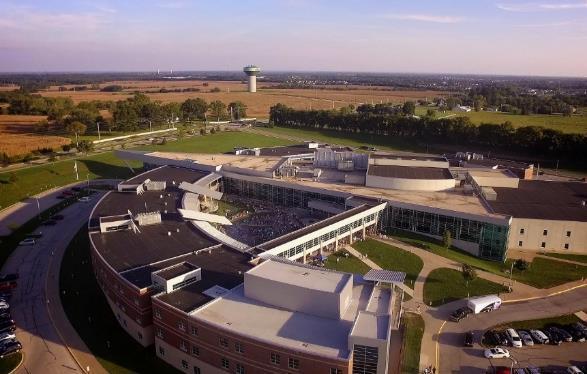

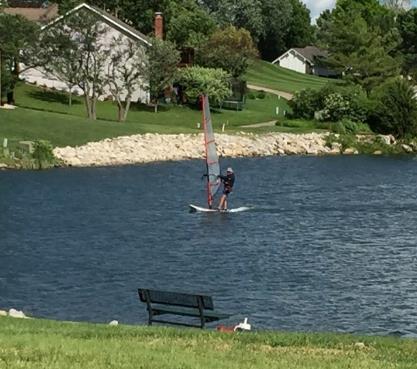 Photo 13: Station 5
Photo 14: Station 5 District


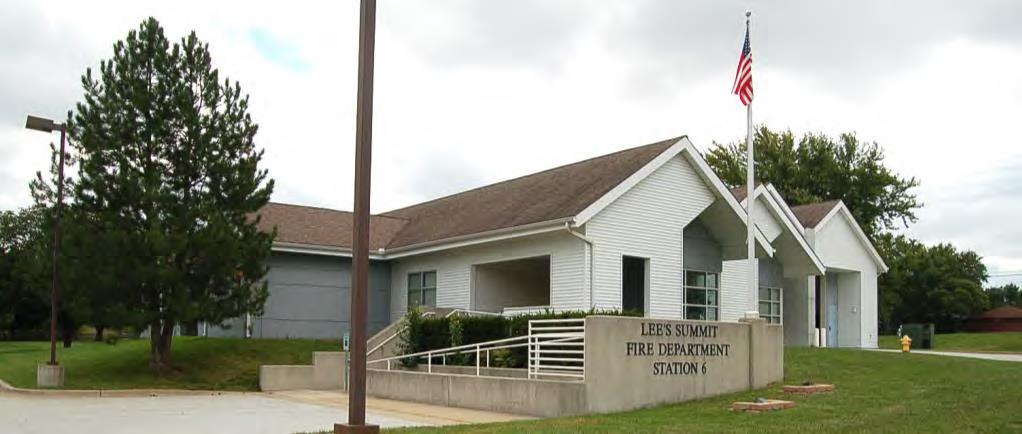

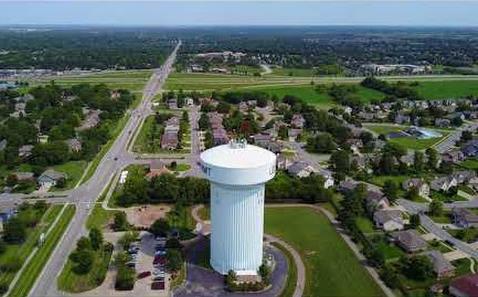

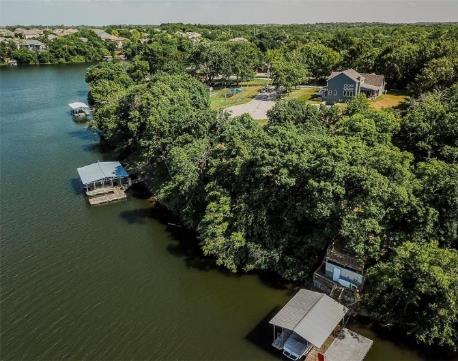 Photo 15: Station 6
Photo 16: Station 6 District


 Photo 17: Station 7
Photo 18: Station 7 District


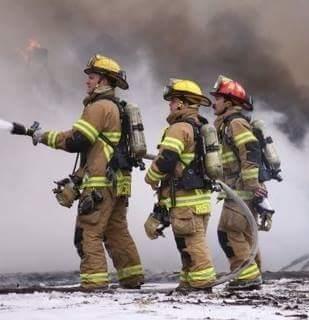


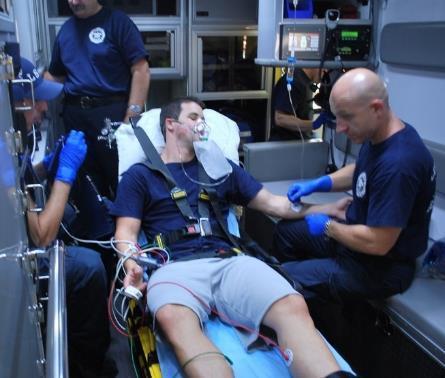

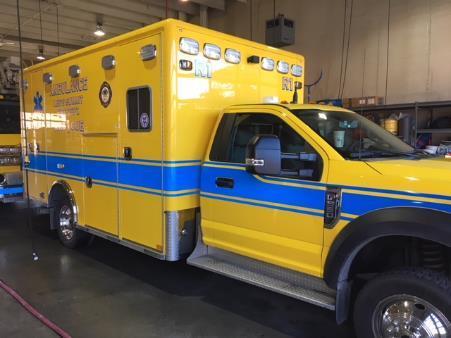


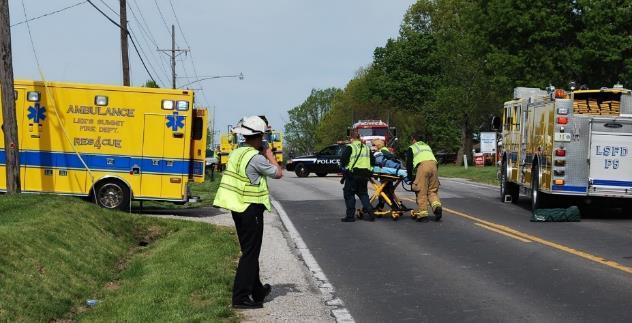


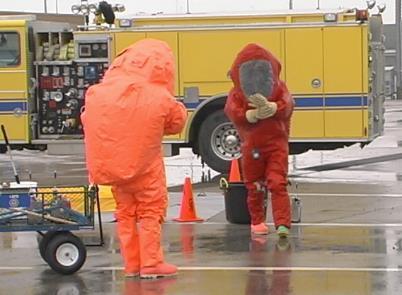

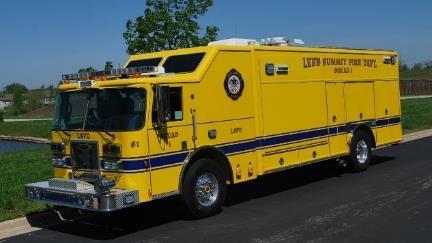

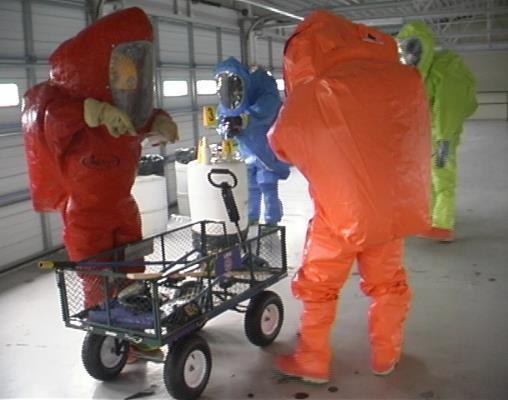


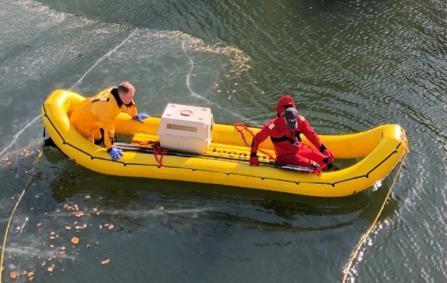





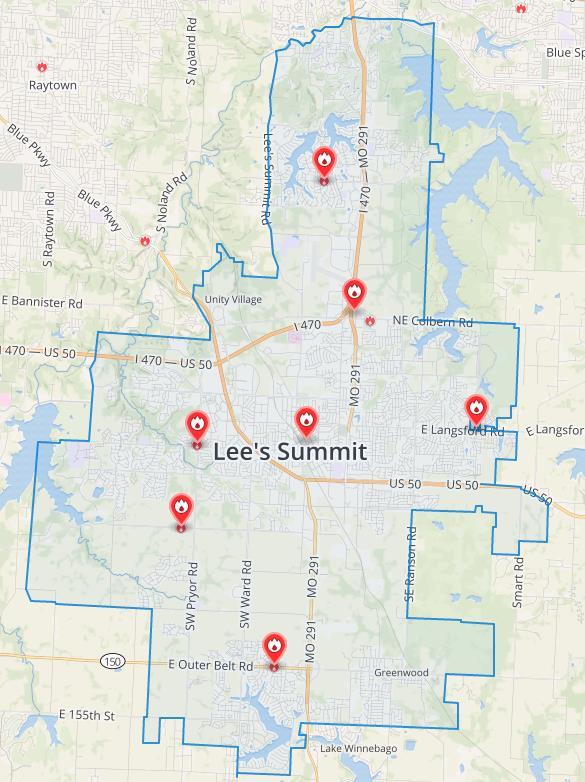 Map 15: Seven Stations within Lee's Summit (including contract cities of Unity Village and Greenwood)
Map
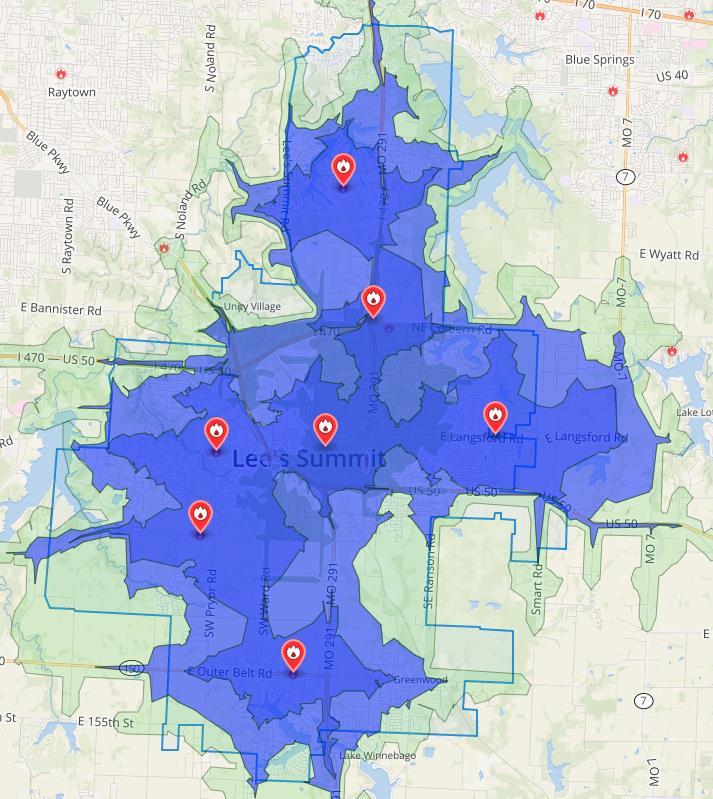
 16: Response Times within City Boundaries (dark blue = 0-4 minutes; light blue = 4-6 minutes; green = 6-8 minutes)


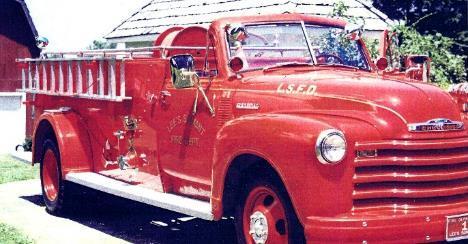
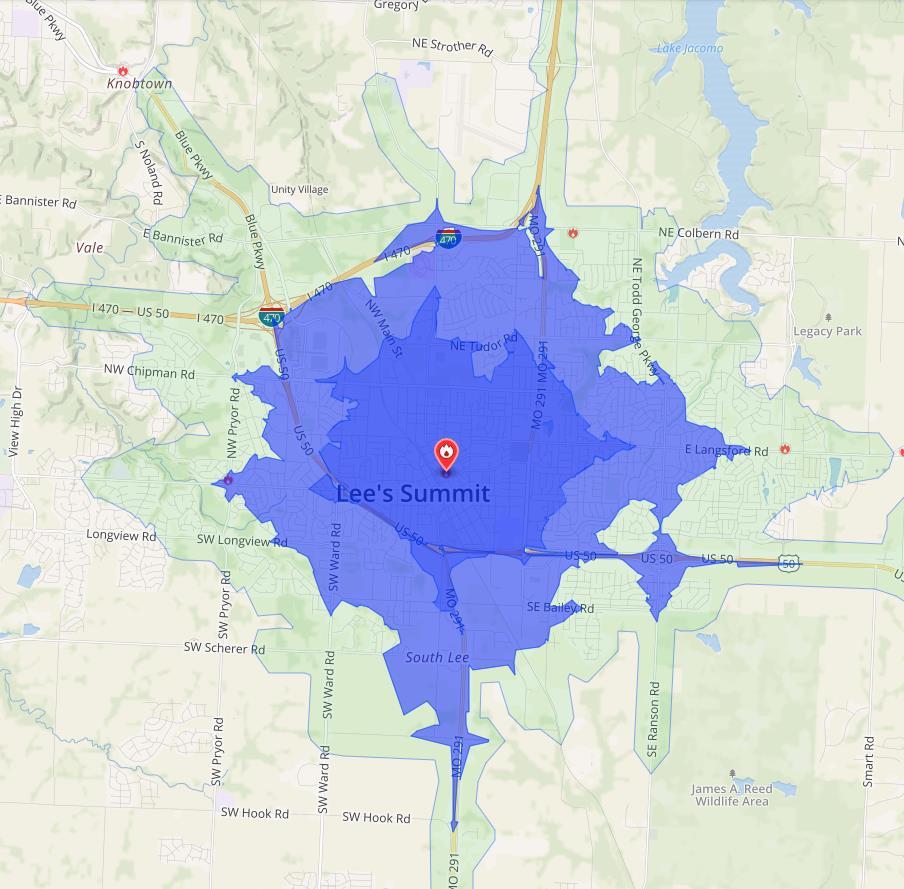 Photo 19: LSFD Station 1 Headquarters
Map 17: District 1 Response Times (dark blue = 0-4 minutes; light blue = 4-6 minutes; green = 6-8 minutes)


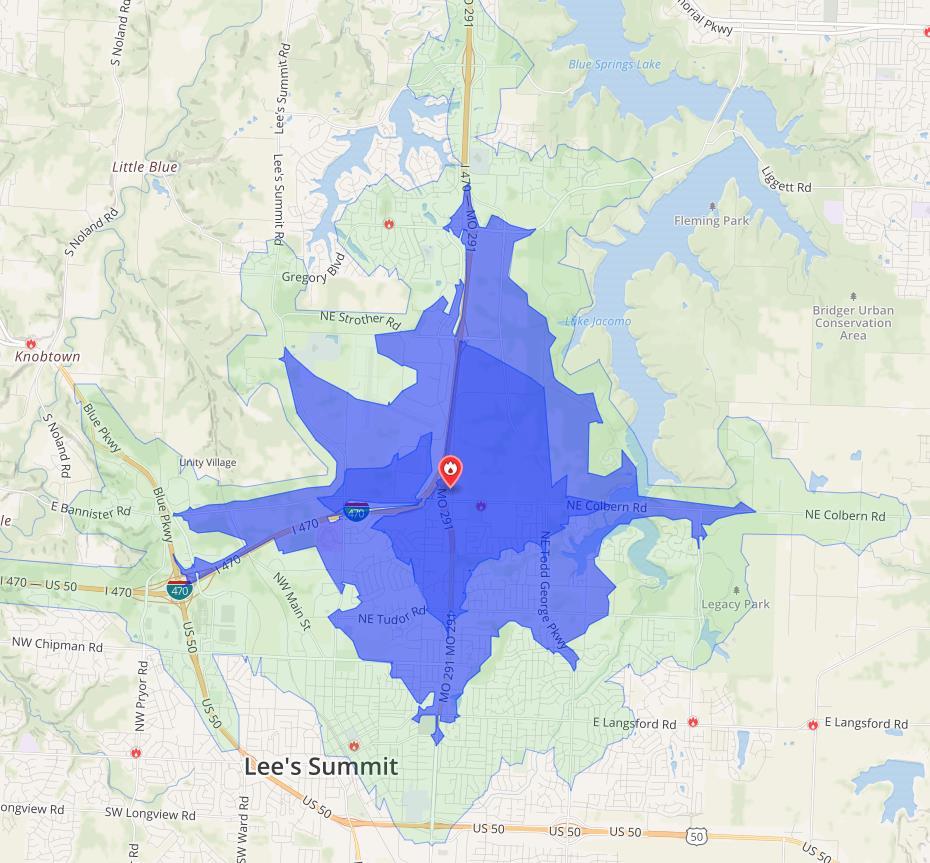 Photo 20: LSFD Station 2
Map 18: District 2 Response Times (dark blue = 0-4 minutes; light blue = 4-6 minutes; green = 6-8 minutes)


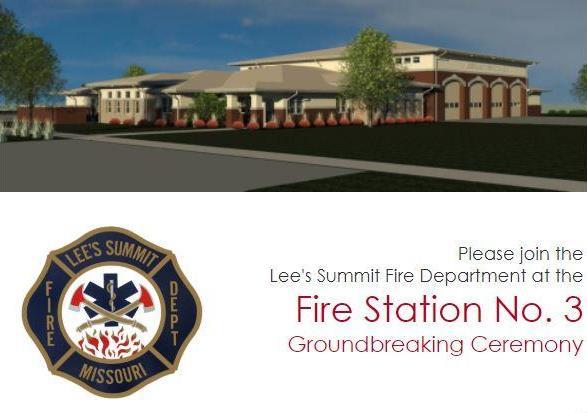
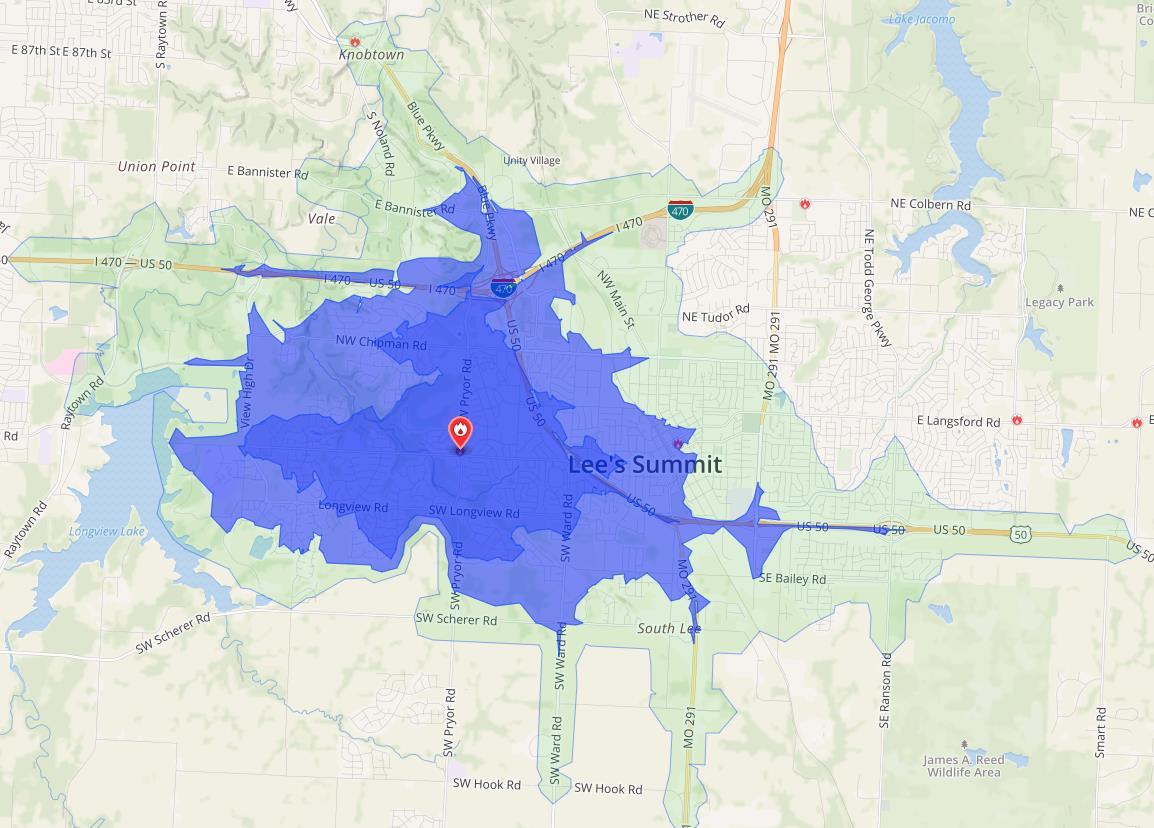 Photo 21: LSFD Station 3
Map 19: District 3 Response Times (dark blue = 0-4 minutes; light blue = 4-6 minutes; green = 6-8 minutes)


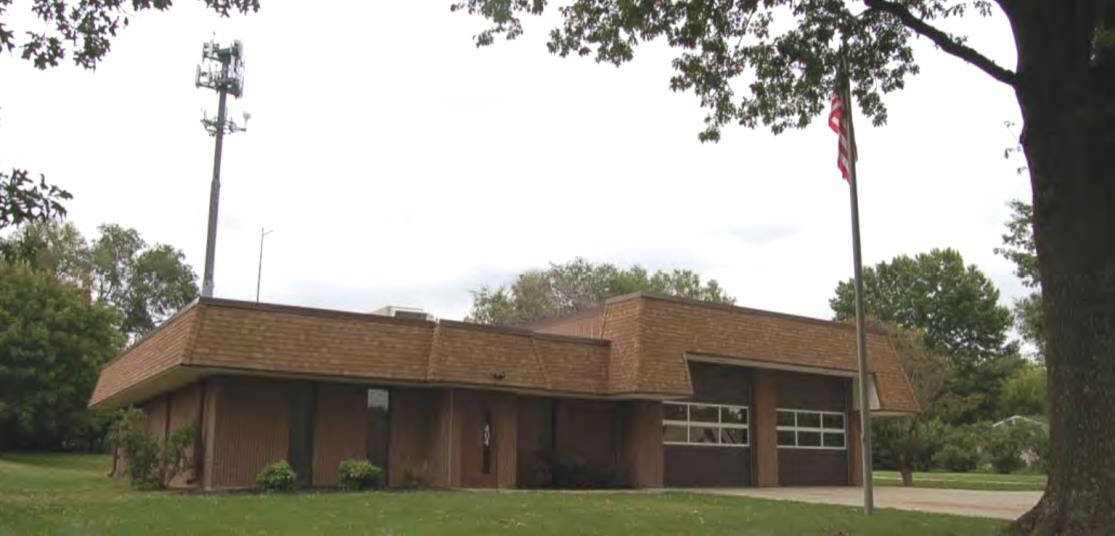
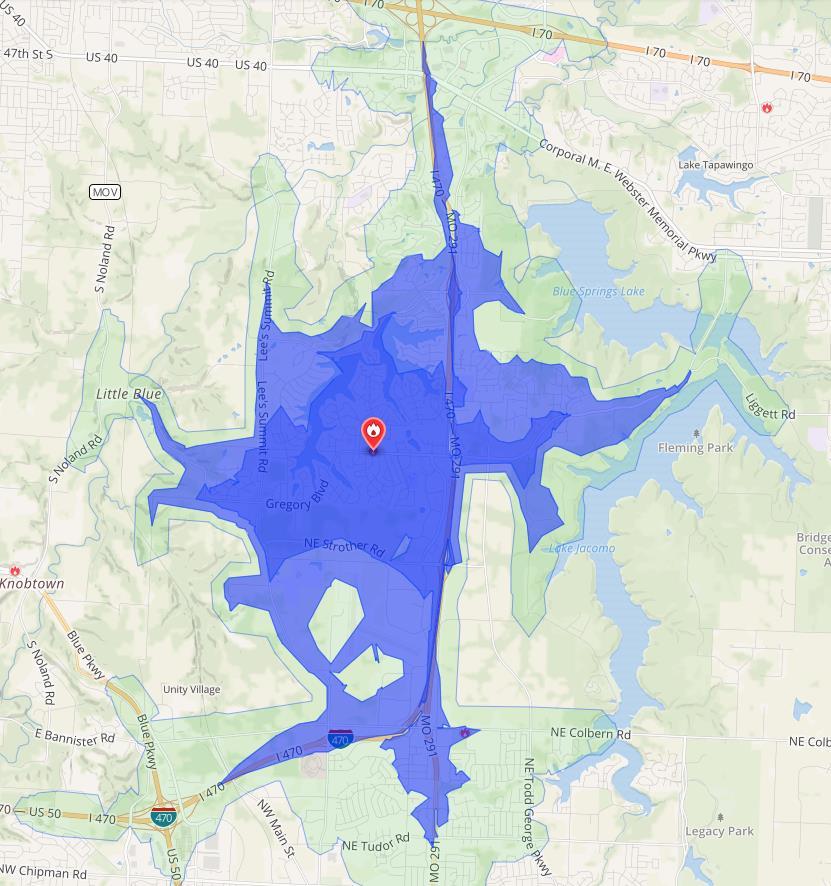 Photo 22: LSFD Station 4
Map 20: District 4 Response Times (dark blue = 0-4 minutes; light blue = 4-6 minutes; green = 6-8 minutes)


 Photo 23: LSFD Station 5
Map 21: District 5 Response Times (dark blue = 0-4 minutes; light blue = 4-6 minutes; green = 6-8 minutes)


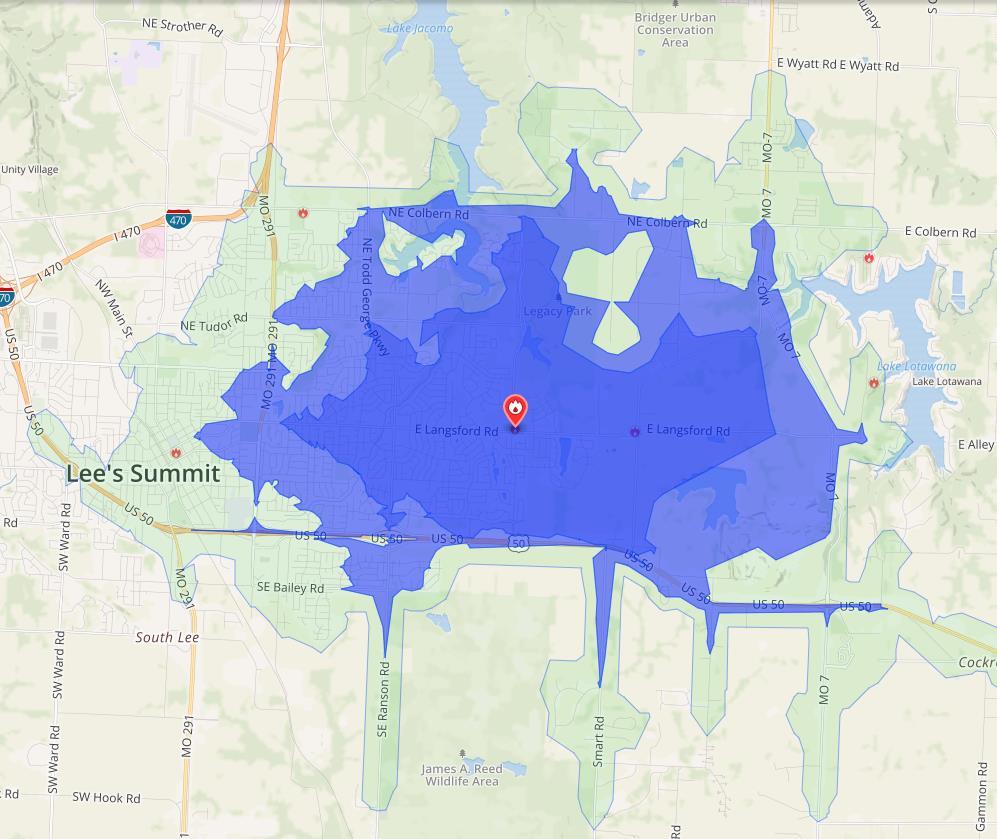 Photo 24: LSFD Station 6
Map 22: District 6 Response Times (dark blue = 0-4 minutes; light blue = 4-6 minutes; green = 6-8 minutes)


 Photo 25: LSFD Station 7
Map 23: District 7 Response Times (dark blue = 0-4 minutes; light blue = 4-6 minutes; green = 6-8 minutes)

 Table 2: Deployment Resources by Station
 Table 3: Area Protected by Fire Response District
Table 4: Road Miles Protected by Fire Response District
Table 5: Population Served by Fire Response District
Table 6: Assessed Value (2018) by Fire Response District

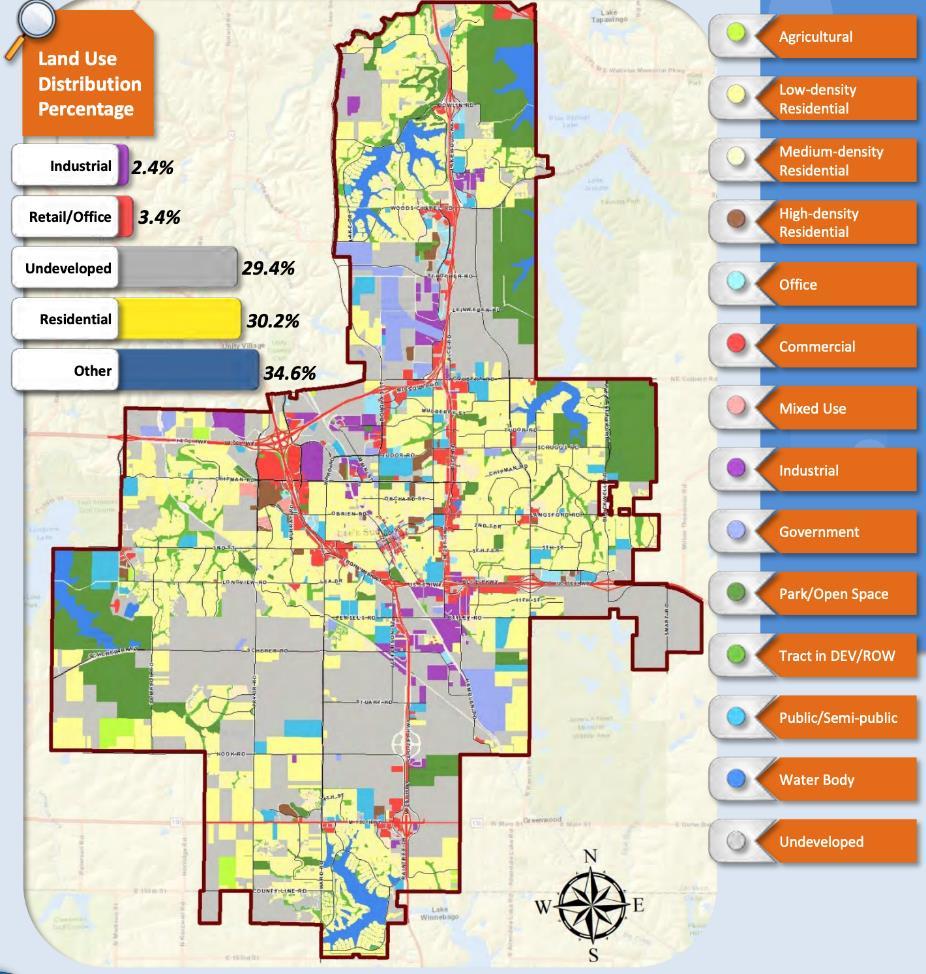 Table 7: Assessed Value (2018) by Fire Response District
Map 24: Current Land Use (2018)

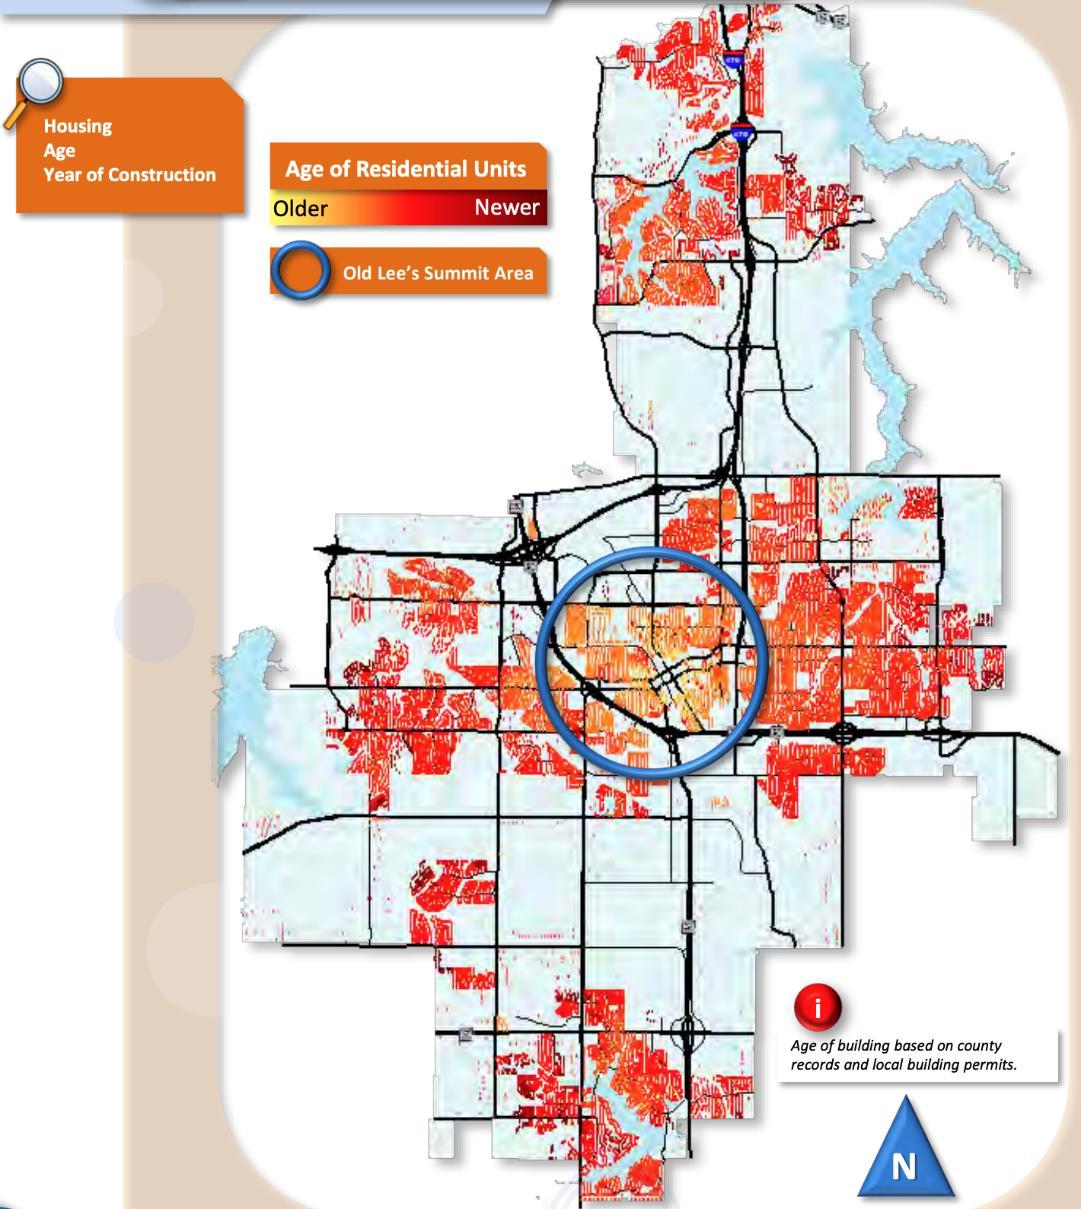 Map 25: Age of Housing in the City (2018)

 Map 26: Economic Development Corridors in Lee's Summit

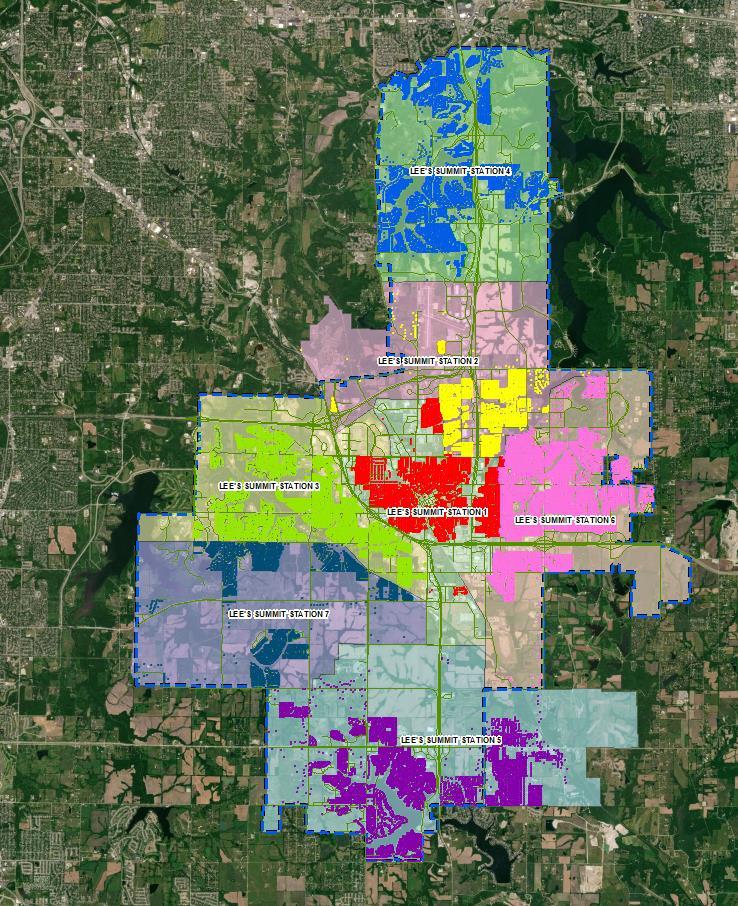 Map 27: Residential Housing Developments in each Fire District
 Table 8: Call Types by Station District (as Dispatched)
 Table 9: Community Service Priorities


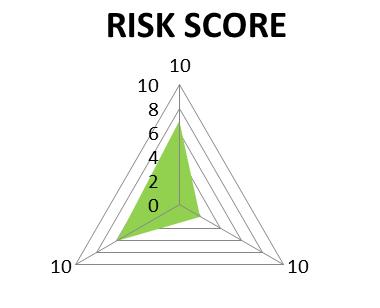

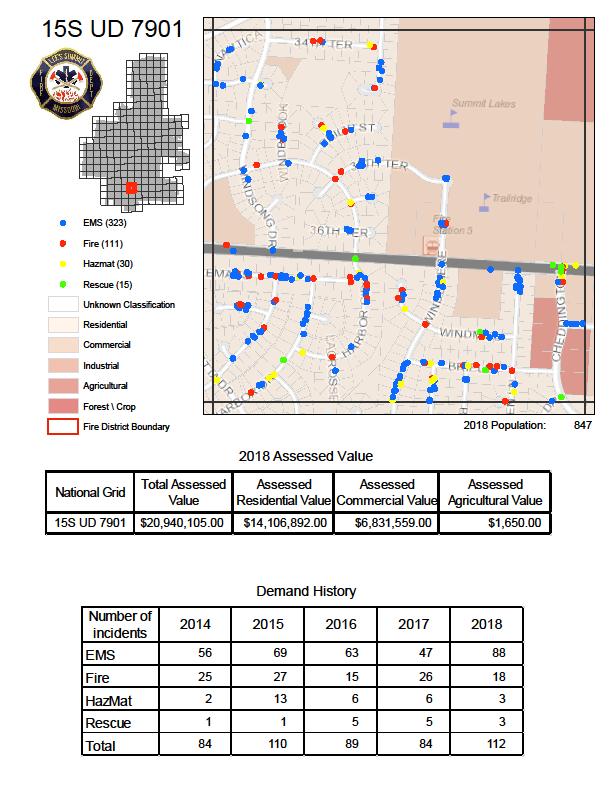

 Table 10: Call Types by Station District (as Dispatched)

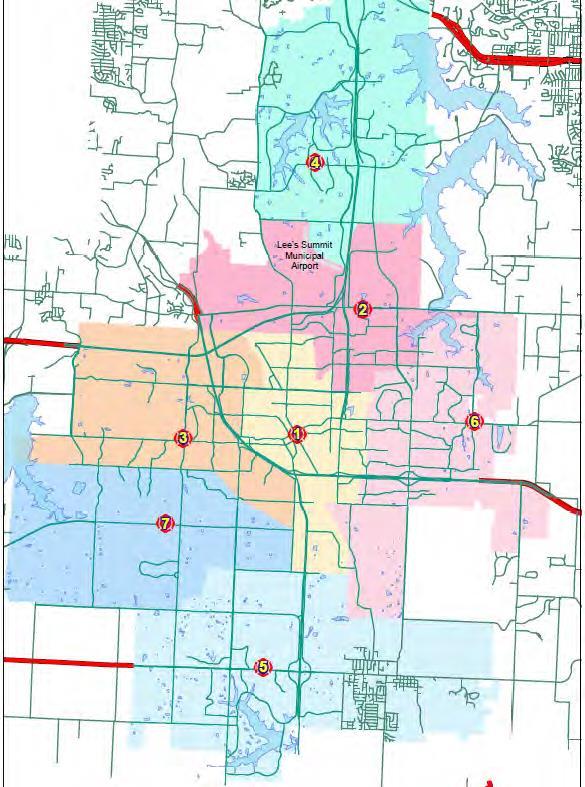 Map 28: Jurisdictional Boundaries of Lee’s Summit Fire with Station Response Districts


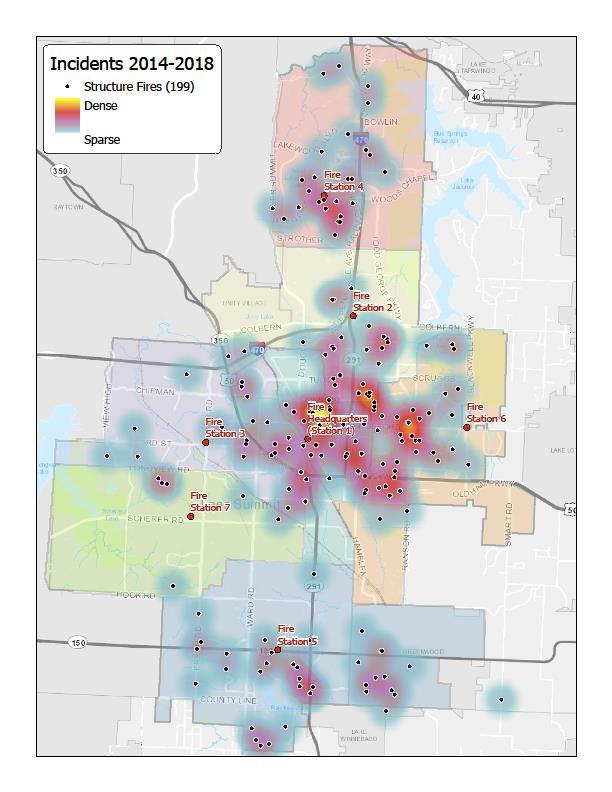

 Chart 13: Fire Death Rate per Million per Year - US Overall / Kansas / Missouri
Low Risk (Still Alarm): 1-13.0
Moderate Risk (Special Alarm): 13.1-30.0
High Risk (First Alarm): 30.1-50.0
Maximum Risk (Second Alarm): 50.1-65.00

Low Risk (Still Alarm-single unit): 1-19.0
Low Risk (Still Alarm): 19.1-22.0
Moderate Risk (Special Alarm): 22.1-35.0
High Risk (First Alarm): 35.1-50.0
Maximum Risk (Second Alarm): 50.1-70.00


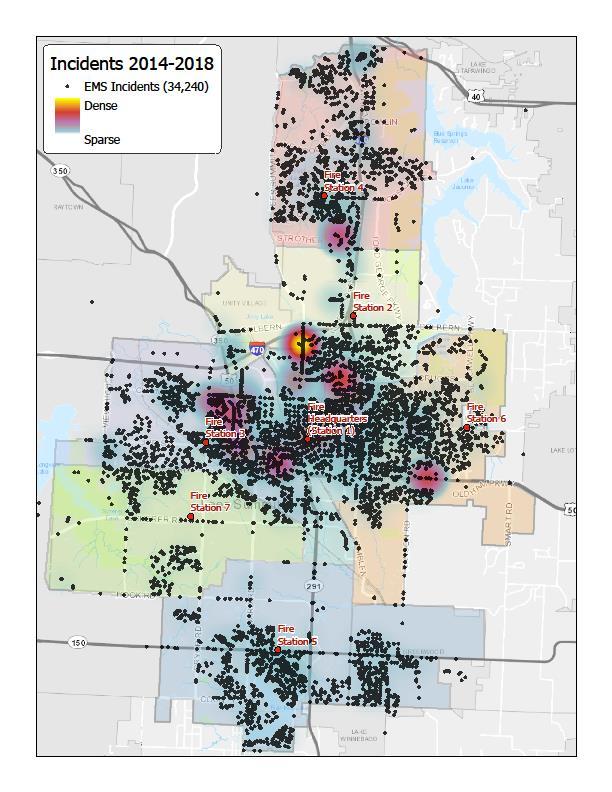
Low Risk (Still Alarm): 1-19.0
Moderate Risk (Special Alarm): 19.1-35.0
High Risk (First Alarm): 35.1-50.0
Maximum Risk (Second Alarm): 50.1-75.00


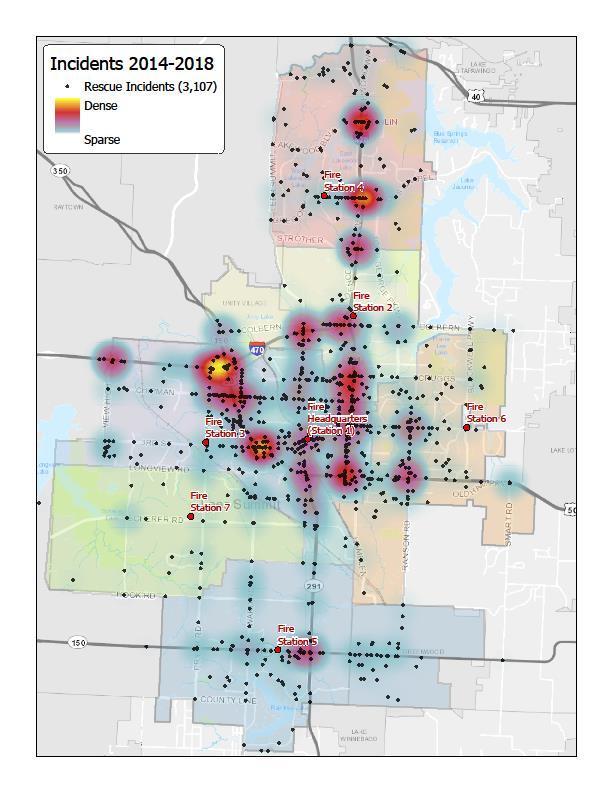
Low Risk (Still Alarm): 1-16.5
Moderate Risk (Special Alarm): 16.6-27.0
High Risk (First Alarm): 27.1-40.0
Maximum Risk (Second Alarm): 40.1-75.00


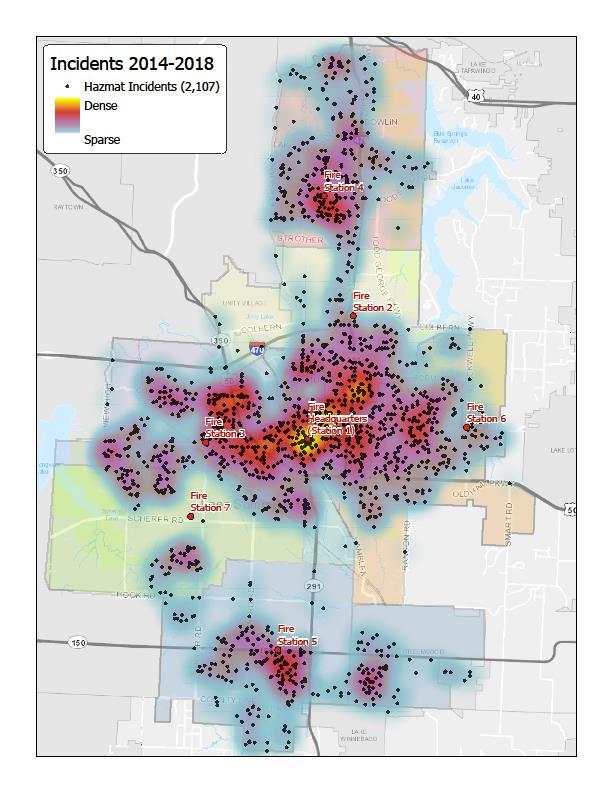
 Table 11: Critical Tasks - Fire Risk - Low
Table 12: Critical Tasks - Fire Risk - Moderate
 Table 13: Critical Tasks - Fire Risk - High
Table 14: Critical Tasks - Fire Risk - Maximum
 Table 15: Critical Tasks - EMS Risk - Low
Table 16: Critical Tasks - EMS Risk - Moderate
 Table 17: Critical Tasks - EMS Risk - High
Table 18: Critical Tasks - EMS Risk - Maximum
 Table 19: Critical Tasks - Rescue Risk - Low
Table 20: Critical Tasks - Rescue Risk - Moderate
Table 21: Critical Tasks - Rescue Risk - High
 Table 22: Critical Tasks - Rescue Risk - Maximum Tier I (MVC)
Table 23: Critical Tasks - Rescue Risk - Maximum Tier II (Disaster)
Table 24: Critical Tasks - HazMat Risk - Low
 Table 25: Critical Tasks - HazMat Risk - Moderate
Table 26: Critical Tasks - HazMat Risk - High
Table 27: Critical Tasks - HazMat Risk - Maximum

Table 29: Risk Scoring – Fire Suppression

Low Risk (Still Alarm-single unit): 1-19.0
Low Risk (Still Alarm): 19.1-22.0
Moderate Risk (Special Alarm): 22.1-35.0
High Risk (First Alarm): 35.1-50.0
Maximum Risk (Second Alarm): 50.1-70.00


Table 33: Risk Scoring - Rescue

Risk (Still Alarm): 1-16.5

Risk (Special Alarm): 16.6-27.0
Risk (First Alarm): 27.1-40.0
Risk (Second
40.1-75.00


 Table 36: Area Protected by Fire Response District
Table 37: Road Miles Protected by Fire Response District

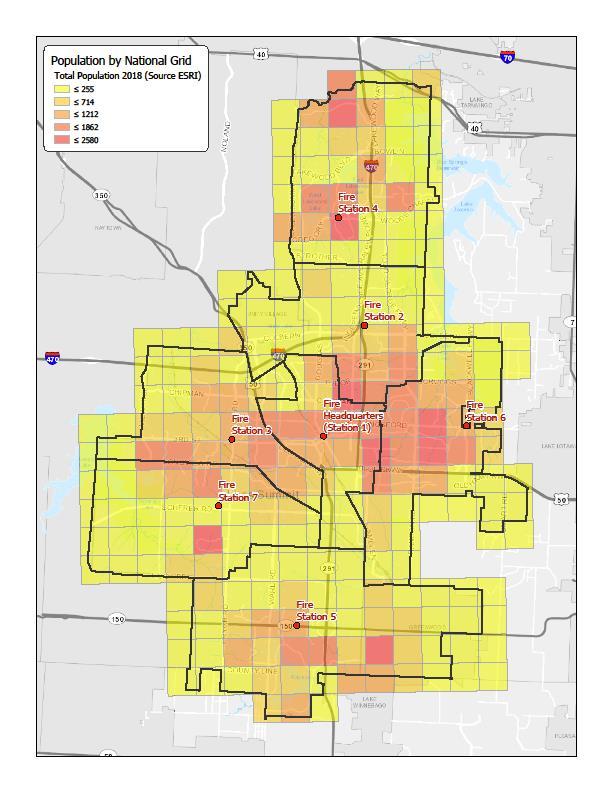
 Table 38: Population Served by Fire Response District
Table 39: Assessed Value – Total and Residential (2018) by Fire Response District
Table 40: Assessed Value – Commercial and Agricultural (2018) by Fire Response District

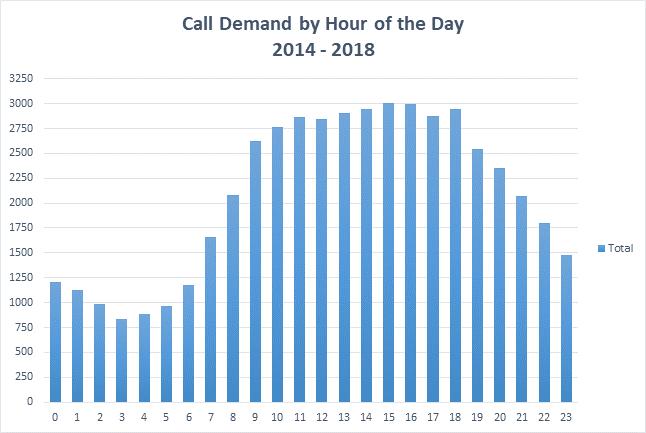
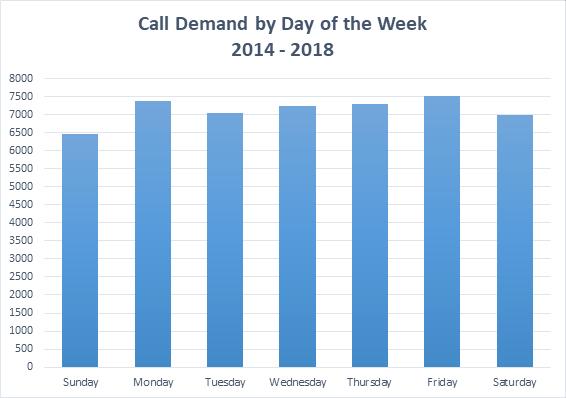 Chart 14: Call Demand by Hour of the Day (2014-2018)
Chart 15: Call Demand by Day of the Week (2014-2018)
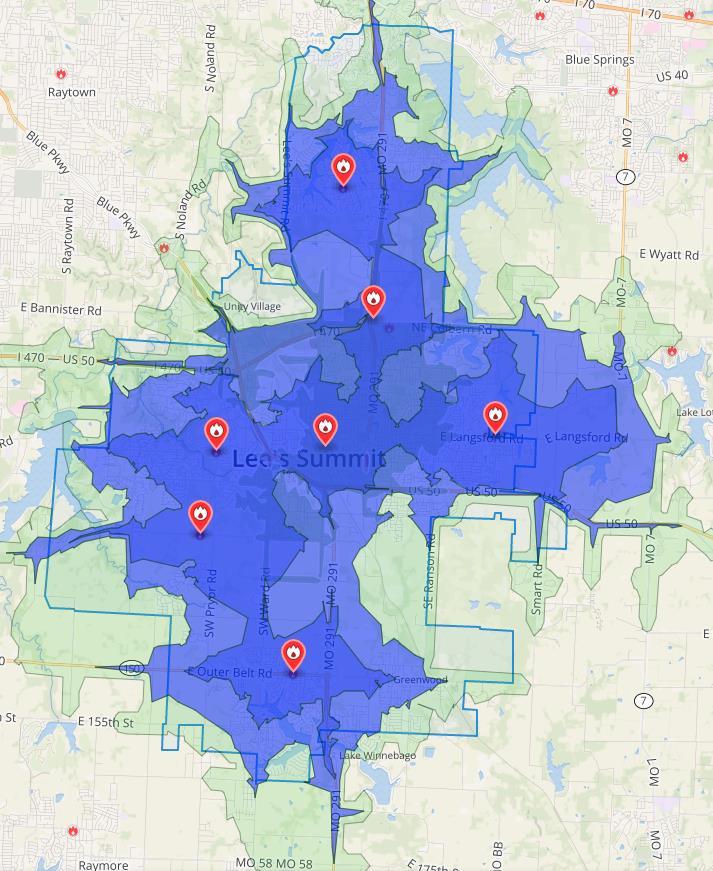
Travel time from stations at 4 minutes for the first arriving unit and 8 minutes for effective response force (CFAI urban density standard)

Map 35: Response within City Boundaries and Contract Cities (dark blue = 0-4 minutes; light blue = 4-6 minutes; green = 6-8 minutes)

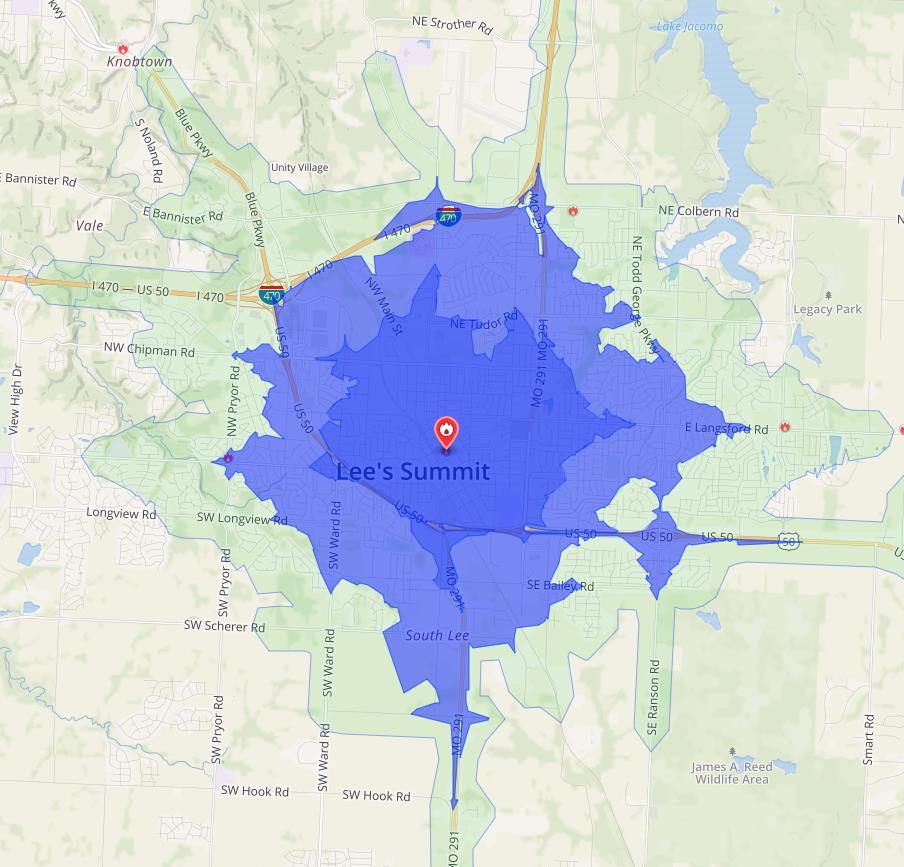
Map 36: District 1 Response Times (dark blue = 0-4 minutes; light blue = 4-6 minutes; green = 6-8 minutes)

Map
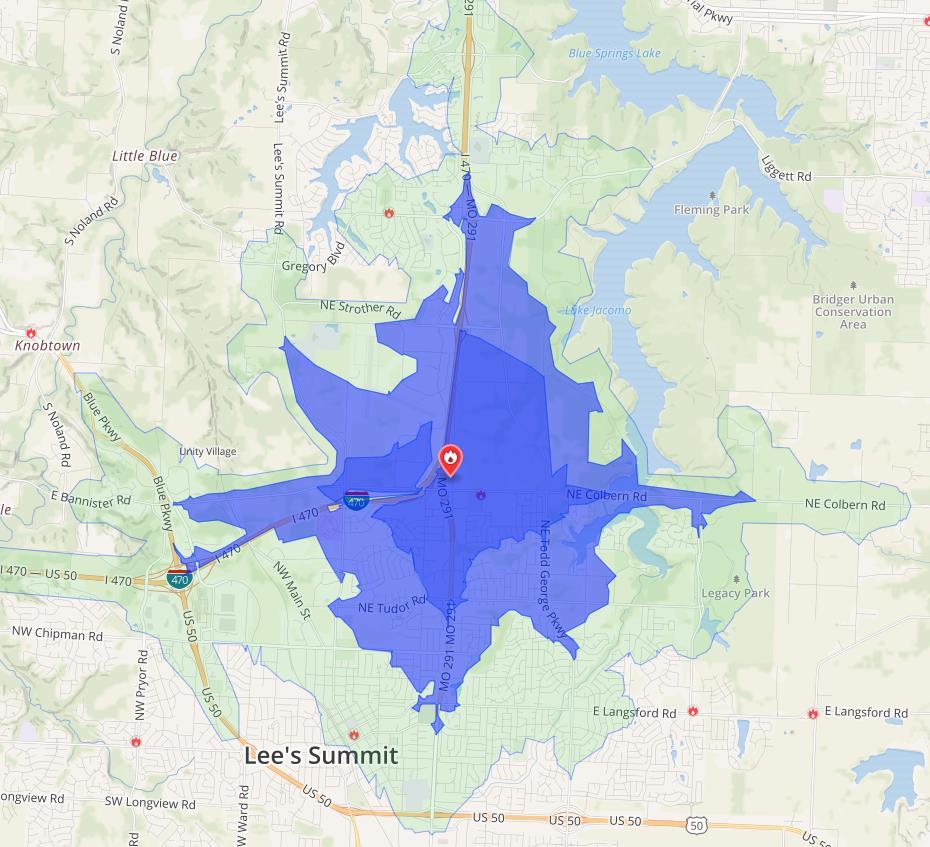
 37: District 2 Response Times (dark blue = 0-4 minutes; light blue = 4-6 minutes; green = 6-8 minutes)
Map 38: District 3 Response Times (dark blue = 0-4 minutes; light blue = 4-6 minutes; green = 6-8 minutes)
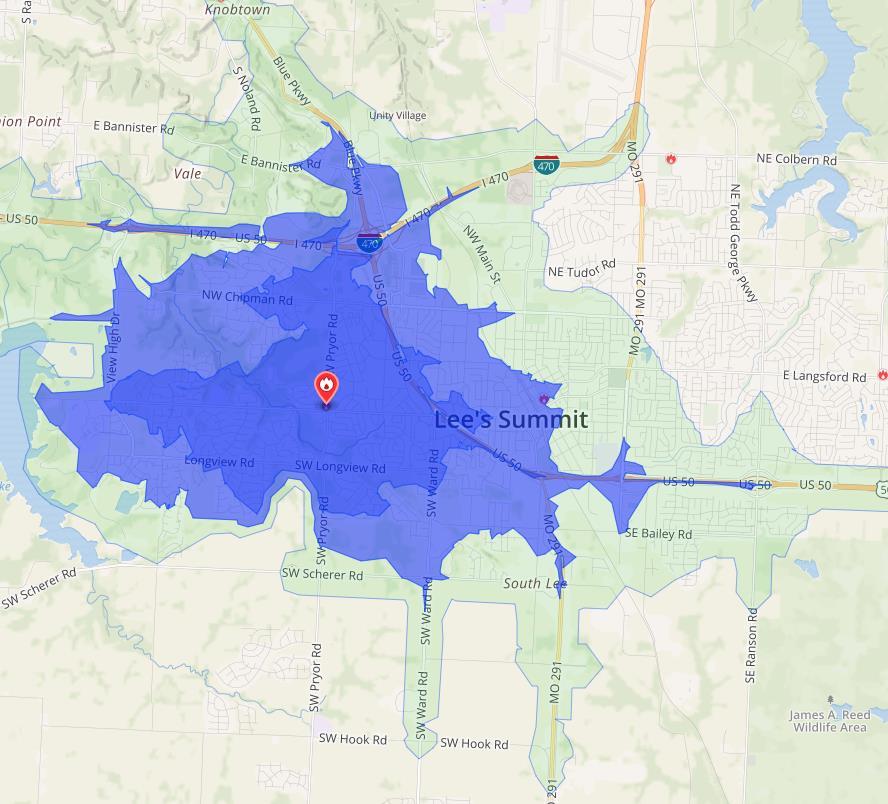

Map 39: District 4 Response Times (dark blue = 0-4 minutes; light blue = 4-6 minutes; green = 6-8 minutes)
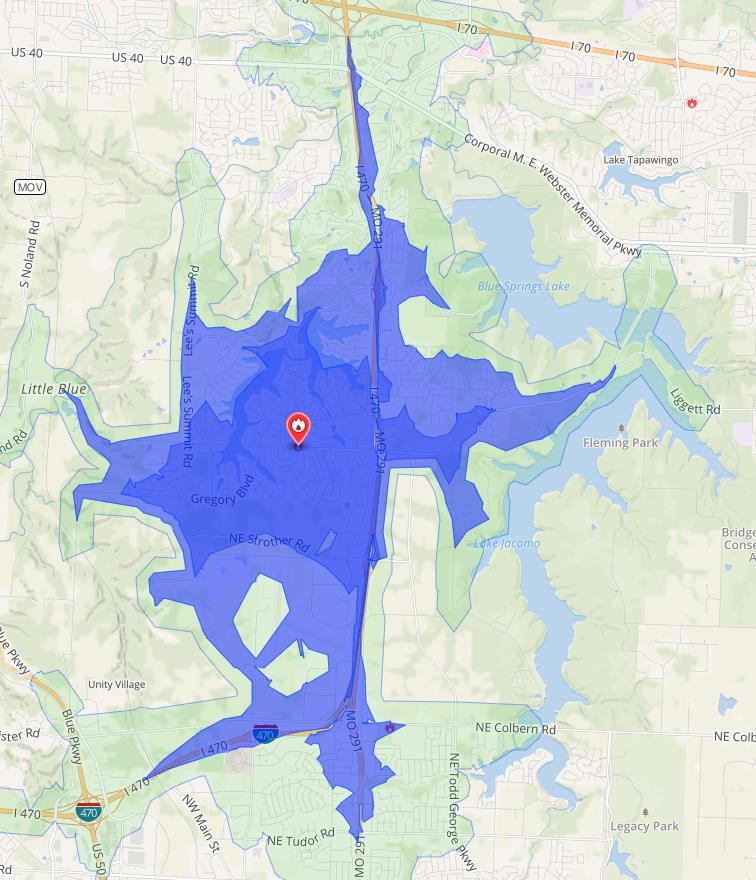

Map 40: District 5 Response Times (dark blue = 0-4 minutes; light blue = 4-6 minutes; green = 6-8 minutes)


 Map 41: District 6 Response Times (dark blue = 0-4 minutes; light blue = 4-6 minutes; green = 6-8 minutes)
Map 42: District 7 Response Times (dark blue = 0-4 minutes; light blue = 4-6 minutes; green = 6-8 minutes)
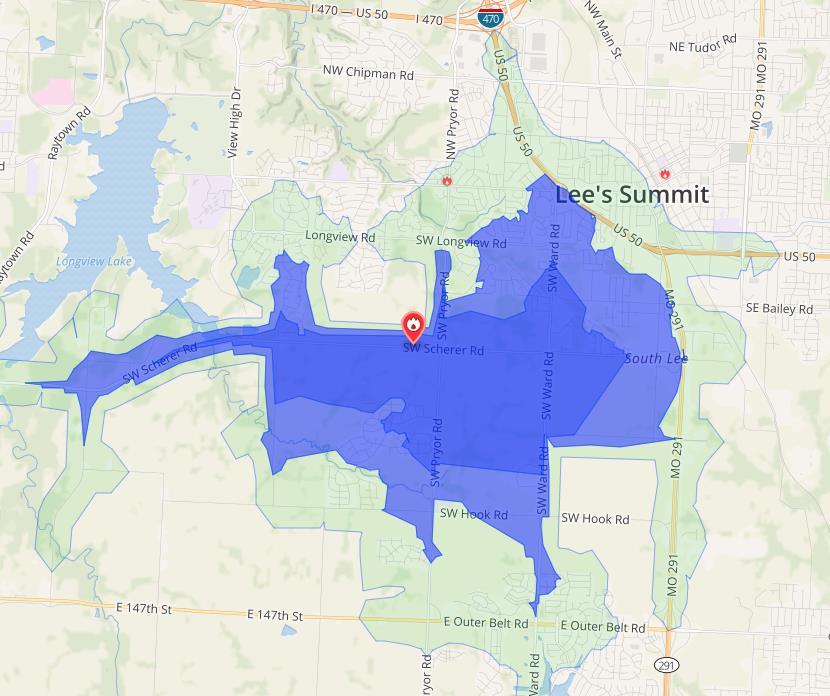
Travel time from stations at 8 minutes (NFPA 1710 effective response force standard)


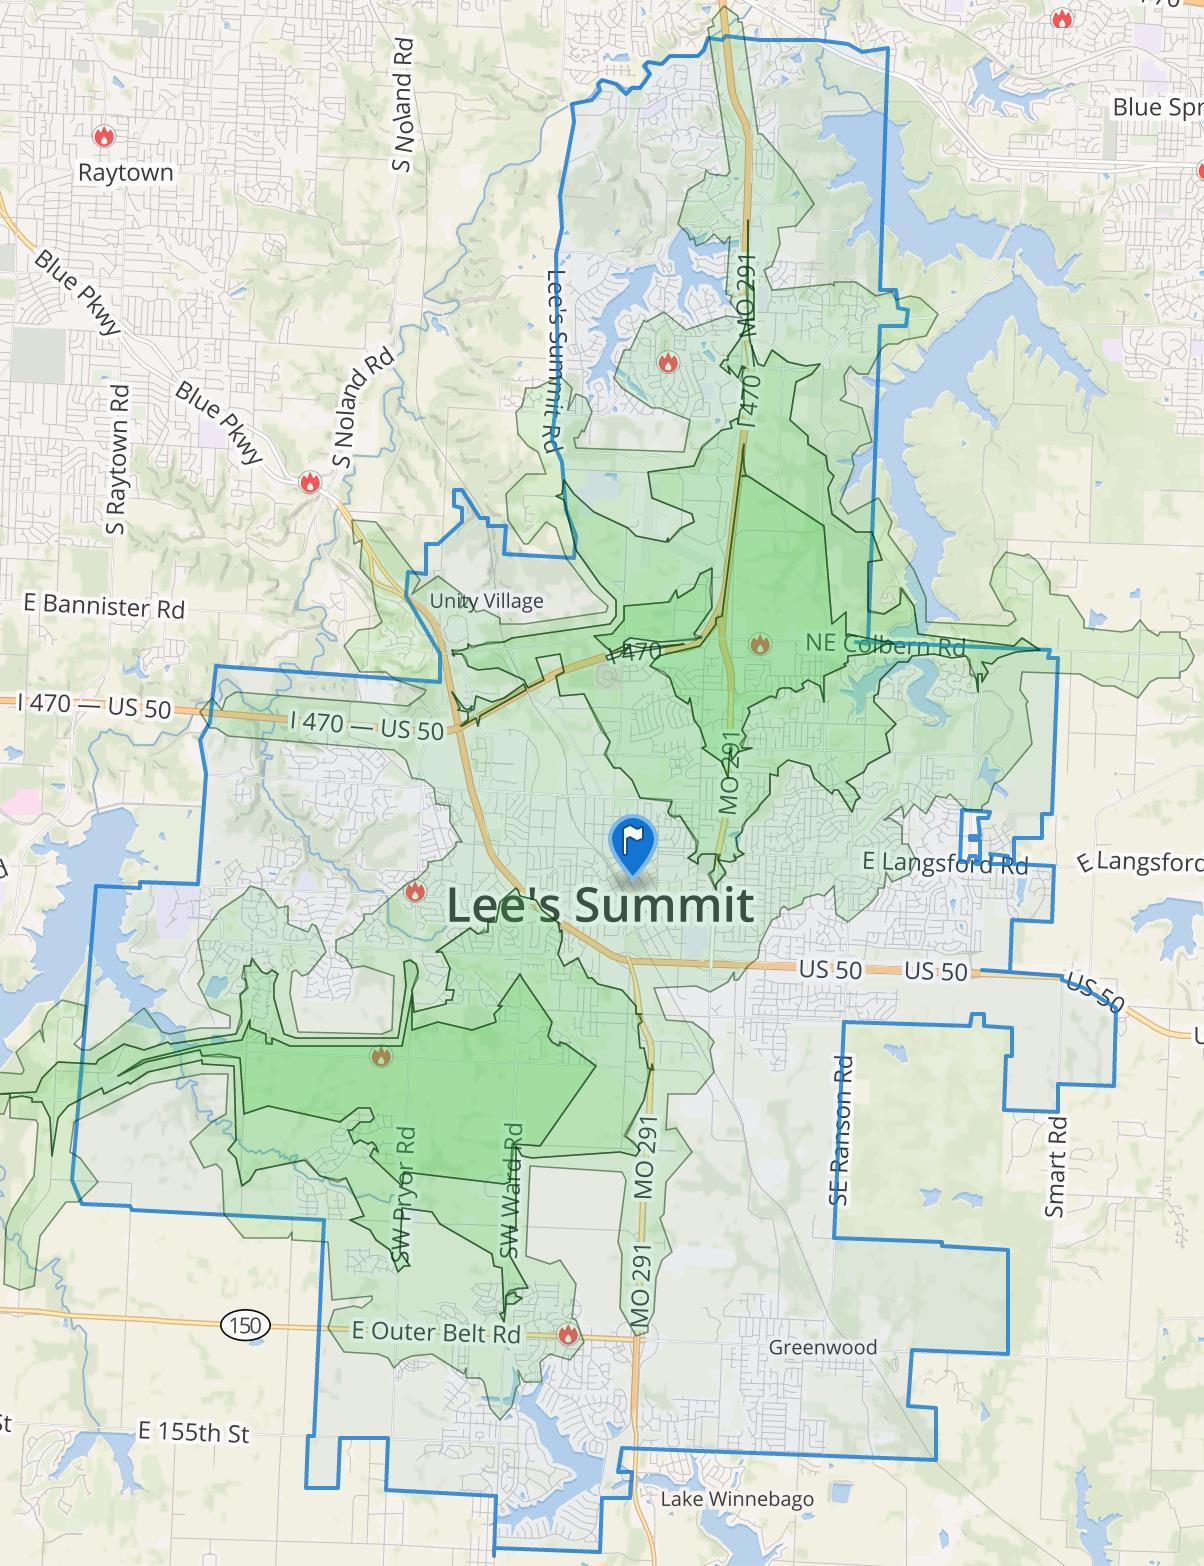 Map 43: Response Times for Ladder Trucks from Station 2 and Station 7 (dark green = 0-4 minutes; green = 4-6 minutes; light green = 6-8 minutes)


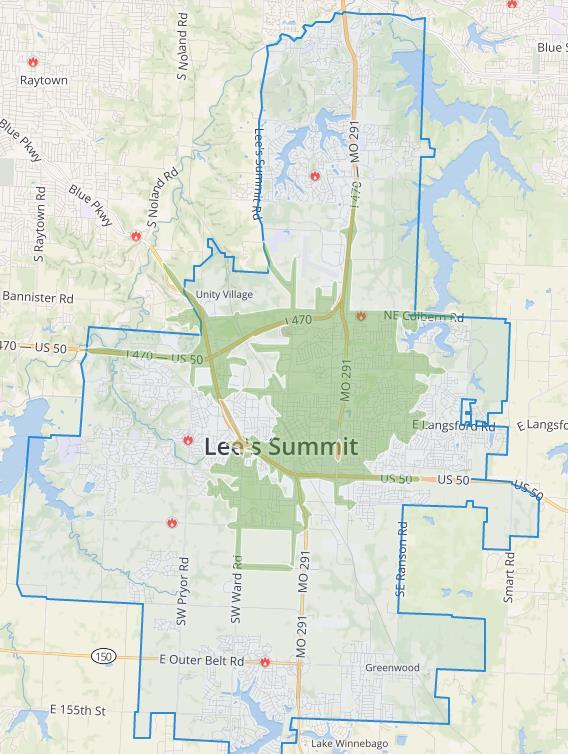 Map 44: Response Time - ERF of 16 Personnel within 8 Minutes (in green)


 Chart 16: Operational Demand - Pumper 1 and Rescue 1 (2014-2018)

 Chart 20: Operational Demand - Pumper 5 and Rescue 5 (2014-2018)

 Chart 24: Rescues Assigned to Calls in District 3 (2014-2018)

Map 49: District 1 Response Times (dark blue = 0-4 minutes; light blue = 4-6 minutes; green = 6-8 minutes)
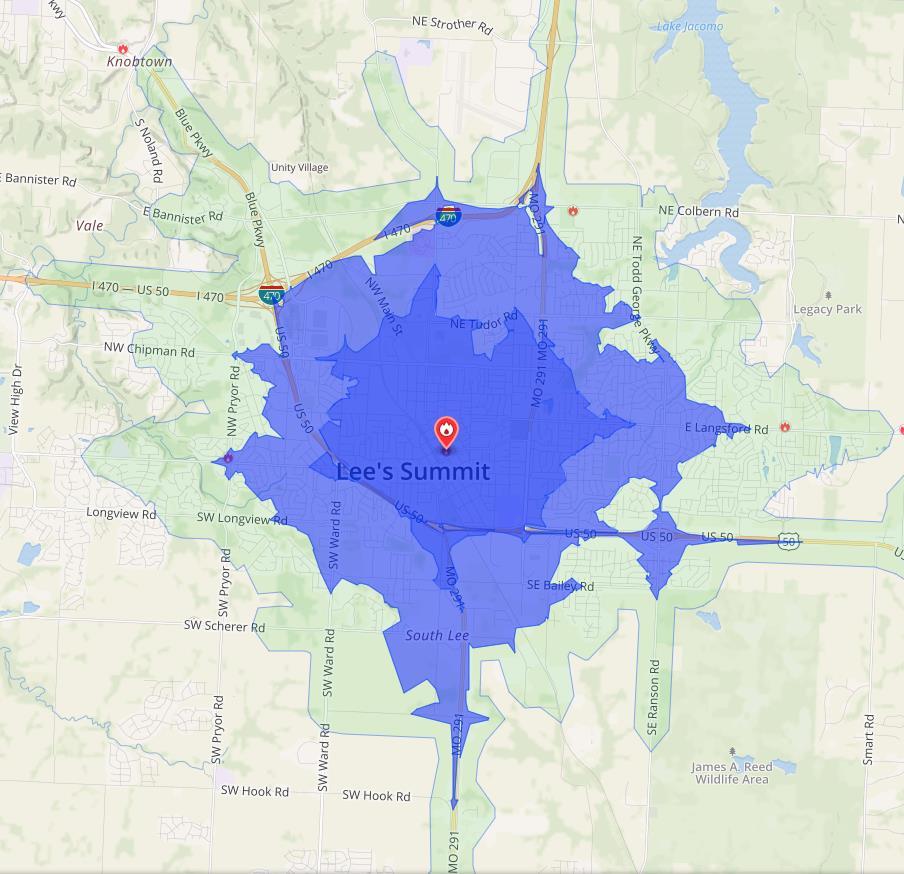

Map 50: District 2 Response Times (dark blue = 0-4 minutes; light blue = 4-6 minutes; green = 6-8 minutes)


Chart 26: Rescues Assigned to Calls in District 3 (2014-2018)
Rescues Assigned to Calls in District 3
2014 -2018


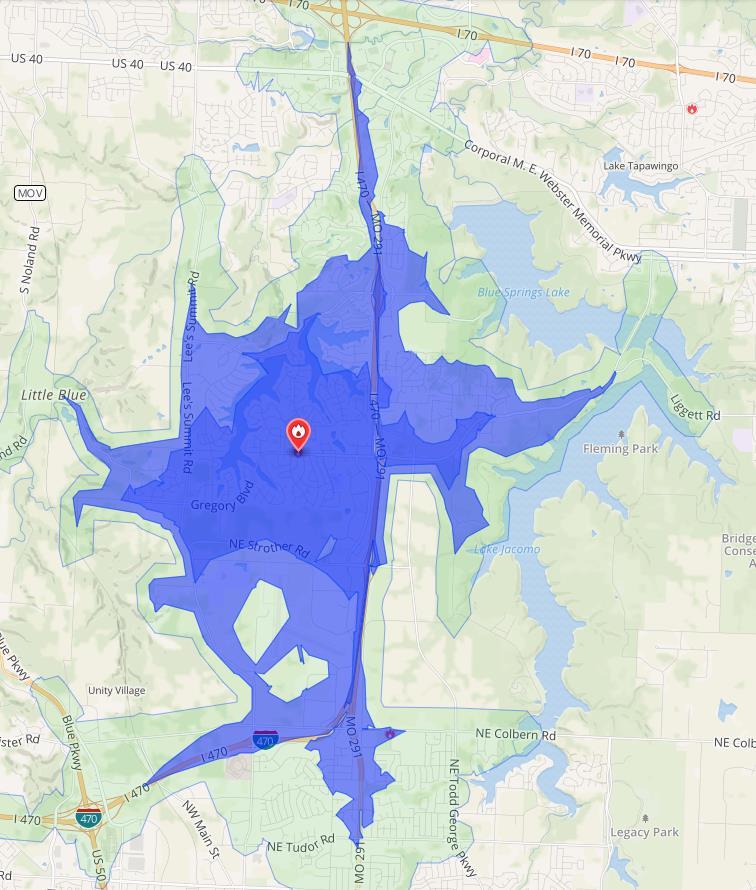

Map 53: District 5 Response Times (dark blue = 0-4 minutes; light blue = 4-6 minutes; green = 6-8 minutes)
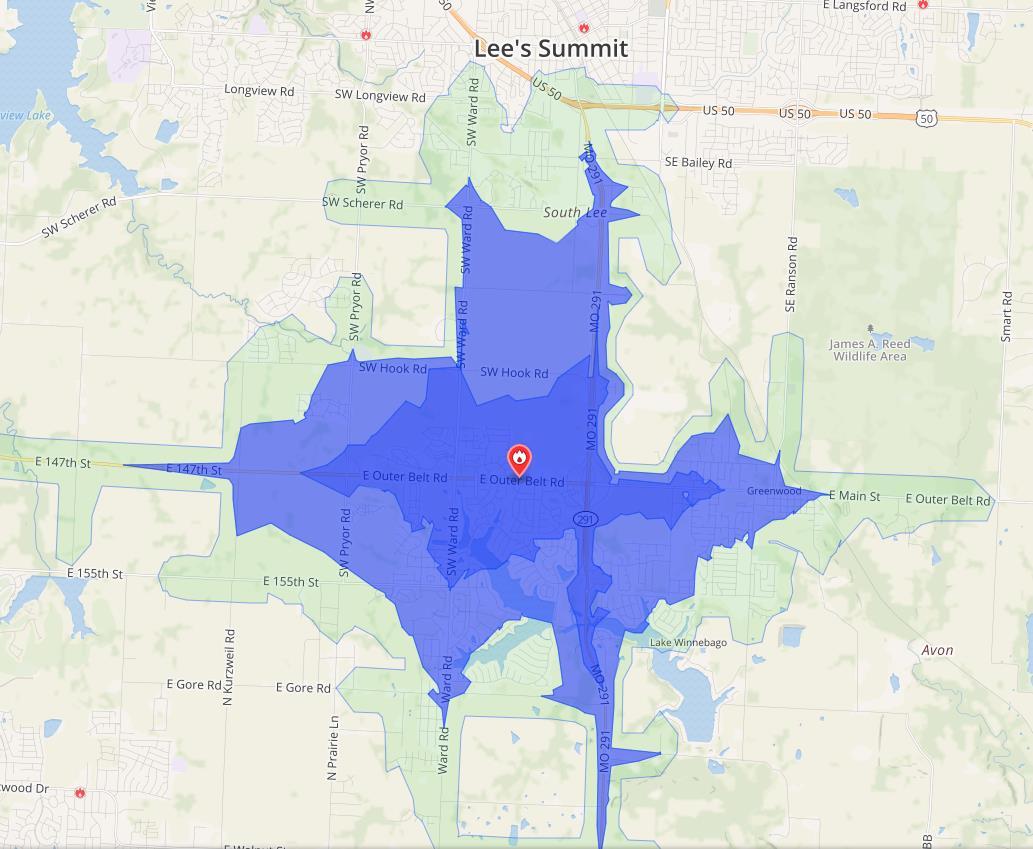

Map 54: District 6 Response Times (dark blue = 0-4 minutes; light blue = 4-6 minutes; green = 6-8 minutes)
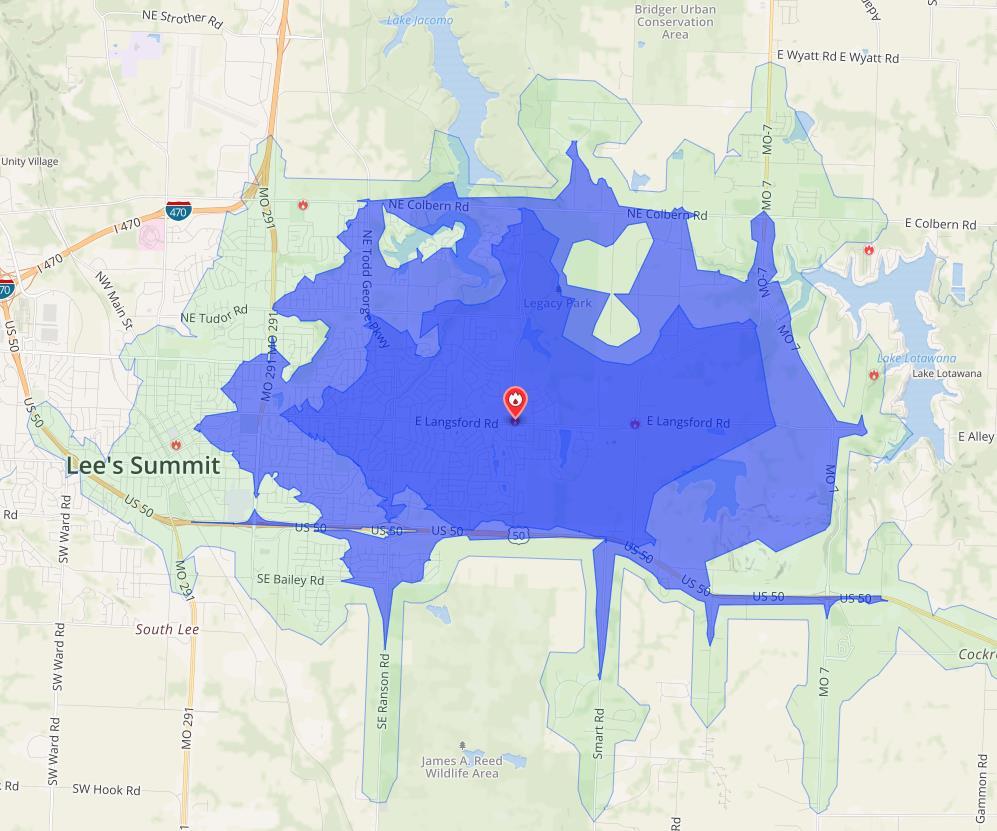

Map 55: District 7 Response Times (dark blue = 0-4 minutes; light blue = 4-6 minutes; green = 6-8 minutes)


Baseline Performance Tables – qualified data (August 3, 2015-2018)


 Table 41: Square Miles Protected, by District
Table 42: Road Miles Protected, by District

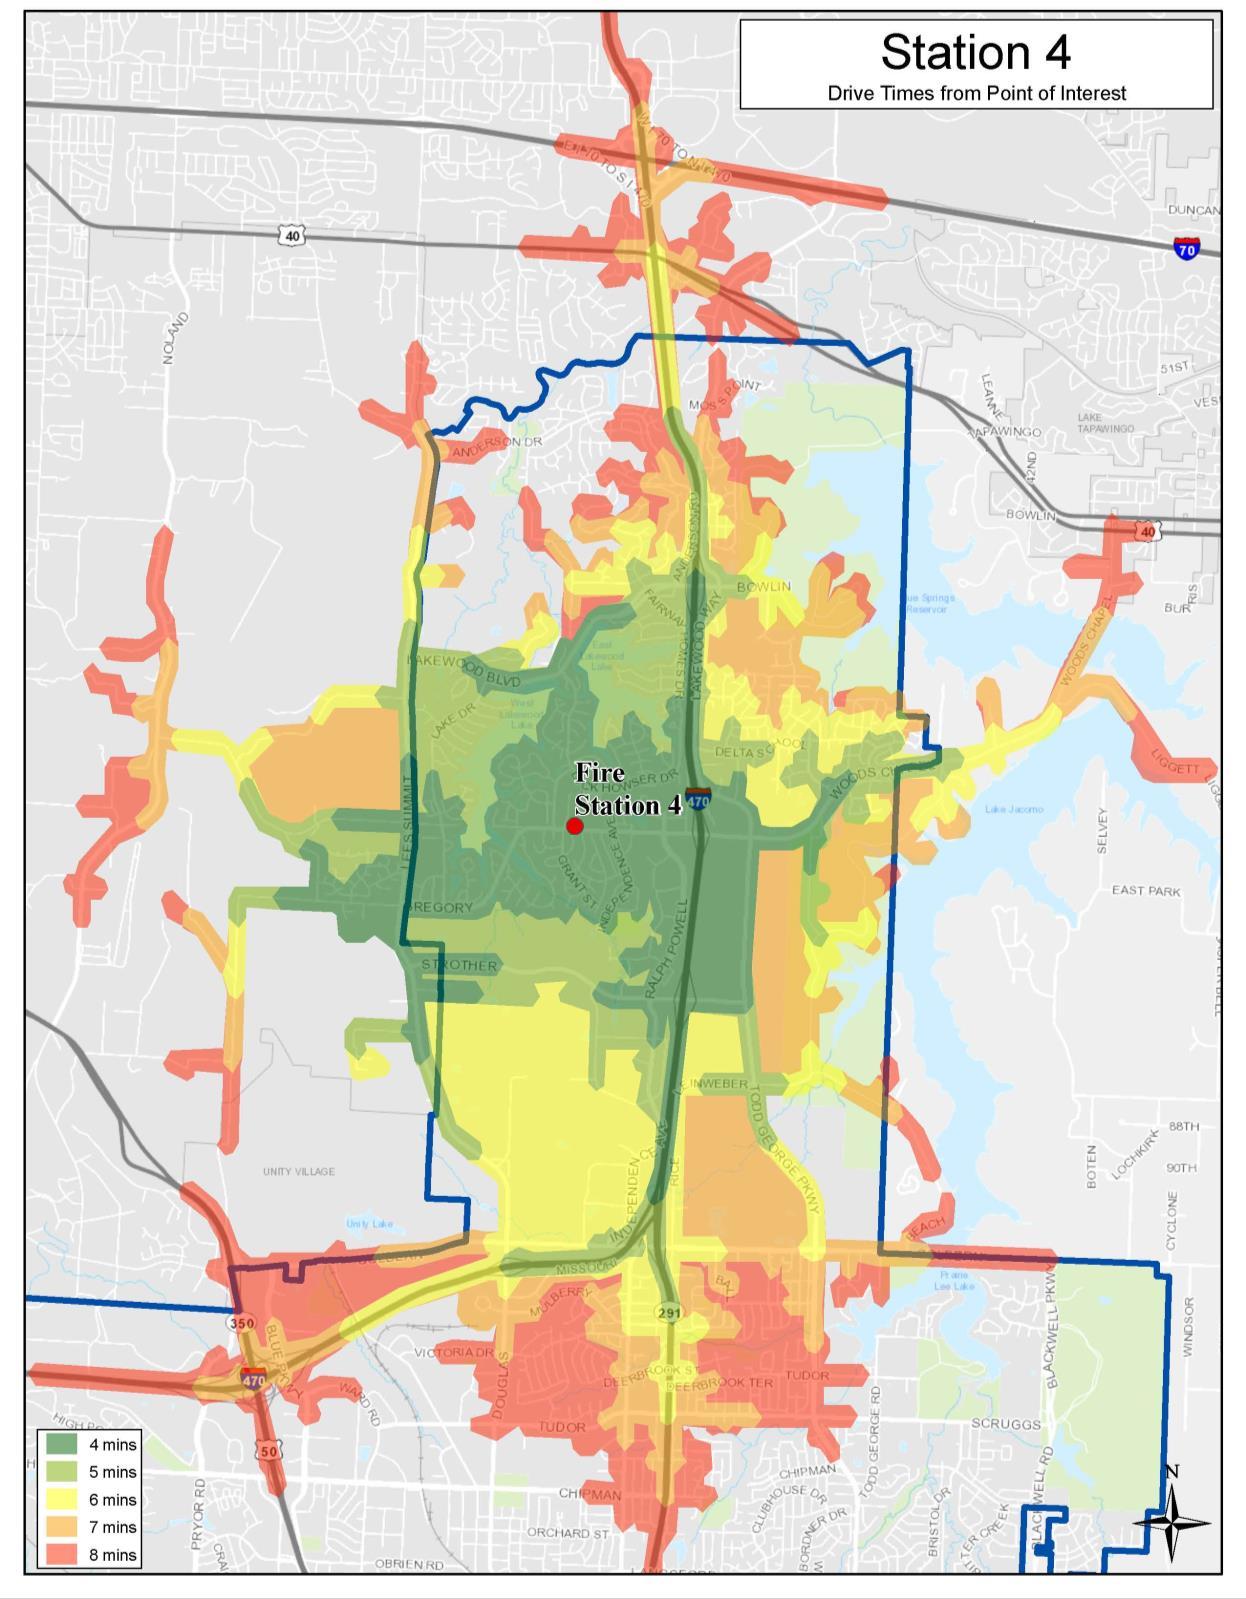 Map 56: Travel Time for Units Deploying from Station 4

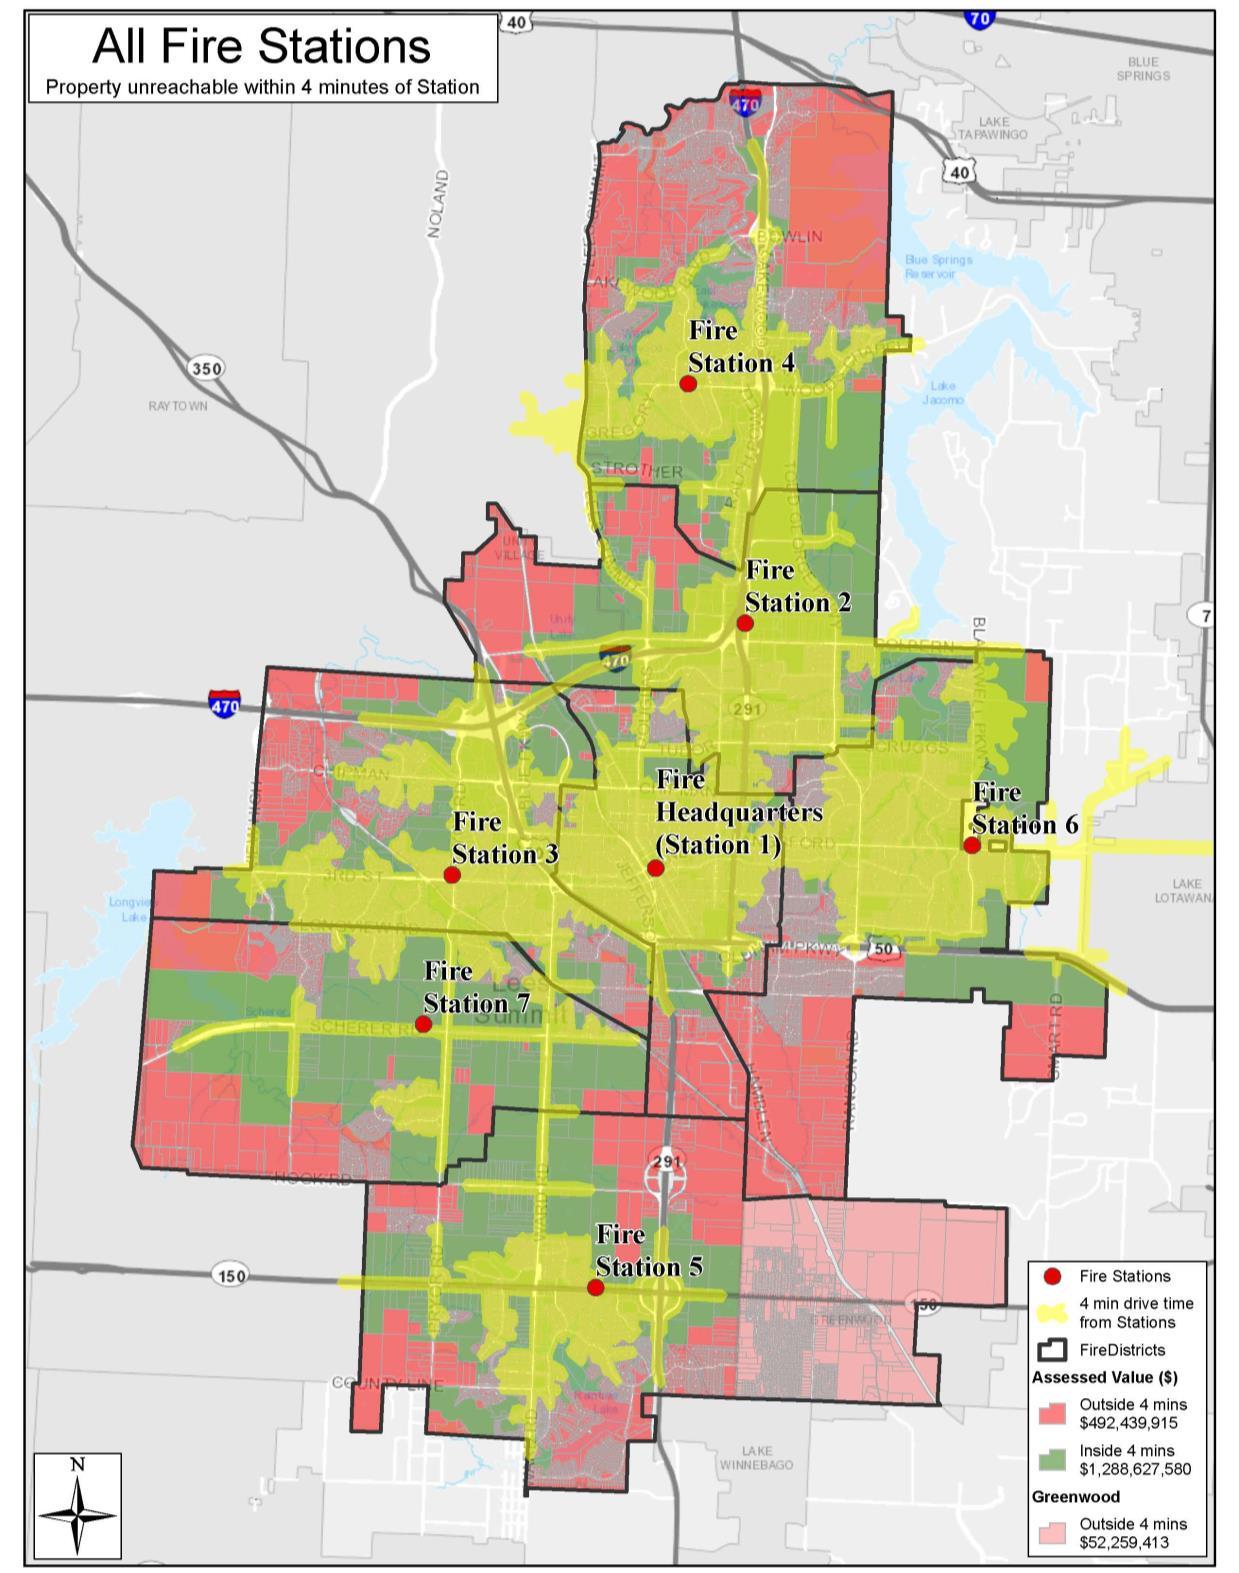 Map 57: Assessed Property Values Unreachable Within 4 Minutes of a Fire Station

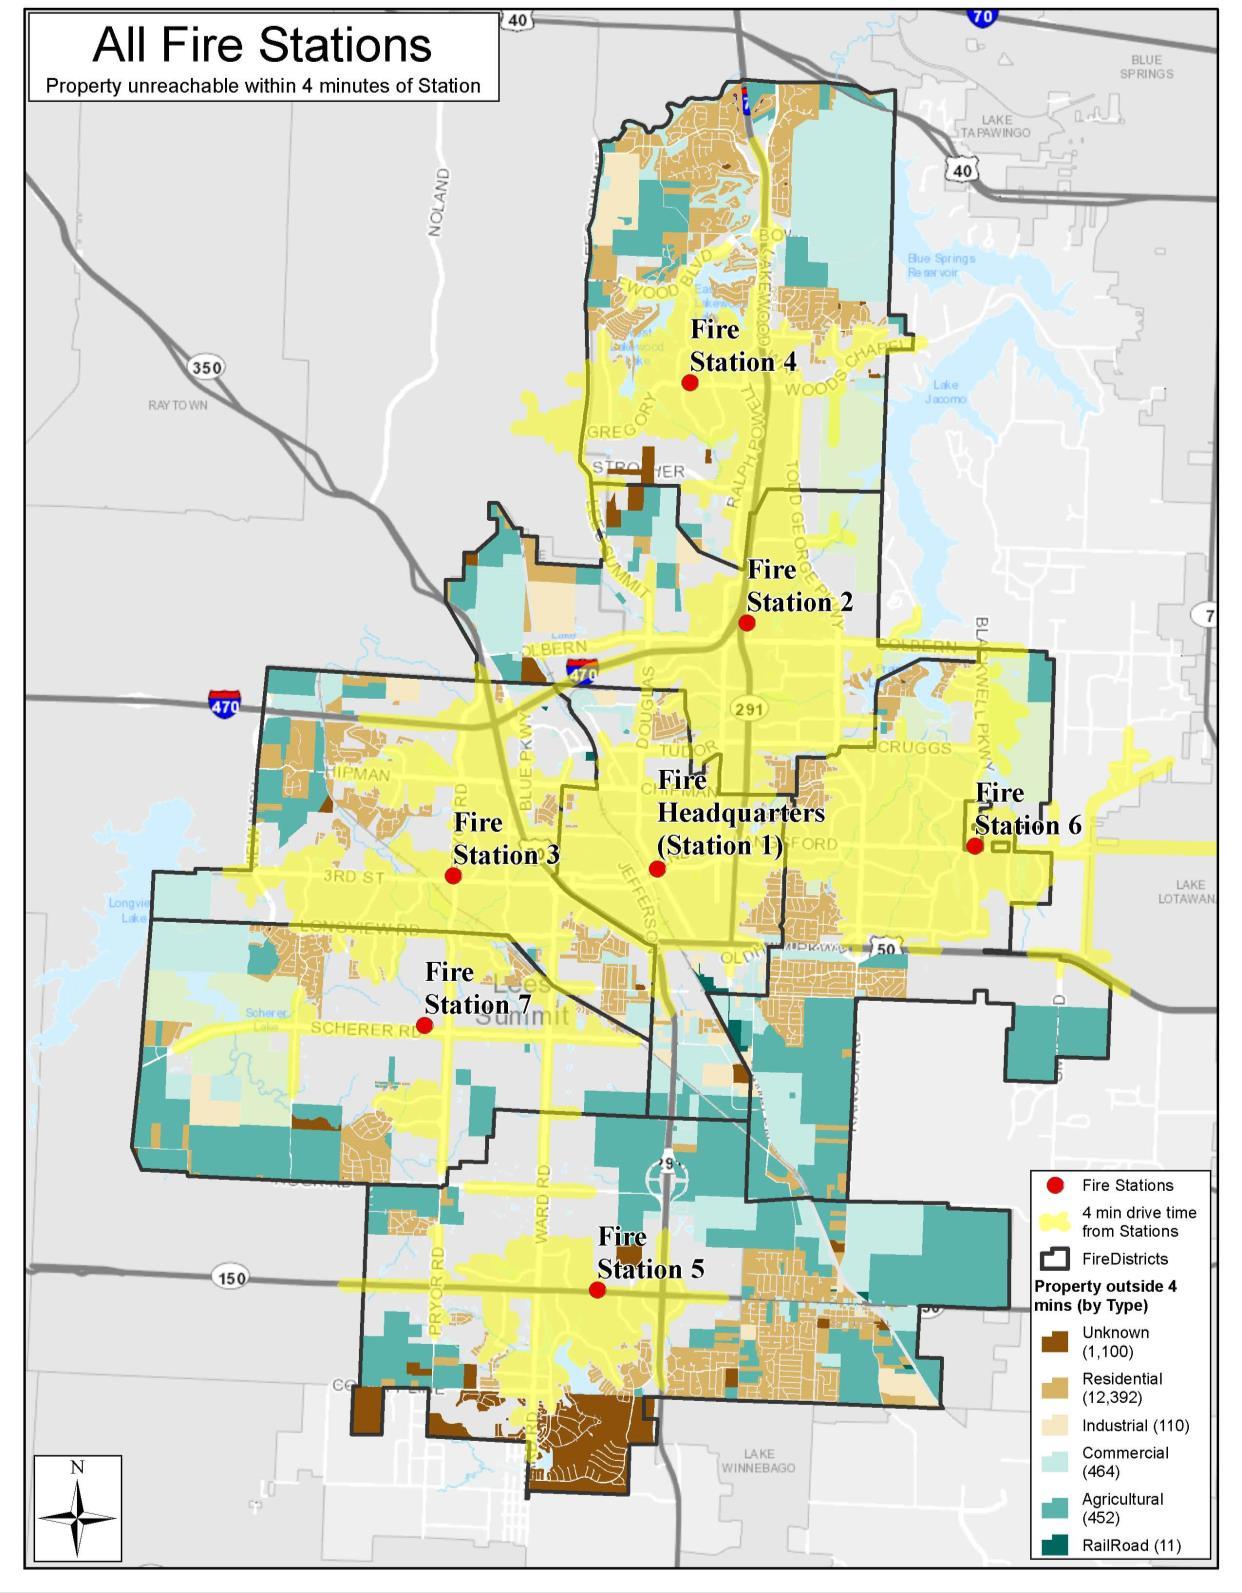 Map 58: Property Types Unreachable Within 4 Minutes of a Fire Station
Map 59: Response Times within City Boundaries and Contract Cities (dark blue = 0-4 minutes; light blue = 4-6 minutes; green = 6-8 minutes)


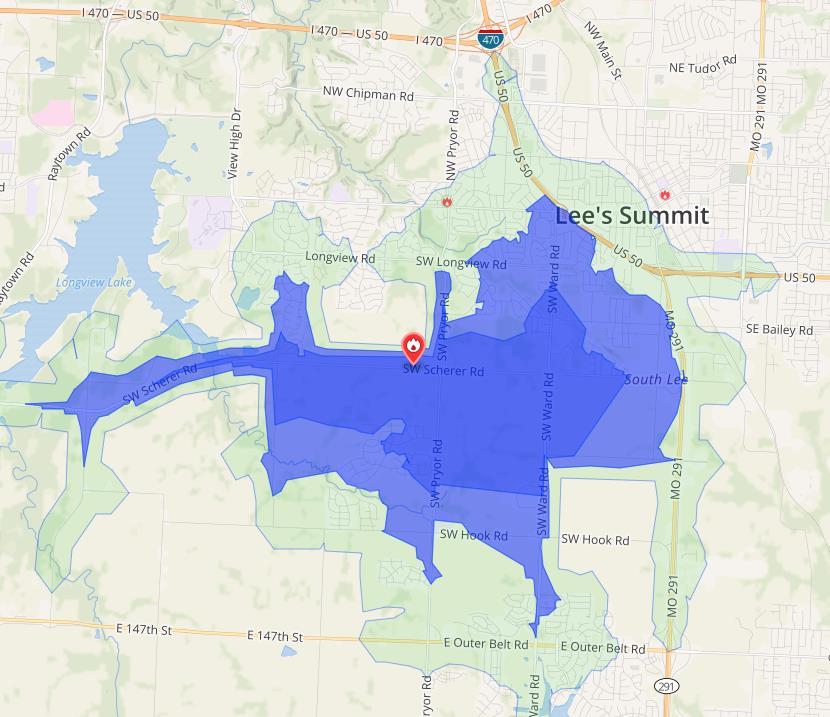
Map 60: District 4 Response Times (dark blue = 0-4 minutes; light blue = 4-6 minutes; green = 6-8 minutes)
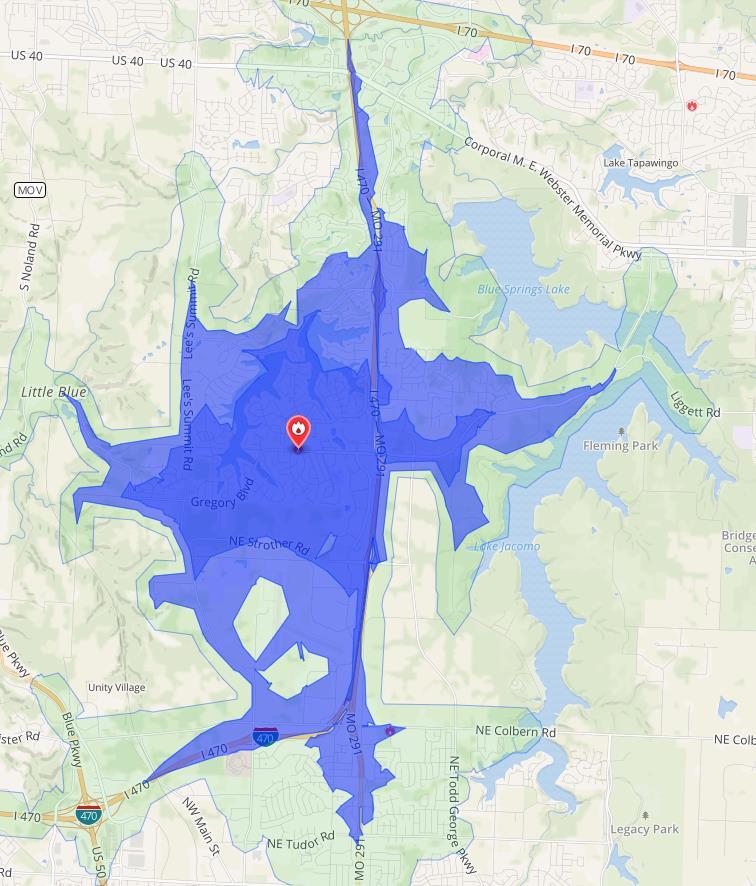


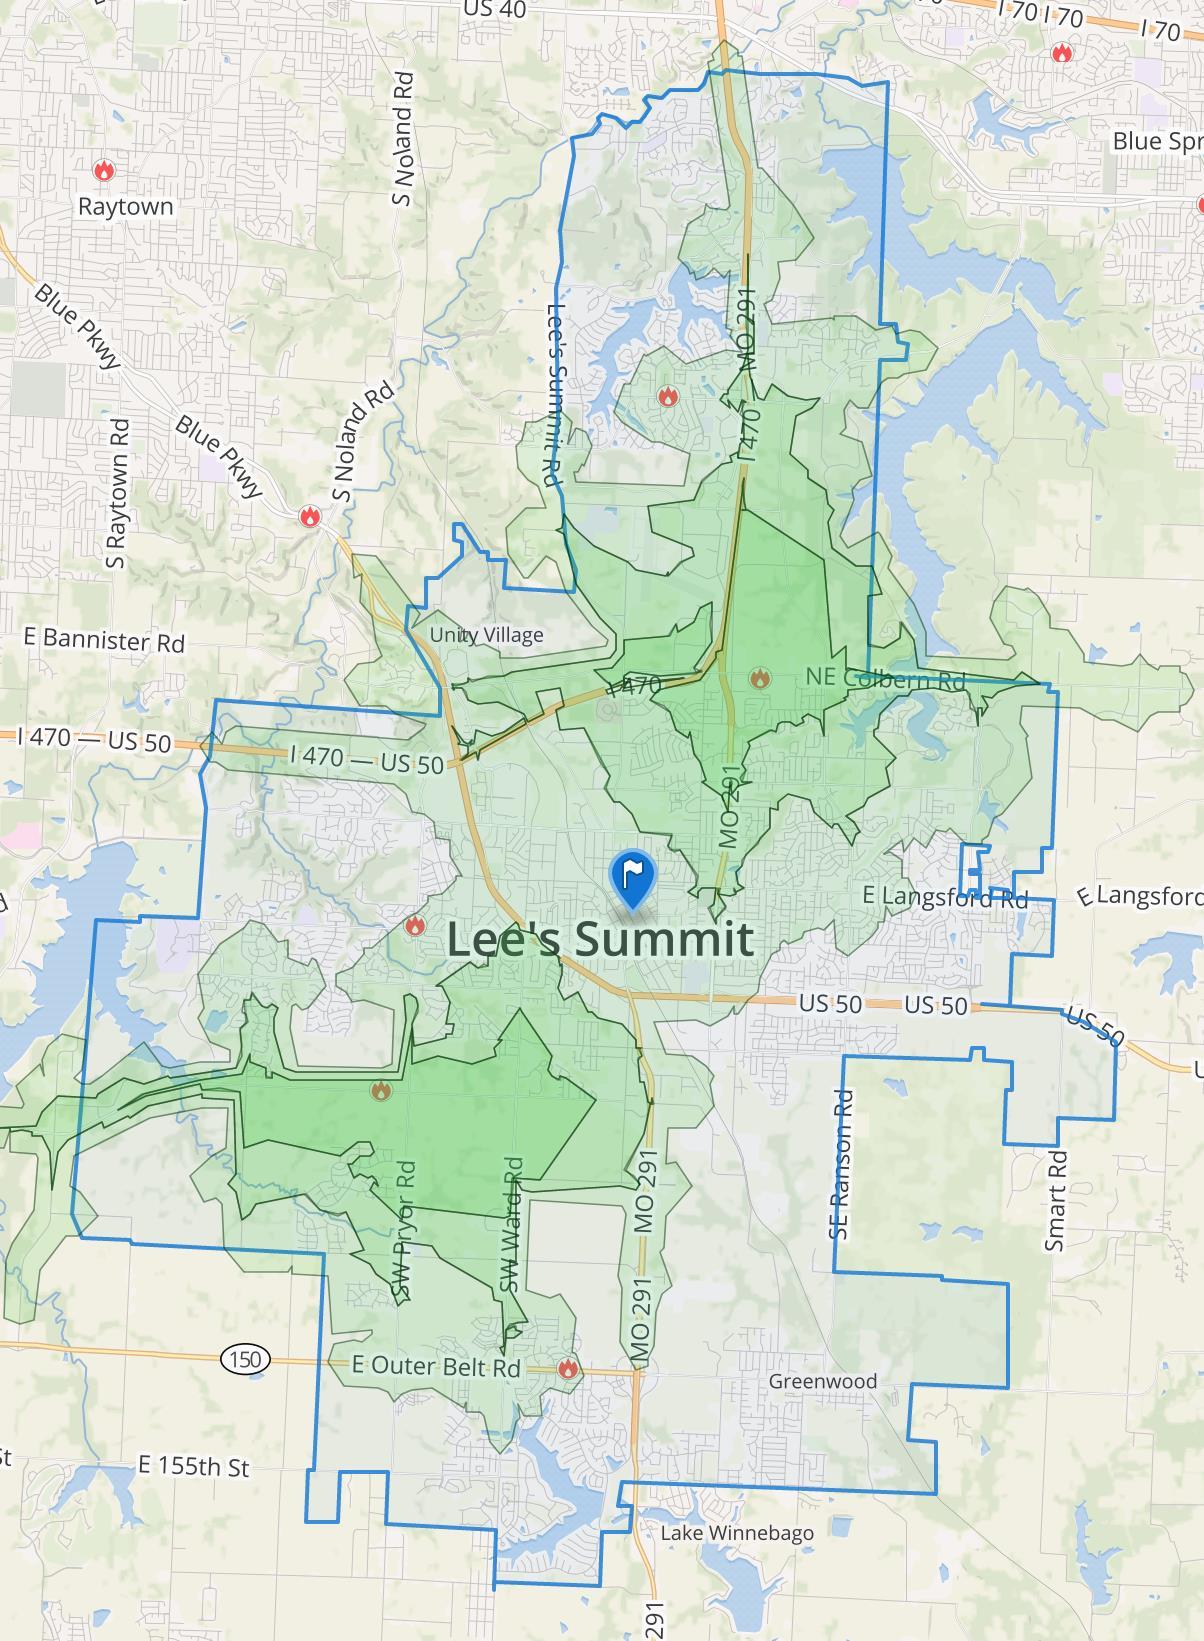 Map 61: Response Times for Ladder Trucks Deploying from Station 2 and Station 7 (dark green = 0-4 minutes; green = 4-6 minutes; light green = 6-8 minutes)

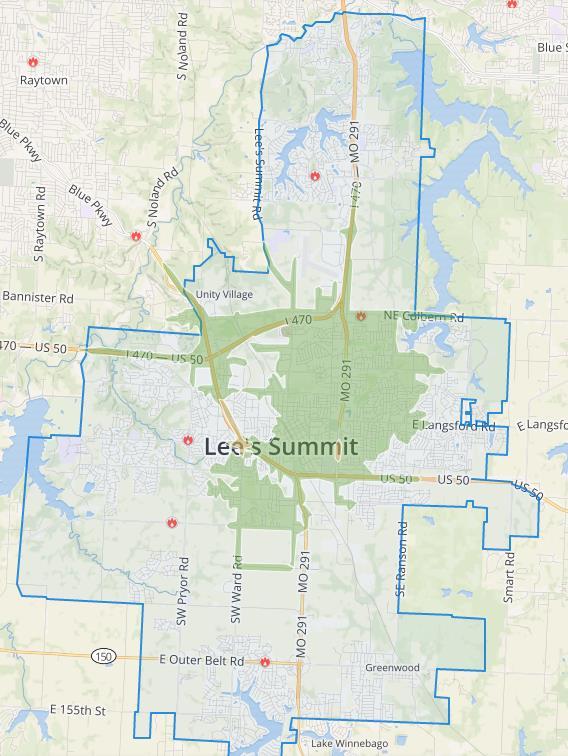 Map 62: Response Time - ERF of 16 Personnel within 8 Minutes (in green)


 Lee’s Summit Fire Department Performance Compliance Methodology Model


