The City of Irving conducts a biennial Resident Survey, initiated in 2006, to gauge residents' satisfaction with quality of life and city services, informing decisions on service levels, budget allocation, and future planning. In 2024, the City partnered with Elite Research to administer the survey and continued with Elite Research for the 2026 survey, using both a randomized sample and open-call method. The survey was available in both English and Spanish. Collected survey data was cleaned by removing incomplete, duplicate, and careless/inattentive responses, resulting in 4,958 valid respondents for the final analysis. The survey results were weighted to correct imbalances in the core set of demographics by ZIP code, age, gender, ethnicity, race, and home ownership as compared to Census population statistics for the City of Irving.
Highlights
Residents generally rated Irving consistent with or slightly better than 2024. Opinion ratings improved across 55 of 72 items requesting feedback on quality and satisfaction across all service areas. Slight progress has been made in many areas, while most 2026 results cluster around regional average benchmarks.
Irving is comparable to peer cities when it comes to working, living, and raising children. More than twothirds of residents highly rated Irving as a place to live (71%) and work (72%), squarely aligned to regional average benchmarks. Modest improvement was seen in perception of Irving as a place to raise children (60% combined “Excellent”/”Good” percentages) Just over a third of respondents perceived Irving as a destination to visit (37%), just above the regional low benchmark (34%) for this measure. This suggests residents generally appreciate living and working in Irving but are not convinced of its external appeal to visitors and neighboring residents.
Fire, library, and solid waste services were the most positively rated services areas by Irving residents. More than three-fourths of residents rated nearly all elements of these services as “Excellent” or “Good”. Maintenance and appearance was the only service area where less than half of Irving residents rated the City as “Good”/”Excellent.” Nearly half of residents again selected sidewalk and street maintenance as a service area requiring emphasis from City Leadership. Many open-ended responses suggested the need for the City to fill in potholes and repair broken sidewalks.
The variety of Irving dining and retail shopping fail to meet regional average benchmarks and the variety of housing options just exceeds the regional average benchmark level. Approximately half of all residents on average (52%) rated the variety of these key economic, leisure, and commercial metrics as “Good” or “Excellent.” Resident responses provided a perception that Irving has a substantial task ahead to compete with regional peers related to dining, retail, and housing needs. Residents also noted in open-ended responses that they often feel like they need to go into other cities to get the variety of dining, retail, and entertainment options they would like to see.
The City of Irving website continues to be the most prevalent way residents receive communications regarding the City, despite major shifts in communication use among residents. The website is used by
90% of residents, while 76% read the City Spectrum. City cable, channels, public meeting streaming, and City weekly email newsletters all decreased significantly in use compared to 2024 as the use of social media, City video content, “City Briefs”, and City Spectrum all increased significantly.
Newer residents use DART/TRE more frequently than long term residents. While the majority of residents had never used DART or TRE public transport in Irving (51%), that trend may be shifting. More than twothirds of residents living in Irving less than a year reported using public transportation at some point. Nearly half of residents in every other group of residency length had never used DART/TRE. Nearly half of Irving residents living in Irving less than one year reported using DART or TRE weekly (46%) when less than 10% of residents of all other groups of time lived in Irving report the same frequency. In total, 60% of Irving’s newest residents use DART or TRE monthly or more frequently. Twice as many Irving residents of 1-5 years reported daily use of public transportation (6%) compared to residents who have lived in Irving less than one year or more than five years. Recent residents are reporting a change in how public transportation is used.
Certain groups tend to have higher and lower satisfaction across nearly all service areas. Stratified results broken out by categories revealed trends that hold for many/most questions. Some of these trends overlap. Renters tended to more highly rate most items than owners. Newer residents tended to more highly rate items than home owners. Generally, residents from zip codes 75038, 75039, and 75063 more highly rated city services and characteristics than residents from 75060, 75061, and 75062.
Resident priorities for leadership were nearly identical to 2024 priorities in magnitude and ordering of most selected areas. Residents combined preventative, maintenance, and expansion efforts for leadership to prioritize over the next two years. The most frequently selected service priorities were identified as street/sidewalk maintenance, homelessness, economic development, housing, and code enforcement as the top five areas of emphasis for city leadership over the next two years. Similarly, open-ended responses for 2026 had the same top four priorities as 2024, which were improving and repairing city infrastructures, increasing social services and community resources, supporting economic development efforts, and providing residential trash and recycling bins.
Limited changes to survey questions from 2024 allow for more robust analysis looking back and moving forward. Most changes to the survey and data collection implemented in 2024 to produce more representative and robust results were continued in 2026. This maintained the rigor and quality of the data collected while also deepening the capacity to compare to past results and compare to future results.
Survey results portrayed Irving as a good place to live and work. Perception improved on the City as a place to raise children The City fell below regional average benchmarks for the variety of dining/restaurant establishments and retail/shopping. Irving residents don’t strongly view the City as a place to visit as just over one-third highly rate its tourism capacity. Newer residents perceive and use City services differently than longer termed residents. Twice as many residents living in Irving 1-5 years rated Irving “Excellent” as a place to live (40%), compared to those less than one year, 11-20 years, and more than 20 years (19-20% each). This group of residents also most highly rated the city as a place to raise children (38% “Excellent”) compared to 14-22% for residents of all other lengths of time lived in Irving. Additionally, individuals living in Irving for 1-5 years most highly rated the city as “Excellent” when it comes to the City as a place to work
and visit. These residents were also most satisfied with the variety of retail or shopping establishments, restaurants, and employment opportunities. For areas of improvement, residents suggested improving and repairing city infrastructures, such as fixing broken sidewalks and streets, and improving the draining system to reduce flooding in the area. They also noted the need for TNR (Trap, Neuter, and Release) programs to help reduce the number of strays and feral cats, as well as targeted efforts to support those experiencing homelessness. Efforts to support economic development were also encouraged, as residents noted the need for Irving to grow in the variety of restaurants and shopping opportunities available.
Safety is a key quality of life determinant for vibrant communities. Irving residents indicated safety levels exceeding regional averages across all safety measures with the majority approaching benchmark highs. Several trends from 2024 continued in 2026, with respondents reporting no perceived safety when walking or visiting parks in the day than in the evening. or in their perceived safety walking in their neighborhood during the day (94% combined “Safe”/”Very Safe”) and during evenings (79%).
However, residents felt less safe visiting city parks during the day (86%) and in the evening (58%) compared to 2024 results (Day: 93%; Evening: 63%). Again in 2026, females tended to feel less safe than males. Contrary to 2024 results, this trend manifests during the day, and not just in the evening. Males (96%) and females (93%) have similar combined “Safe”/”Very Safe” ratings for feeling safe walking in their neighborhood during the day, but greater percentages of males felt “Very Safe” (54%) than females who reported feeling “Very Safe” (39%). Women felt less safe walking in their neighborhoods at night (27% “Very Safe”) compared to males (36% “Very Safe”). Significantly more males felt “Very Safe” visiting Irving Parks during the day (42%) than females (36%). The differences are even more pronounced in the evenings as 79% of males felt “Safe” or “Very Safe” compared to 58% of females feeling “Safe” or “Very Safe” visiting parks in the evening. Residents generally felt safe from violent crimes (75%) and property crimes (73%), but females had much lower “Very Safe” ratings for these items (violent crime: 19%; property crimes: 15%) than males (violent crime: 33%; property crimes: 21%).
Newer residents (less than one year) generally felt safe, but not quite “Very Safe” in Irving. A greater proportion of respondents living in Irving 1-5 years rated the visibility of police in neighborhoods as “Excellent” (30%) compared to residents living more (13-23%) or less (16%) time in the City. Nearly threefourths of residents of less than 1 year felt “Very Safe” walking in their neighborhood during the day (74%), but less than half of residents in each subsequent group of time spent in the City felt “Very Safe.” Conversely, residents of less than 1 year have the lowest rates of feeling “Very Safe” walking in their neighborhood in the evening (17%) compared to those living in Irving for longer times (26-42% “Very Safe”). Residents less than 1 year had comparable feelings of safety visiting parks in the day and during the evening as more long term residents, but lower feelings of being “Very Safe” (Day: 29%; Evening: 14%).
Residents rated the quality of services provided by the City, consisting of city parks, library, arts and culture, traffic and transportation, solid waste, and code enforcement services. Residents more highly rated parks and recreation in 2026 than in 2024 on all program components. The parks and recreation ratings exceeded regional average benchmark ratings for all seven parks and recreation service activities. More
than two-thirds of residents highly rated the maintenance/landscaping of city parks, variety of special event opportunities, quality of walking trails and City park facilities. Newer residents tended to appreciate parks more than longer termed residents. Residents of 1-5 years had the highest rates of “Excellent” responses compared to those living in Irving less than one year or longer than five years regarding maintenance and landscaping of city parks (33%), quality of facilities (26%), quality of walking trails (33%), variety of programs available at recreation centers (25%), and variety of special event opportunities (37%). Aquatic centers continued to be the lowest rated program element, but experienced the largest improvement in “Good” and “Excellent” combined scores (2024: 53%; 2026: 61%)
Fire services continued to be the most highly rated program area across all service areas. Approximately nine out of ten residents rated their satisfaction as “Excellent”/”Good” with Irving Fire Department response times (91%), Irving Fire Services quality (90%), and Irving ambulance services quality (89%). All of these measures approached regional high benchmarks (within 3%). Fire service was the second lowest rated emphasis area (5%) indicative of tremendous satisfaction and low need for improvement or changes.
The library continued to be the second top-rated service areas for Irving. More than three-fourths of residents considered the quality of service provided at the City libraries to be “Excellent”/”Good” (80%) and the facilities at City libraries were rated similarly highly (77%). The physical and digital availability were highly rated (75%) and more than two-thirds of respondents highly rated the variety of in-person and virtual educational programs offered by the library (68%). Consistent with trends elsewhere, shorter term residents tended to more highly rate these programmatic elements. Irving residents of 1 to 5 years had the highest “Excellent” ratings for all aspects of library service compared to those living less or more time in the City. Females more highly rated the availability and selection of physical and library books and materials (38%) and library educational programs (30%) as “Excellent” (38%) than do males (availability/selection: 29%; educational programs (25%).
Ratings for the Irving police department exceed regional average benchmark scores for all measures with police visibility (neighborhoods and retail areas) and response times exceeding regional high levels. Nearly three-fourths of residents were satisfied with City police department response times (73%). Generally, half of Irving residents reported “Excellent” or “Good” ratings for the police department regarding visibility (neighborhoods: 55%; retail areas: 51%) and effectiveness (traffic enforcement: 55%; crime prevention: 57%). Residents in all categories having lived in Irving ten years or less more highly rated their satisfaction with police response times as “Excellent” (35-37%) than all categories of length of residency longer than ten years (25-28%). Renters tended to more highly rate the police.
Traffic and transportation was the second lowest rated service area in 2024 relative to other program areas. Irving residents reported improved satisfaction with seven of the eight traffic and transportation items. Scores for the City of Irving exceed regional average benchmarks for seven of eight items. The majority of residents rated “Good” or “Excellent” the condition of traffic signs and roadway striping (57%), adequacy of placement/number of streetlights (54%), quality of signal timing (53%), and condition of major streets excluding highways (51%). Significantly higher percentages of renters reported feeling “Excellent” about each of these eight measures compared to home owners. The same holds true for greater proportions of males with “Excellent” ratings for each question than females do.
Solid waste services were highly rated by Irving residents in 2026 as improvements were gained in each of the six activity areas. More than 80% of residents highly rated the brush/bulky waste pickup, residential
trash collection, and curbside recycling programs. Satisfaction with landfill services and brush/bulky waste pickup all surpassed regional high benchmarks. Residents of less than one year most favorably rated all solid waste activity measures compared to longer tenures in Irving.
Residents again more highly rated the City of Irving government for services delivered than all larger levels of municipal, state, and federal government. Residents rated the City of Irving the highest for the quality of services provided, with more than two-thirds considering them “Good” or “Excellent” (69%), compared to the other government bodies. Residents rated the City 35 percentage points higher than the U.S. Government, 25 percentage points higher than the State of Texas, and 28 percentage points higher than Dallas County for satisfaction with the overall quality of services. The majority of respondents rated the quality of living in Irving as “Good” or “Excellent” (54% combined) relative to the affordability within the DFW metroplex.
Resident priorities have not changed significantly in the past two years. Results revealed that respondents continued to combine preventative, maintenance, and expansion strategies to strengthen the City. The top five priorities for city leadership to address over the next two years were unchanged in order and comparable in magnitude (+/- 3%) compared to 2024. Irving residents indicated that they want to see leadership prioritize street/sidewalk maintenance, homelessness, economic development, housing, and code enforcement in order to grow. Nearly half the residents believed that sidewalk and street maintenance are top priorities (47%). Homelessness (39%) continued to be a key concern selected significantly more frequently than all service area priorities. Additionally, approximately one in five residents selected economic development (28%), housing (23%), and code enforcement (23%) as areas of service priorities.
The City of Irving Resident Survey has been conducted every other year since 2006 to provide residents with an opportunity to rate the quality of life and city services in Irving. The primary goal is to better understand residents’ satisfaction, as well as what is working well and what needs improvement. The information collected is used to inform decisions related to service levels, budget allocation, and future planning. In 2024, Elite Research collaborated with the City as the first outside vendor to administer the survey and continued with Elite Research for the 2026 survey.
Irving hosts this biennial survey to help measure its efforts in meeting the vision and the mission of the City By participating, residents have the opportunity to voice their opinions and contribute to the betterment of the community.

Vision: Irving will be the model for safe and beautiful neighborhoods, a vibrant economy, and exceptional recreational, cultural, and educational opportunities.
Mission: Deliver exceptional services and promote a high quality of life for residents, visitors, and businesses.
The 2026 Resident Survey was administered by Elite Research. The survey was designed to collect responses from all residents of the City of Irving while also maintaining a randomized sample method similar to prior surveys. The random sample was representative of both single-family and multi-family homes. The survey was additionally available in both English and Spanish. Questions were included for all respondents to rate the quality of life, city services and amenities in Irving.
The results and key findings from the 4,958 valid responses in the Resident Survey gauge satisfaction levels with current city services including public safety, transportation, utilities, parks and recreation, and more. By understanding the issues and services that residents prioritize for future city development and resource allocation, the City gathers insights into how to improve services, infrastructure and community engagement. By ensuring the data gathered is inclusive, the City hopes to capture perspectives from all demographic groups to address disparities and promote equity across the community.

The survey was reestablished as a baseline survey in 2024. In 2026, a few questions were added to gauge city specific ratings on topics of interest like educational opportunities and quality of living The survey begins with five requiredresident profile questions to ensure residency within Irving, followed by 112 rated statements, allowing up to 16 open-ended responses for residents to expand on ratings that were considered poor An additional open-ended question was added for residents to expand on factors or ideas that would impact their rating with the quality of living in Irving relative to affordability of the Metroplex. The survey concludes with six demographic questions (Appendix A) and a final question asking if residents would be interested in participating in a focus group based on their responses
The rating scales varied from “Very Poor” to “Excellent” or “Not Safe” to “Very Safe” with a “No Opinion” response provided for most statements. Some statements include an “Unaware of Service”. An additional rating scale is used to rate frequency and does not include an average or neutral option. Ratings of “No Opinion” and blank responses are excluded from the analysis, as this is best practice (Appendix C). Respondents were also asked to rank their top service priorities.

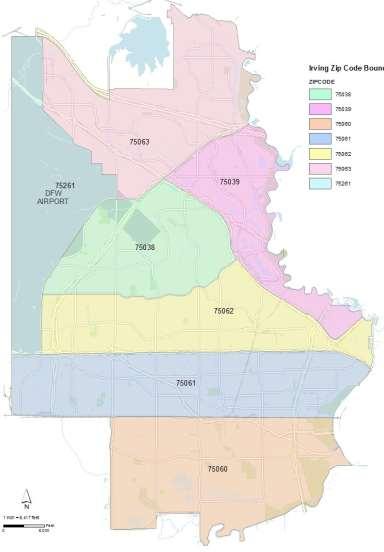
The sample was stratified by ZIP code to make it more representative of the population while allowing for statistical comparisons (Table 1). A proportional number of random households were selected from each ZIP code to match the percentage of the City’s population in each. Weighting estimates are applied based on U.S. Census data.1 The findings within this report are provided with weighting.
The survey was conducted by collecting responses to the 2026 Resident Survey (Appendix A) distributed to 22,938 randomly selected City of Irving single-family contacts provided from the City’s Utilities department An additional list of 10,997 randomly selected City of Irving multi-family contacts were also invited to
Table 1. Frequencies and Percentages of Respondents by ZIP Code
Note. *17 respondents from ZIP code 75019 are included Table shows the weighted results N = number of respondents, % = percentage of respondents
1 ://www2.census.gov/programs-surveys/acs/methodology/design_and_methodology/2022/acs_design_methodology_ch11_2022.pdf
respond. Of the 33,935 contacts included in the original sample, 22,959 had at least one email address 68%) and 17,192 (51%) had a telephone number. Over 10,772 contacts had delivery errors, either as bounced or undeliverable emails and phone numbers, reducing the invited sample to 22,621
Participation in the survey was voluntary and respondent data were deidentified prior to analysis.

Survey responses were collected between February 25, 2026, and April 9, 2026
To maximize responses, data were collected via an online survey using a proprietary tool called PsychData (psychdata.com).
All potential respondents with an email address received an initial invitation to participate in the survey via email, followed by at least two additional email reminders if they did not respond to the survey. Those with undeliverable emails or who did not respond to reminders were added to the text message sample for additional contact efforts via phone or a Short Message Service (SMS) text survey link. Additionally, city attended various events to champion the survey and gain increased response through the open-call:
▪ Frost Fest
▪ Irving’s Got Talent
▪ Music on Main
The open survey was also advertised in various places or publications, including:
▪ City of Irving website
▪ Elite Research website
▪ City Spectrum / Neighborhood Associations
▪ Irving Independent School District Newsletter
▪ City Manager Letter
▪ City’s social media platforms (X, Facebook, Instagram, and LinkedIn)

The City received responses from 10,956 participants via the online survey, phone interview, or SMS text. Examination of the data showed that 5238 of the responses clicked the survey link but did not answer any questions, and an additional 52 responses were save and return connections, leaving 5,638 responses Of these, 3,448 were from the invited sample, resulting in an invited sample response rate of 15.2% (3,448/22,621). Based upon the sample size and Irving’s total adult population (more than 17 years old), the survey results have a confidence level of 95%, which is customary for surveys The margin of error is less than 1.4% for the City of Irving and 4.9% for each ZIP code. Therefore, the results of the survey can be generalized with 95% confidence that the actual score of the City’s entire population would be within 1.4% of the reported results

To ensure survey responses were valid for analysis, validity checks were performed on all responses. The data cleaning, validity check, and coding process was performed using IBM® SPSS® Statistics software. Invalid response removal included:
▪ Incomplete Responses: 649 respondents who clicked the survey link did not answer at least 25% of the survey questions and were removed from further analysis. The drop-off rates after the first quarter of the survey were less than 1.3% per page, typical for online survey collection.
▪ Duplicate Responses: Duplicate responses were identified by matching contact ID, name, email, and IP address across responses. For survey participants identified as having multiple responses, the most completed response was kept for analysis. Five (5) duplicate respondents were removed.
▪ Non-Variance in Responses: If respondents show no variance across multiple matrix item sets, there is strong justification for removing them due to careless or inattentive answering 2 Responses from twenty-seven (27) respondents across all matrix questions showed no variance and were removed from further analysis.
▪ Took Survey Too Fast: Research suggests removing responses where the respondent took less than two seconds to answer each survey question. Responses at this rate may be indicative of careless and inattentive answering.2 Items that were intended to not be answered as part of skip logic based on prerequisite questions were not treated as missing. Of the 5,666 respondents who started the survey, eight (8) were identified as taking the survey too fast and were removed from analysis.
▪ Under the Age Requirement: three (3) participants were under the age of 18 and were removed from further analysis.
After the data validation process, responses from 4,974 participants were determined to be valid, resulting in a validity rate of 88%. Among these, 16 respondents indicated they were visitors, not residents, and were removed This left a final valid sample of 4,958 respondents for analysis.
2 Huang, J., Curran, P., Keeney, J., Poposki, E., & DeShon, R. (2012). Detecting and deterring insufficient effort responding to surveys. Journal of Business and Psychology, 27(1), 99–114. https://doi.org/10.1007/s10869-011-9231-8

Imbalances in public response surveys exist between the survey sample and the population due to characteristics related to responses of targeted segments, nonresponses, and general participant characteristics. Typically, a core set of demographics are used to adjust the dataset to correct these imbalances, including sex, age, race, ethnicity, and geographic regions. Reliable population benchmarks are readily available from the federal government to adjust the response rates from the sample to reflect the population. This is called weighted descriptive analysis, or weighting.
These core demographic variables or descriptive statistics summarize the characteristics of a data set. Weighting data ensures the final data represent the population of the City by weighting the survey responses to reflect population characteristics. The population characteristics (i.e., control variables) used for weighting the data were the same items listed in Table 2: ZIP code, age, gender, ethnicity, race, and home ownership. As shown, the 2026 Resident Survey responses cover segments of the target population in proportions that do not exactly match the proportions of those segments in the population itself.
For this report, response rates were weighted using the raking method to make the respondent sample reflective of the population. The raking weighting methodology is one of the most prevalent methods for weighting public response surveys.3 Raking adjusts the response weights so the marginal distribution of specified variables (i.e., control variables) for the weighted survey sample most closely represents the desired population.4
Appendix B displays weighted and unweighted frequencies and percentages for the respondent demographic characteristics. Appendix C displays the weighted frequencies and percentages for each item in the survey by rating type, while Appendix D displays the weighted percent of positive responses by ZIP code.
Appendix E displays the weighted number of responses for each item, the percentage of “No Opinion” selected, and the weighted percent of positive responses by invited sample versus open call.
The survey results are predominantly reported as the percent positive responses to each statement. The percent positive is an aggregate of the top two most positive responses to each statement (i.e., the combination of “Excellent” and “Good” responses, or “Very Safe” and “Safe” responses). Detailed results for all the scale choices for each item are displayed in Appendix D.
The survey and results are divided into twenty (20) sections by service area/department: General Characteristics, Government Type, Development, Safety, Police, Animal Services, Fire Services, Library Services, Irving Arts & Culture, Parks & Recreation, Maintenance & Appearance, Code Enforcement, Solid Waste Services, Water Utilities, Traffic & Transportation, Public Transportation, Communication Tendencies, Information Sharing & Transparency, Engagement, and Resident Priority Areas.
3 https://doi.org/10.1136/bmj.a494
4 https://www.scb.se/contentassets/ca21efb41fee47d293bbee5bf7be7fb3/weighting-methods.pdf
Table 2: Frequencies and Percentages of Respondent Characteristics for the Population, Unweighted and Weighted Sample
Note. * The ten respondents from ZIP code 75019 are included in this ZIP code ** Total Irving population over
Benchmark data from select cities are included where similar items were available (Appendix F) This data, aggregated from Resident Surveys, includes the lowest, average, and highest scores from Arlington, Dallas, Denton, Mesquite, McKinney and Plano. These cities were selected for their similarity to Irving in location, population, service delivery, and city amenities. Benchmarking allows Irving to evaluate its performance relative to comparable cities and is used to help inform budget allocation and strategic planning decisions
Longitudinal analysis involves studying the City’s Resident Survey data over time to track changes and consistencies, providing insights into trends, patterns, and the effects of interventions or policies (Appendix G). This report compares 2026 survey data to results from 2018 onward to capture recent and significant trends. Longitudinal comparisons with this year’s data should be interpreted with caution as 2024 and 2026 results include the open call sample and are weighted, while prior years were not. Therefore, statistically significant changes for year-to-year comparisons are those that are five or more percentage points above or below the comparative data.
Using surveys to understand the local population's needs and preferences has limitations, particularly related to ZIP code subgroups, participant responses, question structure, timing, technology, and survey fatigue. One constraint was the representation of various ZIP code subgroups compared to the overall generalization to the entire city population as some ZIP codes had a greater response rate than others. This response rate difference by ZIP code made the margin of error for generalization of the findings by each ZIP code less than 5%, but not as low as the city population which was less than 1.4%.
Participant responses and self-selection also pose limitations. The survey relies on voluntary participation, which often attracts individuals with strong opinions or specific interests. This can lead to overrepresentation of certain viewpoints while underrepresenting others, particularly those of marginalized or less vocal subgroups.
Similarly, technological barriers for online surveys can exclude those without internet access or those who are not tech-savvy. This can lead to underrepresentation of certain populations, such as older adults or low-income groups, in the survey results.

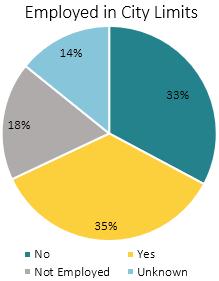
Sample descriptives and frequencies are provided for the weighted respondent characteristics (Appendix B). The largest group of respondents have lived in Irving for more than 20 years (38%) and the next largest have lived in Irving for 1-5 years (24%). More than 30% of respondents reported being employed within Irving City limits (35%), while 33% indicated they are employed outside the city limits
Years Lived in Irving
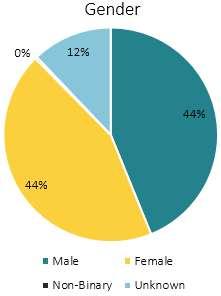
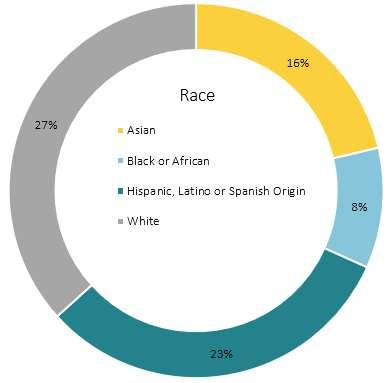
Equal number of females (44%) than males (44%) completed the survey. The largest ethnic/racial group of respondents are White (27%). The next largest groups of respondents are Hispanic (23%), Asian (16%), multi-racial (12%), and Black or African (8%). Additionally, most respondents are younger than 54 years old (59%). The following age groups represent approximately 9% of the sample each: 18-24, 25-29, 30-34, 35-39, and 40-44.
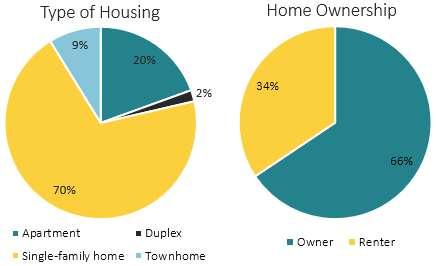
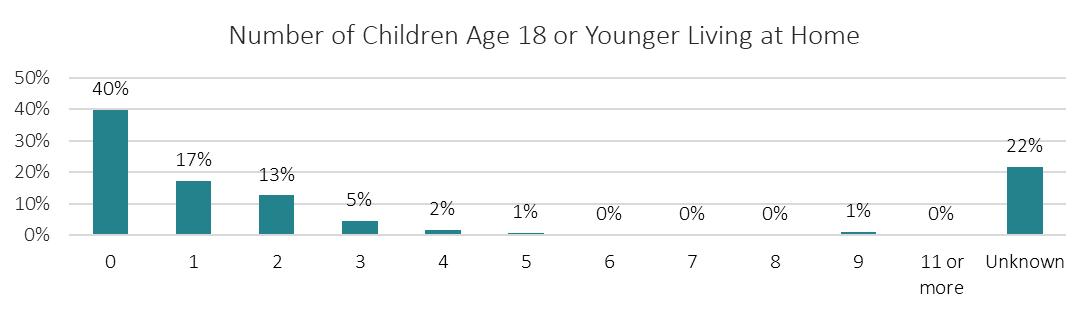
More than two-thirds of respondents live in single-family homes (70%) and 66% of all respondents own and occupy their homes. Thirty percent of respondents have a bachelor’s degree (30%) and nearly onefourth of respondents have graduate degrees (24%). The largest group of participants have no children age 18 or younger living at home (40%), followed by having one child (17%) and two children (13%) under age 18 living in their homes.

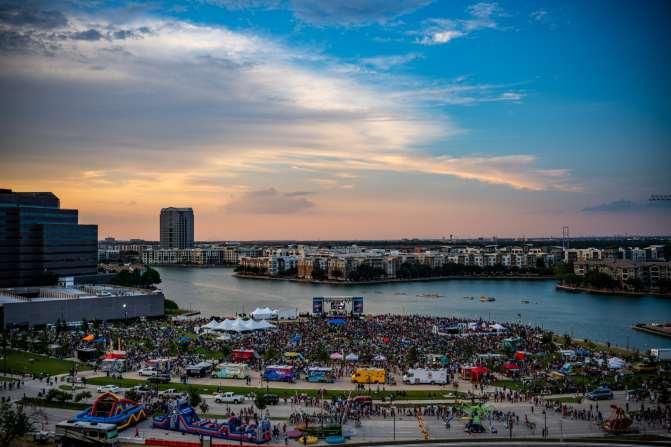
The initial survey items capture broad feedback on key quality of life components related to the desirability to live, work, visit and raise children in Irving. These items measure resident alignment with the City’s mission to “deliver exceptional services and promote a high quality of life for residents, visitors, and businesses.” Quality of life ratings improved in Irving compared to 2024 levels regarding how residents rate Irving as a place to live, work, and raise children. Satisfaction met or surpassed regional benchmark averages for living and working in Irving. Residents rated Irving similar to the regional average regarding the city as a place to raise children (Irving: 60%; Regional Benchmark: 62%). Nearly three-fourths of respondents rated Irving as an “Excellent” or “Good” place to live (72%) and work (71%). Nearly two-thirds of residents agreed that Irving was a “Good” or Excellent” place to raise children (60%). The only metric not to increase compared to 2024 was the rating of Irving as a destination to visit which remained at 37% again in 2026, surpassing the regional low benchmark of 34%. Respondents from the 75038, 75039, and 75063 rated the quality of life in Irving more positively again in 2026 (Appendix D)
Note. Combined "Excellent"/"Good" percentages.
City as a place to work
City as a place to live
City as a place to raise children
City as a destination to visit Quality of living in City relative to the affordability within the DFW Metroplex
Note. Combined “Excellent”/”Good” percentages. Items ranked from highest to lowest “Excellent”/”Good” percentage.

Residents rated their satisfaction with the local, city, state and federal government Ratings increased nominally across all levels of government types with the City of Irving receiving the largest improvement This improvement pushes Irving above the regional average benchmark (Irving: 69%; Benchmark: 65%). US Government support just exceeds the regional benchmark ratings. Consistent with 2024 results, resident satisfaction (percentage of “Excellent”/”Good” responses) generally decreases as governing body size increases. Ratings for the State of Texas, Dallas County, and the US Government all increased by 2-3%. More than two-thirds of the respondents rated the City of Irving as “Excellent/Good” (69%), which is at least 25 percentage points higher than other government types. Residents from the 75038, 75039, and 75063 ZIP codes rated the City of Irving most positively Residents of 75063 had the highest ratings for the US Government, the State of Texas, and Dallas County.
The City of Irving (69%) is most highly rated again in 2026 with all other government types rated much lower. The State of Texas (43%) received higher ratings than did Dallas County (41%). Irving resident rated the US Government (34%) comparable to the regional low (32%). There are no benchmarks published for state or county governments.
Note. Combined "Excellent"/"Good" percentages.
Note. Combined "Excellent"/"Good" percentages. Items ranked from highest to lowest "Excellent"/"Good" percentage.

Development items evaluate facets of Irving that foster its desirability as a place to live, work, and visit. Residents rated Irving’s employment opportunities and housing options variety above the regional benchmark averages, while rating the variety of restaurants and retail shopping establishments below regional benchmark averages. The majority of residents gave high ratings to the variety of dining or restaurant establishments (62%), employment opportunities (53%), and the variety of housing opportunities (52%). Less than half of the residents rated the variety of retail/shopping establishments (43%) as “Excellent” or “Good”. Residents of 75038, 75039, and 75063 most highly rated the variety of these development facets.
Respondents who rated at least one characteristic as poor or very poor were invited to provide suggestions through open ended comments. The most common themes that emerged were the need for more retail and grocery stores (19.9%), the need for more restaurants (14.9%), the need for more parks, recreational, and entertainment spaces (8.5%), and the need to update or renovate Irving Mall (7.0%). Responses also called for an improvement in housing (6.4%) and the need for better school districts (5.8%) (Appendix H)
Note. Combined "Excellent"/"Good" percentages.
Variety of dining or restaurant establishments
Note. Combined "Excellent"/"Good" percentages. Items ranked from highest to lowest "Excellent"/"Good" percentage.

Public safety is an underlying element in establishing an enhanced quality of life for residents serving as the backbone of the City’s vision to be “…the model for safe and beautiful neighborhoods, a vibrant economy, and exceptional recreational, cultural, and educational opportunities.” Residents are highly satisfied with public safety at standards exceeding the regional benchmark averages for all seven components and approaching the regional high standards for the majority. Resident ratings remained consistent with 2024 levels for three safety items, while satisfaction decreased 4-8% for the remaining four items. Residents from 75063, 75039, and 75038 had higher safety ratings than residents from other ZIP codes (Appendix E).
Note. Combined "Very Safe"/"Safe" percentages.
Again in 2024, Irving residents’ felt most safe walking in their neighborhood during the day with 94% feeling “Very Safe” or “Safe” for the third consecutive survey. The next largest groups of residents felt safe visiting Irving parks during the day (86%) and safe from fire, flood, or other natural disasters (83%). Both rates are right at or above the regional high benchmark level despite notable decreases (-8% each) in combined “Safe” and “Very Safe” levels for both safety elements over the past two years
The majority of Irving residents also feel “Very Safe” or “Safe” from violent crimes (75%) and property crimes (73%), with feelings of safety from property crimes the only safety item improving since 2024 These categories all exceed regional benchmark averages. Residents again felt the least sense of safety
when visiting Irving parks in the evenings (58%). This reflects a minor downward trend for this activity which had nearly identical ratings dating back to 2018 This measure still meets the regional benchmark average
Scores by Activity
Walking in your neighborhood during the day
Visiting Irving parks during the day
From fire, flood, or other natural disaster
Walking in your neighborhood in the evening
From violent crimes (e.g., rape, assault, robbery)
From property crimes (e.g., burglary, theft)
Visiting Irving parks in the evening
Note. Combined "Very Safe"/"Safe" percentages. Items ranked from highest to lowest "Very Safe"/"Safe" percentage.
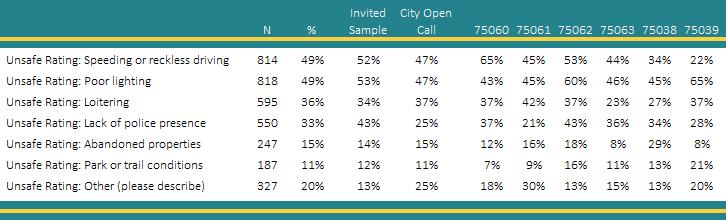
Updates to the 2026 survey allowed for greater insight into factors undermining perceptions of public safety. All residents identifying at least one activity that made them feel unsafe or very unsafe were presented with an additional series of circumstances that contributed to those feelings in an effort to assist the city in improving services. Collectively, 1,688 identified at least one activity that made them feel unsafe.
The most frequently identified reasons for feeling unsafe involved speeding/reckless driving (49%) and poor lighting (49%). Approximately one-third of residents feeling unsafe pointed to loitering (36%) and the lack of police presence (33%) for contributing to these feelings. The reasons for feeling unsafe fluctuated according to zip codes. The majority of residents living in 75060 (65%) and 75062 (53%) who felt unsafe indicated speeding or reckless drivers as a contributing factor, while only 22% of residents from 75039 were concerned by poor/dangerous driving. Just under half of the residents from four of the zip codes selected poor lighting as a reason for feeling unsafe while more than half of residents in 75039 (65%) and 75062 (60%) were concerned about the lighting. Loitering was most concerning to residents in 75061 (42%) and least concerning to those living in 75063 (23%). Lack of police presence contributed more prominently to feeling unsafe for residents of 75061 (21%), while it was most commonly identified as problematic for residents of 75062 (43%). Abandoned properties contributed little to residents feeling unsafe in 75039 and 75063 (8% each), while nearly one-third of residents in 75038 who felt unsafe indicated abandoned properties (29%) contributing to their lower ratings. Park or trail conditions were the least frequently selected reason people felt unsafe, but 21% of residents of 75039 selected this factor while 13% or fewer residents of four of the seven zip codes selected this reasoning. Nearly one-third of 75061 residents included a specified “other” response for contributing to their perception of a lack of
safety. Of these open-ended responses, the greatest concerns were panhandling and homelessness, leading to them feeling unsafe in various areas of the city. One respondent suggested increasing mental health awareness and resources to help these individuals.
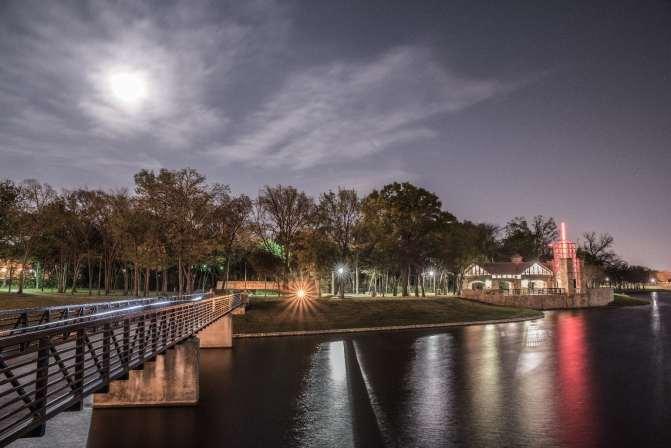

The Police Department promotes community safety by proactively addressing crime and disorder, enforcing traffic regulations, responding to service calls, and building lasting relationships within the community. The majority of residents rated all dimensions of their service as “Good” or “Excellent”. Nearly three-fourths of residents are satisfied with the Irving Police Department’s response times (73%). Just over half of residents highly rate crime prevention (57%), police traffic enforcement (55%), police visibility in neighborhoods areas (55%) and retail areas (51%). The combined ratings significantly exceed the regional high benchmark scores regarding the visibility of police in neighborhoods, the visibility of police in retail areas, and satisfaction with Irving Police Department response times.
Marks for the effectiveness of traffic enforcement strategies exceed regional benchmark averages, while measures for the effectiveness of crime prevention strategies fall just below the regional benchmark Residents in 75063, 75039, and 75038 more highly rate the police in all strategy and visibility measures than residents of 75060, 75061, and 75062. Approximately two-thirds of Irving residents have never used 911 (66%) with approximately one in six indicating use of a few times per year or more frequently (16%). More than 90% of residents reported seeing Irving Police officers patrolling their neighborhood or surrounding residential area with 18% indicating seeing them monthly or more frequently More than onethird (36%) of Irving residents have participated in a Community Event led by either the Irving Fire or Irving Police Department with 15% attending events a few times per year or more frequently. Note.
Satisfaction with city police department response times
Effectiveness of crime prevention strategies
Effectiveness of traffic enforcement strategies
Visibility of police in neighborhoods
Visibility of police in retail areas
Note. Combined "Excellent"/"Good" percentages. Items ranked from highest to lowest "Excellent"/"Good" percentage.
Seen Irving Police officers patrolling neighborhood/ surrounding area
Participated in a Community Event Led by Irving Fire or Police Department
Utilized 911 emergency services in Irving
Utilized Never Utilized

Animal Services play a vital role in safeguarding the wellbeing of residents, pets, and wildlife. Most Irving residents value these services and report satisfaction with the quality of measure items. Residents most highly rate (“Excellent” or “Good”) satisfaction with Animal Services response times to priority calls (58%). These ratings are consistent with 2024 Irving rating and exceed the regional high benchmark (31%). Ratings for the quality of stray animal control (53%) were just below the regional average threshold (55%) and comparable to 2024 results. Approximately one-third of Irving residents have visited the Irving Animal Care Campus (33%) with 17% indicating visiting a few times per year or more frequently. Residents of 75038, 75039, and 75063 most highly rated Irving Animal Services.
Quality of stray animal control in your neighborhood
Satisfaction with Animal Services response times to priority calls
Regional Low Regional Average Regional High Irving 2024 Irving 2026
Note. Combined "Excellent"/"Good" percentages.
The qualitative responses heavily suggested the implementation of trash bins so strays and wild animals would not be able to tear into trash bags and litter the trash throughout neighborhoods. They also noted the need for Animal Services to pick up any dead animals on the side of the road promptly, as they often find dead animals as they walk around their neighborhood or as they drive around. Nearly one-fourth of residents from 75062 (20%), 75060 (24%), 75061 (24%) rated the quality of stray animal control in their
neighborhood as “Poor” or “Very Poor.” These ZIP codes also had the highest combined below average satisfaction ratings for their satisfaction with animal services response times to priority calls. More than one-third of residents from 75038 (36%) and 75063 (38%) rated their satisfaction as “Good” or “Excellent” with Animal Response Services. These percentages are inclusive of the 4-59% of residents with no opinion regarding this service. Similarly, the majority of respondents from 75038 (53%), 75039 (60%), and 75063 (61%) rated the quality of stray animal control in their neighborhood.
Satisfaction with Animal Services response times to priority calls
Quality of stray animal control in your neighborhood (cats, dogs, etc.)
Note. Combined "Excellent"/"Good" percentages. Items ranked from highest to lowest "Excellent"/"Good" percentage. 53%
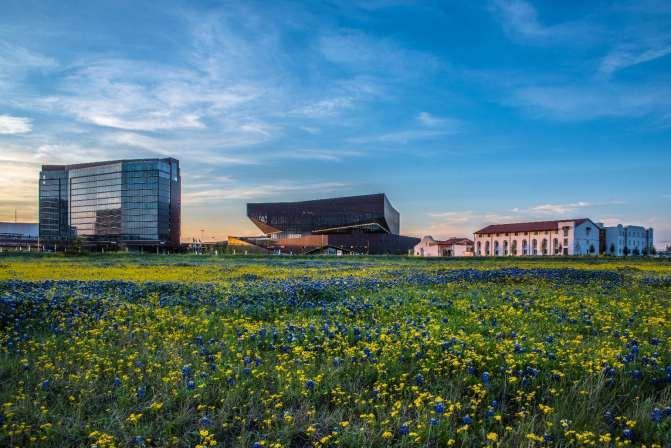

Fire services protect the health and livelihood of residents and resources through provided emergency services. Irving residents more highly rated the Irving Fire Department across all three measures than any other community service. Emergency services are highly rated and well perceived despite limited use by residents. Approximately nine out of ten residents rated each component of fire services as “Excellent” or “Good,” despite roughly two-thirds of residents reporting never having used 911 services in Irving (66%). Satisfaction percentages exceed all regional averages and fall within 3% of regional high benchmark ratings. Ratings for the three Fire Services items were nearly identical with satisfaction ratings ranging from 89-91%. More than one-third of residents participated in a Community Event Led by Irving Fire or Police Departments. Results by ZIP code showed consistently high ratings (Appendix D).
Note. Combined "Excellent"/"Good" percentages.
Note. Combined "Excellent"/"Good" percentages. Items ranked from highest to lowest "Excellent"/"Good" percentage.

The Irving Public Library promotes lifelong learning and the enjoyment of reading through their programs and facilities. Most residents use City public libraries. Three-fourths of Irving residents visited a library in the previous year. The majority of residents rated the library services as “Good” or “Excellent” for all service components despite minor decreases compared to Irving 2024 scores More than three-fourths of residents rated these aspects as “Excellent” or “Good”, with the quality of service receiving the highest rating (80%), quality of facilities at city libraries (77%), and availability of library materials (75%) The library availability and selection of materials as well as the variety of in-person and virtual educational programs offered by the virtual education programs offered by the library exceeded regional high benchmarks. The quality of services provided at the city libraries fell just below the regional average (Irving: 80%; Benchmark: 84%). Residents of ZIP code 75063, 75038 and 75039 most highly rate the library across all service measures. Respondents who rated at least one characteristic as poor or very poor were invited to provide suggestions through open ended comments. A common theme in the comments was residents requesting more children’s activities at the library, particularly for older children with more hands-on learning opportunities (Appendix H).
Quality of service provided at the city libraries
Variety of in-person and virtual educational programs offered by the library
Note. Combined "Excellent"/"Good" percentages.
Availability and selection of physical and digital library books and materials
Quality of facilities at city libraries
Quality of service provided at the city libraries
Quality of facilities at city libraries
Availability and selection of physical and digital library books and materials
Variety of in-person and virtual educational programs offered by the library
Note. Combined "Excellent"/"Good" percentages. Items ranked from highest to lowest "Excellent"/"Good" percentage.
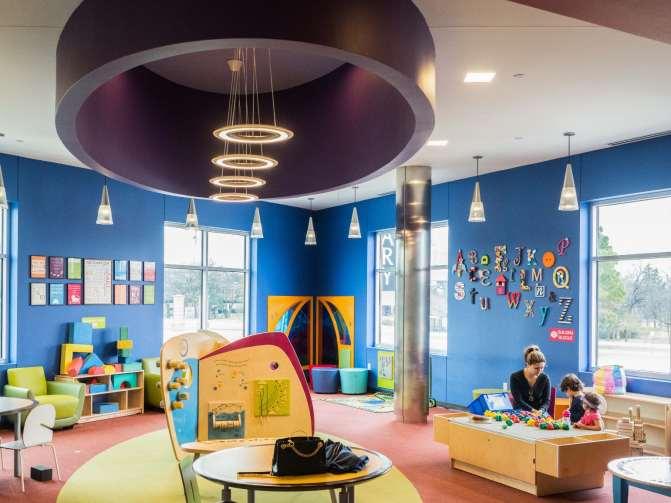

The Irving Arts and Culture department enhances quality of life experiences for residents and by creating and expanding opportunities in the arts. Consistent with 2024 findings, two-thirds of residents rated the Department of Arts and Culture’s quality of services as “Excellent” or ”Good” (67%) just below the regional average benchmark (70%). Ratings regarding the variety of Irving Arts Center programs and exhibits decreased from 76% of residents who found the variety to be “Good” or “Excellent” in 2024 to 66% in 2026. Respondents living in 75038 most highly rated Irving Arts and Culture while residents from 75060 and 75061 had the lowest levels of Arts and Culture quality and variety ratings. Open-ended comments provided feedback related to the affordability of programming at the Irving Arts Center, noting that lowering costs for events may increase engagement.
Note. Combined "Excellent"/"Good" percentages.
Arts & Culture Scores by Activity
Note. Combined "Excellent"/"Good" percentages. Items ranked from highest to lowest "Excellent"/"Good" percentage.

The Parks and Recreational department promotes wellness, socialization, and entertainment through leisure and physical activity facilities/programming. Parks and recreation scores improved among residents for all six measures compared to 2024 levels. Nearly two-thirds of residents rated all recreational components as “Excellent” or “Good”, with the highest ratings for maintenance and landscaping of city parks (73%) and the variety of special event opportunities (71%).
All items except for the maintenance and landscaping of city parks and quality of facilities at city parks exceed regional benchmark averages. The quality of city pool and aquatic centers (61%) continues to be the lowest rated service activity in this section, but experienced the biggest increase in “Good” to “Excellent” reviews compared to the last survey administration The variety of special event opportunities (71%) exceeds the regional high benchmark score (68%) with the quality of walking trails (68%) just shy of the regional high benchmark of 70%. Results vary by ZIP code loosely aligned to trends of certain residents more highly or lowly rating City of Irving.
Respondents who rated at least one characteristic as poor or very poor were invited to provide suggestions through open ended comments. Suggestions included providing more family-friendly areas, such as new playgrounds, as they feel that most activities are geared towards adults or dogs (Appendix H).
Note. Combined "Excellent"/"Good" percentages.
Parks & Recreation Scores by Activity
Maintenance and landscaping of city parks
Variety of special event opportunities (e.g., Movies/Music on Main, etc.)
Quality of walking trails throughout the city
Quality of facilities at city parks (pavilions, playgrounds, picnic tables)
Variety of programs available at recreation centers
Quality of facilities at city pool/aquatic centers
Note. Combined "Excellent"/"Good" percentages. Items ranked from highest to lowest "Excellent"/"Good" percentage.
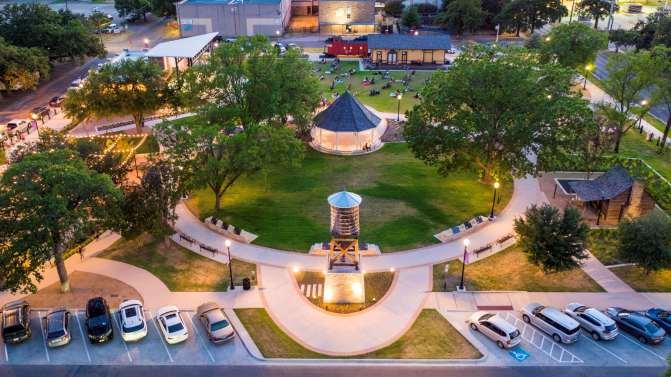

Tremendous maintenance efforts are required to establish and maintain the appearance and sustainability of residential properties, business properties, sidewalks and major highways. Irving residents rated the City’s maintenance and appearance quality similar to 2024 ratings, with roughly half selecting ratings of “Excellent” or “Good” for all items except the maintenance of sidewalks where only one-third indicated higher ratings (36%) Ratings for all other components were comparable to each other in terms of quality and satisfaction with 48-51% of Irving residents indicating “Excellent” or “Good” ratings for each item.
The maintenance of business properties, removal of litter on residential streets/sidewalks, and the removal of litter on major highways all exceed the regional high benchmarks The maintenance of residential properties exceeded regional averages as the maintenance of sidewalks fell just shy of regional averages. Residents of 75063 and 75039 generally more highly rated these items than residents of all other ZIP codes, as residents of 75060, 75061 and 75062 tended to have the lowest ratings for these components. Respondents who rated any characteristic as poor or very poor were invited to provide suggestions. The top two reoccurring themes were to improve and increase the city’s cleaning process including cleaning up trash, car parts, and broken furniture from highways; and repair or upgrade city’s infrastructures, such as broken sidewalks and potholes in the street.
Note. Combined "Excellent"/"Good" percentages.
Maintenance & Appearance Scores by Activity
Maintenance and upkeep of business properties
Removal of litter on residential streets and sidewalks
Removal of litter on major highways
Maintenance and upkeep of residential properties
Maintenance of sidewalks
Note. Combined "Excellent"/"Good" percentages. Items ranked from highest to lowest "Excellent"/"Good" percentage.
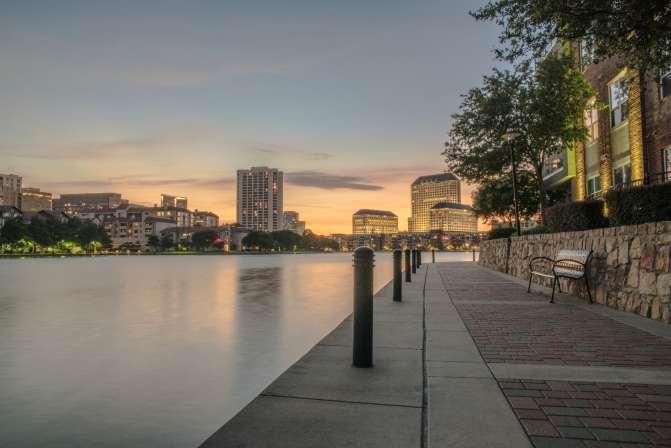

The Code Enforcement department conducts outreach, education, and enforcement to establish and maintain high standards of quality for the overall visual appearance of the community in both residential and commercial-zoned districts Most residents rated the City highly (“Excellent” or “Good”) for each of code enforcement’s assessed areas. Ratings were generally improved in 2026 compared to 2024 results. Residents highly rated the regulation of signs in medians and walkways (64%) and the exterior appearance of single-family homes the highest (63%). Both of these measures exceed the regional high benchmarks. The majority of residents continue to be satisfied with code enforcement reporting that they feel “Good” or “Excellent” about the quality of parking regulations in yards (57%), mowing/cutting weeds/grass regulations on public property (57%), the exterior appearance of commercial/retail buildings (55%), and the regulation of junk/debris (54%).
Ratings for code enforcement remained steady or improved compared to 2024 survey ratings Scores for the regulation of junk/debris on private property and mowing/cutting of weeds/grass on private property also both exceeded regional high benchmarks. The exterior appearance of commercial/retail buildings and multi-family homes fell below the average threshold.
Residents who rated poorly provided qualitative feedback that they feel that code enforcement feels nonexistent and like their complaints are not heard or taken into consideration. Their hopes would be that the City enforces the codes in place to have cleaner lawns and homes, and to reduce the number of cars parked in lawns (Appendix H).
Note. Combined "Excellent"/"Good" percentages.
Regulation of signs in medians and walkways
Exterior appearance of single-family homes
Regulation of parking in yards
Regulation of mowing/cutting of weeds/grass on private property
Exterior appearance of commercial/retail buildings
Regulation of junk/debris on private property
Exterior appearance of multi-family homes
Note. Combined "Excellent"/"Good" percentages. Items ranked from highest to lowest "Excellent"/"Good" percentage.
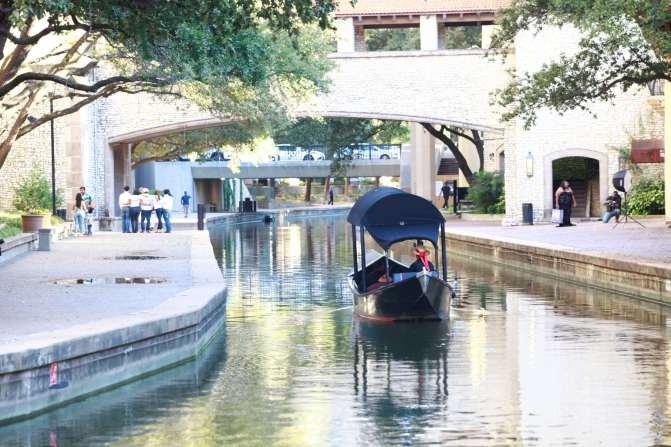

The Solid Waste Services department provides essential solutions to ensuring a clean and sustainable future for businesses, residents, and visitors. The results displayed below are presented for respondents who described where they live as a “Duplex”, “Single-family home”, or “Townhome” in accordance with the residential areas where service is provided. Results improved for all measures by at least 6% in comparison to 2024 Irving ratings. At least three-fourths of residents rated brush and bulky waste pickup, residential trash collection, curbside recycling, landfill services, and hazardous waste disposal as “Good” or “Excellent.” Three measures exceeded regional high benchmark ratings (brush and bulky waste pickup, residential curbside recycling, and landfill services). All activities exceed the regional average benchmark in contrast to 2024 when all seven items failed to meet this threshold. Brush/bulky waste pickup, hazardous waste disposal, and landfill services all rate at or above the regional high benchmark scores. Residents of each zip code had very favorable ratings of solid waste services with educational programs related to recycling the lowest item for each zip code.
Note. Combined "Excellent"/"Good" percentages.
Solid Waste Services Scores by Activity
Brush and bulky waste pickup
Note. Combined "Excellent"/"Good" percentages. Items ranked from highest to lowest "Excellent"/"Good" percentage.

The Water Utilities department and the Municipal Drainage division are responsible for providing high-quality drinking water, educating the community about water conservation and use, and managing the City’s stormwater drainage infrastructure Ratings were generally consistent with 2024 ratings, as Irving scored below regional benchmark averages for all three items again in 2026 Residents again most highly rate the reliability of their water service (72%) despite decreasing since 2024 (78%) such that it rates just between the regional high and average benchmarks. The majority of Irving residents felt the quality of community engagement/educational programs related to the quality of stormwater drainage (63%) and water conservation community programming/engagement (53%) were “Good” or “Excellent.” Residents from 75063 most highly rated all facets of the water utilities service (Appendix D). Residents of 75038 and 75062 were most critical of the reliability of their water service with 14-15% of these residents relating reliability below average. Similar proportions of owners and renters rate stormwater drainage quality and water conservation educational programming above and below average, but more than three-fourths of owners rate the reliability of water service above average (76%) while less than two-thirds of renters rated water service reliability as “Good” or “Excellent” (65%).
Note. Combined "Excellent"/"Good" percentages.
Reliability of your water service
Quality of stormwater drainage
Quality of community engagement and educational programs related to water conservation
Note. Combined "Excellent"/"Good" percentages. Items ranked from highest to lowest "Excellent"/"Good" percentage. 53%


The Traffic and Transportation department manages the City’s critical infrastructure to ensure safe and efficient flow of people, goods, and services throughout the community. Irving residents more highly rated seven of eight traffic and transportation items with 2026 averages meeting or exceeding the regional average for seven items.
More than half of Irving residents rated “Good” or “Excellent” the condition of traffic signs and roadway striping (57%), the adequacy of placement/number of streetlights (54%), the quality of traffic signal timing (53%), and the condition of major streets excluding highways (51%). Respondents were least satisfied with the quality of street maintenance (38%) despite a major improvement in higher ratings compared to 2024 (28%). Ratings for the condition of traffic signs and roadway striping, condition of major streets excluding highways, and the quality of traffic management during rush hour all exceeded the regional high measures. Only the quality of street sweeping (48%) was below the regional average. Residents of ZIP codes 75061 and 75062 have the least favorable traffic and transportation ratings for nearly all items.
Respondents who rated any characteristic as poor or very poor were invited to provide suggestions. Residents reported concern about potholes in the streets, traffic light timing, and street management during storms (flooding, snow, fallen trees, etc.) (Appendix H)
Note. Combined "Excellent"/"Good" percentages.
Condition of traffic signs and roadway striping
Adequacy of placement and number of streetlights
Quality of traffic signal timing
Condition of major streets (not including highways)
Quality of street sweeping
Quality of traffic management during rush hour
Condition of neighborhood and minor street
Quality of street maintenance (filling of potholes, etc.)
Note. Combined "Excellent"/"Good" percentages. Items ranked from highest to lowest "Excellent"/"Good" percentage.


Irving public transportation seeks to provide greater access to the commercial, residential, and recreational components of the city through providing a variety of transportation options. Residents rated the quality of the various types of public transportation (DART’s rail and bus services, Trinity Railway Express services) as well as the overall ease of travel via public transportation. New for 2026, residents provided feedback on DART’s GoLink on-demand service. Ratings of “Good” and “Excellent” exceeded regional high benchmarks for all public transportation items.
There were no major changes to the underlying trend of modest utilization, awareness, and insight regarding public transportation. The majority of residents reported no household members utilized DART/TRE public transport in the past 12 months (51%). Additionally, 33-41% of respondents had “No Opinion” when asked to rate the quality of DART, TRE, and public transportation overall and 10-27% were unaware of public transportation/DART services All findings present results exclusive of those without an opinion. Users of public transportation generally value the service although the lack of use and awareness add important context to evaluating this service.
Residents most highly rate the quality of the Trinity Railway Express service (69%), DART rail (59%), and GoLink on-demand (53%) services as “Excellent” or “Good ” Just less than half of residents rated the ease of travel by public transportation positively (49%), but this is still higher than the regional high (19%) and marks an improvement of 3% compared to 2024 Public transportation ratings did not fluctuate greatly by ZIP code, but residents of 75038 tended to more highly rate the transit items as “Excellent” and “Good” when compared to other ZIP codes (Appendix D).
Note. Combined "Excellent"/"Good" percentages.
Quality of Trinity Railway Express services in city
Quality of DART rail services in city
Quality of DART’s GoLink on-demand service
Quality of DART bus services in city
Ease of travel by public transportation in city
Note. Combined "Excellent"/"Good" percentages. Items ranked from highest to lowest "Excellent"/"Good" percentage.
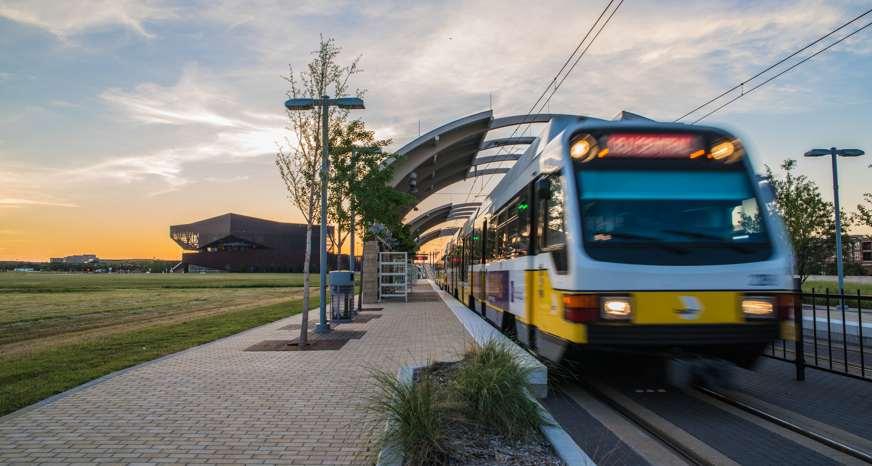

The City of Irving offers diverse communication material published and shared through multiple approaches and medias with the goal of informing different audiences about services and opportunities for residents and visitors alike. The Communications department prioritizes informing residents and capturing feedback about key initiatives, programs, services, and amenities provided by the City. There were notable increases and decreases in use for various communication tools and tendencies compared to 2024.
The City’s website continues to be the most prevalent communication tool for the City, with 90% of residents reporting use. Use of the City Spectrum nearly doubled in 2026 (76%) compared to 2024 (42%). Conversely, city cable channels were the second most utilized resource in 2024 (72%), but decreased threefold to 23% in 2026. There was a notable drop in streaming city council or other public meetings online falling from 63% in 2024 to 28% in 2026. The majority of residents reported engaging with City website listservs (59%), City social media (59%), and reading “City Briefs” (55%). Less than half of respondents watched City of Irving video content (45%) or read “City Spectrum Digital” or “Neighborhood News” (38%). City cable channels, public meeting/City Council streaming, and “City Briefs” exceed regional benchmark high utilization. Additionally, the City website use is within 2% of the regional high benchmark. Only the weekly email newsletters fall below regional benchmark averages.
Note.
City of Irving website
City Spectrum (Monthly print newspaper)
City website listservs
City of Irving social media
“City Briefs” (Utility bill Insert)
City of Irving video content
“City Spectrum Digital” and “Neighborhood News”
Streaming City Council or other public meetings online
City of Irving cable channels
Utilized Never Utilized
Note. Utilized is the combined "Daily”, “Weekly”, “Monthly”, “A Few Times Per Year”, “Yearly" percentages. Items ranked from highest to lowest "Utilized" percentage.

The City promotes continual communication through various channels to designed to inform, listen to, and respond to residents. Sharing information, news, and feedback is essential to sustaining a healthy community. Residents evaluated the City’s performance regarding information sharing and transparency. Results were consistent with previous results as combined “Good” and “Excellent” ratings were within +/-4% of the 2024 survey results for these items
Nearly two-thirds of respondents (61%) highly rated the City for using multiple tools and formats for residents to receive news and information. Nearly half of respondents highly rated all other news, transparency, and feedback items (48-54% combined “Excellent”/”Good” percentages). Irving exceeds the regional high benchmark for using multiple tools and formats for residents to receive news and information, providing feedback opportunities to residents, and being open and transparent to residents. Irving surpasses the regional average benchmark for informing residents about issues and news related to the city. The City falls below the regional low thresholds related to providing a variety of news and information topic to residents and being responsive to resident questions or concerns
Being open and transparent to the residents
Being responsive to resident questions or concerns
Informing residents about issues and news related to city
Note. Combined "Excellent"/"Good" percentages.
Providing a variety of news and information topics to residents
Providing residents opportunities to offer feedback
Using multiple tools and formats for residents to receive news and information
Using multiple tools and formats for residents to receive news and information
Informing residents about issues and news related to city
Providing a variety of news and information topics to residents
Providing residents opportunities to offer feedback
Being open and transparent to the residents
Being responsive to resident questions or concerns
Note. Combined “Excellent”/”Good” percentages. Items ranked from highest to lowest “Excellent"/"Good" percentage.
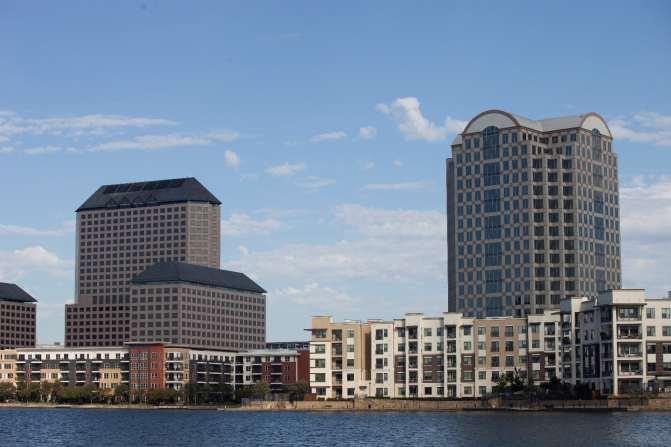

Respondents reported how frequently they engaged with or utilized specific city services, facilities, and amenities. Results were initially analyzed according to the frequencies of daily, weekly, monthly, and yearly visits. Displayed results indicate the percentage of those using each particular amenity or service regardless of whether use was daily, weekly, monthly, or yearly. Many results are presented in previous sections relevant to particular service areas (police, public transportation, library use, etc.).
Engagement increased across all activities/use from 2022 to 2024, but declined slightly for nearly all options in 2026. Use of the Irving trail system was the only activity among the presented findings with increased use in 2026 (+5%).
Nearly all respondents reported that they have visited an Irving park in the past year (89%) Additionally, 75% visited an Irving public library, 73% visited the Heritage/Downtown district, 68% visited the Toyota Music Factory, 66% utilized the Irving trail system, and 63% visited an Irving recreation center Less than one-third of respondents visited an Irving dog park (31%), attended a local public meeting in person (30%), or visited an Irving museum (29%). Local public meeting attendance, city public library visits, and city pool/aquatic center visits exceed regional high benchmarks. Use of 911 and city recreation centers significantly exceed regional average rates. The only measure with regional comparisons not to exceed the benchmark average was visiting a city dog park.
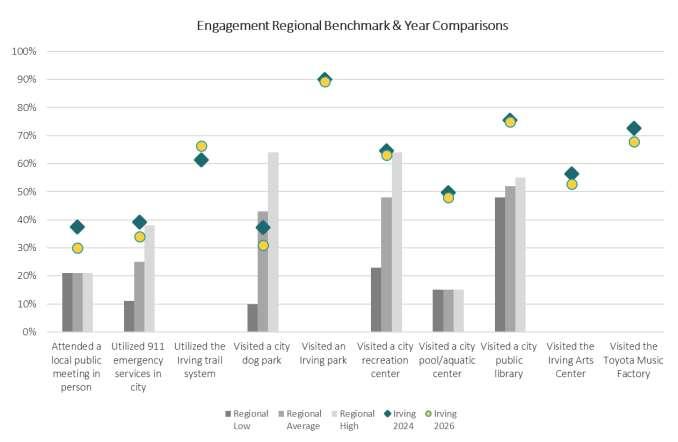
Note. Combined "Daily”, “Weekly”, “Monthly”, “Annually" percentages.
Visited an Irving park
Visited an Irving public library
Visited the Heritage/ Downtown district
Visited the Toyota Music Factory
Utilized the Irving trail system
Visited an Irving recreation center
Visited the Irving Arts Center
Utilized DART or TRE public transport in Irving
Visited an Irving pool/aquatic center
Attended an event at the Irving Convention Center
Visited the Irving landfill
Utilized 911 emergency services in Irving
Visited an Irving dog park
Attended a local public meeting in person
Visited an Irving museum
Note. Combined "Daily”, “Weekly”, “Monthly”, “Annually" percentages. Items ranked from highest to
"Utilized" percentage.

Respondents were asked to rate the top five services areas that need the most emphasis from city leadership over the next two years Resident priorities remained consistent with 2024 findings as there was no change in the order of the six most selected service areas requiring leadership attention. All service areas were within 5% of their 2024 levels. Nearly half of all residents again selected sidewalk and street maintenance as their top priority (47%). Homelessness was the second most frequently selected service area needing attention as 39% of respondents selected this priority. Economic development, housing, and code enforcement also retained at least 20% of the respondents prioritizing these service areas. Street and sidewalk maintenance were combined consistent with historical evaluation due to overlaps in concepts and concerns. In 2026, at least 15% of residents were concerned about litter control (17%) and animal services (16%) whereas those rates were lower than 15% in 2024. Conversely, less than 15% of residents selected planning and zoning (14%), street lighting (14%), and police services (14%) in 2026 in contrast to 2024 when both service areas met the 15% threshold in 2024.
After ranking their priority areas, respondents were asked to describe how the City can improve in their ranked areas as an open-ended response Themes derived from the responses (Appendix I) include improving and repairing city infrastructure, such as fixing potholes in the streets or repairing broken sidewalks (16.9%); Increasing social services and community resources, such as building new homeless shelters or finding affordable housing for those who need a home (12.1%); supporting economic development efforts, such as providing more shopping options (7.9%); providing residential trash and recycling bins instead of placing trash out in bags on the street to reduce stray animals tearing open bags and littering throughout neighborhoods (7.6%); and consistently enforcing inspections and code violations (6.3%). The first four major priorities for 2026 were the same top four priorities for 2024.
Service Areas Requiring Emphasis from City Leadership
Sidewalk & Street Maintenance*
Homelessness
Economic Development
Housing
Code Enforcement
Parks and Recreation
Litter Control
Animal Services
Street Lighting
Police Services
Planning and Zoning
City Communications
Arts and Culture
Library Services
Residential Trash Collection
Storm Drainage
Recycling
Traffic Signals
Water Utility Services
Fire Services
Wastewater/Sewer Services
Note. Percentage of respondents who selected the area as a top five priority. Items ranked from highest to lowest percentage.


The City of Irving, Texas, is conveniently located in the heart of Central Texas, within the Central Time Zone, and just minutes away from the Dallas/Fort Worth (DFW) International Airport- the country’s fourth busiest airport.
The Innovation and Performance Office is dedicated to improving government efficiency and effectiveness through well thought out, collaborative approaches based on best practices and national standards that promote a higher level of service and enhance overall quality of life.
Email. lhale@cityofirving.org Website. www.cityofirving.org/ Address: 825 W. Irving Blvd. Irving, Texas 75060
Elite Research, LLC is an Irving, Texas based market research, process optimization, evaluation, and statistical consulting firm. They are certified as a WBENC Women Business Enterprise (WBE), a Historically Underutilized Business (HUB), and an SBA Women-Owned Small Business (WOSB)

As a global provider of research and statistical consulting they provide expert support to academic researchers, government entities, nonprofits, researchers in the private sector and corporations in all facets of the research process, including the sampling, design, collection, analysis, reporting, implementation, and optimization of findings. Over thirty consultants and staff provide expertise in research design, programming, analysis, data management, survey development, sampling methodologies, web-based surveys, data collection plans, technical writing, and statistical analysis.
Phone. (972) 538 - 1374
Email. info@eliteresearch.com Website. www.eliteresearch.com
Address. 9901 Valley Ranch Pkwy. E., Ste. 2035, Irving, TX 75063
1. What is your ZIP code?*
75060
75061
75062
75063
75038
75039
75019
Other ____________
2. Are you a.... (check all that apply)
Resident
Work in Irving
Visitor
Business Owner
3. How long have you lived in Irving?*
Less than 1 year
1-5 years
6-10 years
11-20 years
More than 20 years
4. Which best describes where you live?*
Apartment Duplex
Single-family home
Townhome
5. Do you rent or own your home?*
Own (Owner Occupied)
Own (Renter Occupied)
Rent
6. Please rate the following:
Irving as a place to live
Irving as a place to raise children
Irving as a destination to visit
Irving as a place to work
7. Please rate each of the following development characteristics as they relate to Irving as a whole:
Variety of dining or restaurant establishments
Variety of retail or shopping establishments
Variety of employment opportunities
Variety of housing options
Variety of education opportunities (K-12)
Variety of education opportunities (higher education)
8. If rated poor or very poor, please provide an example how the city can improve in this area:
9. How frequently has anyone in your household done one of the following in the past 12 months?
Attended a local public meeting in person
Attended an event at the Irving Convention Center
Visited the Heritage/Downtown district
Visited the Toyota Music Factory
10. If rated poor or very poor, please provide an example how the city can improve in this area:
11. Please rate the following aspects of community services in Irving:
Maintenance and landscaping of city parks
Quality of facilities at city parks (pavilions, playgrounds, picnic tables)
Quality of facilities at city pool/aquatic centers
Quality of walking trails throughout the city
Variety of programs available at recreation centers
Variety of special event opportunities (e.g., Fourth of July, Movies/Music on Main, etc.)
Quality of service provided at the Irving libraries
Quality of facilities at city libraries
Variety of in-person and virtual educational programs offered by the library
Availability and selection of physical and digital library books and materials
Quality of service provided by the Department of Arts and Culture
Variety of Irving Arts Center programs and exhibits
12. If rated poor or very poor, please provide an example how the city can improve in this area:
13. How frequently has anyone in your household done one the following in the past 12 months?
Utilized the Irving trail system
Visited an Irving dog park
Visited an Irving park
Visited an Irving recreation center
Visited an Irving pool/aquatic center
Visited an Irving public library
Visited the Irving Arts Center
Visited an Irving museum
For the following items, please rate the items using the scale below, Daily to Never.
14. How frequently do you utilize each of the following sources to receive information about the City of Irving?
By attending a local public meeting (Council, Committee, or Board) in person
City of Irving website (https://www.irvingtx.gov)
City website listservs (email subscriptions, i.e. Public Meeting Notices, Road Construction Updates, Special Events, etc.)
City of Irving social media (@TheCityofIrving on Instagram, X, Nextdoor, Facebook, and LinkedIn)
City of Irving video content (@TheCityofIrving on YouTube, videos posted on social media and the website)
City of Irving cable channels
City Spectrum (Monthly print newspaper)
“City Spectrum Digital” and “Neighborhood News” (Weekly email newsletters)
“City Briefs” (Utility bill Insert)
Streaming City Council or other public meetings online
15. If not listed above, are there other ways or platforms through which you would prefer to receive information about the City of Irving?
For the following items, please rate the items using the scale below, Excellent to Very Poor.
16. Please rate how well the City of Irving does at the following:
Being open and transparent to the residents
Being responsive to resident questions or concerns
Informing residents about issues and news related to Irving
Providing a variety of news and information topics to residents
Providing residents opportunities to offer feedback
Using multiple tools and formats for residents to receive news and information related to Irving
17. If rated poor or very poor, what aspects of resident engagement would you like to see from the city?
18. Please rate the below aspects of the maintenance and appearance of Irving:
Maintenance and upkeep of residential properties
Maintenance and upkeep of business properties
Maintenance of sidewalks
Removal of litter on residential streets and sidewalks
Removal of litter on major highways (ex: 183, PGBT/161, 114, Loop 12)
19. If rated poor or very poor, please provide an example how the city can improve in this area:
20. Please rate the below aspects of fire services in Irving:
Utilized 911 emergency services in Irving
Seen Irving Police officers patrolling your neighborhood or surrounding residential area
Participated in a Community Event led by either the Irving Fire or Irving Police Department
Visited the Irving Animal Care Campus
21. Please rate the below aspects of fire services in Irving:
Quality of Irving fire services
Quality of Irving ambulance services
Satisfaction with Irving Fire Department response times
22. If rated poor or very poor, please provide an example how the city can improve in this area:
23. Please rate the below aspects of police services in Irving:
Effectiveness of crime prevention strategies
Effectiveness of traffic enforcement strategies
Visibility of police in neighborhoods
Visibility of police in retail areas
Satisfaction with Irving Police Department response times
24. If rated poor or very poor, please provide an example how the city can improve in this area:
For the following items, please rate the items using the scale below, Very safe to Very unsafe.
25. Please rate how safe you feel:
Walking in your neighborhood during the day
Walking in your neighborhood in the evening
Visiting Irving parks during the day
Visiting Irving parks in the evening
From property crimes (e.g., burglary, theft)
From violent crimes (e.g., rape, assault, robbery)
From fire, flood, or other natural disaster
26. If rated unsafe or very unsafe, please describe your rating by selecting any relevant items below to assist the city in improving services:
Speeding or reckless driving
Poor lighting
Loitering
Lack of police presence
Abandoned properties
Park or trail conditions
Other (please describe)
For the following items, please rate the items using the scale below, Excellent to Very Poor.
27. Please rate the below aspects of animal services in Irving:
Quality of stray animal control in your neighborhood (cats, dogs, etc.)
Satisfaction with Animal Services response times to priority calls (aggressive dog, animal bite, etc.)
28. If rated poor or very poor, please provide an example how the city can improve in this area:
29. Please rate the quality of the following aspects of solid waste services:
Brush and bulky waste pickup
Household hazardous waste disposal
Residential trash collection
Residential curbside recycling
Services provided at the landfill
Educational programming related to recycling
29. If rated poor or very poor, please provide an example how the city can improve in this area
30. How frequently has anyone in your household done one of the following in the past 12 months?
Visited the Irving landfill
31. Please rate the following aspects of water utility services in the following areas:
Quality of stormwater drainage
Quality of community engagement and educational programs
to water conservation
Reliability of your water service
31. If rated poor or very poor, please provide an example how the city can improve in this area:
32. Please rate the following aspects of traffic and transportation services in the following areas:
Condition of major streets (not including highways)
Condition of neighborhood and minor street
Condition of traffic signs and roadway striping
Quality of street maintenance (filling of potholes, smoothing bumps, etc.)
Quality of street sweeping
Quality of traffic signal timing
Quality of traffic management during rush hour
Adequacy of placement and number of streetlights
32. If rated poor or very poor, please provide an example how the city can improve in this area:
33. How frequently has anyone in your household done one of the following in the last 12 months?
Utilized DART or TRE public transport in Irving
34. Please rate the following aspects of public transportation services in the following areas:
Ease of travel by public transportation in Irving
Quality of DART rail services in Irving
Quality of DART bus services in Irving
Quality of Trinity Railway Express services in Irving
Quality of DART’s GoLink on-demand service
34. If rated poor or very poor, please provide an example how the city can improve in this area:
35. What could the City of Irving implement that would encourage you to utilize public transportation more often?
36. Please rate the quality of the following items related to YOUR specific neighborhood in Irving. For this survey, your neighborhood represents the 1 mile surrounding your home in any direction:
Exterior appearance of single-family homes
Exterior appearance of multi-family homes (apartments, condominiums, etc.)
Exterior appearance of commercial/retail buildings
Regulation of junk/debris on private property
Regulation of mowing/cutting of weeds/grass on private property
Regulation of parking in yards
Regulation of signs in medians and walkways (e.g., garage/estate sale signs)
37. If rated poor or very poor, please describe how the City can better improve services in these areas:
38. Please rate the quality items:
How would you rate the quality of living in Irving relative to the affordability within the DFW Metroplex
39. Please describe factors or ideas that would impact your rating:
40. Selecting from the items below, please rank the five services areas that need the most emphasis from city leadership over the next two years:
Animal Services
Arts and Culture
Code Enforcement
City Communications
Economic Development
Fire Services
Homelessness
Housing
Library Services
Litter Control
Parks and Recreation
Planning and Zoning
Police Services
Recycling
Residential Trash Collection
Sidewalk Maintenance
Street Lighting
Street Maintenance (potholes, condition of pavement)
Storm Drainage
Traffic Signals
Water Utility Services
Wastewater/Sewer Services
41. Please describe how we can improve the services you identified as your priority areas above:
For the following items, please rate the items using the scale below, Excellent to Very Poor.
42. Overall, how would you rate the quality of services provided by each of the following:
City of Irving
US Government
State of Texas
Dallas County Government
The following questions are included to help ensure that the survey respondents are a representative sample of Irving residents.
43. Are you:
Male
Female
Non-Binary
Prefer to self-describe: ____________________
44. What is your age?
45. How many children age 18 or younger live at your home? _________
46. Which of the following best describes your ethnic background? (Please select all that apply)
American Indian or Alaska Native – For example, Navajo Nation, Blackfeet Tribe, Mayan, Aztec, Nome Eskimo Community
Asian – For example, Chinese, Filipino, Vietnamese, Korean, Japanese, Bangladesh, Bhutan, India, Nepal, Pakistan, Sri Lanka
Black or African – For example, Jamaican, Haitian, Nigerian, Ethiopian, Somalian
Hispanic, Latino or Spanish Origin – For example, Mexican or Mexican American, Puerto Rican, Dominican, Columbian, Honduran, Salvadoran
Middle Eastern or North African – For example, Lebanese, Iranian, Egyptian, Syrian, Moroccan
Native Hawaiian or Other Pacific Islander – For example, Native Hawaiian, Samoan, Chamorro, Tongan, Fijian, Marshallese
White – For example, German, Irish, English, Italian, Polish, French
Some other race, ethnicity, or origin, please specify: ___________________________________________________
47. What is the highest degree or level of school you have completed? +
Some High School
High School or GED
Some College
Bachelor's Degree
Graduate Degree
Trade School
48. If you are currently employed, do you work within the city limits of Irving?
Yes
No
Not Employed
49. Are you interested in a focus group? If you would be willing to participate in a focus group sponsored by the City of Irving to discuss some of the issues addressed in this survey, please provide your contact information.
Name:
Thank you for completing Irving’s 2026 Resident Survey! Your feedback will be used to continuously improve the quality of services we provide to all residents.
Weighted and unweighted frequencies and percentages of demographic characteristics of respondents. N = number of respondents, % = percentage of respondents
* The 17 respondents from ZIP code 75019 are included in ZIP code 75063.
Tables show weighted results (invited sample plus open call). N = number of respondents, % =
of respondents.
website listservs (email subscriptions, i.e. Road Construction Updates, Public Meeting Notices, etc.)
City of Irving social media (@TheCityofIrving on Instagram, X, Nextdoor, Facebook, and LinkedIn)
of Irving video content (@TheCityofIrving on YouTube, videos on social media and the website)
“City Spectrum Digital” and “Neighborhood News” (Weekly email newsletters)
Shown as a percent of positive responses (Excellent/Good, Very Safe/Safe, Use). The 17 respondents from ZIP code 75019 are included in ZIP code 75063. Tables show weighted results (invited sample plus open call) N = number of respondents, % = percentage of respondents.
Quality of stray animal control in your neighborhood (cats, dogs, etc.)
City website listservs (email subscriptions, i.e. Public Meeting Notices, Road Construction Updates, Special Events, etc.)
City of Irving social media (@TheCityofIrving on Instagram, X, Nextdoor, Facebook, and LinkedIn)
City of Irving video content (@TheCityofIrving on YouTube, videos posted on social media and the website)
Spectrum (Monthly print newspaper)
“City Spectrum Digital” and “Neighborhood News” (Weekly email newsletters)
“City Briefs” (Utility bill Insert)
Streaming City Council or other public meetings online
Shown as a percent of positive responses (Excellent/Good, Very Safe/Safe). Tables show weighted results N = number of respondents (invited + open call), % No Opinion = the percent of the number of respondents (N) who selected “No Opinion” on each item.
website listservs (email subscriptions, i.e. Public Meeting Notices, Road Construction Updates, Special Events, etc.)
City of Irving social media (@TheCityofIrving on Instagram, X, Nextdoor, Facebook, and LinkedIn)
City of Irving video content (@TheCityofIrving on YouTube, videos posted on social media and the website)
City of Irving cable channels
Spectrum (Monthly print newspaper)
“City Spectrum Digital” and “Neighborhood News” (Weekly email newsletters)
“City Briefs” (Utility bill Insert)
Streaming City Council or other public meetings online
Select results from six comparable regional cities (Arlington, Dallas, Denton, Mesquite, McKinney, Plano) where similar questions were available. Values shown as a percent of positive responses (Excellent/Good, Very Safe/Safe, Use). COI 2026 are weighted results (invited sample plus open call). Low is the lowest value reported from the six regional comparison cities High is the highest value reported Average is the average percentage of the regional comparison cities that had a reported value.
Results presented in the following tables reflect comparable survey questions from 2018 to 2026. Values are shown as a percent of positive response ratings of Excellent/Good, Very Safe/Safe, and Use 2024 and 2026 are weighted results (invited sample and open call). Longitudinal comparisons should be interpreted with caution, as 2024 and 2026 results include open call sample and are weighted, while prior years utilized only a random sample and did not weight the results to align with population demographics. In the table below, the highest year column is the difference between 2026 and the highest percentage from the prior years (2018 – 2024). Likewise, the lowest year column is the difference between 2026 and the lowest percentage from the prior years (2018 – 2024). Negative values indicate that that the current year (2026) decreased from the highest or lowest year, respectively. Positive values indicate that that the current year (2026) increased from the highest or lowest year, respectively. Zero percent (0%) indicate that 2026 was the highest or lowest year.
(ex: 183, PGBT/161, 114, Loop 12)
To analyze the qualitative results, Elite Research read through each comment and coded the responses into categories according to themes present in the individual’s answer. A single comment could be coded into multiple categories depending on how many themes are present. For example, a respondent might note the need to repair city infrastructure while also noting the need to reduce public disturbances. The following sections presents themes with resident and council priority areas and include samples of direct data for each question. The City’s Innovation and Performance Office can provide thematic analysis for the other areas of the report upon request. It is important to note that each percent represents the percentage of respondents who answered the qualitative question rather than the percentage of total survey respondents.
Total Sample. In Question 6 of the survey, participants were asked to rate specific development characteristics as they relate to Irving on a scale of Excellent to No Opinion. The characteristics were the variety of dining or restaurant establishments, variety of retail or shopping establishments, variety of employment opportunities, variety of housing options, and variety of K-12 and higher education opportunities. Question 7 asked them to provide an example of how the city could improve if the participant rated one of the characteristics as Poor or Very Poor. The most common themes that emerged were the need for more retail and grocery stores (19.9%), the need for more restaurants (14.9%), the need for more parks, recreational, and entertainment spaces (8.5%), and the need to update or renovate Irving Mall (7.0%). Responses also called for an improvement in housing (6.4%) and the need for better school districts (5.8%). Concerns about housing included affordability, especially for families and individuals who are retired, and requests for smaller houses with yard for families, rather than more townhouses with no yards.
Invited Sample and City Open Call. The individuals invited to participate in the survey shared the same major categories as the open call for responses from the city, but the invited sample considered needing a better school district (6.5%) to be a higher priority than improving policing and safety (4.7%) while the open call responses suggested that improving policing and safety (5.9%) should be a higher priority than needing a better school district (5.1%).
ZIP codes. Although the major categories present in the responses across the ZIP codes remained the same, there were a few differences in priority levels. While the responses from the other ZIP codes were more equally distributed across the top categories, responses from 75038 and 75039 prioritized needing a better school district (10.4%) and (12.0%). The responses from 75060 indicated that code enforcement for housing (6.2%) and improving policing and safety (6.0%) were higher priorities for the area than updating Irving Mall (5.7%), improving housing (4.8%), and needing a better school district (4.1%). The responses from 75061 indicated that improving housing (7.2%) was prioritized in the area over updating Irving Mall (6.9%). The responses from 75062 indicated that updating the Irving Mall (9.3%) was a higher priority for the area than adding more parks, recreation, and entertainment spaces (8.8%). The responses from 75063 indicated that improving housing (8.3%) was a higher priority for the area than updating the Irving Mall (4.2%). Responses from 75063 also indicated that there was not a priority for restricting street parking, increasing walkability in the city, improving higher education opportunities, or increasing art or murals in the area. Similarly, 75039 responses did not have any responses for decreasing stray cats or increasing art or murals, 75038 did not have any responses for increasing art or murals, and 75062 did not have any for decreasing stray cats or animals. These priorities came up in all other zip codes.
The following quotes are directly from the data and are representative of what the respondents considered Poor or Very Poor.
▪ To enhance Irving's economic vitality and quality of life, the city should prioritize a more diverse commercial mix by incentivizing premium dining, retail, and entertainment developments over the current saturation of service-oriented businesses like insurance agencies, tire shops, and banks. Key areas for professional improvement include: Economic Revitalization: Focus on attracting "lifestyle" businesses that provide daily value to residents, while repurposing underutilized or repetitive commercial spaces. Public Safety & Social Services: Address the growing homeless population through structured support systems and proactive management to ensure public spaces remain accessible and safe. Aesthetic Standards: Evaluate and streamline "corner monuments" and public art to ensure they contribute to a modern, cohesive city image rather than creating visual clutter. Code Enforcement & Cleanliness: Implement stricter standards for business property maintenance and more rigorous residential housing code enforcement. Improving the upkeep of neighborhoods and commercial corridors is essential to protecting property values and city pride. By elevating these standards, Irving can transition into a cleaner, more functional, and highly desirable urban environment.
▪ The area of housing needs improvement. There needs to be more affordable housing for working class. We also need more single family and duplex homes that are affordable.
▪ There seems to be no emphasis on the resources or establishments that support the resident's quality of life. I find myself going to Coppell, Grapevine or Southlake to shop and dine.
▪ South Irving and Lindy Lane that connects to Loop 12 is mainly comprised of unsavory people that have drug dealers who and neighbors that use wi- fi jamming to overcome security (blink) cameras for obvious reasons. Not the Irving that I grew up in (1960's). Police patrolling has intensified but more needed.
▪ The options for housing are next to none and the pricing is very high.
▪ The Irving mall is an absolute embarrassment. It's run down and the quality of the stores inside the mall is terrible. When we have lovely malls nearby like grapevine mills and galleria it’s hard to justify shopping at Irving mall when it’s honestly a half-abandoned dump that has been neglected. The building has so much potential but it’s empty and carved out. It needs a quality anchor store like a JC penny or kohls to replace the empty sears wing. The building overall needs a heavy renovation and cosmetic work.
▪ The Irving schools are antiquated and below area standards. Very disappointed in how most motivated children are driven to a private school if their parents can afford to exit the public system.
▪ There are a few sections of town with great restaurants, but the options in the rest of the city seem pretty old and run-down. I'm not sure of many retail and shopping options at all. There are a few pockets, but those are also run-down and old. Some parts of Irving are great, and others pretty run down. I still think it's safe, just older and people are moving to the suburbs (Frisco/Prosper). It would be great to revitalize Irving and bring people back or increase the value for everyone. The location is hard to beat.
▪ There is literally NO good shopping places in the Irving are that is near the 183 and MacArthur area. Really not any decent restaurants either in this area. All the restaurants and places to shop seem to be in the Las Colinas area. I think there needs to more to do in THIS area. Area code 75062. The only place to shop is the Irving Mall which is PITIFUL and pretty gross in my opinion, or thrift stores on Belt Line.
Total Sample. In question 14, individuals were asked to rate various aspects of the maintenance and appearance of Irving, including the maintenance and upkeep of residential properties, maintenance and upkeep of business properties, maintenance of sidewalks, removal of litter on residential streets and sidewalks, and removal of litter on major highways. Question 15 asked them to provide an example if they rated a particular area as Poor or Very Poor. Most responses (26.4%) reflected the need to reduce the amount of litter around neighborhoods and highways, noting that they see food waste, abandoned car parts, and other trash when walking or driving. Twenty-one percent (21.5%) of responses asked the city to repair or upgrade city infrastructures, such as roads, sidewalks, buildings, or playgrounds. Almost eight percent (7.8%) of responses called for the city to consistently issue and enforce code violations as they do not feel like their complaints are being properly handled. Almost six percent (5.8%) of responses stated that standards and upkeep for residential homes were needed, including making sure yards were cleaned and maintained (5.6%).
Invited Sample and City Open Call. The individuals invited to participate in the survey shared the same categories as the open call for responses from the city, except for one. The open call responses did not have any comments on improving economic opportunities. However, with the similar categories, almost five percent (4.7%) of open call responses asked that the city address parking problems, including too many cars being in front of houses, while that priority was much lower for those invited with only 2.7%.
ZIP codes. Based on their responses, the top priority for 75060, 75061, and 75062 were the same as the total sample. For the ZIP codes 75063, 75038, and 75039, the top priority was to repair or upgrade infrastructure including roads and sidewalks. Responses in 75063 showed a focus more on improving maintenance standards and frequency (5.3%) over consistently issuing and enforcing code violations (4.2%), cleaning up yards (3.7%), and standards and upkeep for residential homes (2.6%). Responses in 75039 indicated that there was more need for having standards for landlords and rentals/multi-tenant homes (5.4%) than consistently issuing and enforcing code violations (4.1%). In 75038, standards and upkeep of local businesses (7.0%) stood out as a higher priority than consistently issuing and enforcing code violations (5.3%).
The following quotes are directly from the data and are representative of what the respondents considered Poor or Very Poor.
▪ Sidewalks are not maintained and continue to deteriorate. They are broken, uneven, covered in mud, blocked by bushes or trees, and so on. There are many areas where you must go into street because the sidewalk is impassable. Some areas have been completely blocked by stalled construction projects. Many of these conditions have existed without being addressed for many years.
▪ Residents need to keep their properties in a neat and orderly manner and not treat their properties like dumps. There needs to be consistency with city staff on how they enforce code violations - one yard looks decent and gets a citation while another looks like a garbage dump and gets no citations at all. Automobiles need to park accordingly - not against flow of traffic or on sidewalks. The highways are filled with trash and there does not seem to be active programs to have the litter picked up or removed
▪ Why do we have a code enforcement? I see them drive through the neighborhood with trash in yards and unmowed grass but no action.
▪ Trash days leave a lot of litter in residential areas due to trash being put out in bags. A bin system would likely greatly improve the trash issue!
▪ Too many neighborhoods are deteriorating due to lack of general maintenance, landscaping. The HOAs are not requiring compliance. In Lakeside Villas there are many homes with dead and missing landscaping, no grass or dead grass, dead or missing trees, chimneys in disrepair, homes with unapproved trees (palm trees in the front yard), fogged windows. Many sidewalks lay in water after rain or sprinkling, many heaved sidewalk areas, dead plants in medians, trees along streets that need to be trimmed.
▪ This is an area where there is much room for improvement. The sidewalks in our neighborhood are a walking hazard. The are uneven and dangerous. After contacting the City of Irving, I was informed that the only way they would be repaired is if each homeowner would contact the City and only then would they repair the sidewalk and only in front of the residents home, which means to get the entire sidewalk along our street repaired, each resident on the street would have to contact the city. We all know that is not going to happen so the sidewalks remain in disrepair. Many streets in North Irving have the same situation. They are uneven and cracked. Many of the business property are even worse. The Las Colinas area, South of I-635 is at least somewhat kept clean and appears to have some sort of planning and zoning applied to business and retail construction and development. Sad to say the area north of I-635 is a train wreck. Commercial buildings are going up with zero zoning or planning.
Total Sample. Question 28 of the survey asked for individuals to rate aspects of traffic and transportation services, including the condition of major streets (not including highways), condition of neighborhood and minor streets, condition of traffic signs and roadway striping, quality of street maintenance, quality of street sweeping, quality of traffic signal timing and traffic management during rush hour, and adequacy of placement of streetlights. Question 29 asked individuals to provide an example of how the city can improve any area they rated as Poor or Very Poor. The majority (41.2%) of responses called for the city to repair street pavement and potholes. About fifteen percent (15.7%) noted a need to improve traffic light timing because they often experienced inconsistent or delayed traffic light changes. Fourteen (14.1%) suggested adding new and fixing current street lighting and a little less than ten percent (9.2%) stated that the city needed to increase and improve street sweeping procedures, because they feel as though they never see street sweepers nor does it seem like there is any, as they still notice trash along the street. A little over six percent (6.2%) stated the need for increased traffic or speeding management, including around school zones and during rush hour.
Invited Sample and City Open Call. Both the city open call and the invited sample had the same top priorities as the total sample. Even throughout the rest of the categories, there were not drastic differences between the invited sample and open call. For example, for the city open call respondents, repairing and cleaning sidewalks was a slightly higher priority (2.07%) than it was for the invited sample, which was 1.54% of responses.
ZIP codes. Although the top three major categories present in the responses across the ZIP codes remained the same, there were a few differences in priority levels among the other categories. Responses from 75060 indicated that adding a stop sign, roundabout, or traffic light (2.5%) was a higher priority than cleaning up, fixing, or building sidewalks (1.1%). Responses from 75061 showed that they considered reducing the number of cars parking on streets (3.8%) a higher priority than improving street painting and signage (3.1%) and cleaning up, fixing, and building sidewalks (2.3%). Responses from 75063 indicated that they consider improving street painting and signage (7.1%) a higher priority than increasing and improving street sweeping procedures (5.6%). Responses from 75063, 75038, and 75039 considered increasing traffic and speed management (6.6%), (6.6.%), (9.0%) as a higher priority than increasing and improving street sweeping procedures (5.6%), (4.4%), (5.0%).
The following quotes are directly from the data and are representative of what the respondents considered Poor or Very Poor.
▪ There aren't enough streetlights in areas that need them most like in/around parks, or just outside of busy shopping centers. Some residential areas receive excellent lighting while others seem to be ignored entirely.
▪ There are too many roads both major and residential that are not in good condition. They are very bumpy and have potholes.
▪ There are no streetlights in my neighborhood, its very dark at night. Additionally street sweeping happens on my street maybe twice a year and it should be more frequent.
▪ There's very little street improvement in my area. The stripes on beltline are not visible at night. When turning on beltline from a side street at night, it is hard to detect where the medium is.
▪ Traffic signals should be integrated with traffic sensing mechanism to avoid unnecessary wait time during off peak hours
▪ Too many potholes that never get fixed, or when they do, they get fixed cheaply and they reopen within a month or two.
▪ Theres streets that have turn only signals that make traffic more congested. Those same streets could have a turn and straight arrow signaling, instead of turn only. One example is North MacArthur Street as it meets John Carpenter Freeway. The left lane is for turning only but it could be turning and going straight because there’s 3 lanes going straight, after the lights. A lot drivers do it anyway. They just drive straight.
▪ There needs to be a light at Ranch Trail & Valley Ranch Parkway. It is currently a Suicide Stop since many new drivers in the area don't know the proper order/rules of a 4-way stop.
▪ Street sweeping needs to be more frequent and street signal timing is no good on Irving Blvd and Pioneer especially on peak hours. They don't last enough time. 2-3 cars get to pass before it turns yellow then red.
Total Sample. Question 33 of the survey asked respondents to rate the quality of the following items to their specific neighborhood in Irving. Question 34 then asked individuals who rated at least one characteristic as “Poor” or “Very Poor” to describe how the City can better improve services through an open-ended comment. The top two priorities for respondents who provided comments was enforcing parking regulations (22.2%) and having stronger code enforcement (19.5%). Almost thirteen percent (12.7%) would like to see more enforcement of yard maintenance and almost twelve percent (11.7%) said that there needs to be enforcement of trash pick-up and cleanliness. Almost nine percent (8.9%) reported issues with the beautification of residential and commercial properties.
Invited Sample and City Open Call. The invited sample and the city open call had the top five priorities as the total sample. However, the city open call responses demonstrated a higher priority for enforcing trash pickup and cleanliness (12.3%), while both the total sample (12.7%) and the invited sample (14.1%) considered enforcing yard maintenance a higher priority.
ZIP codes. The responses from ZIP codes 75060, 75061 and 75062 had the same top five priorities as the total sample. The responses from 75063 and 75038 had the same top three priorities but in different orders, with 75063
prioritizing the enforcement of yard maintenance (23.5%) over stronger code enforcement (19.8%) and enforcing parking regulations (16.0%), and responses from 75038 prioritizing the enforcement of yard maintenance (21.1%) and stronger code enforcement (21.1%) equally over enforcing parking regulations (7.0%). The responses from 75039 had the top three priorities of beautification of residential and commercial properties (20.0%), enforcing removal of signage on lawns, medians, and walkways (20.0%), and stronger code enforcement (16.0%). The responses from 75039 indicated equal priorities of increasing police presence for safety (12.0%) and the enforcement of yard maintenance (12.0%). The responses from 75063 prioritized the beautification of residential and commercial properties (11.1%) over enforcing trash pick-up and cleanliness (4.9%). The responses from 75038 prioritized fixing bad painting of buildings and repairing run-down buildings (8.8%) over improving responses to complaints and requests (5.3%).
The following quotes are directly from the data and are representative of what the respondents considered Poor or Very Poor.
▪ You should enforce vehicle parking in residential areas (commercial vehicles, abandoned, people doing mechanics on the sidewalk, over 6 cars in one household, etc).
▪ Our neighborhood is going downhill, and one of the reasons is that people are not taking care of their yards. Code does nothing about it. Too many junk cars on property and reporting does not help.
▪ Require annual inspections by city, maintain signage. Tow and impound vehicles that are consistently parked in yards. Look at the wheel tracks in the grass and you can see the effects of daily parking. You do not see yard parking in Carrollton, Farmers Branch, and other cities. Garage sales are limited to three signs yet single businesses along Belt Line will place upwards of 50 signs along the road each weekend. Code needs to expand their hours and work on weekends and possibly rewrite the rules.
▪ No enforcement of how many garage sales anyone is having.
▪ Too many cars parked in the street, hard to drive through the neighborhood.
▪ There are many rental properties around my home and they don't do anything to take care of the property...weeds grow, grass dies, trees have dead limbs hanging from them.
▪ The Code enforcement staff needs to take action more quickly and they need to answer their phones
▪ Several residences with lots of “junk” in the front yard. Old businesses in town look run down. Some apartment complexes looking extremely run down.
▪ Regulations of signs on medians or just pull them off
Total Sample. In Question 57, individuals were asked to rate the quality of living in Irving relative to the affordability within the DFW Metroplex. They were then asked to describe factors or ideas that would impact their rating. Less than 20% of responses (18.9%) stated that the overall affordability and cost of living in Irving is poor. Nine percent (9.0%) of responses stated that the city was in a good location, another almost nine percent (8.7%) shared that they found the area to be good and they liked living there, and about six percent (6.3%) shared that affordability was good. Eight percent (8.1%) of responses indicated that they would like to see an increase in the retail, dining, and entertainment options available to them. Six percent (6%) stated that they would prefer a reduction to their taxes.
Invited Sample and City Open Call. The top categories from the invited sample and the city open call sample responses reflected that of the total sample. The city open call responses demonstrated a greater prioritization of beautification of streets, sidewalks and yards (6.1%) over reducing taxes (5.1%). The invited sample responses indicated a higher prioritization of assessing housing needs (6.1%) over the beautification of streets, sidewalks, and yards (5.1%).
ZIP codes. Responses from 75060, 75061, 75062, 75063, 75038, and 75039 reflected the same top responses about cost of living and affordability being poor as the total sample. Responses from 75060 and 75039 prioritized the need for more retail, dining, and entertainment options (11.9% and 7.1%). Responses from 75062 demonstrated the need for reducing taxes as one of their top priorities (8.2%). The responses from 75063 suggested that beautification of streets, sidewalks, and yards was a higher priority (8.1%), while the responses from 75038 indicated that one of their top priorities was improving safety (8.8%).
The following quotes are directly from the data and are representative of what the respondents felt about the quality of living in Irving relative to the affordability within the DFW Metroplex:
▪ There are parts of Irving that are not as affordable but I think that's most places in the metroplex. Overall, I found a place that was nice and affordable to rent.
▪ Things have gone downhill in the past decade. Demographics have dramatically changed and too many people who have just arrived here have no pride for our neighborhoods. I usually end up cleaning up the trash that they throw in their yard as it eventually blows into my yard. It's sad that so many people don't care, because Irving is a great central location in DFW and affordable, but too many people don't take any pride in their neighborhood.
▪ While it is more expensive to live in our neighborhood, there are amenities and services in the community that make up for it.
▪ Too expensive (overpriced) for the quality of home and neighborhood conditions Irving is providing for South Irving.
▪ Water bill has gotten way too expensive for the job that is being done. City taxes are higher than what they are being used for.
▪ We have so few options for shopping and dining, Cost of living is high and resources are few. I see no inclination to attract businesses and services from leadership.
▪ With Irving being centralized, it's easy access to just about anywhere in the metroplex which is great. My area still feels more like a small town to me, which I really like.
▪ Yeah, we definitely DON'T get what we pay for with our taxes. Not in the slightest. I could've lived in a nicer city with nicer amenities for less but wanted to be here for work and it doesn't feel worth it.
▪ The quality of life in Irving is at best sustainable. Have seen the city over the past 45 years go through changes that seem to reflect the interests of special groups but not the overall population. The attempts to upgrade buildings and facilities have fallen short and don't seem to take in the real needs of the city.
▪ The prices for housing in Irving is higher than what someone would like pay to live in with the quality of the city they are surrounded by. One of the only redeeming qualities of living in Irving is the close locations to other cities.
▪ The walkability to retail and nature trails in my neighborhood is excellent in comparison to the price versus walkability in other parts of Irving and DFW.
Respondents were asked to select from the items below and rank the five services areas that need the most emphasis from city leadership over the next two years Sidewalk and street maintenance were combined for presentation due to their similar context. The top service priorities were selected by at least 15% of the respondents and included street/sidewalk maintenance, homelessness, economic development, housing, code enforcement, parks and recreation, litter control, and animal services.
Service Areas Requiring Emphasis from City Leadership
Total Sample. In Question 35, individuals were asked to select five service areas that need the most emphasis from city leadership over the next two years. The options included various services such as animal services, city communication, library services, recycling, and water utility services. Question 36 asked for suggestions on how the five areas they selected could be improved. Most responses (16.9%) suggested the need to improve and repair city infrastructure, such as sidewalks, streets, and buildings. Twelve percent (12.1%) suggested that the city needs to increase the number of social services and community resources provided, such as domestic violence and homeless shelters. Nearly eight percent (7.9%) of responses suggested the need for the city to support economic development efforts, such as helping local businesses stay afloat. A little over seven percent (7.6%) of responses requested improving garbage and recycling processes, including using trash bin to keep trash off of streets. For a little over six percent of responses (6.3%), consistently enforcing inspections and code violations was a suggestion on how to improve the priority areas.
Invited Sample and City Open Call. The City Open Call and the Invited Sample responses matched the top categories present in the total sample, and had little to no differences throughout the remaining categories.
ZIP codes. Responses from 75060, 75061, 75062, 75063, and 75038 reflected the same top two priorities as the total sample. Responses from 75039 prioritized improving and repairing city infrastructure (23.4%) and improving garbage and recycling processes (9.4%) as the top two priorities for the area. Responses from 75060 prioritized the need for consistently enforcing inspections and code violations (8.6%) over improving garbage and recycling processes (7.1%). Responses from 75061 demonstrated the need for supporting economic development efforts (6.3%). The responses from 75063 suggested that they prioritized increasing affordable housing and housing upkeep (7.2%) alongside improvements to law enforcement and safety measures (7.5%) over supporting economic development efforts (6.6%) and improving garbage and recycling processes (6.9%) unlike the other zip codes.
The following quotes are directly from the data and are representative of what the respondents felt would encourage use of public transportation.
▪ These five areas are deeply interconnected neglecting any one accelerates decline in the others. Code enforcement must become proactive and consistent, not complaint-driven; properties and businesses need regular inspection with real consequences for violations. Litter control requires both increased street sweeping frequency and enforcement against businesses that allow debris and abandoned shopping carts on their premises. Police services must expand visible neighborhood and retail patrols, with dedicated traffic enforcement near schools during arrival and dismissal hours. Sidewalks need systematic inspection and repair cracked, uneven, and eroding walkways are safety hazards for pedestrians, wheelchair users, and strollers, not cosmetic issues. Street maintenance must go beyond patching potholes to addressing root causes like poor drainage, soil erosion, and road settling that allow water and debris to accumulate long after they should have cleared. Valley Ranch was built to a high standard these investments protect that.
▪ Police presence in high traffic areas to control speeding, street racing, visible signs to warn of upcoming construction. Code enforcement needs to report deteriorating residential streets and better zoning with apartments that invites crime. Hear more and more about theft property crime at apartments even in upscale apartments in Las Colinas. Again City Manager needs to come down hard if Apartment owners or Managers are not ensuring safety of their residences. Also more vetting of people who rent houses, ensuring they are single family.
▪ Would like to see more affordable townhomes built, as well as condo options. Fix the streets promptly and correctly, not just patch-up work that sits for too long and is not a sufficient long-term fix. More frequent cultural/arts options representing the full diversity of Irving. A little more diverse adult night life options: lounges, comedy clubs. Irving does a good job providing a variety of activities for adults/children throughout the year, and over the years I've seen the frequency of events increasing, which is great. I’d just like to see a little more frequency with the cultural diversity represented in the events.
▪ Water utilities pricing is unpredictable. May be related to meter readings. Pricing swings dramatically between months.
▪ Unoccupied houses are not held up to code enforcement. Sidewalk maintenance is lacking South Irving as a whole.
▪ To improve housing and people moving into the city we need to improve the lack of entertainment and businesses in the city, the standard of education and of the educational buildings, crime rates to make the city safer and to improve drainage so the streets in front of the houses aren't constantly flooding.
▪ The homeless situation in Irving must be addressed. No real solutions have been brought forward despite citizen concern and input. Use eco development funds to drawn retail and better dining options. High end steak houses, trendy dining establishments, less diversity-based restaurants.
▪ Provide more reasonable multi and single-family housing options. Patch roads by actually fixing the underlying substrate instead of just placing asphalt in the potholes. Level out roads again. The roads should not be half underwater the second it starts to rain and neither should businesses sprinklers be on in the winter. The south side of the city commercial properties can look run down. Incentive these properties to remodel and make them look better.