
The Community Climate Action Plan was adopted September of 2021. EnvisionCR serves as the City’s comprehensive plan, providing long-range guidance for policy decisions, investment priorities, and coordinated planning efforts across departments. The annual review of EnvisionCR is an important opportunity to evaluate the City’s progress in implementing the Plan and to ensure that its recommendations remain aligned with evolving community needs, City Council Priorities, and citywide goals.
This review is intentionally timed to support the development of departmental budgets and work plans for the upcoming year. Through the coordinated evaluation of Initiatives and Action Steps, City staff are able to better understand how their efforts connect to the vision and strategies outlined in EnvisionCR. This collaborative process strengthens interdepartmental relationships, improves communication, and contributes to more efficient and cohesive planning an project development.
Within the 6th Street SW Corridor Action Plan 11 Action Steps were reviewed. This year of those, two were started, two were completed, six were on-schedule and one was moved to ongoing. The following page has a table with the updated Action Steps. Scroll through pages 8-9 to see a full list of all the plan's original Action Steps.
Carbon-Free Goal 1.A. Reduce carbon emissions 45% by 2030 and net-zero by 2050
1.
Build a sustainable neighborhood program to advance sustainability achievements in each neighborhood and provide an exciting community-building opportunity for Neighborhood Associations
2.
3.
Create a fund to implement a Green & Healthy Homes and Small Businesses program to support deep energy and water efficiency retrofits, hazard remediation, renewable energy, and vehicle and large appliance electrification, prioritizing vulnerable neighborhoods.
Build a Sustainable Business program that enhances sustainable building practices (energy efficiency, clean energy, electrification, water, waste reduction) and sustainable land use practices (trees, green infrastructure, gardens, biking facilities).
City Manager’s Office (Sustainability) + Community Development Ongoing
Community Development, City Manager's Office, Building Services Ongoing
City Manager's Office, Community Development Ongoing
The Green Homes Program provides a way for Cedar Rapids residents to engage in the CCAP by sharing their sustainable actions, committing to do more, and receiving ongoing educational materials. This program is monitored on an annual basis to ensure it's meeting it's intended goals.
The Neighborhood Finance Corporation Energy Efficiency Program is active. This program is monitored on an annual basis to ensure it's meeting it's intended goals.
Standard City tax incentives include up to 10 year 100% tax exemption or reimbursement based on demonstrated increased cost. This program is monitored on an annual basis to ensure it's meeting it's intended goals.
4. Support residential energy disclosure for prospective homeowners and renters and commercial energy benchmarking to encourage energy awareness and conservation. 2-3 years Building Services, City Manager's Office On-Schedule No updates at this time.
5. Develop a sustainable building policy for new construction and major renovations. 2-3 years Building Services, City Manager's Office On-Schedule No updates at this time.
6. Update land development regulations to expand missing middle housing and neighborhood scale commercial opportunities through the City.
7.
Create a sustainable development policy that defines the characteristics of a 15-minute neighborhood and develops guidance and incentives to fill in missing amenities and features, prioritizing vulnerable neighborhoods. 2-3 years
8. Enhance transit and shared transportation options (micro-mobility and car-sharing) in underresourced communities and high priority transit locations. 2-3 years
9. Enhance the Complete Streets Policy to further community education and prioritize urban heat island mitigation and tree plantings in vulnerable neighborhoods.
Community Development, Development Services Ongoing No updates at this time.
Community Development, City Manager's Office, Development Services, Public Works, Parks & Recreation
Transit, Community Development, Public Works
Started No updates at this time.
Started The City is beginning to replace it's diesel fueled busses with hybrid ones.
Public Works, Community Development, Parks & Recreation Ongoing
Heat mitigation is being integrated into City operations. Examples include bus shelter locations and shade structures.
Carbon-Free Goal 1B. INCREASE RENEWABLES TO 70-100% ELECTRICITY
1. Support large-scale solar installations in underutilized areas (parking lots and rooftops) and urban reserve areas that offer multiple benefits.
Carbon-Free Goal 1.C Increase transtport sector's share of low-emission energy to 35-65%
1. Develop readiness in the community for electric vehicle infrastructure and emerging low-emitting technologies.
Carbon-Free Goal 1D. Eliminate coal, reduce carbon in industry 65-90% and sequester remaining carbon
1. Collaborate with industry around emission reductions (carbon capture, renewable energy) and community sustainability efforts (stormwater BMPs, garden and tree plantings, philanthropy, volunteerism). 2-3 years
Development Services, Community Development, Utilities Ongoing
City of Cedar Rapids became an anchor tenant in Alliant Energy’s Community Solar Garden, which allocates 900, 250-watt solar blocks over 20 years. In turn, the City receives a credit on its energy bill exceeding the amount of the investment.
• A team of City staff are evaluating solar potential on city buildings and land.
• The City has solar installations on NW Transit, three (3) water booster stations, and Ellis Clubhouse.
• Local electric grid will have 50% reduced emissions by 2030.
• The City is gold-rated SolSmart community for solar-friendly policies, programs, and utilities.
City Manager’s Office, Community Development, Finance, Public Works Ongoing The City committed to pursuing a smart charging designation through the DOE.
City Manager’s Office, Utilities, Public Works, Community Development Ongoing
Resilient and Accessible Goal 2.A. Build resilience to flooding and climiate hazards with priority for vulnerable residents
1. Develop indoor and outdoor Resilience Hubs to provide basic amenities to residents in public spaces (info kiosks, wi-fi, charging, shelter, back-up power, water, food). 2-3 years
2. Support and expand existing resilience programs to mitigate flooding and prepare residents for future climate extremes. Within 1 year
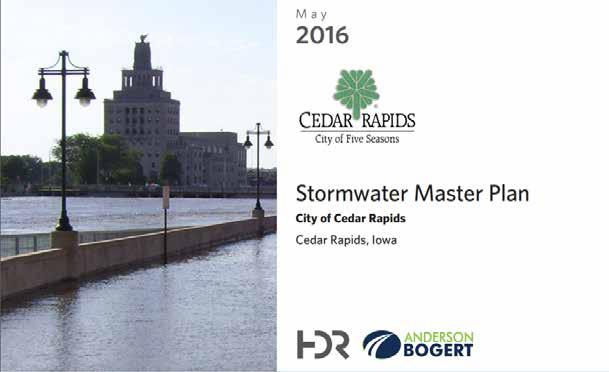
3. Support the stormwater master plan with particular focus on regional detention basins and major funding gaps for hard infrastructure maintenance. Within 1 year
The City has a stormwater costshare program for commercial organizations. Ongoing volunteer opportunites are held every year.
City Manager’s Office, Parks & Recreation, Community Development On-Schedule The City worked with Linn County to update the Hazard Mitigation Plan which includes Resiliency Hub information.
City Manager’s Office, Development Services, Community Development Started
The City actively works with the Indian Creek Watershed Management Authority (ICWMA), the Middle Cedar Watershed Management Authority (MCWMA), and the Lower Cedar Watershed Management Authority to reduce runoff and mitigate flooding impacts.
Public Works, City Manager’s Office, Development Services, Community Development Started Stormwater Master Plan was updated in 2024. The City is currently identifying funding sources for implementation.
Carbon-Free Goal 2B: Ensure all residents have accessible options for growing and consuming healthy, culturally relevant food
1. Develop a food access policy as part of a sustainable development approach to ensure vulnerable residents can achieve healthy and relevant food (land access, growing, consuming, selling) within a 15-minute walk (including urban farms, gardens on commercial properties, public gardens, pantries, groceries, education).
Parks & Recreation, City Manager’s Office, Community Development Ongoing
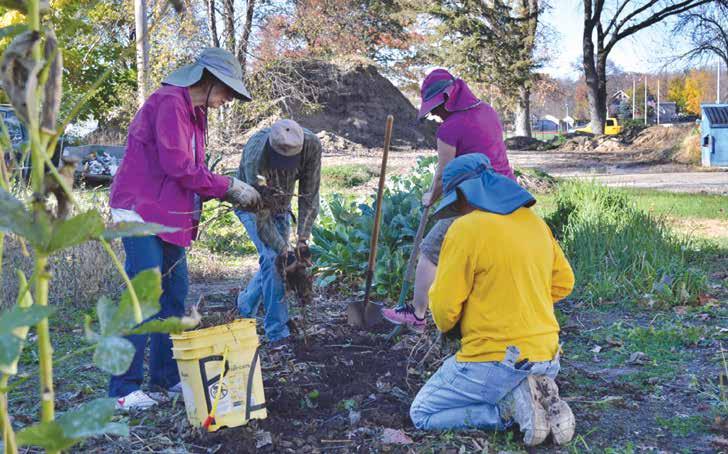
The Community Gardens in Parks Plan has continued to be built out each year. There are five parks with gardens, Ellis, Gardener, Tuma, Sinclair and Lincolnway. The City has 418 garden plots as of 2025.
Schedule Lead Status Comments
Resilient and Accessible Goal 2.C. Ensure equitable access to parks and natural space
1. Support conversion of underutilized hard infrastructure (parking lots, roofs, underpasses) to support gardens, cooling features, and active programming (Resilience Hubs, markets, recreation). 2-3 years
2. Implement the city’s ReLeaf program, supporting vulnerable neighborhoods with air and heat pollution challenges.
Resilient and Accessible Goal 2.D. Increase equitable access to clean air and water
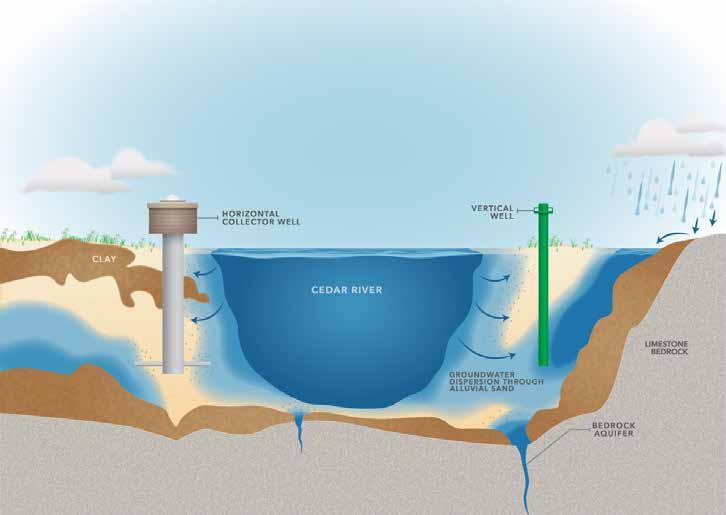
1. Protect water quality by supporting source water protection initiatives and existing watershed partnerships that reduce nutrient-rich runoff into the Cedar River.
Community Development, Public Works, Parks & Recration On-Schedule No updates at this time.
Parks & Recreation Ongoing
As of fall of 2025, the ReLeaf program has planted 18,388 trees across the City, which is almost half of the total goal.
Utilities, Public Works Ongoing
2. Support stormwater BMP cost-share and ERU reduction programs on large properties.
Public Works, Development Services, Utilities Ongoing
The City actively participates in the Middle Iowa, Indian Creek, Middle Cedar, and Lower Cedar Watershed Management Authorities. In collaboration with these organizations, the City promotes the use of infiltration practices to reduce runoff in urban and agricultural areas.
The City continues to operate two cost-share programs for stormwater Best Management Practices (BMP’s). The residential program provides 50% assistance up to $2,000 for projects such as soil quality restorations or rain gardens. The commercial program is also 50% but does not have a cap and typically funds bioswales, permeable pavers, etc.
Resilient and Accessible Goal 2.E : Create high wage jobs and green economic development
1. Complete and implement a green economic development plan, identifying green jobs, community strengths, and programs for equitable business and workforce development. 2-3 years City Manager’s Office On-Schedule
2. Expand sustainability support and expectations in purchasing, contracts, and development to support circular economy, local buying, and cooperative buying. 2-3 years
Resilient and Accessible Goal 2.F : Provide direct connection to city government for vulnerable residents
1. Protect water quality by supporting source water protection initiatives and existing watershed partnerships that reduce nutrient-rich runoff into the Cedar River.
City Manager’s Office, Finance, Public Works, Utilities On-Schedule
The City is working to update and expand how green buildings may qualify for economic development incentives. Our Economic Development team has also boosted its ability to attract green-sector businesses. With verified site searches, we can now connect with companies looking to invest in, and bring environmentally motivated industries to the Midwest.
The Sustainable Purchasing Guidelines updated in spring 2022 provide guidance for City purchases that help support a range of practices. This program is monitored on an annual basis to ensure it's meeting it's intended goals.
The City recently completed a Phase 2 Source Water Protection Plan (SWPP), which outlines the City's approach to safeguarding our water. The city is also working with 11 partners including regional farmers for the Cedar River Source Water Partnership (CRSWP). The goal of (CRSWP) is to work with farmers to protect Cedar Rapids' drinking water and support water quality improvements along the Cedar River. Complete 2023.
2. Operationalize the equitable engagement toolkit to reach more under-resourced and under-represented residents. Within 1 year T Community Development, City Manager’s Office, Public Works
3. Establish City-student partnerships to engage youth in plan implementation. 2-3 years
City Manager’s Office, Finance, Public Works, Utilities On-Schedule
No updates at this time.
City staff continues to host multiple job shadowing and tours for students interested in careers in sustainability City Staff collaborate with teachers in the Cedar Rapids Community School District to provide students sustainabilityrelated project opportunities CRCSD middle school students participate in the Rain Art projects.

Jeff Pomeranz, City Manager
Casey Drew, Director of Finance and Administrative Services
Sandi Fowler, Deputy City Manager
Angie Charipar, Assistant City Manager
Kevin Ciabatti, Building Services Director
Teresa Feldmann, Human Resources Director
Roy Hesemann, Utilities Director
Scott Hock, Parks & Recreation Director
Wayne Jerman, Police Chief
Jennifer Pratt, Community Development Director
Gregory Smith, Fire Chief
Sandi Fowler, Deputy City Manager
Eric Holthaus, Sustainability Coordinator
Adam Lindenlaub, Planner IV
Andy Olesen, Assistant Fire Chief
Mary Beth Stevenson, Watersheds Coordinator
Cara Matteson, Stormwater Program Manager
Phillip Platz, Utilities Communications Specialist
Dara Schmidt, Director, Cedar Rapids Public Library
John Witt, Traffic Engineering Program Manager
Laura Barr
Kelzye Bedwell
Mugisha Bwenge
Megan Crawford
Rachel Maker
Ana McClain
Carter Oswood
Dennis Rigby
Jason Snell
Kristine Sorensen
Mark Weldon
Jean Wiedenheft
John Zakrasek
Large Industry
Medium & Large Businesses
Small Businesses & Neighborhoods
Nonprofits & Schools
Governmental Partners
Thank you to the countless individuals and organizations not named here but who dedicated time and effort toward creating this Community Climate Action Plan. Your efforts are appreciated!
Cedar Rapids’ City Council recognizes the urgency to address climate change and the important progress our community has made to ready us for ambitious action. This community plan demonstrates the vision and commitments for Cedar Rapids to keep leading the way for our city and for the greater good.
Brad Hart, Mayor
Patrick Loeffler, At Large
Tyler Olson, At Large
Ann Poe, At Large
Martin Hoeger, District 1
Scott Overland, District 2
Dale Todd, District 3
Scott Olson, District 4
Ashley Vanorny, District 5
APPROVED BY CITY COUNCIL ON SEPTEMBER 28, 2021.
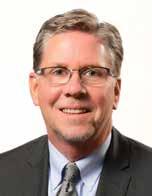
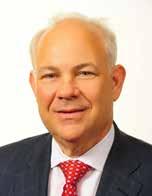
iN FEBRUARY 2020, the Cedar Rapids City Council passed a resolution calling on our community to take urgent action on climate change. Following 18 months of extensive planning and public engagement, we are pleased to introduce Cedar Rapids’ Community Climate Action Plan. This plan includes actionable steps to make meaningful change today and for the betterment of future generations.
Our community has become remarkably familiar with the consequences of an intensifying climate. From record flooding in 2008 and 2016, to the 2020 derecho, Cedar Rapids has endured a disproportionate share of extraordinary climate events. These have come at significant cost and with many opportunities to learn, adapt and improve.
Climate change is bringing heavier rainfalls, hotter days and more flooding across Iowa — and extreme weather to every corner of our world. Cedar Rapids is no exception. Our Community Climate Action Plan brings focus to these changing realities.
This plan also builds upon our community’s strengths. The Cedar Rapids community has become familiar with the concepts of adapting to and mitigating climate change.
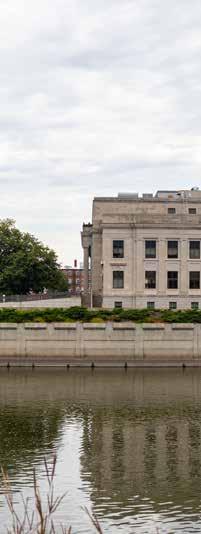
To protect from anticipated floodwaters, we are building the Cedar River Flood Control System. This is the most extensive public infrastructure investment Cedar Rapids has ever made. Following the devastating loss of more than half a million trees from our canopy last year, we are responding with an equally extensive replanting effort.
Cedar Rapids has one of the largest industrial bases in the state of Iowa and is one of the largest corn-processing communities in the world. Our industries understand how greenhouse gas emissions contribute to climate change. Most are already working to reduce their own contributions. Many businesses and residents across Cedar Rapids are doing the same. Our schools have sustainability plans and dedicated employees who work tirelessly to bring excellent and meaningful sustainability education to their students. Non-profit organizations and neighborhood associations bring great talent and passion to the many areas addressed in this plan.
These groups worked together to develop the actions in this plan with a strong emphasis on equity. Residents in Cedar Rapids all belong to the same community and deserve the same opportunities, yet many residents may not have access to the resources they need to thrive. Extensive efforts were made to ensure voices from all of our community members are heard in this plan. You will find these voices reflected in each of the plan’s objectives.
Our Community Climate Action Plan charts a future rich in community, passion and dedication to the greater good. We are proud of this plan and look forward to working alongside everyone willing to help our community achieve the important goals set out in the plan. This city’s strengths and momentum, evidenced throughout the development of the plan, give us confidence we can and will move the plan forward.
Sincerely,
Brad Hart Mayor
Jeff Pomeranz City Manager
Sustainability efforts are not new for the City of Cedar Rapids. The Community Climate Action Plan builds off the momentum and successes of the City’s longstanding commitment to leadership and innovation.
EnvisionCR
City’s comprehensive plan builds on iGreenCR momentum and identifies need to create an action plan.
State of Affairs
City Staff review sustainability issues, work of peer cities, and current city practices. Recommendation made to form a highlevel committee to create iGreenCR Action Plan.
iGreenCR Initiative
iGreenCR promotes green action at work and home.
Staff Survey
90% City staff agree “Sustainability is important to me” in survey. Energy, water, and waste are top three staff areas of interest.
Sustainability
Sustainable City Talks
Three-part educational series held to educate staff and public on sustainability science and leadership.
Integration Committee
City director-level committee forms to guide sustainability assessment and iGreenCR Action Plan creation.
iGreenCR Action Plan Development
iGreenCR Action Plan is the City’s first municipal sustainability plan, an ambitious guiding document pursuing environmental, social, and economic health. Teams work to integrate sustainability priorities across City operations. Sustainability Integration Committee evolves to Innovation Executive Council.
Community Climate Action Plan
More than 1,600 residents surveyed
Advisory Committee guided plan
24 actions included in final plan
STAR Communities
Comprehensive sustainability assessment; Cedar Rapids earns Certified 4-STAR Community designation. (Review a report overview in the Appendix.) The STAR report forms a baseline from which to build Cedar Rapids’ first municipal sustainability plan, the iGreenCR Action Plan. STAR Communities has since transformed to LEED for Cities.
iGreenCR Action Plan Implementation
First iGreenCR Action Plan covers FY20, FY21 & FY22
Progress reports are provided following each fiscal year
Plan is renewed every three years
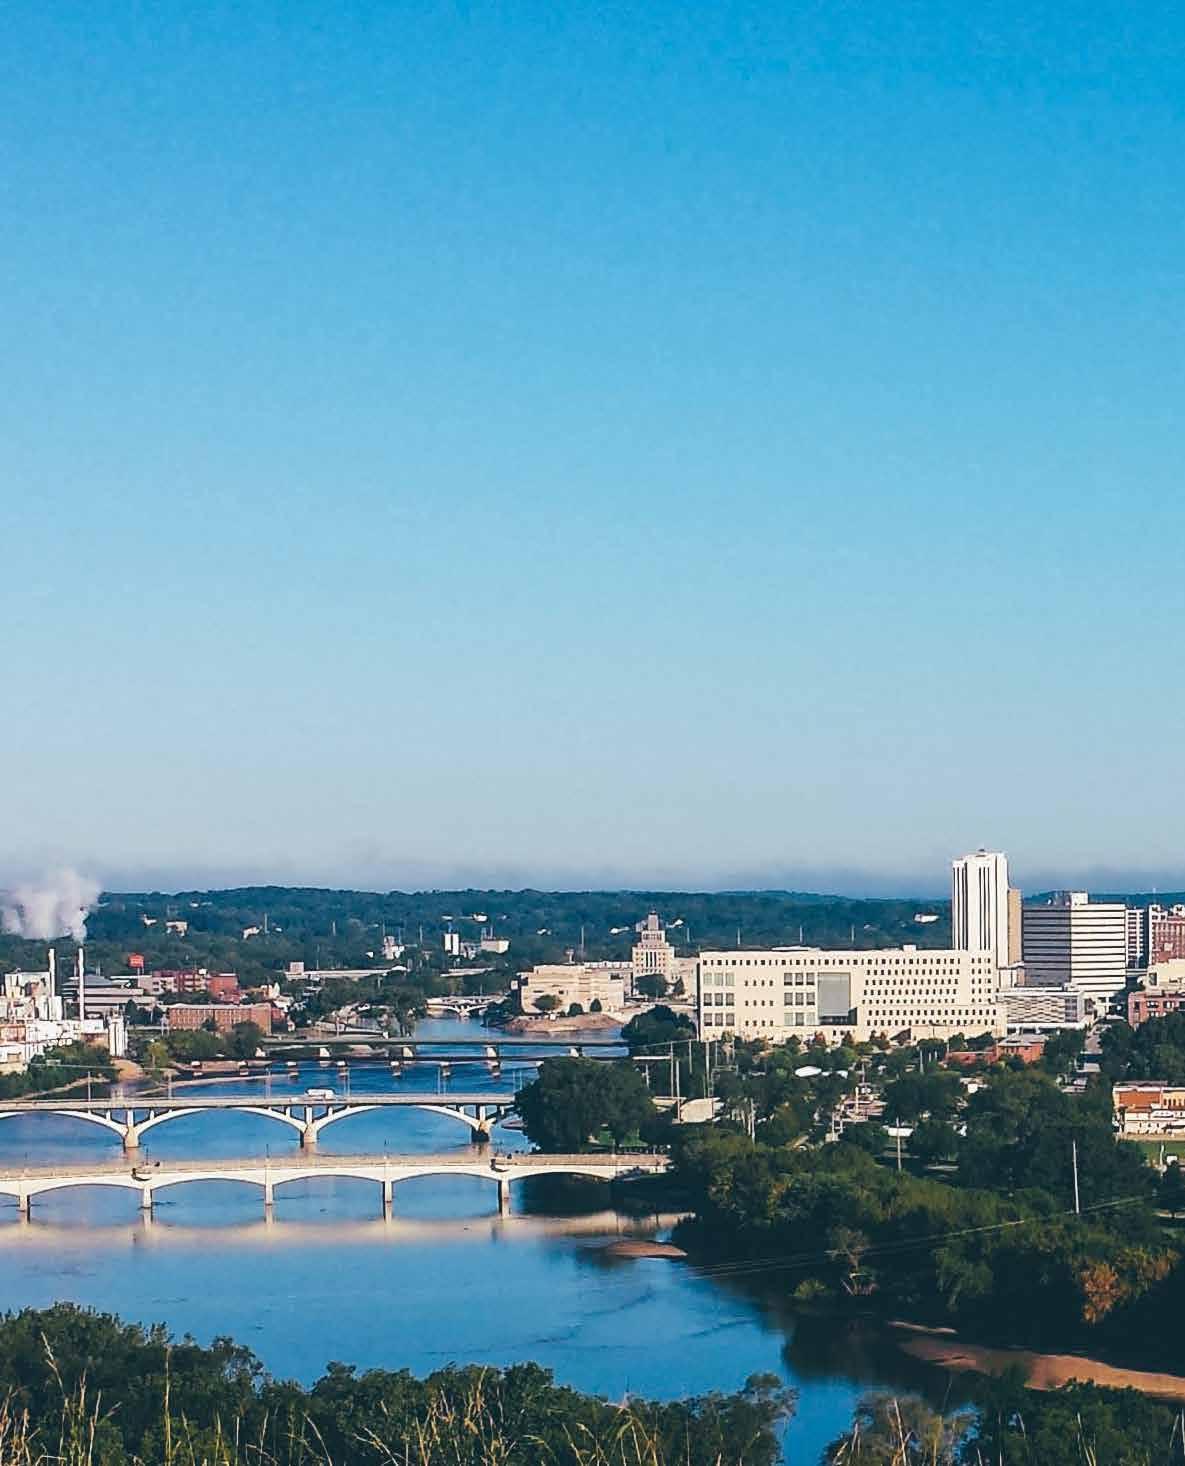
In February 2020, Cedar Rapids City Council declared an urgency for our community to take climate action. City Council’s Climate Resolution called for the creation of a Climate Action Plan. According to the resolution, the plan should aim to prevent global climate change from surpassing 1.5 degrees Celsius and support our community’s most vulnerable residents in this journey.
• REDUCE CARBON EM i SS i ONS FROM 45% BY 2030 AND 100% BY 2050,
• TRANS i T i ON TO 70-100% CLEAN AND RENEWABLE ENERGY BY 2050,
• ACH i EVE 35-65% LOW-TO-NO EM i SS i ON TRANSPORTAT i ON BY 2050,
• EL i M i NATE COAL AND REDUCE CARBON i N i NDUSTRY BY 65-90%,
• SUPPORT CARBON CAPTURE, AND
• REDUCE METHANE AND BLACK CARBON (FROM D i ESEL AND COAL) 35% BY 2050
• BU i LD RES i L i ENCE TO FLOOD i NG AND CL i MATE HAZARDS — W i TH A PR i OR i TY FOR VULNERABLE RES i DENTS, AND
• GUARANTEE ACCESS (PR i OR i T i Z i NG VULNERABLE RES i DENTS) TO CLEAN WATER AND A i R; HEALTHY FOOD; GOOD PARKS AND NATURE; GOODPAY i NG GREEN JOBS; AND D i RECT CONNECT i ONS TO C i TY GOVERNMENT
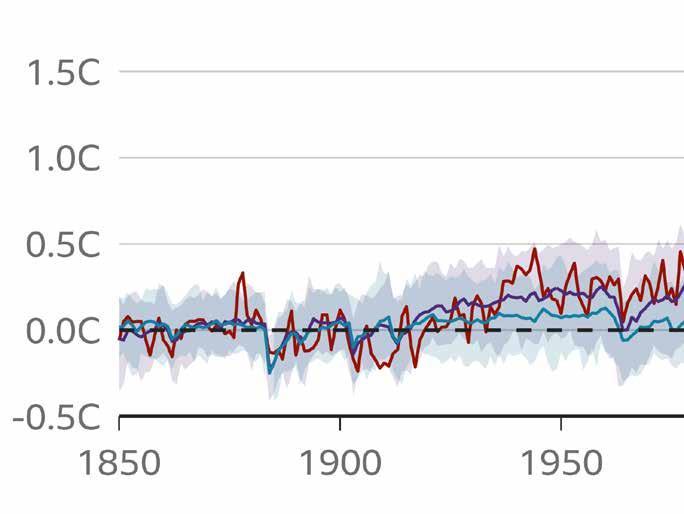
Figure 1 : Change in Average Global Temperature from 1850 to 2020. Note: Shaded areas show possible range for stimulated scenarios
Source: The Intergovernmental Panel of Climate Change, 2020.
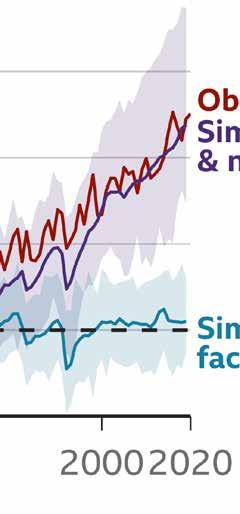
Observed
Simulated human &natural factors
Simulated natural factors only
Human life on Earth has progressed within a relatively stable climate. Half of the warmth on Earth is caused by the sun’s rays hitting our planet. The other half of the warmth is caused by the atmosphere that acts like a blanket surrounding Earth. When sunshine hits the Earth’s surface, it bounces off and, rather than going back into space, some is trapped in greenhouse gases that make up the atmosphere. Without this atmosphere composition, Earth would be more like Mars, cold and uninhabitable.
Since the industrial revolution, society has powered civilization from energy trapped in the Earth’s crust. Coal, natural gas and petroleum, are mined and extracted to be used as energy inputs in factories, power plants, and vehicles. The burning of these fuels results in the emission of greenhouse gases (carbon dioxide, methane, and nitrous oxide) into our atmosphere. Proven by Irish physicist John Tyndall in 1859, these gases can trap heat. If enough are put into the atmosphere, the Earth will warm.
For the past 150 years, a growing amount of greenhouse gases have been emitted into the atmosphere. As decades have passed, scientists around the world have gained greater understanding of human and natural drivers (volcanic eruptions, variable solar radiation) of the climate. In response to a rapidly warming climate due to human influences, the International Panel on Climate Change was formed in 1988 to provide regular research and reports on the state of climate change.
Climate change is causing more frequent and overlapping weather extremes, challenging the resilience of communities at global and local scales. Significant action is needed to build resilience to extreme weather and to reduce the greenhouse gases that are supercharging the climate and causing extreme weather.
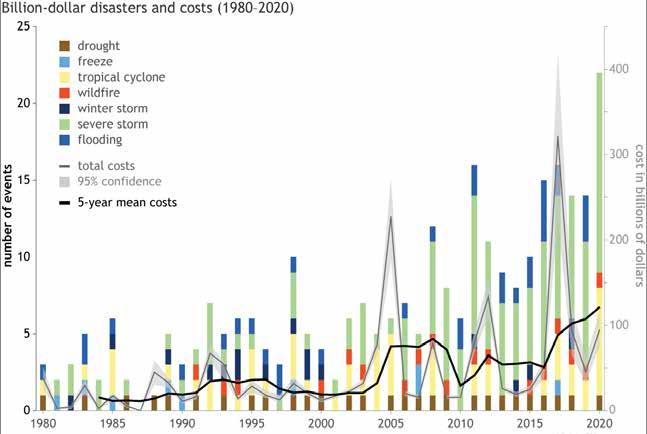
Figure 2 National Oceanic and Atmospheric Administration’s estimates of billion-dollar disasters and associated costs from 1980 to 2020
Source: Adam B. Smith, 2020 U.S. billion-dollar weather and climate disasters in historical context, utilizing NOAA data
From Climate.gov : “The number and cost of weather and climate disasters are increasing in the United States due to a combination of increased exposure (i.e., more assets at risk), vulnerability (i.e., how much damage a hazard of given intensity—wind speed, or flood depth, for example—causes at a location), and the fact that climate change is increasing the frequency of some types of extremes that lead to billion-dollar disasters (NCA 2018, Chapter 2).” Costs of all disasters in this graph are adjusted to the December 2020 Adjusted Cost Index.
Source: City of Cedar Rapids Finance Department
Source: Adam B. Smith, 2020 U.S. billion-dollar weather and climate disasters in historical context, utilizing NOAA data
Figure 3
Climate extremes are increasing in Cedar Rapids. HEAT: 90+ degrees days in a calendar year will triple.
HEAVY RA i N: Downpours have increased 42% since 1958. In 2014, flash flooding in Cedar Rapids cost the community $1.5 million as 3.5–5.5 inches of rain fell in less than 6 hours and peaked at 8 inches in one hour in some locations (a 500-year, one-hour rainfall event).
FLOOD i NG: The Cedar River is rising 1” per decade. The 2008 flood cost Cedar Rapids $1.1 billion, cresting at 31.1 feet, well beyond the 26.5 foot, 500-year flood level. The 2016 flood cost $8.5 million and crested at 22 feet.
EXTREME WEATHER: The 2020 derecho was an extreme weather event, costing Cedar Rapids (estimated) $60–80 million. i
OBSERVED CHANGE i N TOTAL
ANNU AL PREC i P i TAT i ON FALL i NG i N THE HEAV i EST 1% OF EVENTS 1958 - 2016
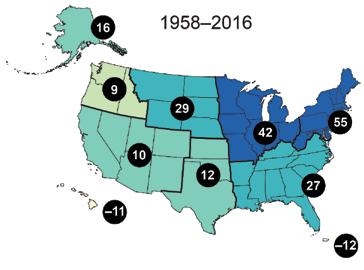
Figure 4
Source: Fourth National Climate Assessment, 2018
Figure 5: Change in 90+ degree days in Iowa by 2050
Source: 4th U.S. National Climate Assessment, Volume II (2018)
We refer to reputable scientific organizations and studies to understand climate change:
• S TATE: “An Uncertain Future: The outlook for Iowa communities and flooding as our climate changes.”
• NAT i ONAL: 4th National Climate Assessment
• i NTERNAT i ONAL: The Intergovernmental Panel on Climate Change. The latest working group report, released in August 2021, describes the “widespread, rapid, and intensifying” nature of climate change that is pushing society toward—and soon beyond—1.5 degrees Celsius warming.
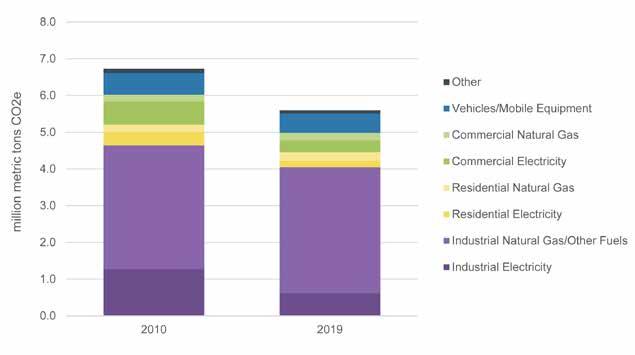
Figure 6: Community-wide greenhouse gas emissions in Cedar Rapids (2010 and 2019).
Data Sources: Alliant Energy, Cedar Rapids/Linn County Solid Waste Agency, City of Cedar Rapids, EPA FLIGHT, EPA National Emissions Inventory, ICLEI, Iowa Department of Transportation, MidAmerican Energy
Cedar Rapids has conducted greenhouse gas (GHG) emissions inventories tracking the GHGs associated with the community. More information and methodologies can be found in the Existing Conditions Report on the City’s Climate Action Page
Cedar Rapids’ GHG inventories account for:
• Commercial buildings: Natural gas from MidAmerican and electricity from Alliant
• Residential buildings: Natural gas from MidAmerican and electricity from Alliant
• Vehicles and mobile equipment: On-road passenger and freight vehicles and off-road construction or industrial equipment
• Industrial operations: Natural gas from MidAmerican, on-site fuel combustion, and electricity from Alliant
• Other: Emissions from landfill waste and wastewater treatment
In 2019, the community of Cedar Rapids emitted 5.60 million metric tons of CO2e.
• More than 70% of emissions come from industrial processes
• 17% of emissions are from residential and commercial buildings, supplied by the grid
• 9% of emissions come from on-road vehicles and off-road equipment
• 2% of emissions are from solid waste and wastewater treatment
Community-wide emissions have decreased by 17% since 2010, which recorded 6.72 million metric tons of CO2e.
The reduction during this time period is due primarily to a transition to cleaner electricity sources rather than efficiency or conservation efforts.
The emission reduction scenario planned for Cedar Rapids takes the following trends into account:
• Existing policies, such as building energy codes and federal vehicle fuel economy standards;
• Established goals, such as Alliant Energy’s goals to reduce their carbon emissions 50% from 2005 levels by 2030 and achieve net-zero emissions by 2050;
• Anticipated market trends – such as an increase in electric vehicles – adjusted based on feedback from the community; and
• Potential reduction strategies developed through the planning effort, such as increasing energy efficiency in new and existing buildings and supporting large-scale solar installations. These strategies are the focus of the community actions described in this plan.
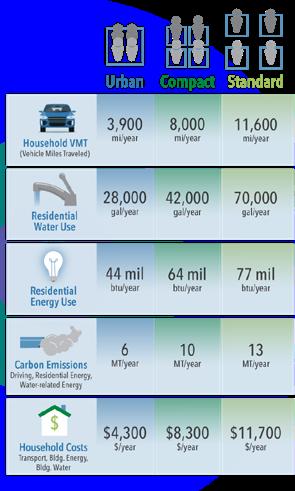
The more spread out our community, the more energy and water properties consume, the more GHGs we emit, and the less our communities can be accessible by biking, busing, and walking. The more spread out our community is, the more expensive it is for residents and for the City to pay for infrastructure.
Vulnerability: As climate change intensifies, the basic needs of vulnerable residents in Cedar Rapids should be prioritized. Residents who have barriers to achieving basic needs experience daily stress, making them susceptible to greater challenges when faced with extreme weather.
Equitable Engagement is the process for developing understanding and partnership with vulnerable residents who are under-represented and under-resourced. As a community looks to reduce carbon emissions and build resilience to a changing climate, residents with vulnerabilities should be central to the planning and decision-making processes and outcomes.
Impacts: Vulnerable residents are most impacted by extreme heat and flooding. If you wait for the bus, live without air conditioning, or work outside, heat and flooding can be very difficult to endure.
Process: Residents who are under-resourced and underrepresented are often disconnected from City decision processes. Traveling downtown to a meeting or getting online to provide feedback may not be feasible with limited funds, mobility, time, and familiarity.
Outcomes: Prioritizing the needs of vulnerable residents in a planning process ensures their needs are central to the plan’s outcomes. Without their input and interests, a plan could be made focuses on actions that are irrelevant or not attainable.
Below Poverty
Unemployed
HOUSEHOLD COMPOSITION & DISABILITY
MINORITY STATUS & LANGUAGE
HOUSING TYPE & TRANSPORTATION
No High School Diploma
Aged 65 or Older
Aged 17 of Younger Income
Older than Age 5 with a Disability
Single-parent Households
Minority
Speaks English “Less than Well”
Multi-Unit Structures
Mobile Homes
Crowding
No Vehicle
Group Quarters
Using the CDC’s Social Vulnerability Index, Census tracts with the highest levels of vulnerability can be mapped. These areas are important priorities for climate action engagement in Cedar Rapids. Neighborhood Association boundaries are overlayed on the map. Those with the highest levels of social vulnerability include Wellington Heights, Oakhill Jackson, Westdale Area, and Taylor.
Overall percentile ranking
0.7501 - 1 | Highest Vulnerability
0.5001 - 0.75
0.2501 - 0.5
0 - 0.25 | Lowest Vulnerability
Data Unavailable
Neighborhood Association Boundary
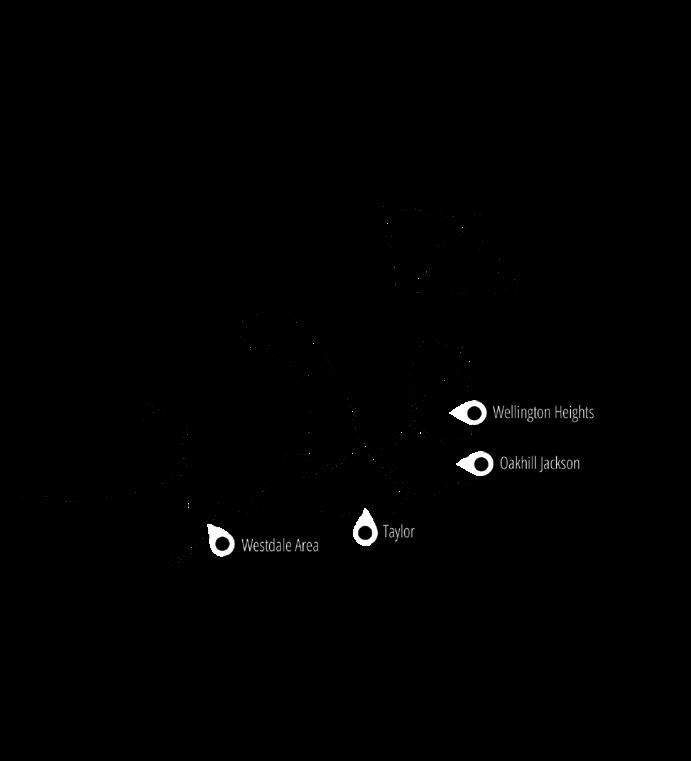
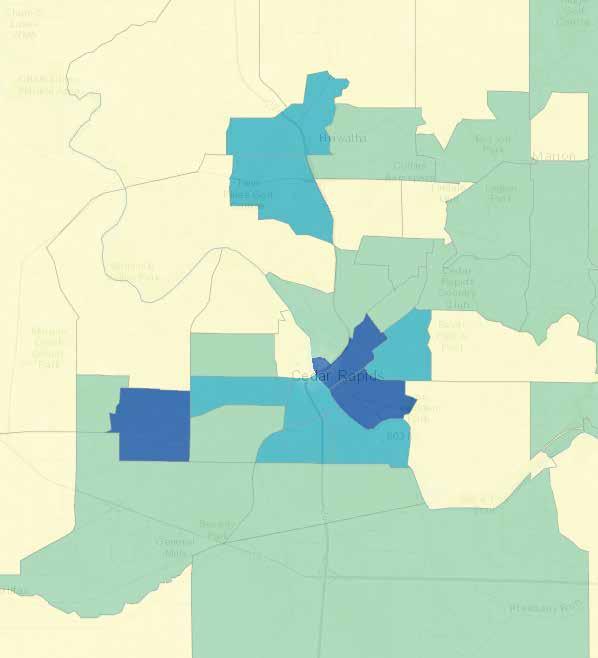
Figure 8: CDC Social Vulnerability Index 2018 for Cedar Rapids Source: cdcarcgis.maps.arcgis.com
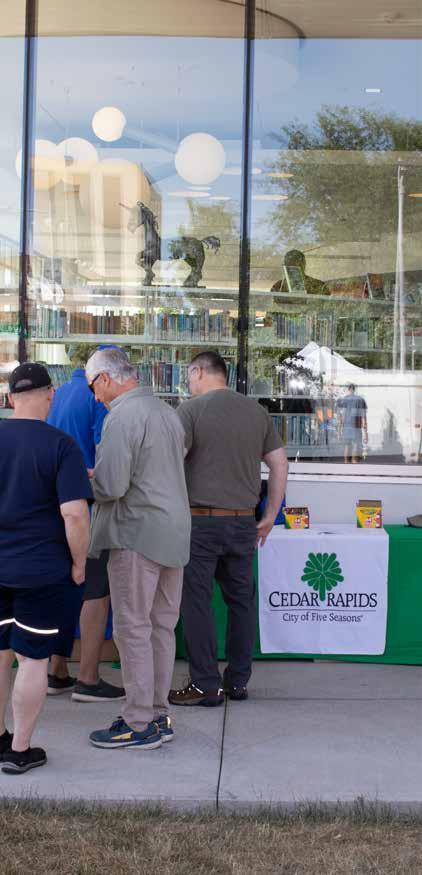
To develop the Community Climate Action Plan, public surveys, focus groups, and an advisory committee were used to integrate the community’s priorities.
City and community leaders introduced the Community Climate Action Plan effort, sharing stories of climate action & equity needs in CR.
A representative group of 13 Cedar Rapids residents guided the development of the planning process. Members represented industry, business, non-profits, schools, and neighborhoods. The committee met regularly from January 2021 to September 2021, providing feedback and perspective on community priorities and plan development.
Residents provided high-level climate action priorities and experiences. Surveys were conducted online and in-person, garnering 1,400 responses, 200 of which came from local schools. Top issues for residents were extreme heat, tree replacement, renewable energy, and winterized homes.
Residents provided feedback on potential climate action initiatives. Survey outreach occurred primarily in person, with a focus on under-resourced and under-represented residents. 28% of responses identified as non-white, and 29% identified household income of under $25,000. Top priorities were healthy food access, energy efficient homes, and tree replacement.
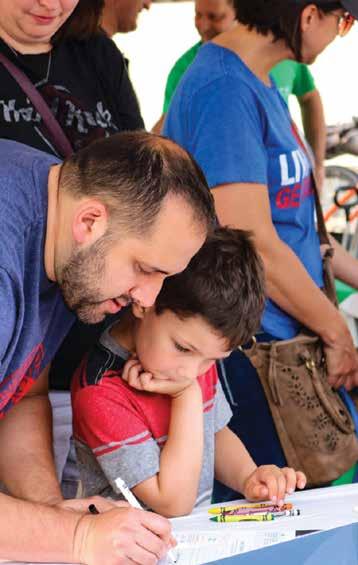
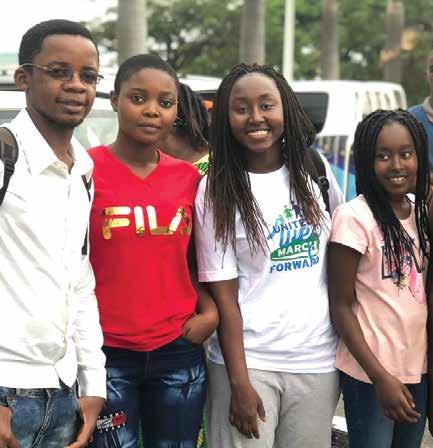
Neighborhood volunteers & City staff conducted COVIDsafe, in-person surveys in under-resourced neighborhoods: Westdale, Taylor, Oakhill-Jackson, Wellington Heights, and Northwest Area. Ground Teams then helped create the Sustainable Neighborhood program.
Input was solicited from stakeholder groups including neighborhoods, small and large businesses, nonprofits and schools.
The final draft of the plan was presented at a public event, which featured City staff and community members from the CCAC, Ground Teams, and focus group participants.
The Community Climate Action Plan was developed over 18 months, which included six months of preliminary development and twelve months of public engagement and plan creation.
October - December 2020January - September 2021 September 2021 + EDUCAT i ON & C OMMUN i TY i NPUT PLANN i NG & ENGAGEMENT
• Kickoff Events
• Recruit Advisory Committee
• Community Surveys
• Consultant Support
• Advisory Committee
• Public Engagement
• Plan Creation
• Short Term Action
• Long Term Vision
• Community Leadership


i MPACTS
T i MEL i NE
LOCAL PRECEDENCE
NAT i ONAL EXAMPLES
RESOURCES
KEY
DEPARTMENT

Potential and tangible impacts of actions
When public action should begin
Foundational City programs and policies
Model programs from across the country
Community
The
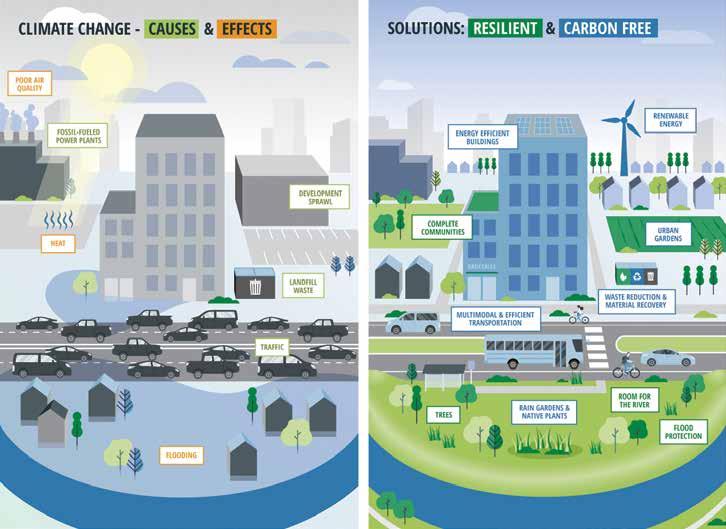
Climate Action may seem complex or daunting — but we are already taking action in many ways. Iowa is a leader in renewable energy. We’re building an extraordinary flood control system. We care about pollinators, bike trails, growing food, energy efficiency, and trees. Climate Action in Cedar Rapids is the commitment to bring these actions to life across our community in order to build an equitable, prosperous, lasting City.
Community inaction is undesirable
Community action builds prosperity
Source: City of Cedar Rapids
CARBON-FREE
PAGES 23–44
RES i L i ENT & ACCESS i BLE
PAGES 45–72
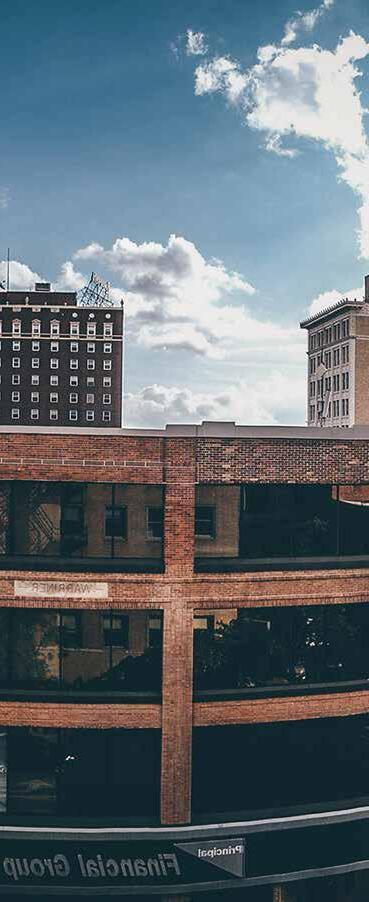
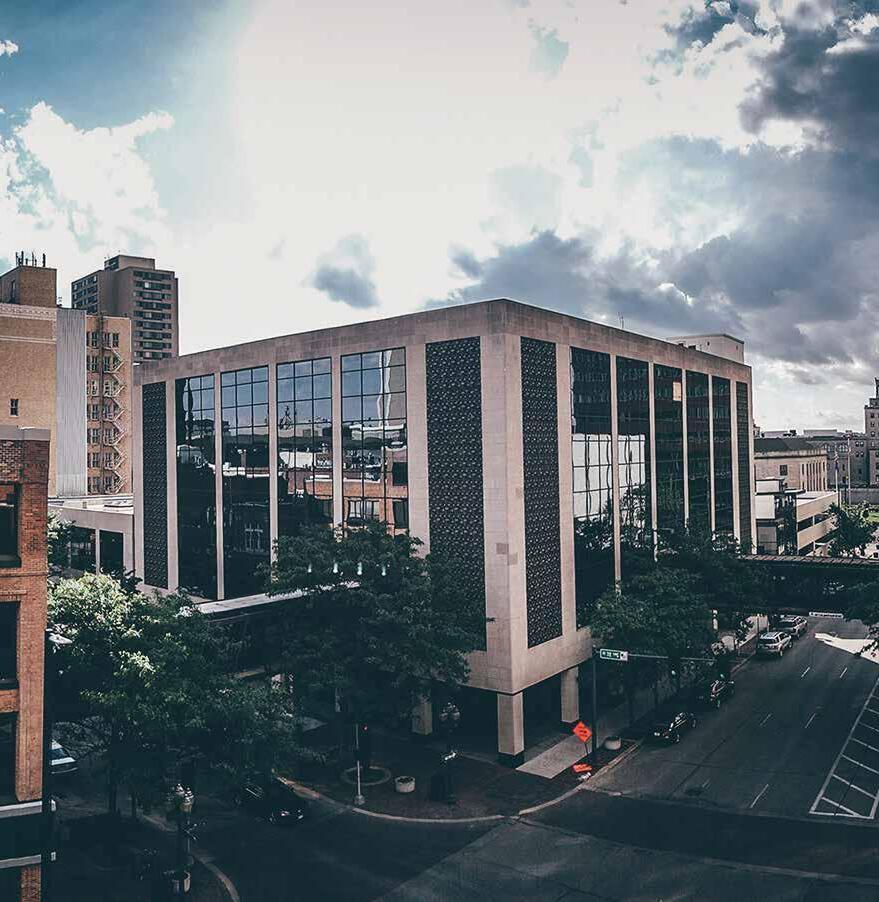
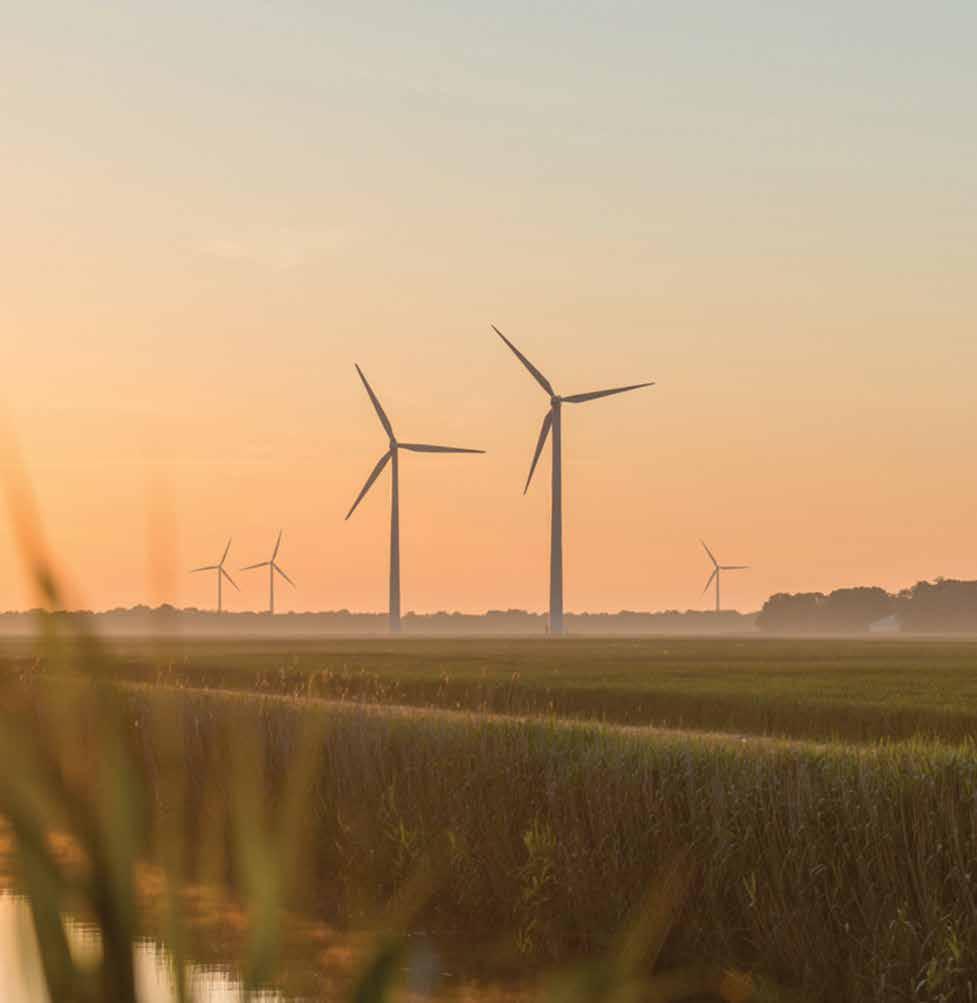
In 2020, wind power contributed to 57% of Iowa’s net energy generation, a higher percentage than any other state.
Source: U.S. Energy Information Administration

2050 V i S i ON:
Cedar Rapids is a carbon-free community. Residents can meet their basic needs within a 15-minute walk. Clean energy provides clean, healthy air. Walking, biking, and busing are popular, while low-emissions public transit and shared-mobility options come frequently.
1A. REDUCE CARBON EM i SS i ONS 45% BY 2030 AND NET-ZERO BY 2050
1B. i NCREASE RENEWABLES TO 70-100% ELECTR i C i TY
1C. i NCREASE TRANSPORT SECTOR’S SHARE OF LOW-EM i SS i ON ENERGY TO 35-65%
1D. EL i M i NATE COAL, REDUCE CARBON i N i NDUSTRY 65-90%, AND SEQUESTER REMA i N i NG CARBON
1A. REDUCE CARBON EM i SS i ONS 45% BY 2030 AND NET-ZERO BY 2050
2030 Vision I: Homes and businesses build identity, achievements, and community through sustainability actions, which are celebrated and shared.
1B. i NCREASE RENEWABLES TO 70-100% ELECTR i C i TY
1C. i NCREASE TRANSPORT SECTOR’S SHARE OF LOW-EM i SS i ON ENERGY TO 35-65%
1D. EL i M i NATE COAL, REDUCE CARBON i N i NDUSTRY 65-90%, AND SEQUESTER REMA i N i NG CARBON
2030 Vision II : Sustainable development policies support walkable core neighborhoods, where basic needs can be met in a 15-minute walk or bike ride. Living and working options support flexibility, resilience, entrepreneurship, and neighborhood identity
2030 Vision: Renewable energy is widespread, equitable, and a key attractor for economic growth
2030 Vision: Low-emission city fleet and private vehicles are standard
2030 Vision: Industry-City partnerships drive carbon reduction and community resilience, providing a model of cooperation locally and nationally
Action 1: Build a Sustainable Neighborhood program to advance sustainability achievements in each neighborhood and provide an exciting neighborhood-building opportunity for Neighborhood Associations.
Action 2: Create a fund to implement a Green & Healthy Homes and Small Businesses program to support deep energy and water efficiency retrofits, hazard remediation, renewable energy, and vehicle and large appliance electrification, prioritizing vulnerable neighborhoods.
Action 3: Build a Sustainable Business program that enhances sustainable building practices (energy efficiency, clean energy, electrification, water, waste reduction) and sustainable land use practices (trees, green infrastructure, gardens, biking facilities).
Action 4: Support residential energy disclosure for prospective homeowners and renters and commercial energy benchmarking to encourage energy awareness and conservation.
Action 5: Develop and implement a sustainable building policy for new construction and major renovations.
Action 6: Update land development regulations to expand missing middle housing and neighborhood scale commercial opportunities throughout the city.
Action 7: Create a sustainable development policy that defines the characteristics of a 15-minute neighborhood and develops guidance and incentives to fill in missing amenities and features, prioritizing vulnerable neighborhoods.
Action 8: Enhance transit and shared transportation options (micro-mobility and car-sharing) in under-resources communities and high-priority transit locations.
Action 9: Enhance the Complete Streets Policy to further community education and prioritize urban heat island mitigation and tree plantings in vulnerable neighborhoods.
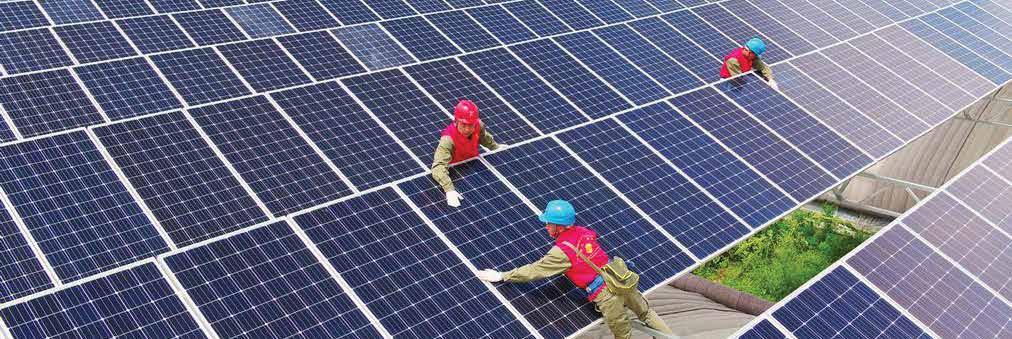
Action 10: Support large-scale solar installations in underutilized areas (parking lots and rooftops) and urban reserve areas that offer multiple benefits.
Action 11: Develop readiness in the community for electric vehicle infrastructure and emerging low-emitting technologies.
Action 12: Collaborate with industry around emission reductions (carbon capture, renewable energy) and community sustainability efforts (stormwater BMPs, garden and tree plantings, philanthropy, volunteerism).
Cedar Rapids is a carbon-free community. Residents can meet their basic needs within a 15-minute walk. Clean energy provides clean, healthy air. Walking, biking, and busing are popular, while low-emissions public transit and shared-mobility options come frequently.
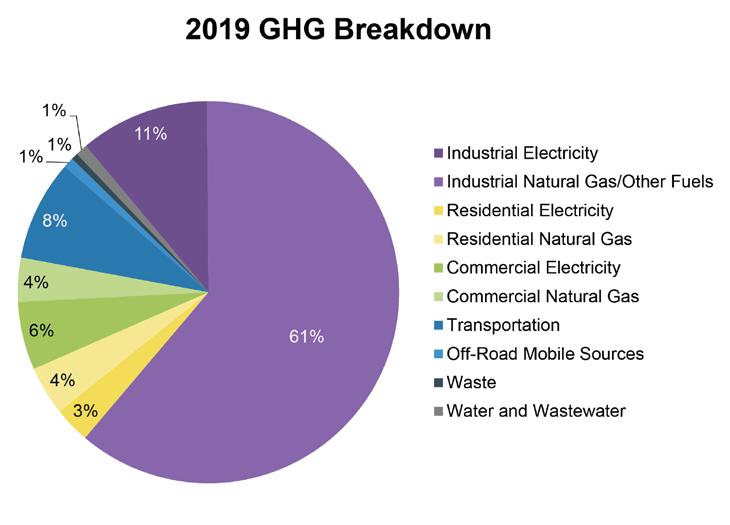
Existing Conditions:
• Industrial emissions: 4.05 million tonnes CO2e, 72%
• Building emissions: 936,000 tonnes CO2e, 17%
• Transportation emissions: 526,000 tonnes CO2e, 9%
• All other emissions: 87,700 tonnes CO2e, 2%
Co-Benefits:
• Improved access to basic needs (Objectives 2B, 2C)
• Improved air quality, (Objective 2D)
• Increased efficiency and renewable energy jobs (Objective 2E)
Public Input:
What excites you about climate action?:
“That it could help not only the community, but all the world.”
“People working together for the better good.”
“The fact that we can literally stop global warming it is just that everyone has to join.”
Homes and businesses build identity, achievements, and community through sustainability actions, which are celebrated and shared.
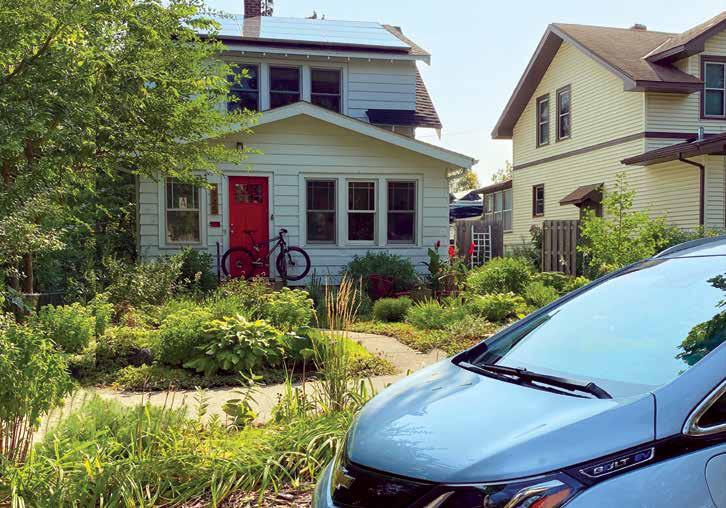
Build a Sustainable Neighborhood program to advance sustainability achievements in each neighborhood and provide an exciting community-building opportunity for Neighborhood Associations.
Prioritize outreach in target neighborhoods (Westdale, Wellington Heights, Oakhill-Jackson, Taylor, Northwest)
i M PACT
T i MEL i NE
LOCAL PRECEDENCE
NAT i ONAL LEADERS
RESOURCES & FUND i NG OPPORTUN i T i ES
KEY STAKEHOLDERS
DEPARTMENT LEAD + SUPPORT
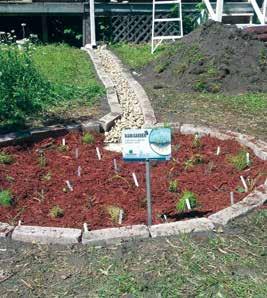
Reduce energy, water, and waste in the home; enhance sustainability in yards
Increase interest in green products and services
• Households could save more than $100 annually through small sustainability updates including efficient lighting, low-flow water fixtures, weatherstripping, and programmable thermostats
• Household waste emissions can be reduced by 33% by 2030 through reduction, compost, and recycling strategies
Within 1 year
Green Iowa AmeriCorps; City door-to-door Derecho assistance
• Denver Sustainable Neighborhoods Program
• Accelerating Neighborhood Climate Action (Denver, Boulder)
• Minneapolis Green Zones Initiative
• Building Blocks for Sustainable Communities (Environmental Protection Agency)
• Partner for Places
Neighborhood Associations, non-profits
City Manager’s Office (Sustainability) + Community Development
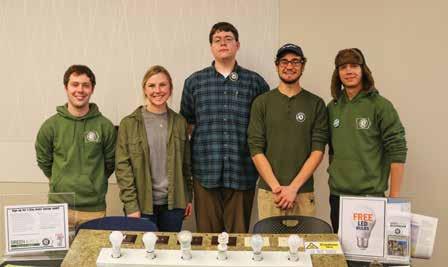

Create a fund to implement a Green & Healthy Homes and Small Businesses program to support deep energy and water efficiency retrofits, hazard remediation, renewable energy, and vehicle and large appliance electrification, prioritizing vulnerable neighborhoods.
Reduce energy burden, improved indoor air quality, increased access to technology
i M PACT
Reduce GHG emissions, improve air quality
Solar, EV and energy efficiency jobs; reduced utility costs
• Deep energy retrofits can reduce home energy use by 30%
• 2,500 homes need to be retrofitted annually to meet 2030 goals
• 350 businesses would need to be retrofitted annually to meet the 2030 target
• Cleaner grid-supplied electricity will further reduce residential emissions by 7% by 2030
T i MEL i NE 2-3 years
• Housing Rehabilitation Programs
• Neighborhood Finance Corps
LOCAL PRECEDENCE
NAT i ONAL LEADERS
RESOURCES & FUND i NG OPPORTUN i T i ES
KEY STAKEHOLDERS
DEPARTMENT LEAD + SUPPORT
• Alliant Energy and MidAmerican programs, Owner occupied rehab program, first-time home buyer program, NFC
• 1,000 homes in 1,000 days, Ithaca, NY
• Green cost-share program with low-income production incentive, Minneapolis, MN
• National Association Housing Redevelopment Organizations (NAHRO)
• American Planning Association (APA)
• Green & Healthy Home Initiative
• HACAP Energy Conservation Programs
• Utility rebates, Alliant Energy, MidAmerican Energy
• Low-income and Multifamily Energy Efficiency Programs Inventory (ACEEE)
Kirkwood Community College, local labor unions, non-profits, small businesses
Community Development (Housing) + City Manager’s Office (Sustainability) + Building Services
Build a Sustainable Business program that enhances sustainable building practices (energy efficiency, clean energy, electrification, water, waste reduction) and sustainable land use practices (trees, green infrastructure, gardens, biking facilities).
Prioritize small and minorityowned businesses
i M PACT
Reduce waste, reduce GHG emissions, enhance indoor and outdoor environmental sustainability
Lower operational costs, green existing jobs, increase demand for green products and services
• Cleaner grid-supplied electricity will further reduce commercial emissions by 10% by 2030
• Commercial waste emissions can be reduced by 33% by 2030 through reduction, compost, and recycling strategies
T i MEL i NE 2-3 years
LOCAL PRECEDENCE
NAT i ONAL LEADERS
RESOURCES & FUND i NG OPPORTUN i T i ES
• Cedar Rapids Economic Development “Buy Local” program
• ISU-Cedar Rapids Food & Bio Business Roundtable
• Green Business Program, Jersey City. NJ
• Sacramento Area Sustainable Business
• Sustainable Business Program, Longmont, CO
• Utility rebates: Alliant Energy, MidAmerican Energy
• Economic Alliance “Buy Here”
KEY STAKEHOLDERS Businesses, non-profits
DEPARTMENT LEAD + SUPPORT
City Manager’s Office (Economic Development & Sustainability) + Community Development
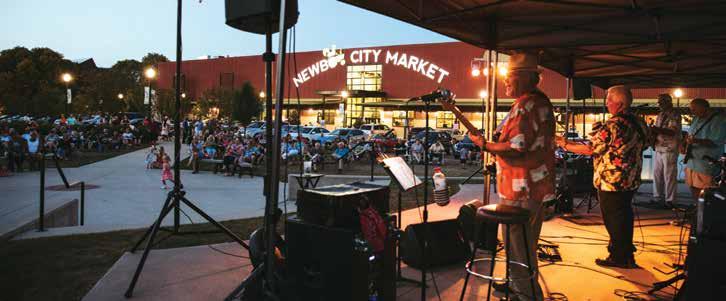
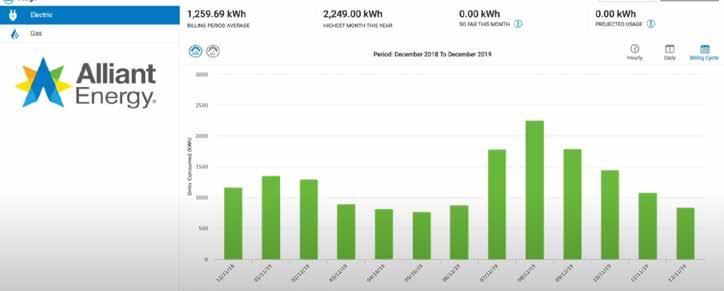
Making
Support residential energy disclosure for prospective homeowners and renters and commercial energy benchmarking to encourage energy awareness and conservation.
EQU i TY
Reduce energy burden, increase energy education and awareness
i M PACT
ENV i RONMENT
Conserve resources
Increase sustainability practices of landlords and property managers
• Cities that have implemented commercial building energy benchmarking and disclosure policies have demonstrated a 3 to 8 percent “gross energy consumption or energy use intensity over a two- to four-year period”, Lawrence Berkeley Lab
• Deep energy retrofits can reduce commercial energy use by 21%
• Up to 16,000 renters will be informed about the energy costs of rental unit
• Up to 4,500 home-buyers will be informed about the energy costs of homes each year
T i MEL i NE 2 - 3 years
LOCAL PRECEDENCE
NAT i ONAL LEADERS
RESOURCES & FUND i NG OPPORTUN i T i ES
KEY STAKEHOLDERS
DEPARTMENT LEAD + SUPPORT
• Landlord Training Program
• Benchmarking DSM, Des Moines, IA
• Home Energy Score Program (Portland, OR)
• Energy Star Portfolio Manager, Environmental Protection Agency
Developers, local labor unions, real estate groups, property managers, building owners
Building Services + City Manager’s Office (Sustainability)
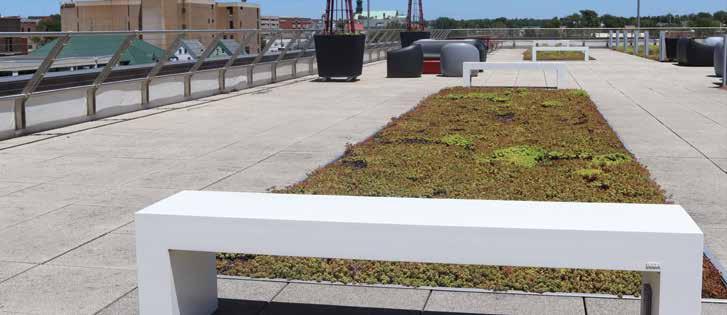
Develop a sustainable building policy for new construction and major renovations.
Lower operating costs for small businesses, tenants Increase energy conservation, reduce greenhouse gases Reduce energy costs
i M PACT
• High-efficiency new homes can achieve 20% energy savings over the current building energy code while improving air quality and reducing household costs
• New commercial buildings meeting the Architecture 2030 Challenge can achieve 66% energy savings over the current building energy code while also reducing operating costs
• 180 new homes and 10 new commercial buildings need to participate annually in a sustainable building policy to meet the 2030 target
T i MEL i NE 2–3 years
LOCAL PRECEDENCE
NAT i ONAL LEADERS
RESOURCES & FUND i NG OPPORTUN i T i ES
KEY STAKEHOLDERS
DEPARTMENT LEAD + SUPPORT
• LEED Certified buildings: Downtown Library and the Central Fire Station
• Ten ENERGY STAR Certified Schools
• Sustainable Building Policy for Private Development, St. Paul, MN
• Green Building Policy, St. Louis Park, MN
• Minnesota Municipal Sustainable Buildings Policies Guide, Center for Energy and Environment
Developers, local labor unions, real estate groups, property managers, building owners
Building Services + City Manager’s Office (Sustainability)
Sustainable development policies support walkable core neighborhoods, where basic needs can be met in a 15-minute walk. More living and working options support affordability, resilience, entrepreneurship, and neighborhood identity.
Update land development regulations to expand missing middle housing and neighborhood scale commercial opportunities throughout the city.
Increase access to basic needs
i M PACT
Increase active mobility, improve air quality, reduce emissions
Build local wealth, increase financial resilience
• With more compact development, people drive 20 to 40 percent less compared to sprawling communities
• Services and infrastructure required to serve low-density, sprawling development can cost 3.7 times as much as more compact development
T i MEL i NE Within 1 year
LOCAL PRECEDENCE
NAT i ONAL LEADERS
RESOURCES & FUND i NG OPPORTUN i T i ES
KEY STAKEHOLDERS
DEPARTMENT LEAD + SUPPORT
• ReZone Cedar Rapids (chapter 32)
• Age-Friendly Cedar Rapids
• Accessory Dwelling Units Program, Portland, OR
• ADUniverse central resource, Seattle, WA
• Promote Inclusionary Growth, American Planning Association
• Cedar Rapids Livability Index, AARP
• Congress for New Urbanism
Neighborhood organizations, small businesses, developers
Community Development + Development Services
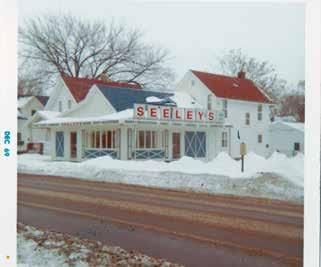
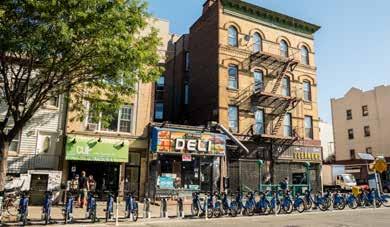
Mixed-use developments contribute to a community’s walkability. Ground floor commercial units with apartments on top make it easy for residents to access daily needs without an automobile.
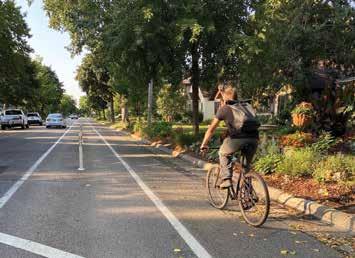
A bicyclist uses a bike lane protected by plastic bollards in Minneapolis, MN. Safe, connected bicycle infrastructure can provide residents with appealing alternatives to vehicle travel.
Source: Great Plains Institute
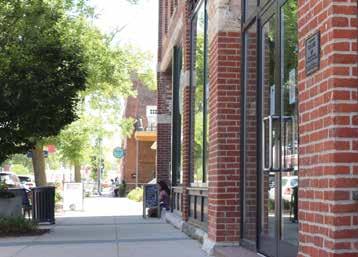
Connected communities provide opportunities for easy access to walkable, well-vegetated commercial corridors, such as 3rd Street SE in Cedar Rapids.
Create a sustainable development policy that defines the characteristics of a 15-minute neighborhood and develops guidance and incentives to fill in missing amenities and features, prioritizing vulnerable neighborhoods.
Increase amenities in underresourced neighborhoods, improve health
i M PACT
Increase tree canopy coverage
Build local wealth
• Americans with lower incomes spend between 17% and 29% of their incomes on cars
• Sprawling development that is not walkable, compared to compact development, costs residents, 2-3x more in transportation and housing and uses 2-3x more energy, water, and carbon per development
T i MEL i NE 2-3 years
• Cedar Rapids neighborhood action plans
LOCAL PRECEDENCE
NAT i ONAL LEADERS
RESOURCES & FUND i NG OPPORTUN i T i ES
KEY STAKEHOLDERS
DEPARTMENT LEAD + SUPPORT
Community Development + City Manager’s Office, Development Services, Public Works, Parks & Recreation EQU i TY ENV
• Cedar Rapids Complete Streets Policy
• Cedar Rapids Economic Development Programs
• Sun Valley EcoDistrict Denver, CO
• Sustainable Development Incentives, Bloomington, IN
• EcoDistrict Protocol to create neighborhoods for all
• Blue Zones improve longevity through built environment and healthy food access
• Review of Sustainable Development Incentives
Neighborhood organizations, businesses, non-profits, developers, government agencies
Enhance transit and shared transportation options (micro-mobility and car-sharing) in under-resourced communities and high priority transit locations.
Reduce asthma hospitalizations, increase active-living options, improve transportation accessibility
i M PACT
Improve air quality, reduce transportation emissions
Reduce transportation costs
• Individuals in the community will need to drive 2% less each year to meet the 2030 targets
• In 2019, more than 80% of Cedar Rapids commuters drove alone
T i MEL i NE 2-3 years
LOCAL PRECEDENCE
NAT i ONAL LEADERS
RESOURCES & FUND i NG OPPORTUN i T i ES
KEY STAKEHOLDERS
DEPARTMENT LEAD + SUPPORT
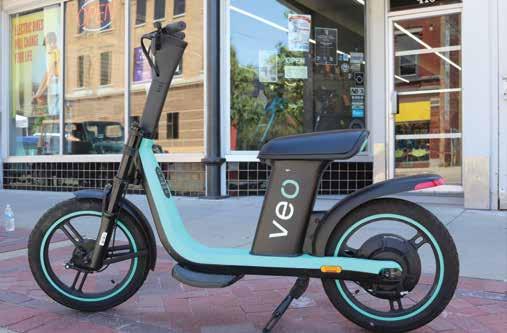
• Cedar Rapids bike- and scooter-share program
• Via Ride Service from Neighborhood Transportation Services
• EV Spot Network, Minneapolis/St. Paul, MN
• Twin Cities Shared Mobility Program
• Driving Down Emissions: Transportation, Land Use, and Climate Change, Smart Growth American and Transportation for America
• Complete streets policy with mode prioritization, Minneapolis, MN
• Golf Carts as micro-transit - Review of 4 cities
Transit riders, neighborhood organizations, government agencies
Transit + Community Development, Public Works
Enhance the Complete Streets Policy to further community education and prioritize urban heat island mitigation and tree plantings in vulnerable neighborhoods.
Increase proximity to natural spaces, reduce urban heat island effect
i M PACT
Increase tree canopy, carbon sequestration; improve ecological functions
Increase community vibrancy
• Shading building walls and rooftops can reduce their temperatures by as much as 45°F and placing trees in downtown areas can reduce temperatures by as much as 7°F
• 100 medium-sized trees could store more than 44,000 pounds of CO2 annually
T i MEL i NE 2-3 years
LOCAL PRECEDENCE
NAT i ONAL LEADERS
RESOURCES & FUND i NG OPPORTUN i T i ES
• Cedar Rapids Complete Streets Policy
• Shared, stacked-function infrastructure, St. Paul, MN
• Urban Street Stormwater Guide, (Performance Policy Metrics) National Association of City Transportation Officials
• Extreme heat map tool, Metropolitan Council
KEY STAKEHOLDERS Government agencies, non-profits, bike advocacy groups, neighborhood associations
DEPARTMENT LEAD + SUPPORT
Public Works + Community Development, Parks & Recreation
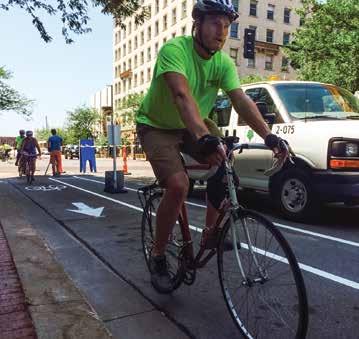
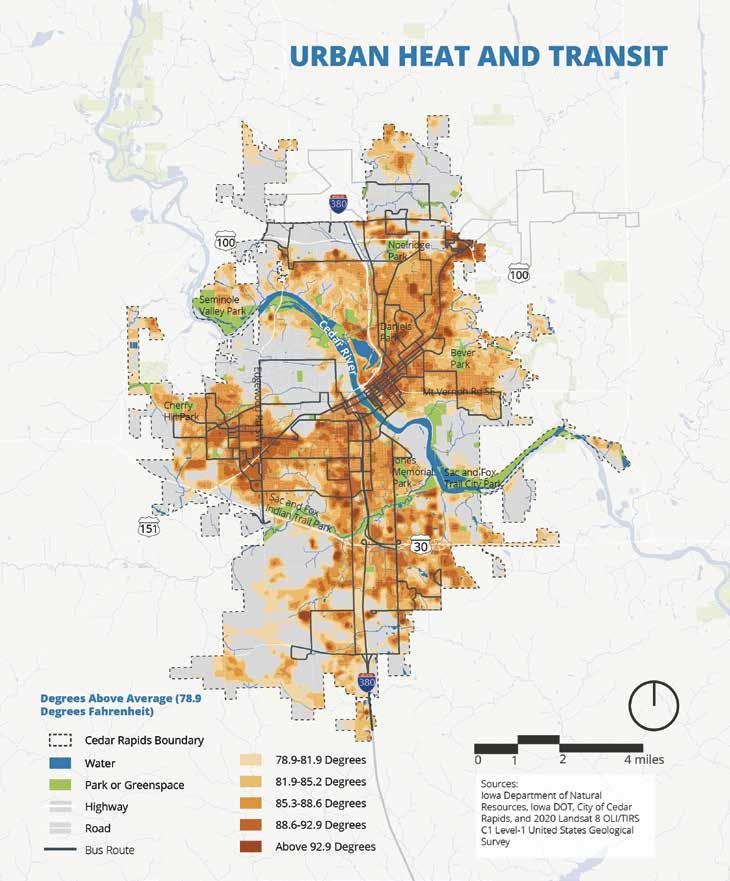
Figure 11: Areas of Urban Heat Island Effect with Elevated Average Temperates, overlain with Public Transit Routes. As shown, public transit routes show the highest temperatures above average, compounding exposure for transit-dependent residents.
Source: Asakura Robinson 2021
Existing Conditions:
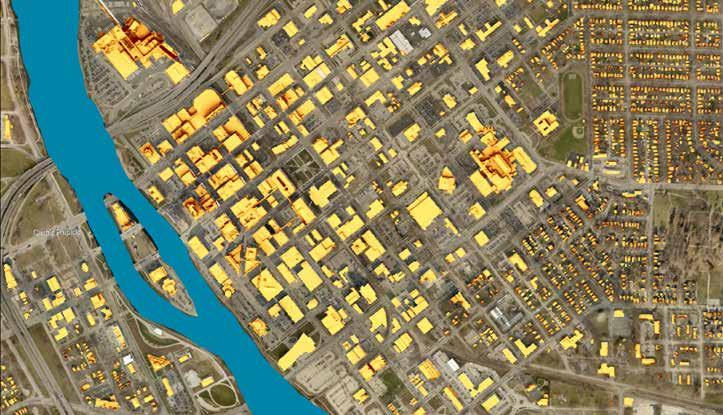
• Grid-supplied electricity use in buildings and industrial processes accounts for 20% of total emissions (2019)
• 34% of Alliant’s generation comes from renewable sources
• The existing solar resource could meet at least 36% of non-industrial electricity use
• Alliant plans include 50% renewable by 2025 and reduced emissions 50% by 2030
Co-Benefits
• Reduction in carbon emissions from electricity (Objective 1A)
• Increased grid resilience (Objective 2A)
• Clean access to air (Objective 2D)
• High-wage clean energy job opportunities (Objective 2E)
Public Input:
“Renewable energy is important for obvious reasons. We must leave oil and other fossil fuels in the ground if we are to have a hope of meeting the challenge of climate change”
“Renewable energy makes economic sense, and I want a sustainable future.”
Renewable energy is widespread, equitable, and a key attractor for economic growth
Support large-scale solar installations in underutilized areas (parking lots and rooftops) and urban reserve areas that offer multiple benefits.
Increase renewable energy options for all residents
i M PACT
Reduce fossil fuels, decrease pollution
Increase jobs in renewable energy
• The top 10 largest rooftops can fit 9.5 MW of solar energy systems, serving 1% of the community’s residential and commercial electricity needs
• 135 MW of solar would need to be installed to meet the 2030 target, achieving 15% of the community’s residential and commercial electricity needs
T i MEL i NE 2-3 years
LOCAL PRECEDENCE
NAT i ONAL LEADERS
RESOURCES & FUND i NG OPPORTUN i T i ES
KEY STAKEHOLDERS
• Cedar Rapids Future Land Use Map
• Linn County Solar Energy
• Solar Master Plan, Leech Lake Band of Ojibwe
• 100 MW solar development for City of Cincinnati (35 MW) and its residents (65 MW)
• Jobs trainings and resilience hub microgrid, Minneapolis, MN
• Alliant Energy Community Solar Program
• Cities Renewables Accelerator, World Resource Institute
• American Planning Association
Alliant Energy, local labor unions, neighborhood organizations, government agencies, non-profits
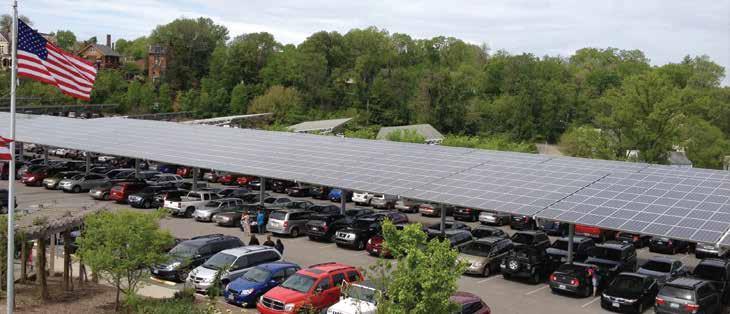
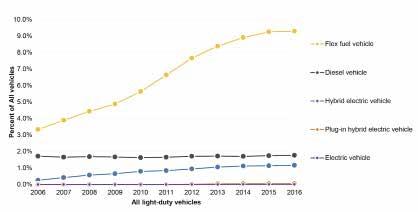
Figure 13 : Community-wide Vehicle Fleet Composition in Cedar Rapids (2006 to 2016).
Data Source: National Renewable Energy Lab, State and Local Planning for Energy (SLOPE) data
Existing Conditions:
• On-road transportation accounts for 9% of total emissions
• More than 80% of vehicles use gasoline
• Less than 1% of vehicles are electric
• There is one fast charger and two dozen level two chargers
2030 V i S i ON:
Low-emission city fleet and private vehicles are standard.
Co-Benefits:
• Reduce carbon emissions (Objective 1A)
• Improved air quality, (Objective 2D)
• Support green jobs and economic development (Objective 2E)
Public Input:
“Eliminating the need to drive everywhere is at the top of the list because of the innumerable health and environmental benefits.”
“We have a population that is trending to want to live in walkable neighborhoods, use renewable energy, really use the built environment”
Develop readiness in the community for electric vehicle infrastructure and emerging low-emitting technologies.
Increase charging availability for all residents
i MPACT
T i MEL i NE
LOCAL PRECEDENCE
NAT i ONAL LEADERS
RESOURCES & FUND i NG OPPORTUN i T i ES
KEY STAKEHOLDERS
DEPARTMENT LEAD + SUPPORT
Reduce GHG emissions, improve air quality near arterial roads
Increase jobs in electric vehicle manufacturing and infrastructure
• Owning an electric vehicle results in $6,000-10,000 of lifetime savings for the typical driver, compared to a gas-powered vehicle
• 19% of the community’s vehicles will need to be electric to meet the 2030 target
Within 1 year
• Eastern Iowa EV Readiness Report
• iGreenCR Action Plan (page 20) - Resources, Goal 4, Objective A
• Electric Vehicle Readiness Road Map, Fort Collins, CO
• Electric Vehicles & Infrastructure, San Jose, CA
• Eastern Iowa EV Readiness Plan
• Summary of Best Practices for EV Ordinances, Great Plains Institute
• Hydrogen Fuel Cell Vehicles, EPA
Government agencies, small businesses, local labor unions, housing developers, non-profits, Alliant Energy
City Manager’s Office (Sustainability) + Community Development, Finance, Public Works
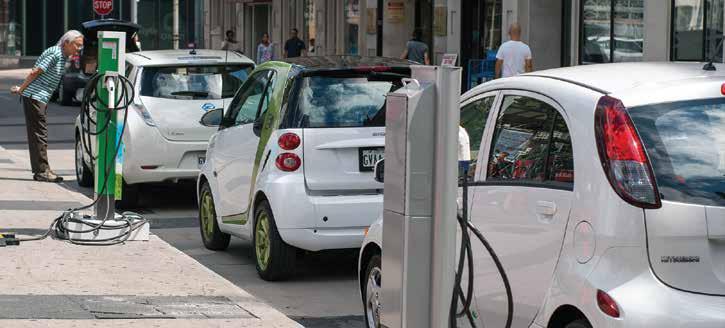
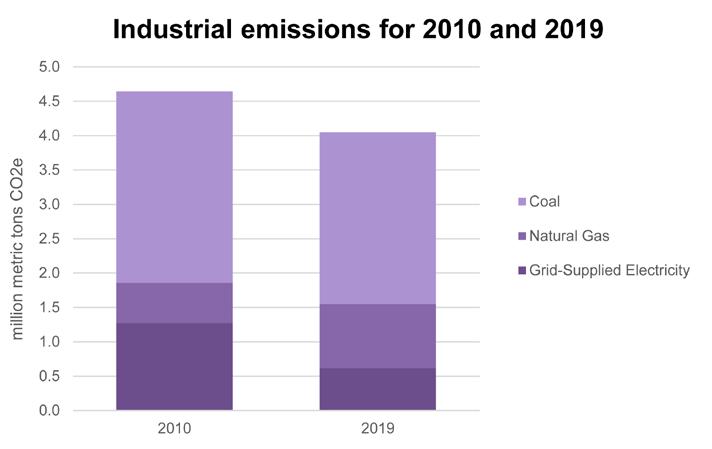
Figure 14. Industrial GHG emissions for 2010 and 2019. Data sources: Alliant Energy, MidAmerican Energy, EPA FLIGHT data
Existing Conditions:
• 72% of community-wide emissions come from industrial processes
• Industrial emissions decreased 13% between 2010 and 2019 due to cleaner electricity and switching from coal to natural gas
• The five largest industrial companies have corporate GHG goals
Co-Benefits:
• Reduce carbon emissions (Objective 1A)
• Increase renewables (Objective 1B)
• Improved air quality, (Objective 2D)
• Support green economic development (Objective 2E)
Public Input:
“Cedar Rapids should prioritize using clean energy resources, given that we are an industrial city that often emits many pollutants.”
“Reduce fossil fuels. Invest in solar and wind power.”
Industry-City partnerships drive carbon reduction and community resilience, providing a model of cooperation locally and nationally
Collaborate with industry around emission reductions (carbon capture, renewable energy) and community sustainability efforts (stormwater BMPs, garden and tree plantings, philanthropy, volunteerism).
Improve air quality for most sensitive
i M PACT
T i MEL i NE
LOCAL PRECEDENCE
NAT i ONAL LEADERS
RESOURCES & FUND i NG OPPORTUN i T i ES
KEY STAKEHOLDERS
DEPARTMENT LEAD + SUPPORT
Reduce GHG emissions, eliminate coal-powered electricity
Increase energy efficiency, resilient infrastructure, and clean energy
• A pathway to achieving the 2030 target includes improving industrial energy efficiency by 1% each year, replacing two-thirds of coal use with lower-emitting alternatives, and obtaining 60% of industrial electricity through green power programs reduces emissions.
• Cleaner grid-supplied electricity will also contribute, reducing industrial emissions by 3% by 2030
Within 1 Year
Stormwater BMPs, Flood Control, Economic Development programs
• ADM: Reduce absolute emissions 25% by 2035
• General Mills: 30% reduction by 2030, net zero by 2050
• Cargill: 10% from 2017 by 2025 for Scope 1 and 2
• Ingredion: 25% absolute reduction by 2030
• Quaker (PepsiCo): 40% by 2030, 100% renewable electricity by end of 2021
• Low carbon industrial policy options, Industrial Innovation Initiative
• 45Q tax credit, Carbon Capture Coalition
• EJ Screen Mapping Tool
• Guide to Public-Private Collaboration on City Resilience Planning, C2ES
Large industrial companies, government agencies
City Manager’s Office + Utilities, Public Works, Community Development
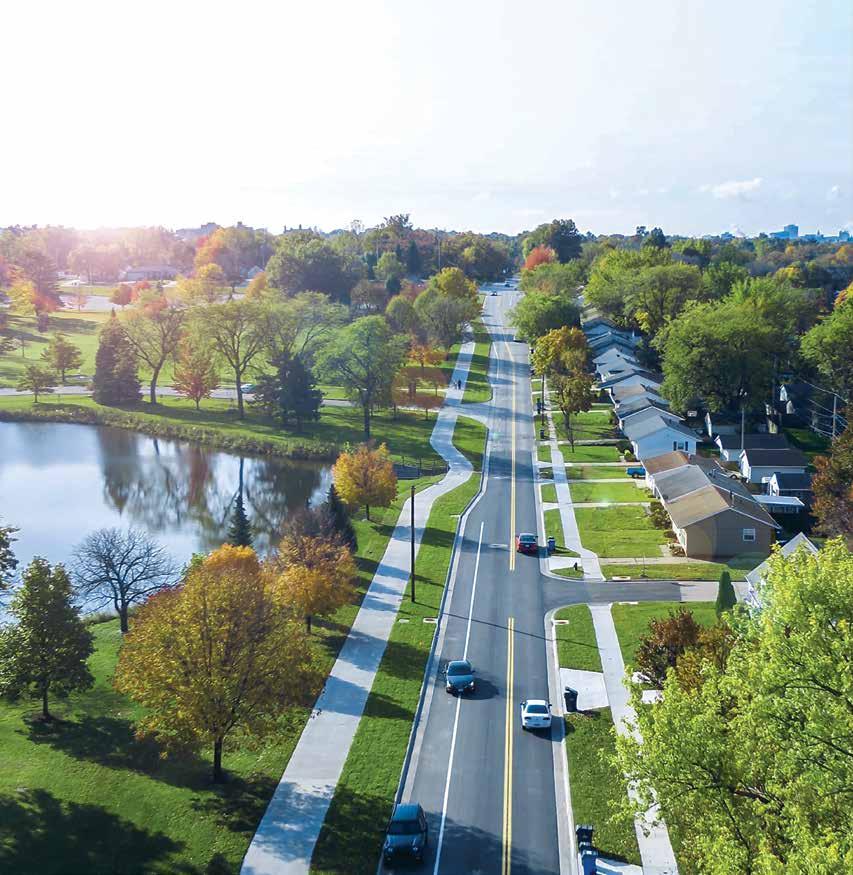
All residents of Cedar Rapids have access to high-quality green space, healthy food, clean air and water, and good, green jobs. Residents and neighborhoods are cohesive and familiar, helping each other out and getting connected to our rich community resources.
• 2A. BU i LD RES i L i ENCE TO FLOOD i NG AND CL i MATE HAZARDS W i TH PR i OR i TY FOR VULNERABLE RES i DENTS
• 2B. ENSURE ALL RES i DENTS HAVE AFFORDABLE AND ACCESS i BLE FOOD OPT i ONS FOR GROW i NG AND CONSUM i NG HEALTHY, CULTURALLY RELEVANT FOOD
• 2C. ENSURE EQU i TABLE ACCESS TO PARKS AND NATURAL SPACE
• 2D. ENSURE EQU i TABLE ACCESS TO CLEAN A i R AND WATER
• 2E. CREATE H i GH-WAGE, GREEN JOBS AND GREEN ECONOM i C DEVELOPMENT
• 2F. PROV i DE D i RECT CONNECT i ON TO C i TY GOVERNMENT FOR VULNERABLE RES i DENTS
2A. BU i LD RES i L i ENCE TO FLOOD i NG AND CL i MATE HAZARDS W i TH PR i OR i TY FOR VULNERABLE RES i DENTS
2030 Vision: All residents have access to basic needs regularly and following extreme weather events
2B. ENSURE ALL RES i DENTS HAVE AFFORDABLE AND ACCESS i BLE OPT i ONS FOR GROW i NG AND CONSUM i NG HEALTHY, CULTURALLY RELEVANT FOOD
2030 Vision: Within a 15-minute walk there are healthy food outlets in all vulnerable neighborhoods
2C. ENSURE EQU i TABLE ACCESS TO PARKS AND NATURAL SPACE
2030 Vision: Vulnerable neighborhoods have 15-minute walkable access to amenity-rich parks via tree-lined corridors
2D. ENSURE EQU i TABLE ACCESS TO CLEAN A i R AND WATER
2E. CREATE H i GH-WAGE, GREEN JOBS AND GREEN ECONOM i C DEVELOPMENT
2030 Vision: Cedar Rapids is trusted for excellent air and water quality
2030 Vision: High-wage green jobs and a more sustainable local economy support plan implementation
2F. PROV i DE D i RECT CONNECT i ON TO C i TY GOVERNMENT FOR VULNERABLE RES i DENTS
2030 Vision: Community members are active in implementation through equitable engagement that is inclusive of all residents
Action 1: Develop indoor and outdoor Resilience Hubs to provide basic amenities to residents in public spaces (info kiosks, wi-fi, charging, shelter, water, food).
Action 2: Support and expand existing resilience programs to mitigate flooding and prepare residents for future climate extremes.
Action 3: Support the stormwater master plan with particular focus on regional detention basins and major funding gaps for hard infrastructure maintenance.
Action 4. Develop a food access policy as part of a Sustainable Development approach to ensure vulnerable residents can achieve healthy and relevant food (land access, growing, consuming, selling) within a 15-minute walk (including urban farms, gardens on commercial properties, public gardens, pantries, groceries, education).
Action 5: Support conversion of underutilized hard infrastructure (parking lots, roofs, underpasses) to support gardens, cooling features, and active programming (Resilience Hubs, markets, recreation).
Action 6: Implement the city’s ReLeaf program, supporting vulnerable neighborhoods with air and heat pollution challenges.
Action 7: Protect water quality by supporting source water protection initiatives and existing watershed partnerships that reduce nutrient-rich runoff into the Cedar River.
Action 8: Support stormwater BMP cost-share and ERU reduction programs on large properties.
Action 9: Complete and implement a green economic development plan, identifying green jobs, community strengths, and programs for equitable business and workforce development.
Action 10: Expand sustainability support and expectations in purchasing, contracts, and development to support circular economy, local buying, and cooperative buying.
Action 11: Operationalize the equitable public engagement toolkit to reach more under-resourced and under-represented residents.
Action 12: Establish City-student partnerships to engage youth in plan implementation.
All residents of Cedar Rapids have access to high-quality green space, healthy food, clean air and water, and good, green jobs. Residents and neighborhoods are cohesive and familiar, helping each other out and getting connected to our rich community resources.
Existing Conditions:
• 2,636 residential and 778 commercial parcels currently located in the 100-year floodplain
• 11.6% of the population is below the federal poverty line
Co-Benefits:
• Reduction in carbon emissions (Objective 1A)
• Improved access to basic needs (Objectives 2B, 2C)
• Support connection to city government for vulnerable residents (Objective 2F)
Public Input:
“Humans are resilient resourceful, and adaptable. It excites me to see the solutions we will come up with to adjust how we live with any changes in the weather around us.”
“Ensuring that racial and socioeconomic equity are a priority in addressing climate change.”
Cedar Rapids builds resilience, with a focus on the most vulnerable, acknowledging its legacy of flooding and extreme weather.
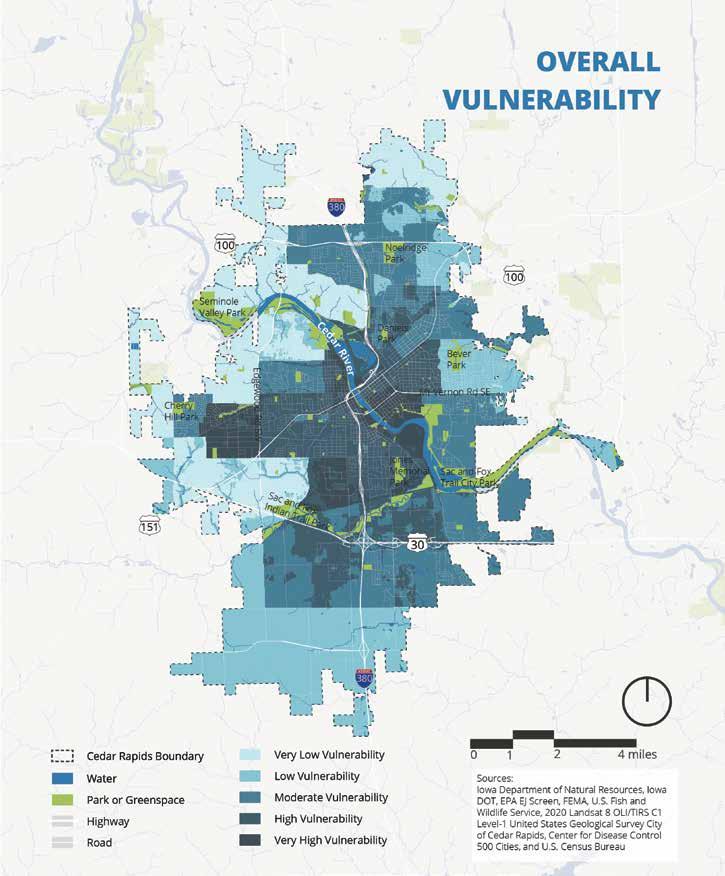
Figure 15: Vulnerability, shown as the aggregate of many factors for residents, across the City. Determinants of vulnerability include both social and demographic, like vehicle access and language ability, as well as geographic considerations like proximity to high-traffic corridors, or green space access.
Source: Asakura Robinson 2021
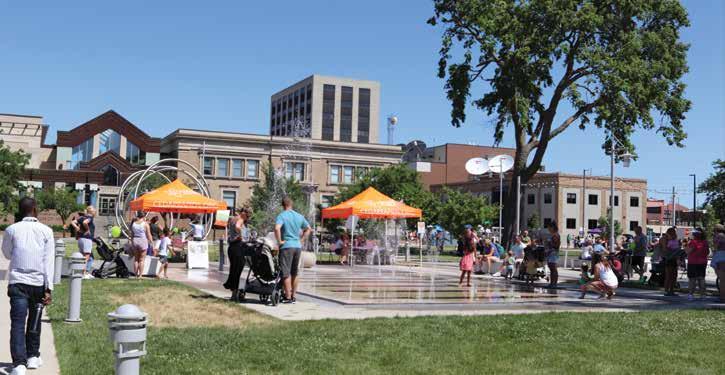
Develop indoor and outdoor Resilience Hubs to provide basic amenities to residents in public spaces (info kiosks, wi-fi, charging, shelter, back-up power, water, food).
Increase resilience in vulnerable neighborhoods
i M PACT
T i MEL i NE
LOCAL PRECEDENCE
NAT i ONAL LEADERS
RESOURCES & FUND i NG OPPORTUN i T i ES
Decrease vehicle miles traveled to meet basic needs
Increase economic resilience for vulnerable residents
• Resilience hubs located in priority neighborhoods (Wellington Heights, Oakhill Jackson, and Taylor would help more than 3,800 households
2-3 years
• Rollin’ Recmobile
• Leadership in Community Resilience Grant
• Cedar Rapids Public Library
• Resilience Hubs, Medford, MA
• City Community Resilience Hubs, Baltimore, MD
• Resilience Hubs, Urban Sustainability Directors Network
• Partner for Places, Funders Network
KEY STAKEHOLDERS Neighborhood organizations, Cedar Rapids Library
DEPARTMENT LEAD + SUPPORT
City Manager’s Office + Parks & Recreation, Community Development
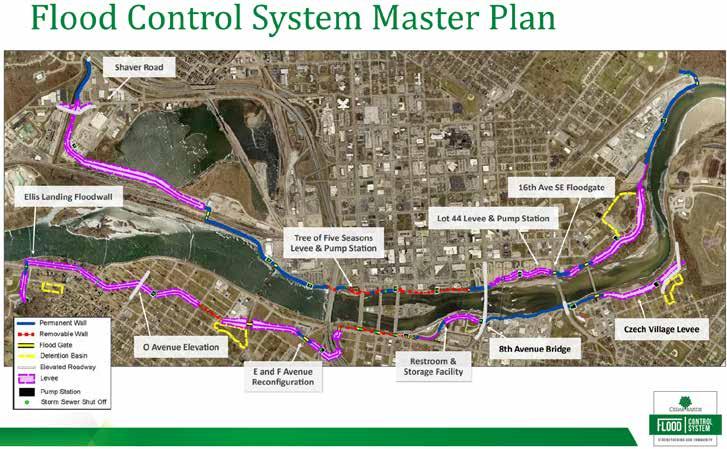
Support and expand existing resilience programs to mitigate flooding and prepare residents for future climate extremes.
EQU i TY
Mitigate flooding in vulnerable neighborhoods
i M PACT
T i MEL i NE
LOCAL PRECEDENCE
NAT i ONAL LEADERS
RESOURCES & FUND i NG OPPORTUN i T i ES
KEY STAKEHOLDERS
DEPARTMENT LEAD + SUPPORT
ENV i RONMENT
Increase tree canopy, reduce impervious surface, control flooding
Increase infrastructure jobs
Flood Control System protects both sides of the river
In progress
• Neighborhood P.A.C.T.
• Flood protection resources
• Leadership in Community Resilience, National League of Cities
• FEMA Community Rating Score and flood insurance premium reduction
All residents, businesses, non-profits, government agencies
City Manager’s Office + Development Services, Community Development
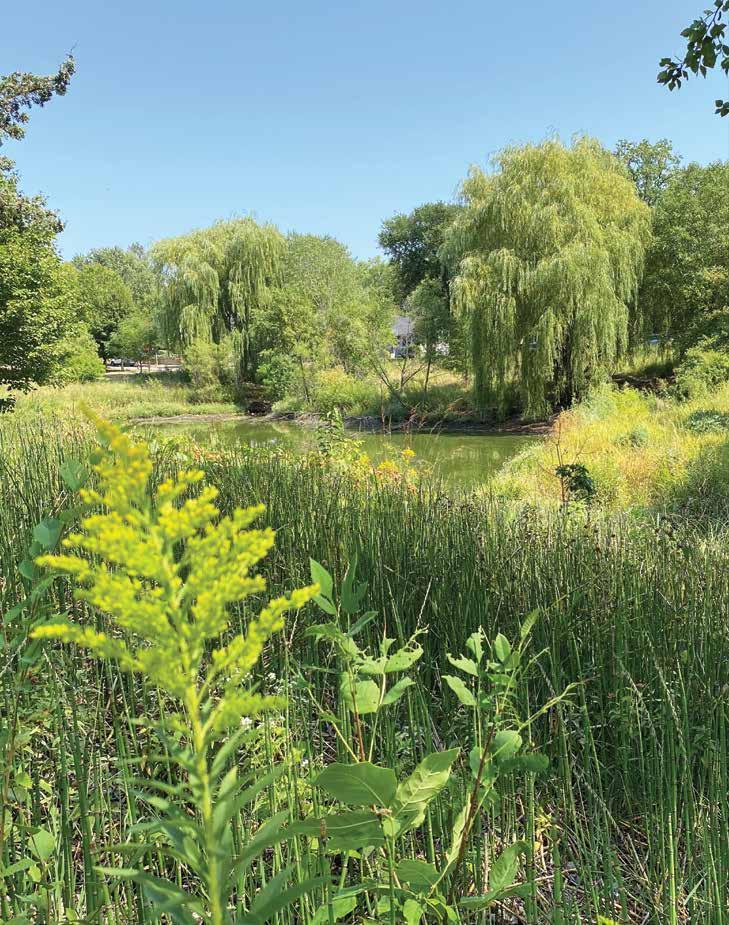
Support the stormwater master plan with particular focus on regional detention basins and major funding gaps for hard infrastructure maintenance.
Mitigate flooding in vulnerable neighborhoods
i M PACT
T i MEL i NE
LOCAL PRECEDENCE
NAT i ONAL LEADERS
RESOURCES & FUND i NG OPPORTUN i T i ES
KEY STAKEHOLDERS
DEPARTMENT LEAD + SUPPORT
Increase tree canopy, reduce impervious surface
Increase infrastructure jobs, avoid economic losses due to flooding
Detention basins capture sediments and pollutants, improving receiving stream water quality, and reduce stormwater flow, decreasing the risk of flooding
In progress
• Stormwater Master Plan
• iGreenCR Action Plan, Nature, Goal 2, Objective A & B
• Flood Control System
• Greenseams Program, Milwaukee, WI
• Water Systems, Urban Sustainability Directors Network
Government agencies, State of Iowa Flood program
Public Works + City Manager’s Office, Development Services, Community Development
Existing Conditions:
• 63% of low income residents are more than 0.5 miles away from a full service grocery store
• 12.1% of seniors are food insecure
Co-Benefits:
• Increased community resilience (Objective 2A)
• Advance equitable access to green and natural space for cultivation or urban gardening (Objective 2C)
2030 V i S i ON:
Public Input:
“Implementation of more urban gardens to both provide food and jobs in a more sustainable fashion.”
“Healthy food access is the number one priority for non-white residents and households with incomes under $25,000.”
“I would like to garden cause I love fruits and would like to have fresh vegetables.”
Within a 15-minute walk there are gardens and healthy food outlets within all vulnerable neighborhoods
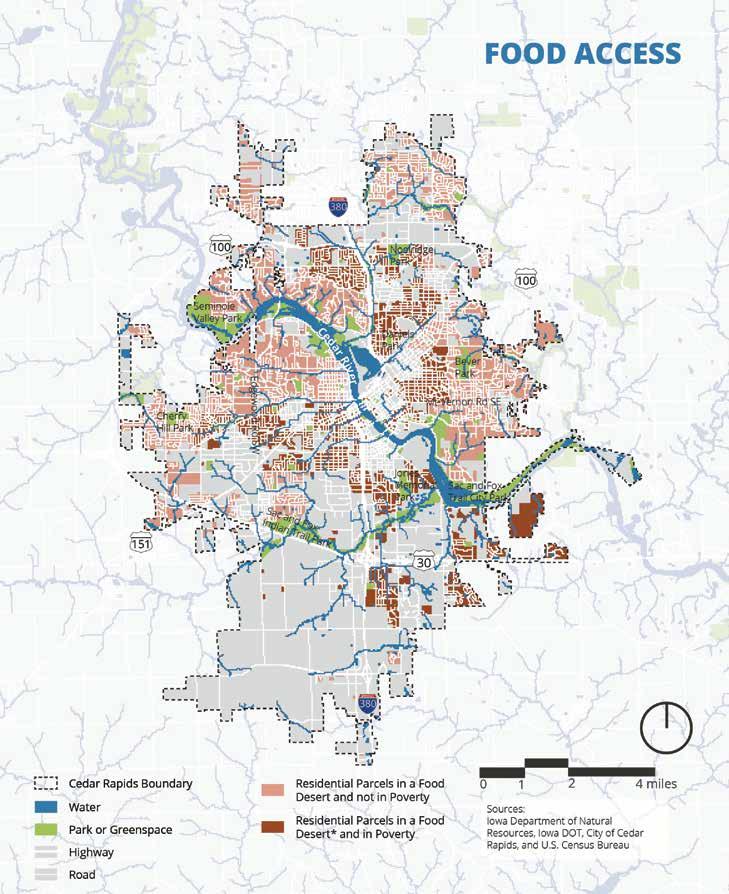
Source: Asakura Robinson 2021
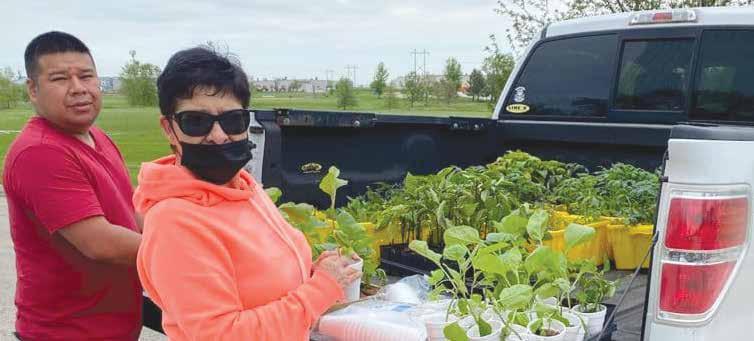
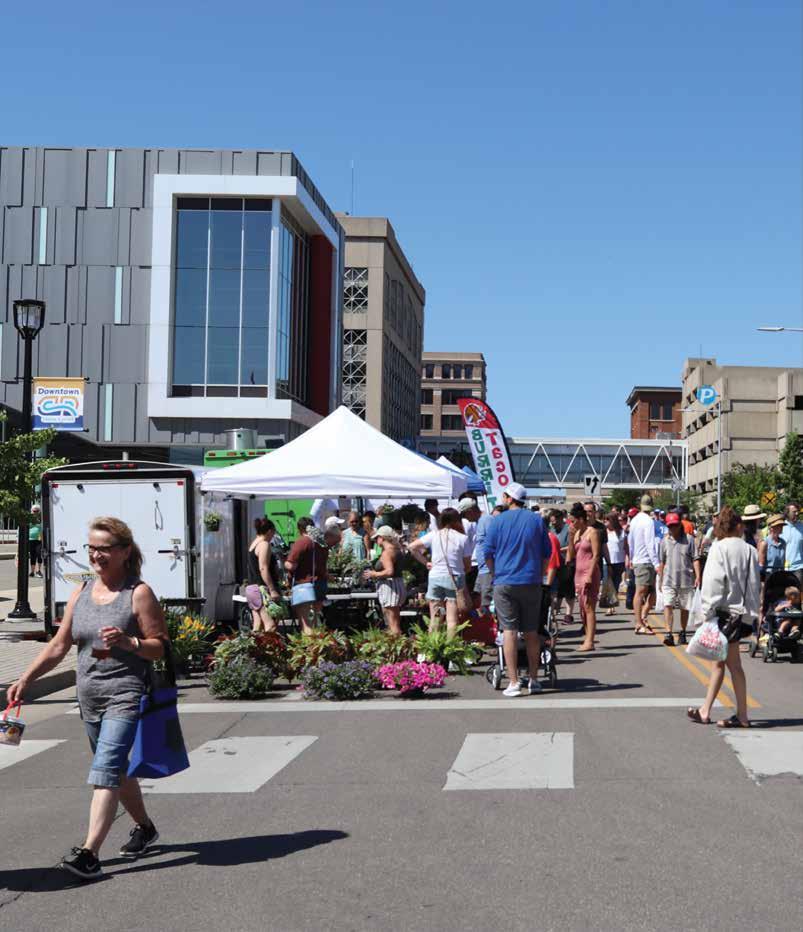
Develop a food access policy as part of a Sustainable Development approach to ensure vulnerable residents can achieve healthy and relevant food (land access, growing, consuming, selling) within a 15-minute walk (including urban farms, gardens on commercial properties, public gardens, pantries, groceries, education).
Eliminate food deserts
i M PACT
Reduce travel emissions Increase food security
• In Linn County, 7.8% of the total population and 12% of children are considered food insecure
• Double Up Food Bucks enabled low-income Iowa residents to purchase more than $1million in fruits and vegetables, generating almost $2 million in total economic impact
• An 800 square-foot garden can feed a family of four year-round
T i MEL i NE 2-3 years
LOCAL PRECEDENCE
NAT i ONAL LEADERS
RESOURCES & FUND i NG OPPORTUN i T i ES
KEY STAKEHOLDERS
• Linn County Food Systems Council
• iGreenCR Goal 4: Increase food health and availability
• Food Policy Action Plan, Asheville, NC
• Healthy Food Access, City of Milwaukee, WI
• Food pantries in Cedar Rapids
• Local nonprofits and community-based organizations, faith institutions, neighborhood organizations, schools and higher education institutions, government agencies, immigrant farmers
DEPARTMENT LEAD + SUPPORT Parks & Recreation + City Manager’s Office, Community Development
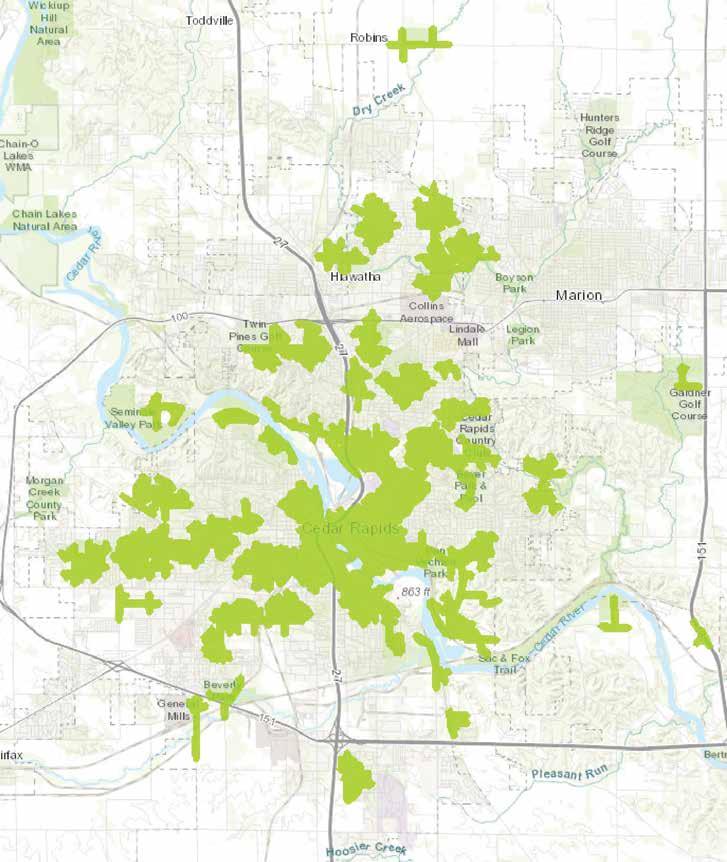
Park access of 0.5 miles or less for parks at least 1 acre in size
Source:
Existing Conditions:
• The City manages over 4,171 acres of parks and green space
• Park access is greater closer to the urban core than the newer sections of Cedar Rapids
• Cedar Rapids lost 65% of its tree canopy during the August 2020 derecho Co-Benefits
• Carbon sequestration through increased vegetation (Objective 1D)
• Improved air quality with more trees (Objective 2D)
Public Input:
Planting trees for increased shade was identified as the top priority by survey participants. In Survey 1, 36% of students reported that their families would not be completely prepared for several days over 100°F.
“Repopulating our City with trees and green spaces should be top priority. Investing in bike and walking trails connecting parks to neighborhoods making it easy to access parks.”
Vulnerable neighborhoods have 15-minute walkable access to amenity-rich parks via tree-lined corridors.
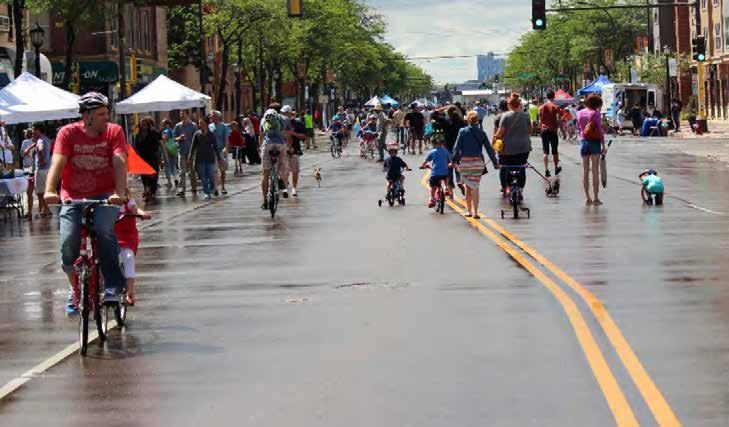
Support conversion of underutilized hard infrastructure (parking lots, roofs, underpasses) to support gardens, cooling features, and active programming (Resilience Hubs, markets, recreation).
Increase amenities in underresourced neighborhoods
i M PACT
Increase natural spaces, reduce urban heat island effect
Increase economic resilience, real estate values
Changing the use of underutilized infrastructure to create public spaces is cheaper than intensive construction and can drive local economic benefits
T i MEL i NE 2-3 years
• UFG Pocket Plaza
• Matthew 25 garden
LOCAL PRECEDENCE
NAT i ONAL LEADERS
RESOURCES & FUND i NG OPPORTUN i T i ES
KEY STAKEHOLDERS
DEPARTMENT LEAD + SUPPORT
• 1,000-acre Pollinator Initiative
• ReZone
• Expand and improve public space in the urban core, New York Regional Planning Association
• The Underline, Miami, FL
• American Planning Association’s Review of Underpass-to-Park Conversions
• Innovative ways to create more urban green spaces, Project Living Tree
• Parklets guide, National Association of City Transportation Officials
Government agencies, non-profits, school districts, property owners
Community Development + Public Works, Parks & Recreation
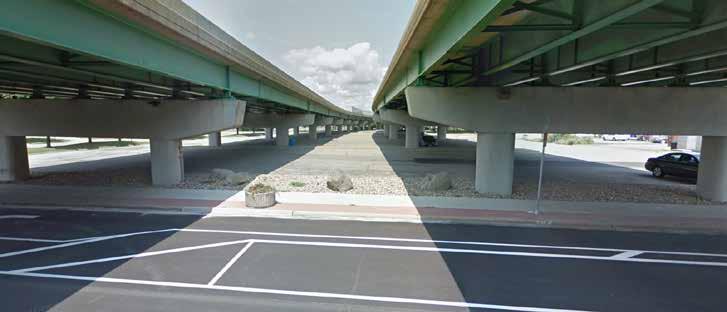
The August 2020 Derecho damaged every corner of our 75 square mile city, and impacted every resident in some way. It was the most costly thunderstorm in U.S. history.
Source: The National Oceanic and Atmospheric Administration
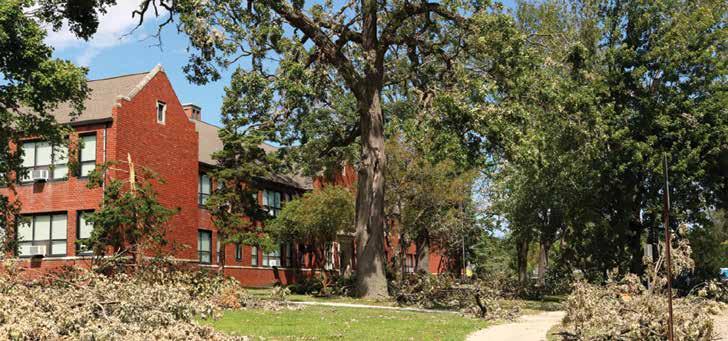
Implement the city’s ReLeaf program, supporting vulnerable neighborhoods with air and heat pollution challenges.
EQU i TY
Increase tree canopy in low-coverage communities, improve mental health
i M PACT
ENV i RONMENT
Improve air quality and ecological functions; increase habitat for wildlife, carbon sequestration
ECONOMY
Increase jobs in forestry, reduce energy costs with trees to provide shade and reduce wind
• Trees placed near buildings can reduce air conditioning needs by 30% and reduce energy use for heating 20-50%
• The Cedar Rapids Tree Equity Score is lowest in the urban core (39) and highest (100) in many of the surrounding neighborhoods
• Trees have the greatest impact filtering air pollution within 30 meters of the source (e.g., highway)
T i MEL i NE Within 1 year
LOCAL PRECEDENCE
NAT i ONAL LEADERS
RESOURCES & FUND i NG OPPORTUN i T i ES
KEY STAKEHOLDERS
• ReLeaf
• City forestry
• Street Tree Interactive Map, Eugene, OR
• Urban Tree Nursery Program, Savannah, GA
• Reforestation Hub, World Resource Institute
• Urban Drawdown Initiative and carbon credits
Businesses, residents, neighborhood organizations, large institutions, non-profits
DEPARTMENT LEAD + SUPPORT Parks & Recreation
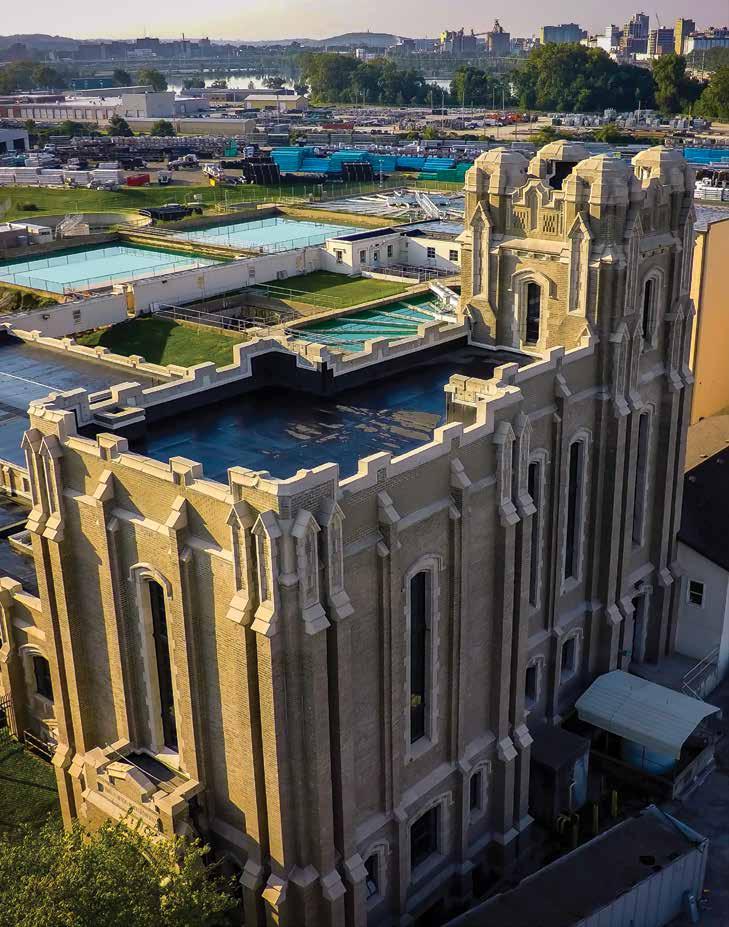
The 1930 J Avenue Water Treatment Plant has undergone many expansion and renovation projects over its 90+ years as the community has grown and water treatment methods have improved. Ongoing investments ensure the city has safe, reliable water for years to come.
Existing Conditions:
• The City consistently achieves federal clean drinking water standards
• Asthma is most prevalent along arterial roads Co-Benefits
• Enhanced resilience from public health benefits (Objective 2A)
• Improved access to basic needs (Objectives 2B, 2C)
Cedar Rapids is trusted for excellent air and water quality
Public Input:
“I think our city should continue to be passionate about water quality and using nature’s resources to keep the supply clean.”
“The water quality and air quality are already good and need to be protected.”
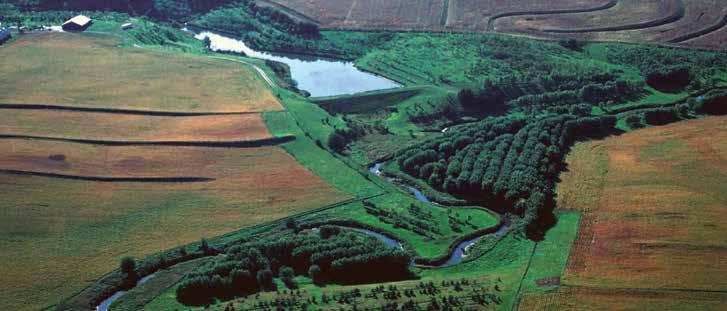
Densely vegetated waterways tucked between agricultural fields in western Iowa showcase opportunities to integrate green infrastructure, improving water and soil quality and sequestering carbon.
Protect water quality by supporting source water protection initiatives and existing watershed partnerships that reduce nutrient-rich runoff into the Cedar River.
Protect residents most vulnerable to water quality changes
i M PACT
Improve water quality, reduce erosion, sequester carbon, solar and pollinator habitats co-benefit
Diversify income for farmers, increase jobs in green infrastructure
• Riparian buffers have the capacity to remove up to 50% of nutrients and 75% of sediment
• Stormwater bets practices capture carbon and support wildlife
T i MEL i NE In-progress
• Cedar River Source Water Partnership to improve water quality
LOCAL PRECEDENCE
NAT i ONAL LEADERS
RESOURCES & FUND i NG OPPORTUN i T i ES
KEY STAKEHOLDERS
DEPARTMENT LEAD + SUPPORT
• Partnership with Soil and Water Outcomes Fund to reduce nutrients and sequester carbon
• Middle Cedar Partnerships Project
• Forthcoming Sourcewater Protection Plan and MS4 Permit
• Iowa Nutrient Reduction Strategy, Iowa DNR
• EPA Water Finance Center Case Studies
• Benefits of solar-integrated agriculture, Great Plains Institute
• Natural Resource Conservation Service, USDA
Farmers, non-profits, watershed management authorities, state and federal government
Utilities + Public Works
Support stormwater BMP cost-share and ERU reduction programs on large properties.
Increase resilience in vulnerable neighborhoods
i M PACT
T i MEL i NE
LOCAL PRECEDENCE
NAT i ONAL LEADERS
RESOURCES & FUND i NG OPPORTUN i T i ES
KEY STAKEHOLDERS
DEPARTMENT LEAD + SUPPORT
Reduce impervious coverage, improve ecological function
• Benefits of green infrastructure:
Increase infrastructure jobs, decrease stormwater fees
• Porous landscapes (e.g., forests, prairies) can soak up to 90% of rainfall
• As much as 75% of rainfall that lands on a rooftop can be captured on-site and repurposed
• The life expectancy of a green roof is twice as long as a regular roof
• A typical rain garden is 30% more absorbent than a conventional lawn
• Bioswales can filter out as much as 90% of trace metals, oils, and grease; 70% of sediment; and almost 30% of phosphorus from stormwater runoff
Within 1 year
• Cedar Rapids Stormwater Master Plan
• Cedar Rapids Stormwater Program
• Stormwater management practices and EPA facilities
• Shared stormwater system design, Mississippi Watershed Management Organization
• Localized flood map tool, Metropolitan Council
Eastern Iowa Airport, large property holders
Public Works + Development Services, Utilities
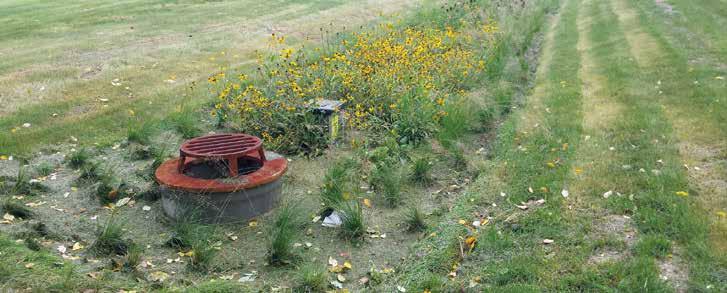
Existing Conditions:
• There are approximately 6,784 green jobs in Linn County
• Wind energy makes up the largest share of clean energy jobs in Iowa (3,909)
• Current median household income is $58,511
• 12.5% of Cedar Rapids live below the federal poverty line
Co-Benefits:
• Reduction in carbon emissions, particularly from advancement of green industry and technologies (Objective 1A)
Public Input:
“I think that we need to encourage all jobs to help with the environment. I especially feel that teachers need to have programs that emphasize the importance of a community climate action plan and have students assist in these areas having more project learning based opportunities.”
“Climate action has the power to both reduce emissions, but also create jobs and equity in our community. In this way it can be very transformative.”
High-wage green jobs and a more sustainable local economy support plan implementation
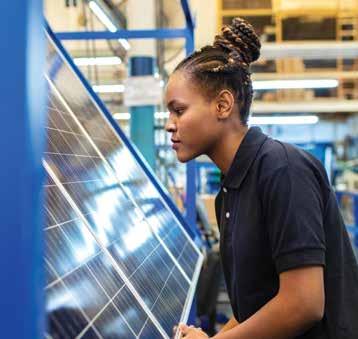
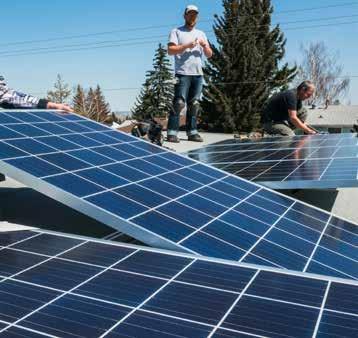
Complete and implement a green economic development plan, identifying green jobs, community strengths, and programs for equitable business and workforce development.
Provide training and opportunities for high-wage green jobs
i M PACT
Reduce GHG emissions, reduced energy, increased resilience
Increase green jobs, retain local talent
• Iowa has 5,000 jobs in wind, 1,000 in solar, and 18,000 in energy efficiency
• 80% of recent college graduates are “very” or “extremely” interested in gaining jobs that feel purposeful, yet only 50% achieve this work
T i MEL i NE 2-3 years
LOCAL PRECEDENCE
NAT i ONAL LEADERS
RESOURCES & FUND i NG OPPORTUN i T i ES
KEY STAKEHOLDERS
DEPARTMENT LEAD + SUPPORT
City Manager’s Office (Sustainability + Economic Development) EQU i TY
• Energy Production and Distribution Technology program, Kirkwood Community College
• The Cleveland Model to build community wealth
• Policies for Community Wealth-Building, Democracy Collaborative
• Bureau of Labor Statistics Green Jobs Definition
• Vancouver Economic Commission, Green and Local Food Jobs
• Annual U.S. Energy & Employment Report, U.S. Department of Energy
Government agencies, colleges, schools, non-profits
Expand sustainability support and expectations in purchasing, contracts, and development to support circular economy, local buying, and cooperative buying.
Contract with small, local, and/or minority-owned businesses
i M PACT
Reduce waste
Build local wealth
• City wide waste emissions can be reduced by 33% by 2030 through reduction, compost, and recycling strategies
• U.S. cities purchase $1.72 trillion of goods and services annually together, these purchases create a carbon footprint nine times greater than city buildings and vehicle fleets combined
T i MEL i NE 2-3 years
LOCAL PRECEDENCE
NAT i ONAL LEADERS
RESOURCES & FUND i NG OPPORTUN i T i ES
• Buy Local Policy
• Sustainable Purchasing Guidelines
• City of Seattle Sustainable Purchasing Policy, Seattle, WA
• Sustainable Procurement Policy, Raleigh, NC
• The Cleveland Model, Cleveland, OH
• Developing a sustainable purchasing policy, Minnesota Pollution Control Agency
• Sustainable Purchasing Leadership Council
KEY STAKEHOLDERS Businesses, non-profits, schools, local unions
DEPARTMENT LEAD + SUPPORT City Manager’s Office (Sustainability) + Finance, Public Works, Utilities
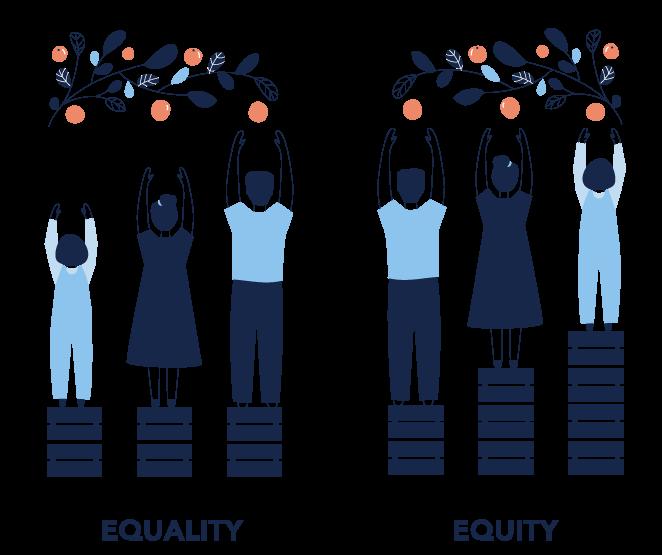
Existing Conditions:
• Cedar Rapids tracks and reports outreach efforts
• The City has more than two dozen commissions citizens can participate in
• The Rollin’ Recmobile has reached engages 13 neighborhoods through the summer
• Ground Teams help to reach deeper into underrepresented communities
2030 V i S i ON:
Co-Benefits:
• Enhance community resilience (Objective 2A)
• Improved access to basic needs (Objectives 2B, 2C)
• Support green economic development (Objective 2E)
Public Input:
“The city should prioritize equitable engagement and outcomes and working closely with environmental organizations who are already integrated into the community could be a good way to do this.”
Community members are active in implementation through equitable engagement that is inclusive of all residents
Operationalize the equitable engagement toolkit to reach more under-resourced and under-represented residents.
EQU i TY
Inclusive engagement and decision-making
i M PACT
Increase public environmental awareness and action
Increase learning and connections among all residents
• 9,658 Cedar Rapids residents live in the priority neighborhoods of Wellington, Oakhill Jackson, and Taylor
• Equitable and inclusive engagement ensures those most impacted by policy decision have a say in those decision
T i MEL i NE In Progress
LOCAL PRECEDENCE
NAT i ONAL LEADERS
RESOURCES & FUND i NG OPPORTUN i T i ES
KEY STAKEHOLDERS
DEPARTMENT LEAD + SUPPORT
• Rollin’ RecMobile
• Public Engagement Opportunities
• Public Participation and Resource Guide, Madison, WI
• City of Everett, Washington Mayoral Directive on Community Engagement and Inclusion
• Guide to Equitable Community-Driven Climate Preparedness, USDN
• Our Power, Our Communities Toolkit, NAACP
• Streetwyze engagement platform
Neighborhood leaders, non-profits, BIPOC residents, social service organizations
Community Development + City Manager’s Office, Public Works
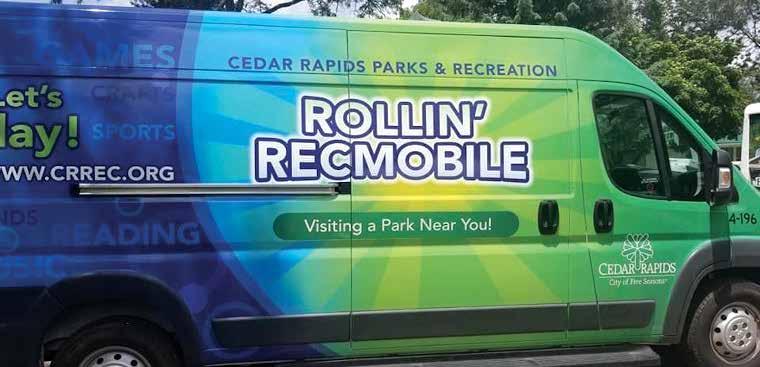
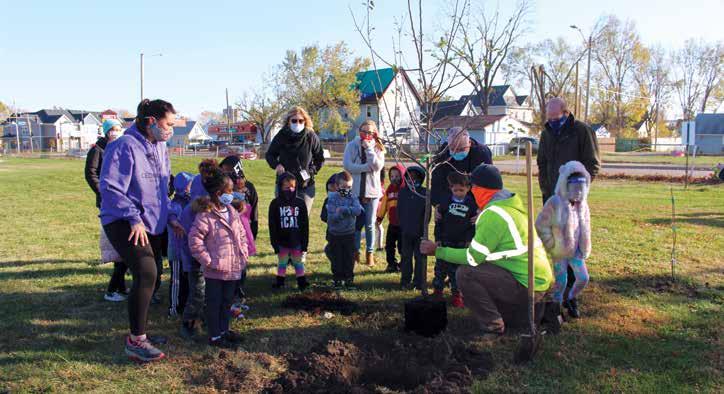
Establish City-student partnerships to engage youth in plan implementation.
EQU i TY
Diverse student participation
i M PACT
ENV i RONMENT ECONOMY
Increase public environmental awareness and action
16,294 students attend Cedar Rapids Schools
New generation of climatefocused workforce
Students, staff, and community volunteers from the school district participate in Green Teams
T i MEL i NE 2–3 years
LOCAL PRECEDENCE
NAT i ONAL LEADERS
RESOURCES & FUND i NG OPPORTUN i T i ES
• Municipal Volunteer Program
• Collaborations with local schools and colleges
• Climate Justice Advisory Committee (youth requirement), St. Paul, MN
• Climate Action Committee (youth requirement), Albany, CA
• Governments Engaging Youth Toolkit , Institute for Local Government
• Youth in Planning Task Force, American Planning Association, Washington Chapter
KEY STAKEHOLDERS K-12 schools, colleges
DEPARTMENT LEAD + SUPPORT
City Manager’s Office (Sustainability) + Community Development

Successful implementation of this plan will require allhands-on deck from city to community
i .MA i NTA i N SUCCESSFUL PLAN i MPLEMENTAT i ON
ii .CONT i NUE TO BU i LD MOMENTUM AND OUTREACH FOR COMMUN i TY CL i MATE ACT i ON, PR i OR i T i Z i NG VULNERABLE RES i DENTS
The Community Climate Action Plan is embedded across city programs, functions, and services
National Leaders:
• Greenest City Action Plan - an approach to involve residents, businesses, organizations, and all levels of government to implement the plan, Vancouver, BC, CA
• Fort Collins Municipal Sustainability & Adaptation Plan
Integrate Community Climate Action Plan priorities into city decision-making and existing plans.
Align the iGreenCR Action Plan, the City’s municipal sustainability plan, with the Community Climate Action Plan.
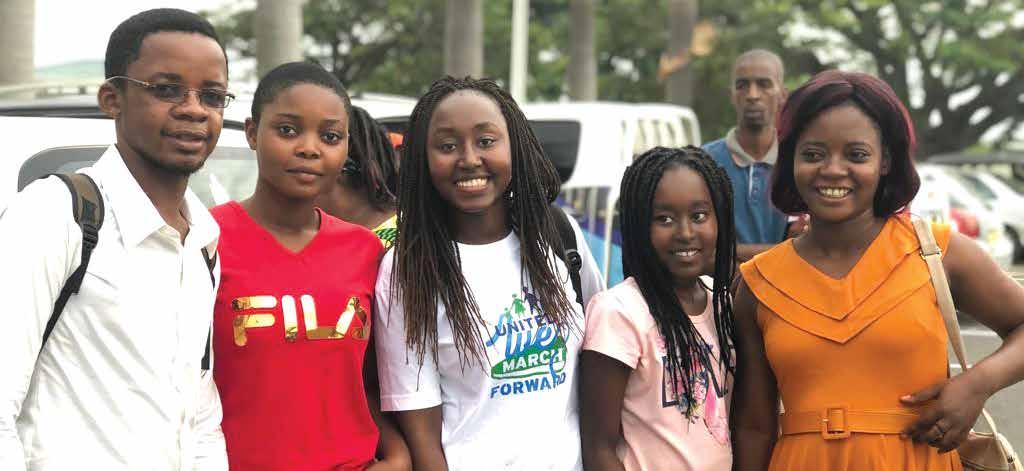
2030 V i S i ON:
Momentum for the CCAP continues to build through shared successes and meaningful engagement
Examples/Models:
• The A2Zero landing page includes progress updates, plan information, and an opportunity to pledge to support the plan, Ann Arbor, MI
• Climate Dashboard, San Francisco, CA
Create a process for tracking, sharing, and regularly reporting upon success.
Create regular outreach opportunities in education, volunteering, and recognition.
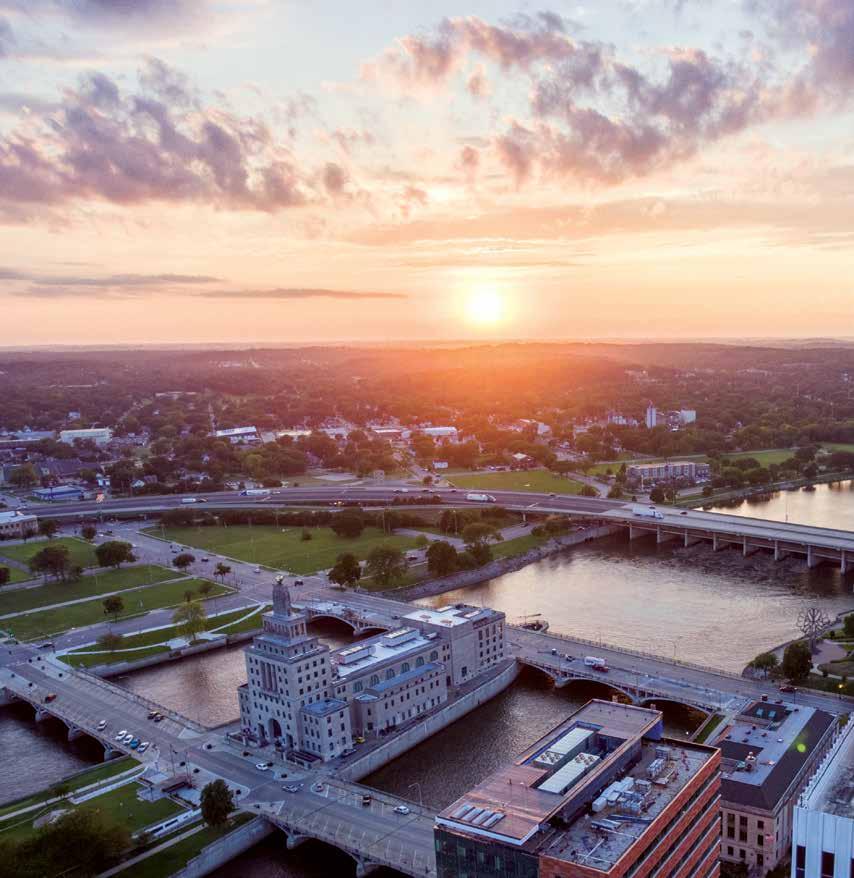
The City of Cedar Rapids is committed to doing its part to limit global warming and avoid the worst effects of a changing climate. This will take a community effort, where every resident, business, and institution plays a role in reducing emissions and strengthening resilience to ensure everyone benefits from an improved quality of life, especially our most vulnerable.
While achieving the goals of this plan will be a great challenge, it is also a momentous opportunity to shape our community into one where everyone has access to basic needs, healthy food, active living, and prosperity. Cedar Rapids will move forward together.