2015 Annual Report
POWER Investigators
• Ron Stall, University of Pittsburgh
• Lisa Eaton, University of Connecticut
• Patrick Wilson, Columbia University
• Derrick Matthews, University of Pittsburgh
• Earl Fowlkes, Center for Black Equity
• Henry Raymond, SFDPH
Epidemiological Background:
CDC Surveillance in 2010
• 69% of people living with HIV in the US are MSM
• 47,500 Americans were infected with HIV in 2010, 78% (38,000) of these new infections occurred among MSM
• 10,600 new infections in 2010 occurred among BMSM
• 22% of the entire burden of new cases in the US in 2010 occurred among BMSM
o A disproportionate number of these cases occurred among very young men (38% aged 13-24 among all Black males)
HIV Risk among BMSM
• HIV prevalence and incidence among BMSM are higher than for any other other group of US citizens
• But traditional HIV risk-taking behaviors are lower than found among most other MSM communities.
• If “risk behaviors” don’t explain new HIV infections, then what does?
• And if we don’t understand what is driving new infections among BMSM, how do we prevent them?
Samuel, et al., 1987, JAMA
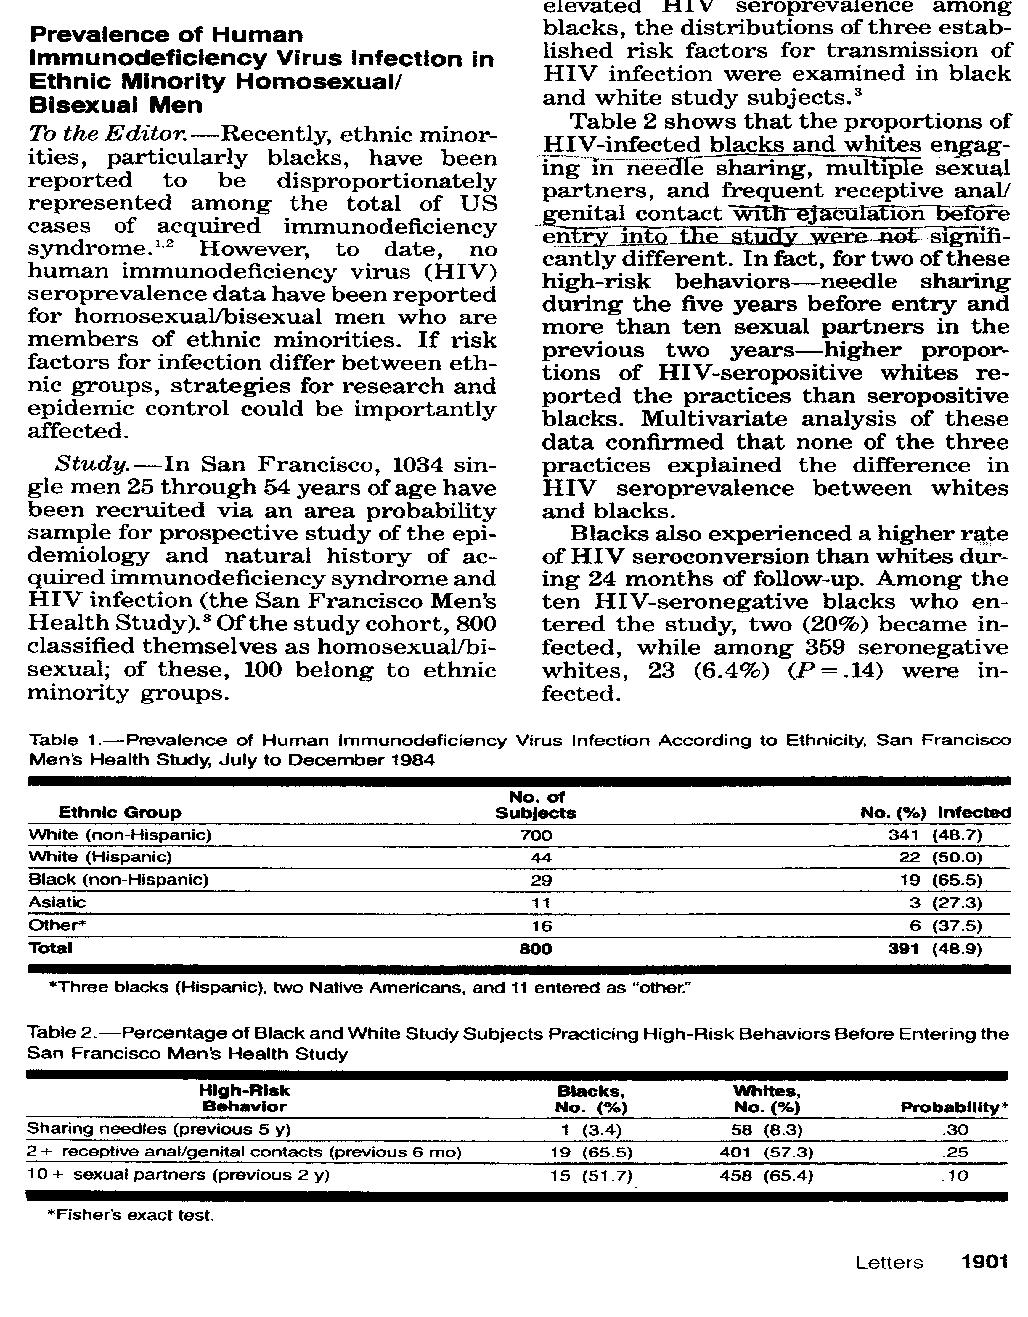
“established risk factors for HIV infection…do not explain the differences in HIV seroprevalence or seroconversion rates between blacks and whites.”
Greg Millett’s Answer to this Puzzle
• Delayed HIV testing
• Unknown HIV status
• Lower rates of uptake of HAART among diagnosed HIV positive BMSM
• Higher background rates of STIs High risk of infection for
High rates of unknown and untreated
POWER Aims
1. Measure the rates of HIV testing and identify the factors associated with testing among BMSM
2. Describe unknown HIV positive BMSM and identify the factors associated with an unknown positive status
3. Measure access to care among HIV+ BMSM
To what extent can we use existing data sets to address these aims?
Not very well:
• Traditional sampling methods yield small samples of BMSM:
o National sample, US (3922 men, 11 BMSM)
o Urban gay men (2881 MSM, 144 BMSM)
o Internet sample (609 MSM, 104 BMSM)
Treatment Cascade Studies Require Large
Numbers of BMSM
• Millett, et al., 2011, JAIDS
o 1154 BMSM from the Brothers y Hermanos study
o Compared BMSM who did not know that they were HIV+ and HIV- BMSM
o Although they detected significant differences between groups, they warned that results
should be “…interpreted with caution” due to the small sample of HIV+ BMSM.
How will large samples allow us to address POWER’s aims?
Aim 1: Measure the rates of HIV testing and identify the factors associated with testing among BMSM
Expected rate of identifying as HIV- or unknown status
Expected rate among men who identify as HIV-/unknown status who were last tested >6 months ago
Aim 2: Measure the rates of HIV testing and identify the factors associated with testing among BMSM
Aim 3: Measure access to care among HIV+ BMSM
Traditional
sampling methods cannot be used to address the hypotheses that Millett proposed to explain disparities in HIV/AIDS epidemiology among BMSM
So Why Don’t We Sample BMSM Where
They Already Gather?
That is the core idea of POWER—to survey BMSM at Black Pride Events
Black Pride as a Social Movement
• The Black Pride movement began in 1990 as a single event in Washington, D.C.
• That one event grew to become a national Black Pride movement
o Formally-organized events in 39 cities across the US
o Provides a safe space for members of Black LGBT communities to celebrate the duality of being both Black and LGBT
• The Center for Black Equity estimates that in 2010 nearly 200,000 people attended Black Pride events across the US
Study Overview
• Collect data from ~6000 BMSM aged 18+ over the course of 3 years
• Meet men where they’re at—Black Pride events
• Recruit at multiple and different prides and pride events to increase diversity
o Small and large cities
o Northern and southern cities
o Club events and health fairs
o Expensive events and free events
o Male-focused events and mixed gender events
Study Overview
• Use a form of time/location sampling so that participants have to be selected in order to participate
• Participation is anonymous
• Collect behavioral data with a 20-30 minute survey on a tablet computer o Compensate $10
• Offer HIV testing through local community based organizations and POWER
o Compensate an additional $10
Approach to Sampling
• Time/location sampling approach
• First order of randomization is to sample time slots and events that occur during a Black Pride weekend in a specific city
• Second order of randomization is the recruitment of men who attend specific time/event windows during a Black Pride weekend
Participant Selection
•
48 events in 6 cities


Time Location Sampling: Venues/Time Selection
• From all possible Black Pride events in each city, we randomly select sampling venues/times in 2hour blocks
Club Aura
Attendance: 200
April 24th
10 -2am Diary of a Legend: Mini Ball Deluxe Attendance: 400+ 7pm-1am
Club Voyeur Attendance: 400+ 11-3am
April 25th
Location TBA Attendance: 400+ 10-4am
April 26th
Social Sunday: Day Mingle Attendance : 200+ 5pm-9pm
Frank Bradleys
Attendance: 200+ 10-2am
Sampling Events for Philadelphia Black Pride: Recruitment Goal of 415 BMSM
Club Aura Attendance: 200 10 -2am Sampling: 10PM-12AM Club Voyeur Attendance: 400+ 11-3am Sampling: 11PM-1AM Location TBA Attendance: 400+ 10-4am Sampling: 10PM-2AM Social Sunday: Day Mingle Attendance : 200+ 5pm-9pm Sampling: 5PM7PM
Frank Bradleys
Attendance: 200+ 10-2am Sampling: 10PM2AM
Time Location Sampling: Establishing Intercept Zone
Time Location Sampling: Participant Recruitment
• Principle: Count every person entering intercept zone; men counted should approximately be the men that could have been sampled
• Practice:
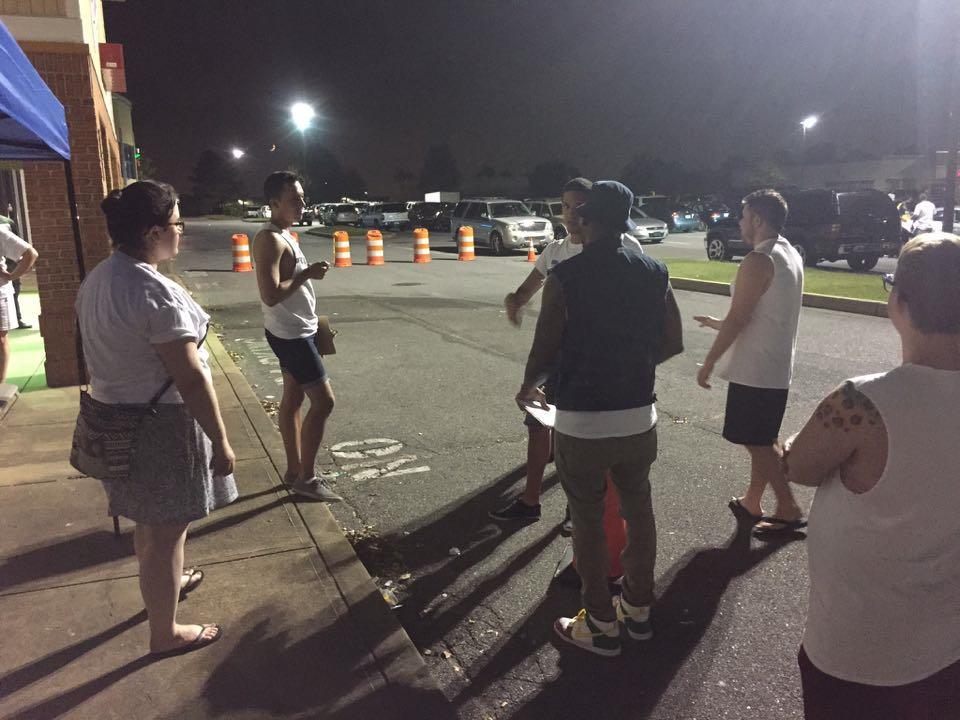
o Enumerator counts every person entering intercept area
o Recruiters consecutively approach enumerated persons
o Recruiter introduces study, assesses interest, assesses eligibility, enrolls subject
o When all recruiters and tablets are occupied, enumerator continues to count
o When recruiter and tablets is again available, intercepts resume
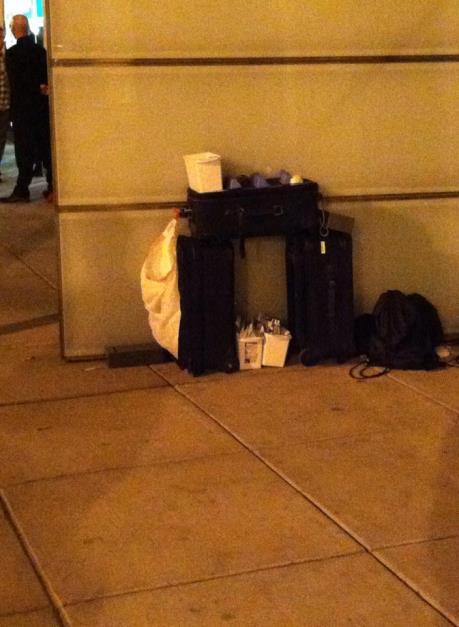
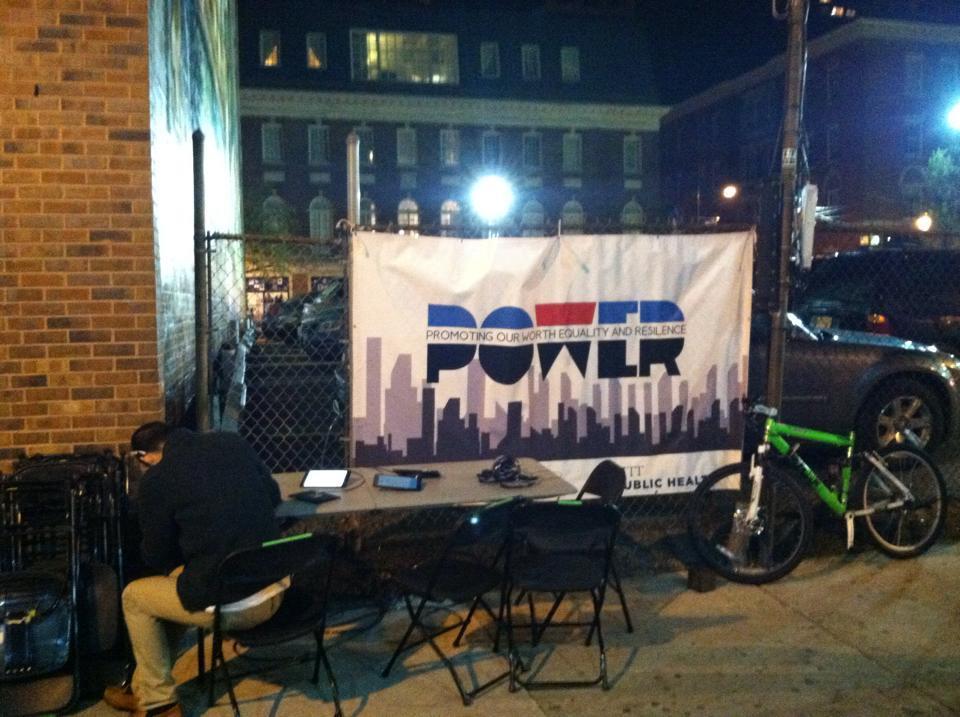
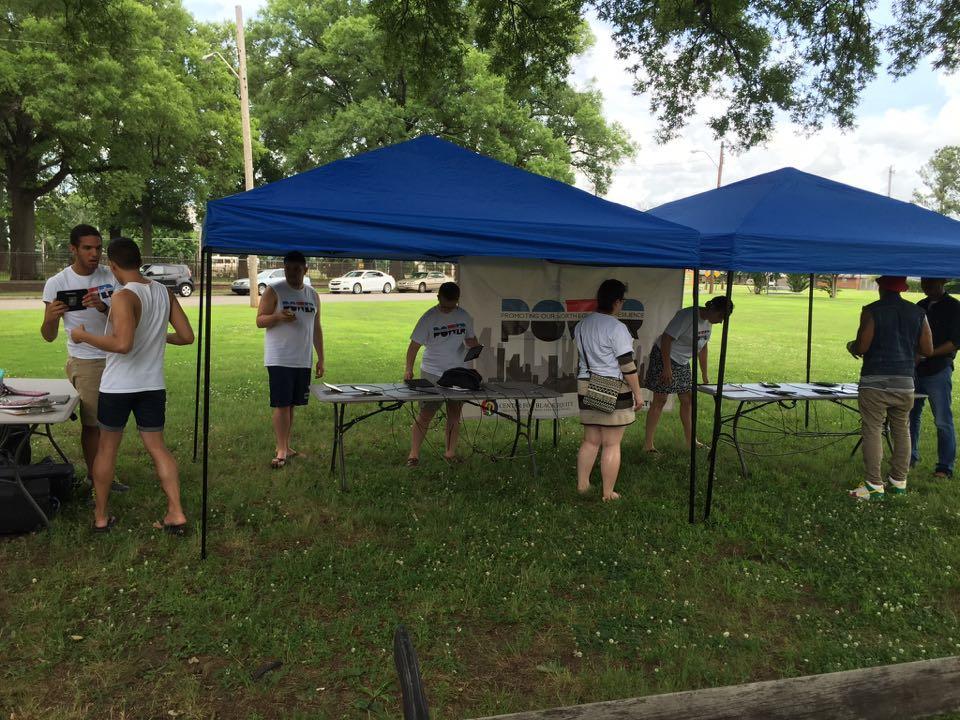
Establishing Intercept Zone in a Real World Setting
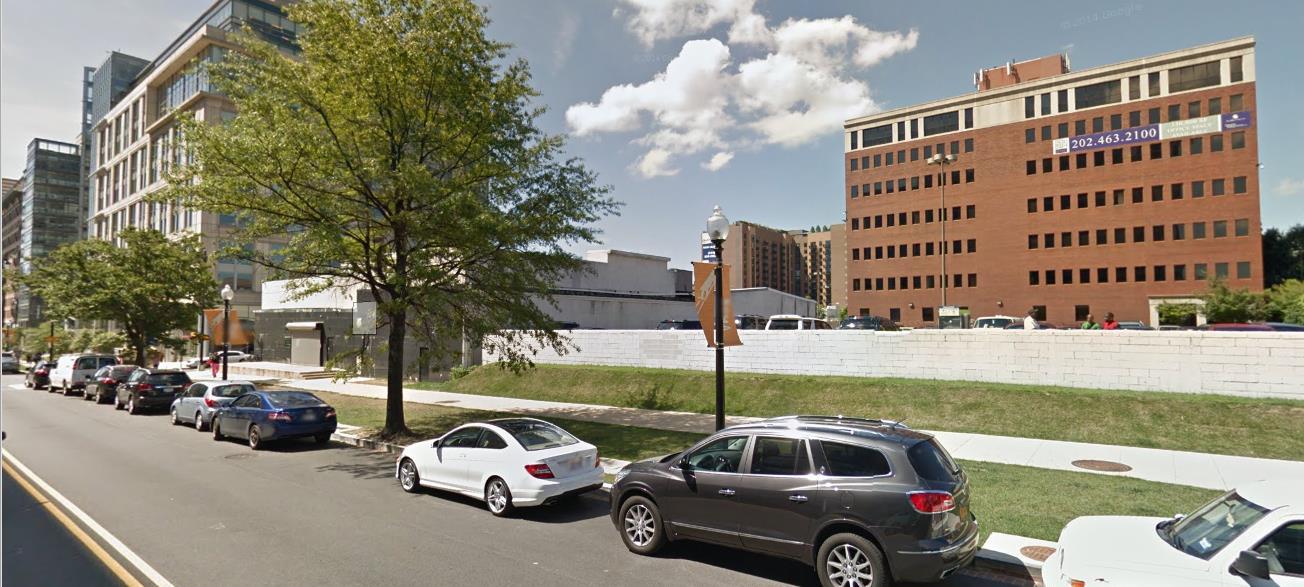
Venue Entrance
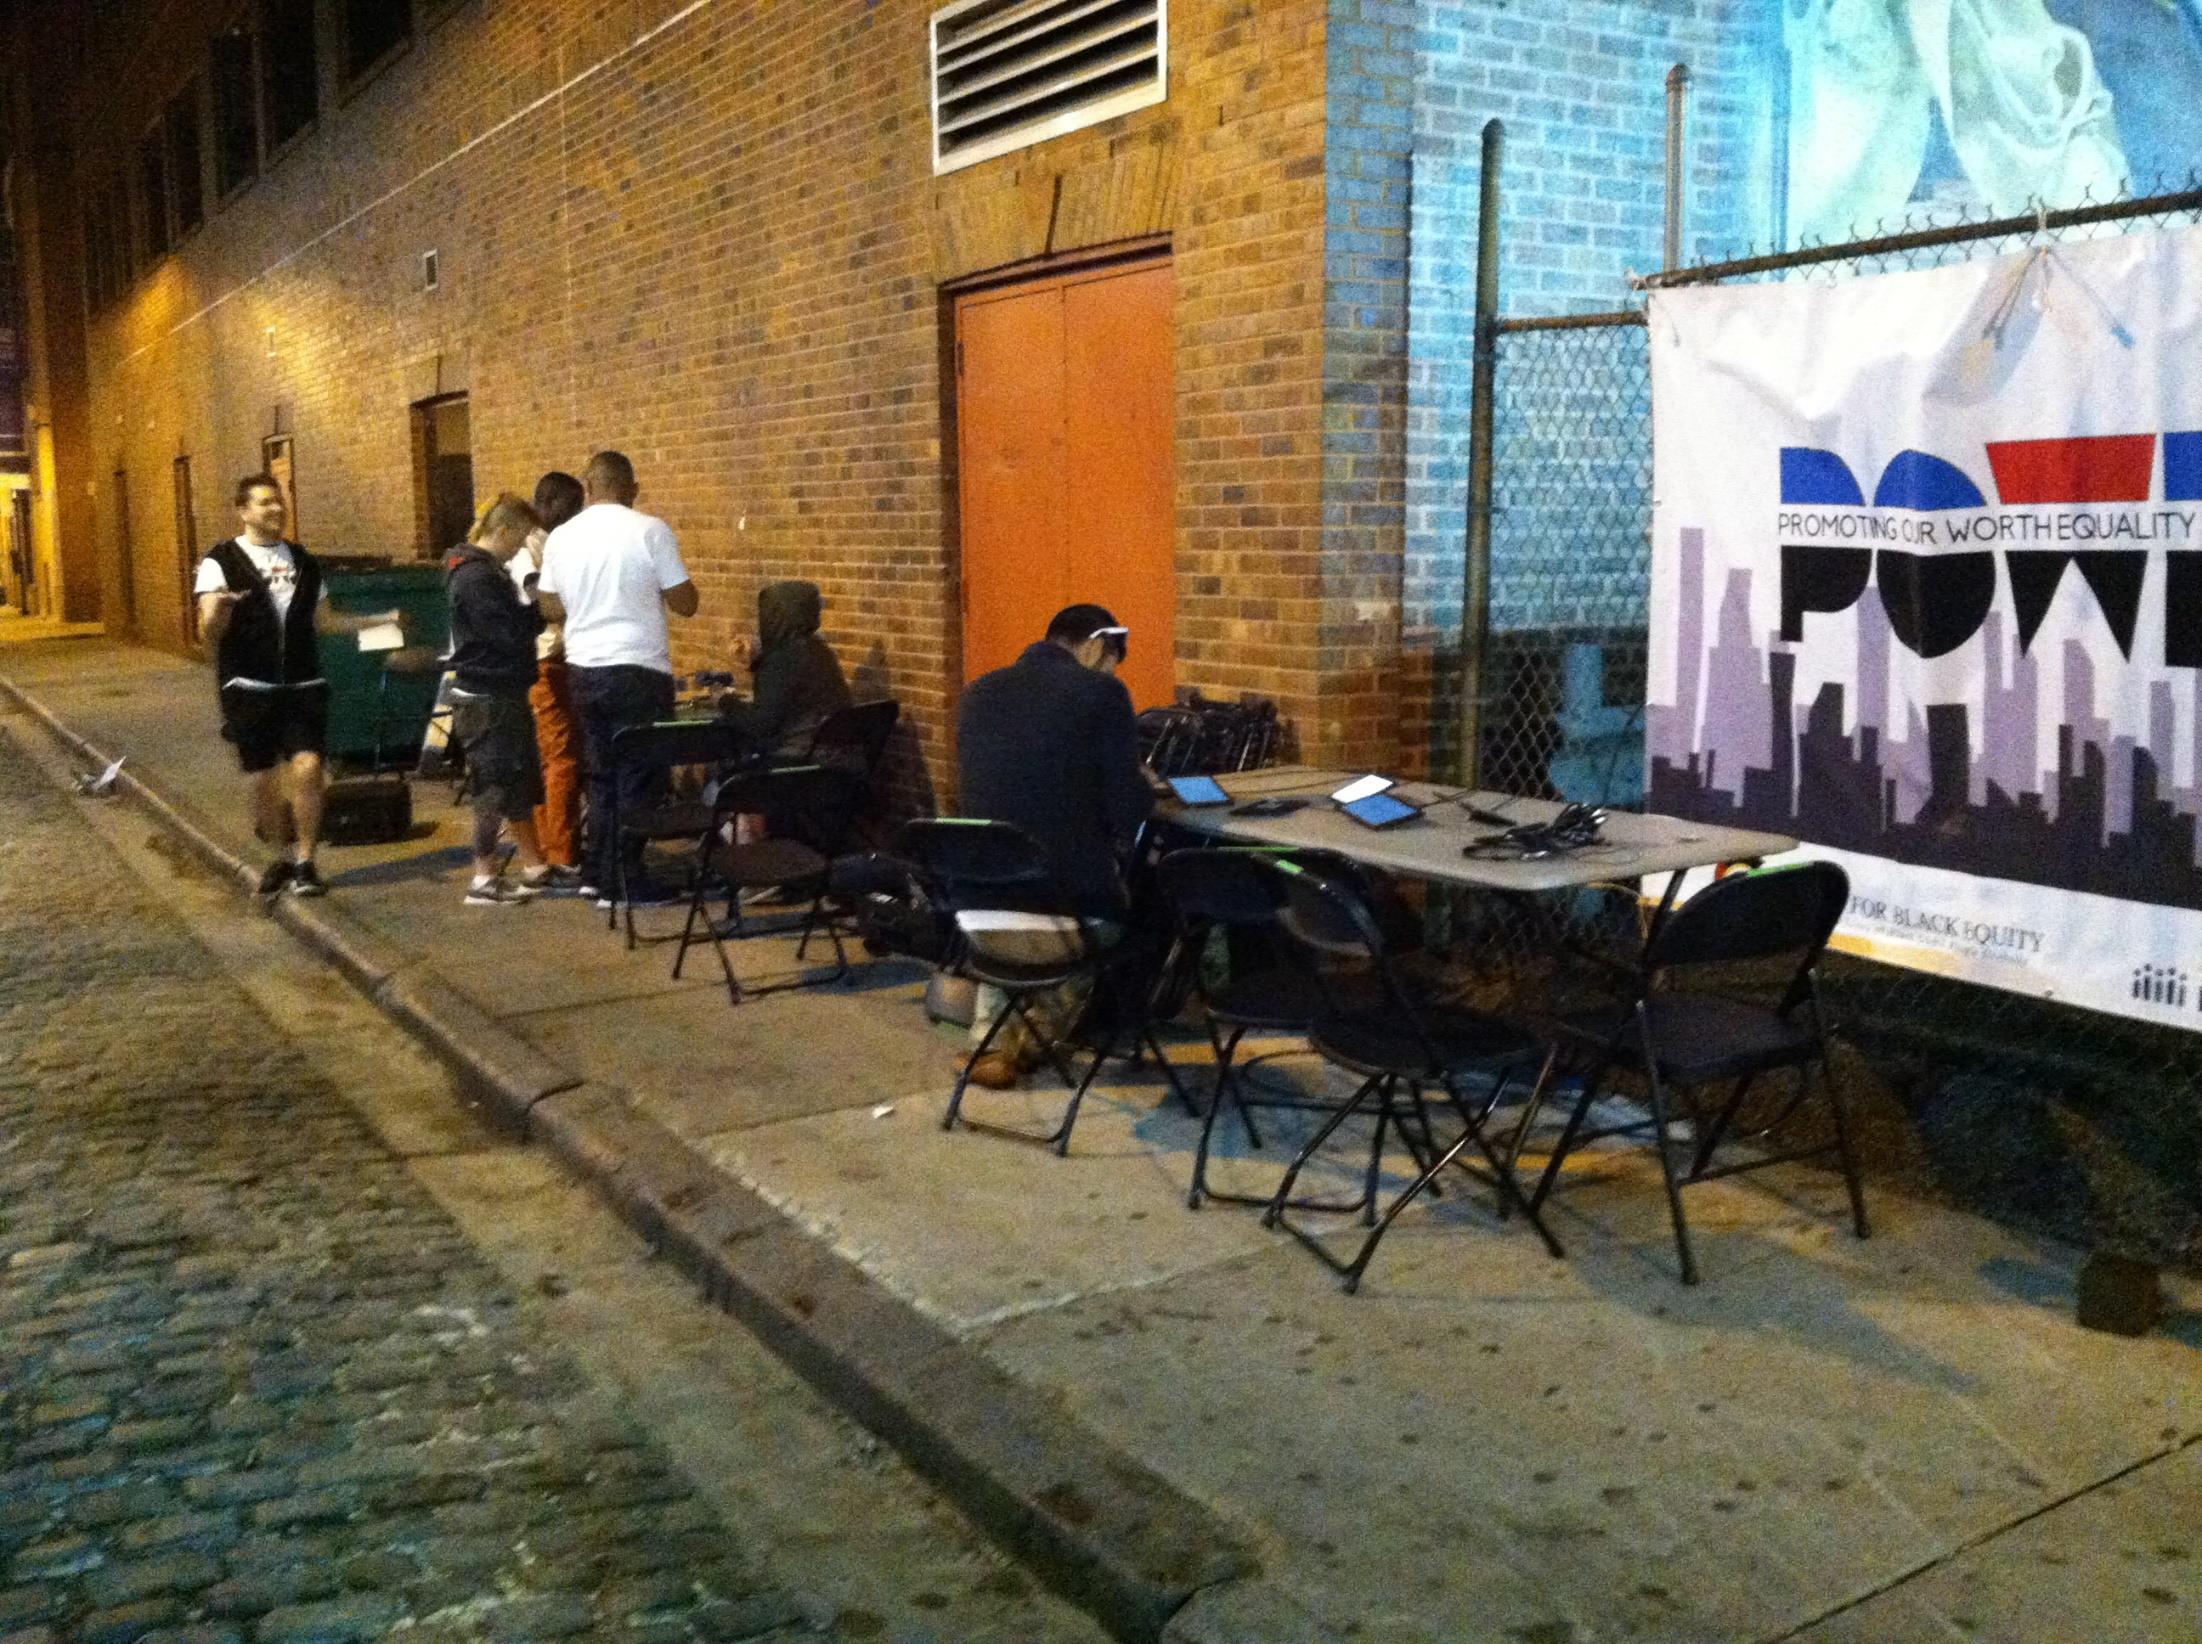
Behavioral Health Survey
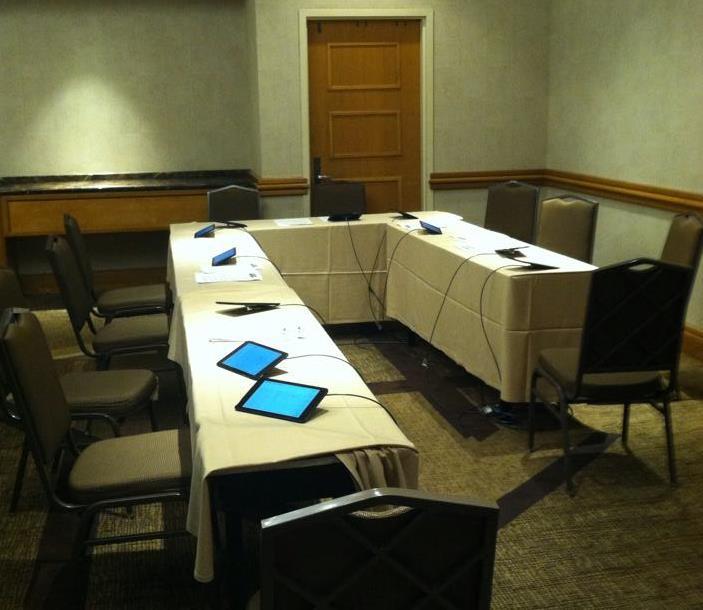
• Self administered using QDS software on Dell Venue Pro tablets
• ~20 minutes to complete
• Participants compensated $10

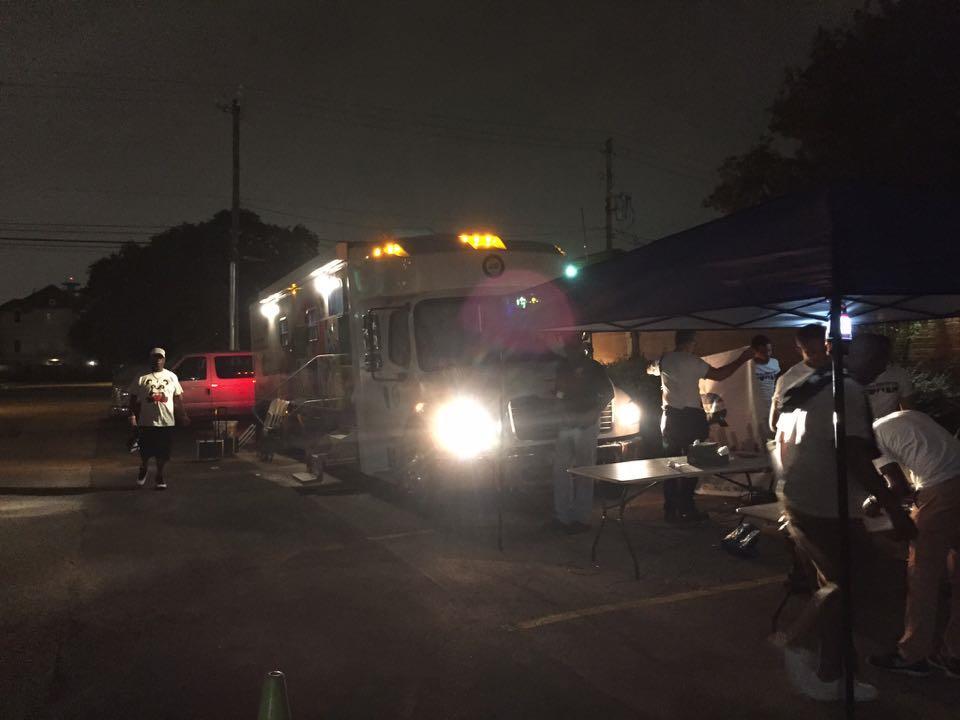
Confidential HIV Testing
• Performed by local CBOs
• No changes were made to CBOs usual HIV testing procedures
• Participants received their test result and $10
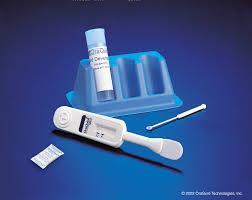
Anonymous HIV testing
• Performed by POWER
mouth swab
using OraQuick
• Participants did not receive their test result, but did receive $10
Participant Selection 2014 & 2015
35,051 Potential participants crossed into the intercept zone
7,705 Approached and asked if they would like hear about POWER
7,102 Agreed to Hear about POWER

3,726 Agreed to take the survey and were screened for eligibility
3,597 Completed the survey
2,827 Received HIV test
1,764 w/ POWER 1,063 w/ CBO
Besides HIV Risk Behaviors, what does
POWER measure?
• Multiple health conditions to collect data on health in general
o Syndemic variables
Substance use Depression Violence/victimization
o Resiliencies
Social support
Community support
• Sample sizes will allow us to describe understudied groups of BMSM:
o Rural men
o Men who identify as heterosexual
o Older men
Study Population POWER eligibility criteria:
1. Assigned male sex at birth
2. Currently identify as male, female, transgender, or reported having transitioned from male to female
3. Reported having a male sexual partner in their lifetime
4. 18 years or older
Study Population(s)
3,597 Completed the survey
3,426 Identified as “Black” or “African American”
3,234 Identified as male
192 Identified as female or transgender
Results: BMSM
3,597 Completed the survey
3,426 Identified as “Black” or “African American”
3,234 Identified as male
192 Identified as female or transgender
Descriptive Statistics among BMSM
Descriptive Statistics: BMSM
Demographics
Age
31.2 (range: 18-87)
Income
$0-,9,999: 20%
$10,000-29,999: 26%
$30,000 - 49,999: 26%
$50,000 - 69,999: 15%
$70,000 - 89,999: 8%
$90,000 and up: 5%
Education:
Less than high school: 7%
High school diploma: 19%
Some college: 37%
College diploma or more: 37%
Descriptive Statistics: BMSM
Demographics
Sexual self-identity
Gay: 80%
Heterosexual: 1%
Bisexual: 17%
Other: 2%
Ethnicity
African American: 91%
Caribbean American: 5%
African Immigrant: 1%
Other: 3%
Health care
Presence of coverage: 85%
Unable to access care: 20%
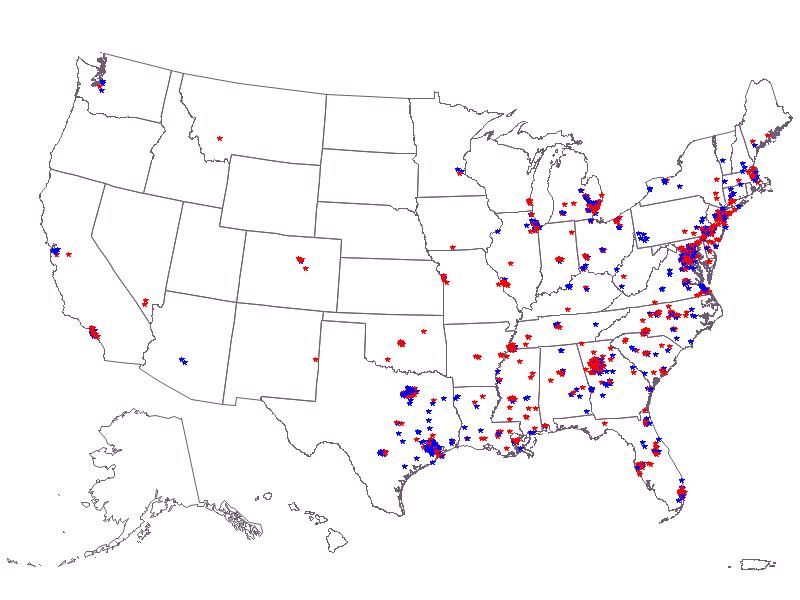
Where are BMSM from?
Descriptive Statistics : BMSM
Sexual Behavior
Sex w/ women
Lifetime: 48.5%
Past-year: 17.2%
75% of those who reported sex w/ a woman in the past-year reported condom use at last vaginal or anal sex
Descriptive Statistics : BMSM
Sexual Behavior
Sex w/ men
Past-year: 87.3%
Bottomed: 97.9%
Of those who bottomed, 56.8% reported using a condom half the time or more when bottoming, and 63.3% reported discussing HIV-status with a partner with whom they bottomed.
Topped: 96.7%
Of those who topped, 61.5% reported using a condom half the time or more when topping, and 65.0% reported discussing HIV-status with a partner with whom they topped.
Descriptive Statistics : BMSM
Psychosocial Outcomes Depression: 23%
Violence/ Victimization
Childhood Sexual Abuse: 24%
Intimate Partner Violence: 17%
Physical Assault: 14%
Perceived Discrimination
Race: 17%
Sexuality: 18%
HIV status: 5%
Descriptive Statistics : BMSM
Psychosocial Outcomes
Substance Use
Marijuana: 25% Nitrates: 8% Crack: 6%
Cocaine: 4% Heroin: 4% Methamphetamines: 3% Party
5% Poly-substance
5%
Descriptive Statistics : BMSM
Psychosocial Outcomes
Alcohol
Incarceration
Past two-years: 10%
Homelessness: 12%
Descriptive Statistics : BMSM
Resiliencies
Receive support from:
Family: 84%
Friends 89%
Church: 59%
Work: 75%
Gay community: 85%
Black community: 82%
People where I live are tolerant of gay and bisexual people: 72%
HIV Testing among BMSM
Rates of HIV Testing among BMSM
2,586 (80%) Accepted Testing



3,234 (100%) Offered Testing

648 (20%) Refused Testing

*Excludes self-reported/known positives
Research Question:
What factors are associated with having ever received an HIV test?
What factors are associated with having ever received an HIV test?


2,675*

*Individuals who did not identify as HIV-positive versus
What factors are associated with having ever received an HIV test?
Multivariable analysis were weighted according to time-location sampling and adjusted for:
• Sociodemographics
o Age
o Education
• City in which survey was completed
• Internalized homophobia
• Depressive symptomatology
What factors are associated with having ever received an HIV test?
Among individuals who did not identify as HIV-positive:
• Education was associated with increased odds of having ever received an HIV test
o AOR: 1.51; 95% CI: 1.33, 1.70
• Internalized homophobia was associated with reduced odds of having ever received an HIV test
o AOR: 0.75, 95% CI: 0.63, 0.90
Research Question:
Among individuals who did not identify as HIV-positive and who had never received an HIV test, what factors are associated with an assumption of HIV-positive status?
What factors are associated with assumption of HIV-positive status



What factors are associated with assumption of HIV-positive status
Multivariable analysis were weighted according to time-location sampling adjusted for:
• Sociodemographics
o Age
o Education
• City in which survey was completed
• Internalized homophobia
• Depressive symptomatology
What
factors are associated with assumption of HIV-positive status
Among those who did not identify as HIVpositive and who had never received an HIV test:
• Age was associated with an increased odds in assuming HIV-positive status
o (AOR: 1.05, 95% CI: 1.01 – 1.09)
• Health insurance was associated with a decreased odds in assuming HIV-positive status
o (AOR: 0.19, 95% CI: 0.07 – 0.52)
Research Question:
Among individuals who did not identify as HIV-positive, who had never received an HIV test, and who elected to receive and HIV test through they study, what factors are associated with an HIV-positive test result?
Never received HIV test


Tested through POWER
(28.0%) Received a positive test result

(72.0%) Received a negative test result
Did not test through POWER
*Though 202 (83.0%) received HIV testing through participation in POWER, most (n=107; 53.0%) elected not to receive their result. 57
What factors are associated with an HIV-positive test result?
202
Tested through POWER
What factors are associated with HIV-positive test result?
Multivariable analysis were weighted according to time-location sampling adjusted for:
• Sociodemographics
o Age
o Educaiton
• City in which survey was completed
• Internalized homophobia
• Depressive symptomatology
What factors are associated with HIV-positive test result?
Among individuals who did not identify as HIVpositive, who had never received an HIV test, and elected to receive a HIV test through POWER:
• Age was associated with an increased odds of an HIV-positive test result
o AOR: 1.07, 95%, 1.01 – 1.13
• Assumption of being HIV-positive was associated with an increased odds of an HIV-positive test result
o AOR: 6.60, 95% CI: 1.72 – 25.23
• Choosing not to receive HIV test result was associated with an increased odds of an HIVpositive test result
o AOR: 2.83; 1.18 – 6.79
HIV Prevalence among BMSM
HIV Prevalence among BMSM
952 (36%) Positive
2,672*

1,720 (64%) Negative
*Includes all self-reported positives and self-reported negatives who received an HIV test
HIV Infection Rates BMSM & Africa
Swaziland: 28%
Botswana: 25%
Lesotho: 23%
South Africa: 19% Zimbabwe: 17%
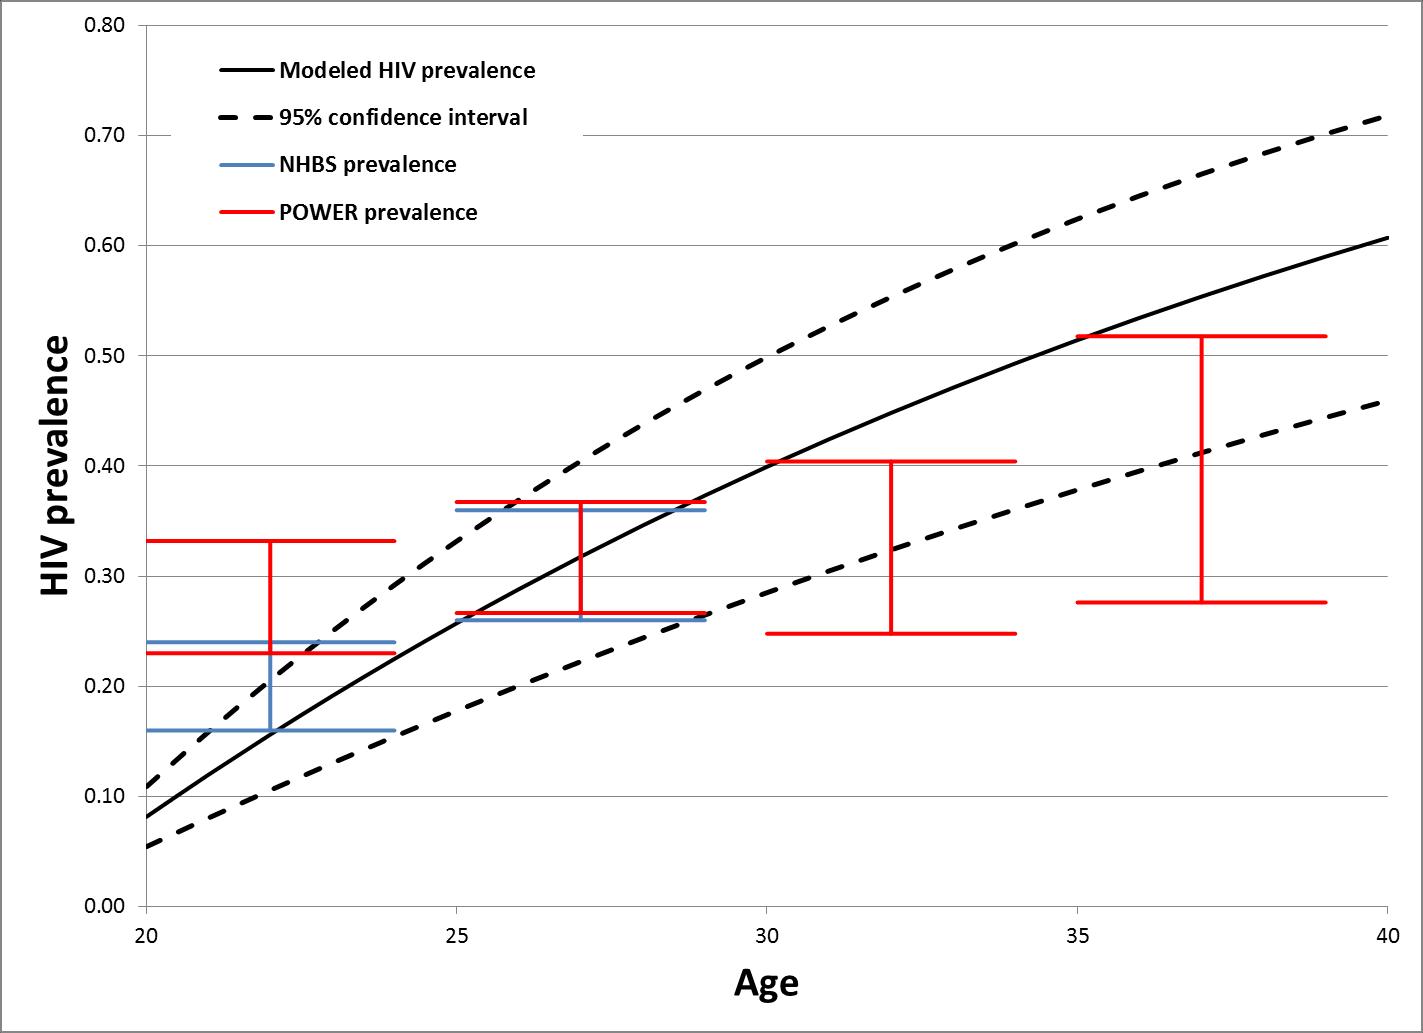
HIV Prevalence among BMSM
By Age Group
18-19: 18%
20-24: 27%
25-29: 34%
30-34: 35%
35-39: 41%
≥ 40: 52%
Existing HIV prevalence estimates among BMSM by age, and projection based on annualized HIV incidence rate of 4.16%*
*Matthews DD, Herrick AL, Coulter RWS, et al. Running Backwards: Consequences of Current HIV Incidence Rates for the Next Generation of Black MSM in the United States. AIDS and behavior. 2015;20(1):7-16. (http://www.ncbi.nlm.nih.gov/pubmed/26267251)
Treatment as Preventions among BMSM
Of all HIV+ BMSM, 41% reported being unaware of their status.


Of HIV+ BMSM unaware of their HIV-status, 67.8% reported having been tested for HIV in the past six months.


Research Question
What factors are associated with an unknown HIV+ status?
What factors are associated with an unknown HIV+ status?
952 Positive versus
*Includes all self-reported positives and self-reported negatives who received an HIV test
What factors are associated with an unknown HIV+ status?
Compared to individuals aware of their HIV-positive status, individuals unaware of their HIV-status:
• Were more likely to identify as bisexual
o 18.1% vs. 8.9%, p< 0.001
• Were more likely to have experienced intimate partner violence in the past-year
o 24.0% vs. 17.0%, p=0.011
• Had higher levels of internalized homophobia
o p<0.001
• Had achieved lower levels of education
o P=0.49
• Were younger
o 30.6 vs. 34.6, p<0.001
• Had lower levels of social support
o p=0.001
What factors are associated with an unknown HIV+ status?
Multivariable analysis were weighted according to time-location sampling adjusted for:
• Sociodemographics o Age o Educaiton
• City in which survey was completed
• Substance Use
• Depressive symptomatology
What factors are associated with an unknown HIV+ status?
Among HIV-positive individuals
• Bisexual identify was associated with an increased odd of unknown HIV-positive status
o AOR=2.15; 95% CI: 1.41, 3.31
• Age was associated with decreased odds of unknown HIV-positive status
o AOR=.96; 95% CI: .95, .98
• Internalized homophobia was associated with increased odds of unknown HIV-positive status
o AOR=1.03; 95% CI: 1.01, 1.04
Care Continuum: BMSM
HIV Care Conituum Among BMSM
Results: Black transgender women
3,597 Completed the survey
3,426 Identified as “Black” or “African American”
3,234 Identified as male
192 Identified as female, or transgender
Descriptive Statistics among Black transgender women
Descriptive Statistics: Black transgender women
Demographics
Age
30 (range: 18-84)
Education:
Less than high school: 27%
High school diploma: 32%
Some college: 23%
College diploma or more: 18%
Health care
Presence of health insurance/coverage: 80%
Unable to access care: 44%
Descriptive Statistics: Black transgender women
Psychosocial Outcomes
HIV Prevalence among Black transgender women
HIV Prevalence among Black transgender women
73
*Includes all self-reported positives and self-reported negatives who received an HIV test
Treatment as Prevention among Black transgender women
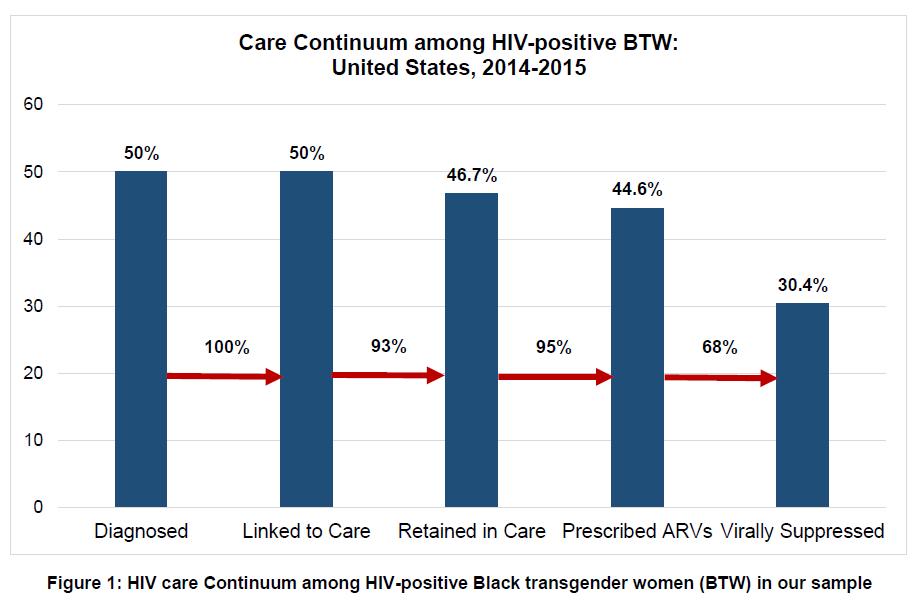
Of all HIV+ Black transgender women, 50% reported being unaware of their status.

HIV Care Continuum among Black transgender women
Conclusions
If BMSM in the United States were able to form a country of their very own, that country would have the highest rate of HIV infection in the world.
So What Are We Going to Do About It?
Continue to Underfund It
Pros
• We’re good at it
• We have three decades of experience in underfunding HIV prevention for BMSM.
Cons
• We’ve tried it and it hasn’t worked
• Continuing to underfund prevention and research will ensure that new generations of young BMSM will have high HIV infection rates.
• The epidemic will continue to spin out of control
Create a New Country for BMSM and Address the Epidemic Through PEPFAR
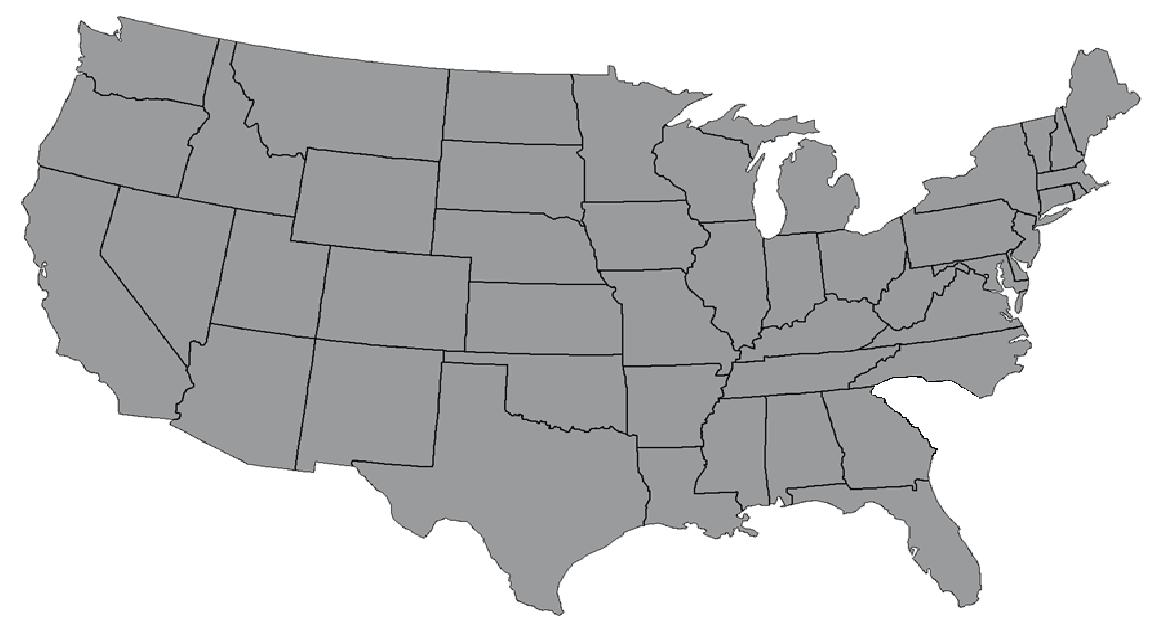

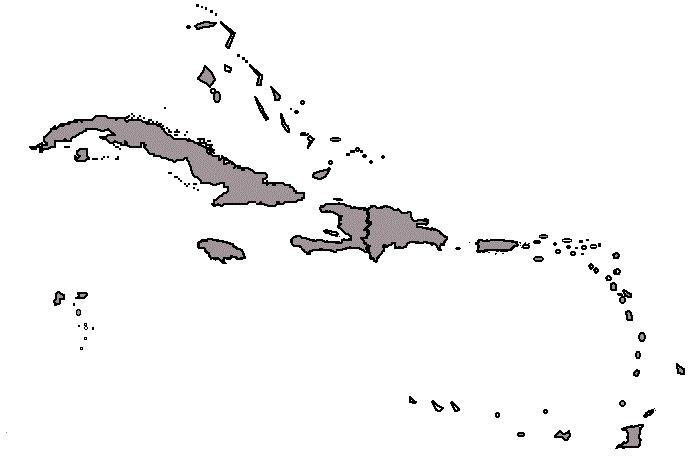
Use PEPFAR as a Mechanism
Pros
• We’d finally have a mechanism that could address the epidemic among BMSM
Cons
• PEPFAR funds are limited
• It is a violation of human rights to have to give up citizenship rights to access medical care & prevention services
• The question of whether South Carolina can leave the Union was settled at Appomattox.
Take It Seriously
• Work with community leaders to design interventions to:
1. Identify HIV+ BMSM
2. Link HIV+ men to care
3. Help HIV+ BMSM stay healthy across their life course by supporting adherence
4. Help HIV- BMSM access PEP and PrEP
5. Harness resiliencies to raise levels of health
• Address the multiple health problems that afflict BMSM
• Address the many ways that racism and homophobia compromise the health of BMSM.
Conclusions
• HIV infection rates among BMSM in the US are among the highest of any group in the world
• The epidemic among BMSM continues to spiral out of control and constitutes a national scandal
• Future historians of the AIDS epidemic will doubtless conduct analyses to try and explain how we allowed the epidemic among BMSM to go unaddressed over the past 3 decades.
Conclusions
• Lack of an incisive theory to explain greater vulnerability of BMSM is one of the reasons for our failure at epidemic control
• Millett’s theoretical framework showing how the combination of racism, lack of access to medical care, and basic HIV biology create a perfect storm that increases transmission offers many possible intervention targets.
Conclusion
• These targets include:
o Getting HIV positive men into medical care
o Supportive services to help men achieve undetectable viral loads
o Helping HIV negative men access PrEP and PEP
o Special prevention efforts to reach very young BMSM, with PrEP a probably component of these efforts
o Efforts to raise levels of co-occurring health problems among BMSM that also drive HIV risk
Conclusion
• These efforts cannot be successful unless we train new generations of scholars in ways to create interventions to stop the epidemic
• We cannot end the HIV epidemic in our country unless we place the prevention care care needs of BMSM front and center in this struggle
• We now have many of the tools to end the epidemic; this knowledge also makes it our responsibility to use these tools to their full extent so that HIV will end among BMSM.
POWER Study Participants
Center for Black Equity

CENTER for LGBT HEALTH RESEARCH
University of Pittsburgh Graduate School Public Health

Community Partner Organizations