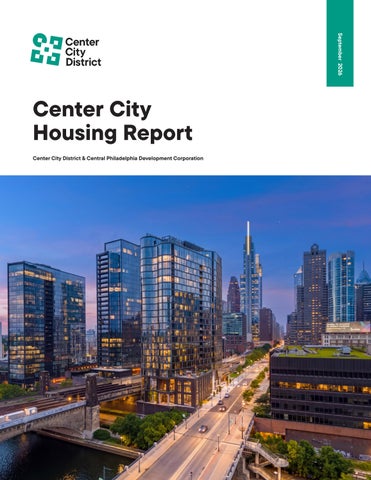
September 2026
Center City Housing Report Center City District & Central Philadelphia Development Corporation
September 2026
Center City Housing Report Center City District & Central Philadelphia Development Corporation
100 S. Broad Street, Ste. 1N Philadelphia, PA 19110
centercityphila.org
Percentage of citywide housing units completed (January 1, 2025 – June 30, 2026) 40% of all housing production in the City of Philadelphia occured in Greater Center City, an area comprising just 6% of the city’s land area.
Northeast 1%
Northwest 8%
North 22% River Wards 12%
West 9% Greater Center City 40%
South 7% Southwest 1%
Center City and its surrounding neighborhoods are Philadelphia's housing production engine Since the beginning of 2025, Greater Center City has accounted for 40% of the more than 10,000 housing units completed citywide, despite comprising just 6% of the city's land area. Ongoing production and absorption of housing units in Center City contribute to Mayor Cherelle L. Parker’s Housing Opportunities Made Easy (H.O.M.E.) Initiative, which aims to build, preserve, and restore 30,000 units. Since the start of the Parker administration, Greater Center City alone has created more than 7,800 units, 26% of this ambitious target. Building ample housing in the core has helped to slow rent growth and lessen demand on other neighborhoods by capturing a high share of inbound buyers and renters. Read on to learn more about Center City’s role in growing and diversifying the city’s housing market.
Greater Center City by the numbers
6%
of the city’s land area
Center City Housing Report | September 2026
40%
of the city’s housing production
26%
of H.O.M.E. Initiative housing units target
3
Methodology and Definitions This year’s Center City Housing Report looks at 18 months of Philadelphia Department of Licenses and Inspections (L&I) data (January 1, 2025 – June 30, 2026). This dataset includes completed and active housing permits for the entirety of Philadelphia County, which allows Center City District (CCD) to quantify the share of housing production in and near downtown and analyze Center City’s role in the broader housing market. With the citywide housing landscape as context, this report focuses largely on housing supply, demand, pricing, and policies affecting an area CCD refers to as Greater Center City (map below). Within Greater Center City are Core Center City, comprised of the four ZIP codes that make up the high-rise, mixed-use downtown bounded by Pine Street, Vine Street, and the two rivers; and Extended Center City, comprised of the two ZIP codes to the immediate north and two to the immediate south of the core. This eight ZIP code area is grouped together as Greater Center City for research purposes due to the clear interplay of these areas with one another: the population growth of Extended Center City occurred due in large part to the resurgence of Core Center City, and today many residents of Extended Center City hold jobs in the core. Collectively, Greater Center City contains a density of households, jobs, retail businesses, and economic activity unlike any other section of Philadelphia.
Greater Center City (Core + Extended)
Girard Ave.
Extended Center City Vine St.
Core Center City Pine St.
New Jersey
Extended Center City Tasker St.
4
Center City District & Central Philadelphia Development Corporation
Photo by Matt Stanley
Center City Housing Report | September 2026
5
Photo by Matt Stanley
6
Center City District & Central Philadelphia Development Corporation
5 Things to Know 1. People want to live in and around Center City. Sustained population growth (28% growth since 2011) and more recent estimates from Placer.ai (3.7% growth in 2025) show downtown’s desirability is real. Our survey of apartment dwellers last year found that 44% of respondents moved to Core Center City from other cities and towns, and most cited not owning a car and having a short commute to work as things they valued about downtown living.
2. Growth emanates from the core. Population growth and housing development have accelerated in neighborhoods connected to Center City via reliable public transit. The top three ZIP codes for housing completions are 19123 (Northern Liberties, Poplar, the Delaware River waterfront), 19122 (South Kensington, Temple University, Norris Square), and 19125 (Fishtown, East Kensington, Olde Richmond). More than 3,850 units were completed in these areas over the last 18 months.
3. Demand is meeting supply.
4. Housing production in Center City moderates pricing and pressure on other neighborhoods. When housing production peaked in 2023, rents decreased due to concessions, and rent growth slowed. More broadly, Center City’s relatively strong levels of housing development have helped keep rent increases below those of downtowns like Lower Manhattan and Boston.
5. Advancing H.O.M.E. Initiative recommendations can help Center City build more (and better). Removing parking minimums in high-density zoning districts is an early win, and extending the Transit Oriented Communities Overlay to Broad Street Line stations would further increase density in appropriate locations while supporting SEPTA ridership growth. A 20-year tax abatement, meanwhile, can make unworkable conversion projects feasible. Opportunities exist across Greater Center City for Turn the Key projects as well as leveraging publicly held land to deliver market rate and affordable units.
Absorption (new occupancy) of apartments has outpaced new supply enough to drive vacancy down. In the four ZIP codes of Core Center City, vacancy stands at just 8%. In the surrounding four ZIP codes of Extended Center City, vacancy has dropped six percentage points since 2024 to just under 12%. All told, 4,872 units were absorbed (occupied) across Greater Center City.
Center City Housing Report | September 2026
7
1
People want to live in and around Center City To understand Center City’s housing market, we look at both Core Center City — the four ZIP codes between Pine and Vine streets that include our high-rise areas — as well as the ZIP codes to the immediate north and south. These areas of what we define as Extended Center City have grown in direct response to Center City’s vibrancy and resurgence as a place to live, work, and play. Core Center City and Extended Center City together make up what we call Greater Center City, an area comprising just 6% of the city where more than 200,000 (one in eight) city residents live. Since 2011, Greater Center City’s population has grown 28% while the city’s overall population has grown just over 3%. According to CCD’s survey of new apartment buildings, 44% of residents relocated to Center City from outside of the region and 41% were already in Philadelphia and decided to live downtown. Citywide, Philadelphia drew the highest influx of new residents from New York, Pittsburgh, Northern New Jersey and Lancaster County. Population density in Center City is more than double the citywide average with more than 24,500 residents per square mile. Greater Center City has gained nearly 44,000 residents with advanced degrees compared to 2011, as educational attainment has risen sharply alongside a growing population of younger residents. Roughly three in four adults in Greater Center City hold a bachelor’s degree, more than a third hold a graduate degree, and 41% are between the ages of 20 and 34. Households are small (averaging 1.7 people) and largely car-free: 30% in Greater Center City own no vehicle and more than half commute without one, with those rates spiking much higher within Core Center City. Households tend to be larger in Extended Center City with more school-age children, while more single and empty-nester households live in the core.
8
Center City District & Central Philadelphia Development Corporation
Key demographics, 2025 Core Center City households trend younger and smaller than Extended Center City households. As a whole, Greater Center City (the combination of those two geographies) differs significantly from the city and region in terms of educational attainment, modes of transport, and median incomes. Source: U.S. Census Bureau, ACS
Core Center City
Extended Center City
Greater Center City
City of Philadelphia
Philadelphia Metro
Total population (2025 Esri)
69,628
137,248
206,876
1,599,611
6,307,532
Population density per square mile
27,604
22,611
24,504
11,800
1,356
Percentage of foreign born population:
16.7%
11.5%
13.2%
15.2%
11.8%
Number of households
40,213
66,268
106,481
679,428
2,467,761
Average household size
1.4
2.0
1.7
2.3
2.5
Median household income
$100,869
$106,102
$104,407
$61,953
$91,289
Percentage of households owner-occupied
29%
46%
40%
52%
67%
Percentage of households with children
4%
16%
12%
25%
29%
Percentage over 25 with at least a bachelor’s degree
80%
70%
74%
35%
42%
Percentage over 25 with at least a master’s degree
42%
35%
37%
16%
18%
Percentage 20-34
45%
39%
41%
25%
20%
Percentage 60 and older
24%
16%
18%
20%
24%
Percentage under 18
4%
14%
11%
21%
21%
Non-auto commuting mode share
70%
52%
58%
34%
14%
Public transit commuting mode share
20%
21%
21%
20%
8%
Total percentage novehicle households
47%
30%
30%
18%
12%
Population
Households
Education
Age
Commuting
Center City Housing Report | September 2026
9
2
Growth emanates from the center Anonymized cellphone data from Placer.ai indicate that Core Center City’s population grew 4.9% in 2025, while Extended Center City grew 3.2%. All told, the area between Girard Avenue and Tasker Street grew 3.7%, more than double the city at large, which grew 1.7% according to Placer estimates. These data indicate that Center City’s residential base has expanded every year since 2020.
Population change in Greater Center City vs. Philadelphia overall, 2020-2025 Greater Center City (the combined areas of Core Center City and Extended Center City) has grown faster than Philadelphia overall every year since 2020. Source: Placer.ai
Population Change, 2020-2025 Core Center City
Extended Center City
Philadelphia
8% 7% 6% 5% 4% 3% 2% 1% 0 -1% -2% -3% -4% 2020
2021
2022
2023
2024
2025
Housing production has followed a similar pattern. Over the 18 months analyzed, more than 4,000 units were added to Greater Center City, accounting for 40% of all housing units completed citywide. In recent years production has expanded outward from the core, as Extended Center City delivers more units, drawing on its connection to downtown and the transit lines that link them. The 19123 ZIP code, containing Northern Liberties, Poplar, and a major stretch of the central Delaware River waterfront, once again led Philadelphia in housing completions with 1,800 units, or 18% of the citywide total. The trend continues even farther north in the ZIP codes of 19121, 19122, and 19125. This area, which includes Strawberry Mansion and parts of Brewerytown, Yorktown, Ludlow, South Kensington and Fishtown, accounts for 26% of all housing units built and 24% of units with an active permit, meaning development will continue in the years to come.
10
Center City District & Central Philadelphia Development Corporation
Photo by A1RMedia
Center City Housing Report | September 2026
11
Completed housing units (January 1, 2025 – June 30, 2026) Just over 10,000 housing units were completed across the city in this 18-month period. 40% of those units were built in Greater Center City, while another 26% of development occurred in the adjacent ZIP codes of 19121, 19122, and 19125.
Number of Units Extended Center City
Under 5 6 - 25 26 - 50
Core Center City
51 - 100 101 - 200 Over 200
Extended Center City
Single Family Apartments Zip Code Boundary Greater Center City
12
Center City District & Central Philadelphia Development Corporation
Housing completions (January 1, 2025 – June 30, 2026) Area
Number of units
% Completed units
1,389
14%
Core West
432
4%
Core East
957
10%
Extended Center City
2,637
26%
Extended North
2,102
21%
Extended South
535
5%
Greater Center City Total
4,026
40%
Adjacent North
2,640
26%
19121
598
6%
19122
1,152
12%
19125
890
9%
10,005
100%
Core Center City
Citywide Total
Combining these areas, Greater Center City and its adjacent ZIP codes to the north represent more than two thirds (67%) of all housing units completed in Philadelphia. These new development projects continue to build density along major corridors like Broad Street, Spring Garden Street, Frankford Avenue, and Delaware Avenue/ Columbus Boulevard.
Center City Housing Report | September 2026
13
Completed housing units by year, Greater Center City After several years of record completions, production has begun to slow as the tax-abatement pipeline works through and financing conditions tighten. There are just under 5,700 active housing permits across Philadelphia, with Greater Center City accounting for 23% of them. Source: CCD analysis of City of Philadelphia, Department of Licenses and Inspections Data
Completed Housing Units by Year, Greater Center City
4K
3,811 3,175
3K
2K
2,805
2,844
2022
2023
2,142 1,780 1,126
1K
0 2019
2020
2021
2024
2025
While housing units have delivered at historically high rates for the last several years, the construction pipeline has slowed, with 17% fewer completions in 2025 than in 2024. This stems from factors including the 10-year tax abatement phaseout in 2021, elevated material costs up and down the supply chain, and stubbornly high interest rates. Yet coming after several years of record production, this pullback has actually helped the housing market balance supply and demand, as projects opened during the height of the boom now face less competition coming online during lease-up. In Core Center City, office-to-residential conversions comprise most new housing production for the first time in multiple economic cycles. Philadelphia has converted at least 11 million square feet to alternative use since 1997, leading the nation, and the current wave of projects has made this a larger slice of the housing market than it has been in years.
14
Center City District & Central Philadelphia Development Corporation
Philadelphia has converted at least 11 million square feet to alternative use since 1997, leading the nation, and the current wave of projects has made this a larger slice of the housing market than it has been in years.
Center City Housing Report | September 2026
15
Recent and upcoming conversions 400 Market Flats
The Wanamaker
Lubert-Adler and Keystone Properties completed the conversion of 173,700 square feet to 176 apartments. The developers also purchased the Bourse with plans for a conversion, though this project remains in limbo.
In Center City’s most ambitious project currently underway, 622 apartments will sit atop renovated office space and multiple floors of retail and food and beverage uses, and rooftop amenities overlooking City Hall. This project is both a bookend and an anchor for the transformation of Market East.
Three Parkway and Ten Penn Center PMC Property Group has completed partial conversions in both of these office buildings, retaining commercial tenants in one portion of the building as residents populate the other.
1500 Pine and 337 S. Broad Both formerly University of the Arts buildings, the first is now leasing as apartments while the second is under development to add 84 new units.
Hahnemann Conversions The developer of 337 S. Broad, Dwight City Group, is also planning to convert former patient towers at Hahnemann University Hospital and recently acquired an additional building on the massive site, giving them a potential pipeline of 536 units.
16
Centre Square The status of this project, even larger in scope than Wanamaker, remains unclear. The scale and complexity of redeveloping a complex like this could be helped through targeted tax abatement or other specialized incentives.
Bonner’s (23rd and Sansom) The long-time pub was sold to an adjacent property owner, who plans a residential project estimated to cost as much as $55 million. Bonner’s would remain a ground floor tenant and expand its footprint. There is no timeline for construction at this time.
Center City District & Central Philadelphia Development Corporation
Active housing units, 2026 Over 1,300 units are in progress in Greater Center City and 5,600 citywide. Source: CCD analysis of City of Philadelphia, Department of Licenses and Inspections Data
Number of Units Extended Center City
Under 5 6 - 25 26 - 50
Core Center City
51 - 100 101 - 200 Over 200
Extended Center City
Single Family Apartments Zip Code Boundary Greater Center City
Center City Housing Report | September 2026
17
Photo by A1RMedia
18
Center City District & Central Philadelphia Development Corporation
The next wave of new construction Conversions are moving forward more readily than new construction given the challenging financing and interest rate environment. Nevertheless, a handful of major ground-up projects are underway, and there are signs of momentum at a number of other large-scale development sites across Greater Center City.
113-119 S. 19th Street
Harper Square Pearl Properties’ project rising at 19th and Sansom is set to be the city’s tallest rental apartment building upon completion. The 267-unit project builds on the success of The Harper, located just across 19th Street.
708 Sansom Street
The Arbor House New permit activity at this long-vacant Jewelers’ Row site suggests the project is gradually moving forward. The latest application to the Historical Commission concerns alterations to two protected buildings at the tower’s base, which would be converted into storefronts incorporated into the new structure.
1601 Washington Avenue OCF Realty’s proposed 285-unit project along this rapidly changing corridor has taken another step forward with the firm acquiring the final parcel needed to consolidate the site. They estimate groundbreaking in 12 to 18 months.
1021 N. Hancock Street
The Mercato Immediately adjacent to the Piazza Alta project currently building out Phase II on top of a fully leased Phase I, Post Brothers submitted plans for a 241-unit building to replace a single-story office and industrial structure.
Center City Housing Report | September 2026
19
Photo by Matt Stanley
20
Center City District & Central Philadelphia Development Corporation
Center City Housing Report | September 2026
21
3
Demand is meeting supply Stronger absorption throughout 2025 has helped drive vacancy down in Extended Center City and hold Core Center City’s low vacancy rates steady. According to CoStar, absorption — the change in occupancy in the housing supply, measured against new construction and demolitions as well as move-ins and move-outs — has remained positive every year since 2021. Since 2020, Greater Center City has added more than 16,000 net new units, and demand has kept pace.
Absorption and deliveries, Center City multifamily housing units In Core Center City, supply and demand have kept pace in recent years. In Extended Center City, a supply spike in 2024 drove up vacancy, but strong absorption in the last 18 months has significantly reduced it. Source: CoStar
2023
2024
2025
2026
2023
2024
2025
529
664
1,393
0
2,742
0
426
1K 343
1K 1,042
2K
1,123
2K
856
3K
850
3K
1,124
4K
844
4K
4,174
Extended Center City Units Delivered
1,689
Core Center City Units Delivered
2,105
Extended Center City Net Absorption
1,221
Core Center City Net Absorption
2026
Looking at Core Center City and Extended Center City together, occupancy across all of Greater Center City stands at 90%. The slower construction pipeline will allow continued absorption of units, assuming lease-up rates hold constant. Supply/demand imbalance is the biggest driver of rental rate changes, as we explore in the next section.
22
Center City District & Central Philadelphia Development Corporation
Occupancy The 2024 dip reflects lease-up as a wave of new units came online in Extended Center City. Source: CoStar
Greater Center City Occupancy Core Center City
Extended Center City
100 95 92%
92%
90
88% 85 82% 80 75 2020
2021
2022
2023
2024
2025
2026
Average rent Core Center City rents continue to outperform Extended Center City. Source: CoStar
Average Rents in Greater Center City Core Center City
Extended Center City
2.6K $2,492
2.4K 2.2K
$2,077
2K 1.8K 1.6K 1.4K 1.2K 2020
2021
Center City Housing Report | September 2026
2022
2023
2024
2025
2026
23
According to MLS, 2025 home sales rose 11.7% in Core Center City and 2% in Extended Center City ZIP codes, the first annual increase since 2021. This momentum is carrying into 2026, as midyear sales in both areas have surpassed half of 2025 totals. In the Extended ZIP codes, where homes have sold faster than in the Core, average prices increased by 1.3%. In the Core, average prices dipped by a similar margin even as sales volume grew. Continuing the trend in the rental market, the strength of the core is shared by the extended neighborhoods.
Greater Center City home sales Home sales rose in 2025 for the first time since 2021, with 2026 on pace to continue the momentum. Home Sales in Greater Center City
Source: MLS
Core Center City
Extended Center City
4K
3K
2K
1K
0
24
3,214
2,562
1,946
1,869
1,915 1,005
1,034
884
728
720
804
461
2021
2022
2023
2024
2025
2026
Center City District & Central Philadelphia Development Corporation
When housing production peaked in 2023, rents decreased due to concessions and rent growth slowed. More broadly, Center City’s relatively strong levels of housing development have helped keep rent increases below those of downtowns like Lower Manhattan and Boston.
Center City Housing Report | September 2026
25
4
Housing production in Center City helps moderate both pricing and pressure on other neighborhoods Across six major Northeastern U.S. downtowns from 2016 to 2025, the markets that built housing fastest generally saw the slowest rent growth. Core Center City Philadelphia added supply faster than any peer downtown while keeping rent growth near the bottom. Within the Core Center City footprint, apartment stock grew by about 40% (roughly 3.8% a year) while average asking rents rose just 13% (about 1.4% a year) — the widest gap between supply growth and rent growth of any downtown examined. Across the region, Greater Center City experienced slower rent growth than Philadelphia and the region, according to the Zillow rent index, which normalizes for unit mix to allow apples-to-apples comparisons over time.
Change in compound annual growth rate (CAGR), inventory and rent, 2016-2025 Philadelphia’s housing supply grew 3.8% annually, far outpacing 1.4% rent growth. Source: CoStar
Downtown
Inventory CAGR
Rent CAGR (nominal)
Lower Manhattan
0.6%
2.1%
Downtown D.C.
1.4%
1.1%
Downtown Boston
2.0%
2.1%
Downtown Baltimore
2.5%
1.0%
Core Center City Philadelphia
3.8%
1.4%
Downtown Brooklyn
4.1%
2.2%
Because consumer prices rose about a third over the same stretch, that small nominal increase translates into a real, inflation-adjusted rent decline of roughly 15%. Lower Manhattan poses a sharp contrast, increasing its housing supply only 5.5% over the same period and observing the steepest rent increases relative to supply. These insights align with the growing body of evidence that expanding supply helps hold rents down. While this is not the same as delivering truly affordable housing options for residents up and down the income spectrum, it is a reminder that fueling market rate housing production is one facet of a multipronged strategy to moderate cost of living. A five-year comparison of downtown housing growth by the Urban Institute showed that Core Center City and Fishtown collectively added more new supply than any downtown in the United States outside of Nashville (see chart on facing page). The Urban Institute used census blocks to define neighborhoods to standardize size among geographies across the country.
26
Center City District & Central Philadelphia Development Corporation
Change in housing units of major downtown areas, 2020-2025 Center City and Fishtown collectively added more housing than any major U.S. downtown besides Nashville. Source: Urban Institute
Change in Housing Units 2020-2025, Major Downtown Areas 30K
24,700 20,163
20K
18,995
17,465
17,371
17,148 11,831
10K
10,071 6,171
5,729
5,580
o
s Sa
n
Di
eg
le ge An Lo s
M id At tow la n nt a
nv er De
hi No ng M t a D. on C. ) (W as
W yn n (M wo ia od m i)
ity lt
La ke
C
e Sa
Se at tl
n kly Br oo
en t Fi er C sh i to ty/ wn
C
Na
sh vil
le
0
The Urban Institute defined neighborhood areas by density within census blocks.
Center City Housing Report | September 2026
27
5
Advancing H.O.M.E. Initiative recommendations can help Center City build more (and better) Mayor Parker’s H.O.M.E. Initiative is a comprehensive approach to building, preserving, and restoring housing across the city. Its many recommendations address housing at all scales and at all levels of affordability. Given Center City’s high land values, dense zoning, and major employers, it is incredibly difficult to provide housing for the most vulnerable and lowest-income residents within its boundaries. Center City’s role in improving affordability is more about ensuring adequate production. As our analysis shows, Center City’s strong housing market — driven by its enduring desirability — has been able to produce enough housing to keep rent growth more modest than many peer downtowns, while also providing enough units to absorb the majority of demand from new city residents arriving here for job opportunities from other cities and towns across the country. There are several key recommendations and actions within the Parker administration’s H.O.M.E. Initiative that apply directly to Center City by making large-scale housing development feasible, easier to build, and appropriate for its dense, transit-served location at the center of the region.
Reduce parking requirements in Center City Status: COMPLETED
City legislation was approved in mid-2025 to eliminate parking minimums in CMX-4 and CMX-5 zoning districts. These high-density mixed-use zoning designations cover most of the high-rise areas of Center City, aligning closely with the operational service boundaries of the Center City District itself. While many CMX-4/5 parcels take advantage of the permitted density through their use as high-rise office, apartment, and hotel towers, there is a lot of unbuilt capacity in these zoning districts due to the ongoing use of certain lots as surface parking, single-story structures, and other outdated uses. Analysis from Build Philly Now (BPN) completed in August of this year found that, built out to about 65% of their allowed envelope. All told, approximately 66.5 million square feet of permitted zoning capacity is unused in Core Center City. Removing this requirement eliminates the need to build below-grade parking structures that can cost tens or sometimes hundreds of thousands of dollars per space, or above-ground parking decks that raise construction costs by forcing developers to build higher to fit both parking and the residential units above. These expenses ultimately drive up rental rates, as tenants absorb added costs through their rents. Secondarily, providing parking attracts renters with cars, while car-free buildings tend to attract those who don’t own them. CCD’s 2025 survey of downtown apartment dwellers found that 55% of respondents don’t own cars, and that many choose to live downtown precisely because they can walk, bike, or ride SEPTA to work. The removal of the parking requirement from CMX-4/5 carries with it enormous cost savings and opens up opportunities for thousands of additional housing units. BPN’s analysis showed that under the previous parking requirements, the unbuilt potential of CMX-4/5 parcels (if fully developed) would have required approximately 31,490 structured parking spaces, equivalent to roughly 11 million square feet. This translates to billions of dollars that would have been spent just to provide required parking, dollars that can now be allocated to other aspects of development.
28
Center City District & Central Philadelphia Development Corporation
Parcels zoned CMX-4 and CMX-5 The city’s most permissive and highest-density zoning districts are concentrated in the core within walking distance of major Metro and Regional Rail stations. Analysis from Build Philly Now indicates that many of these parcels are unbuilt or significantly underbuilt relative to what the underlying zoning allows. Source: City of Philadelphia
CMX-4 CMX-5 CCD Boundary
Analysis from Build Philly Now completed in August of this year found that, on average, CMX-4/5 parcels are built out to about 65% of their allowed envelope. All told, approximately 66.5 million square feet of permitted zoning capacity is unused in Core Center City.
Center City Housing Report | September 2026
29
Expand the Transit Oriented Communities Overlay Status: IN PROGRESS
The city’s zoning code already included a Transit Oriented Communities (TOC) Overlay, but the recently passed revisions expand the applicable radius of the bill from 500 feet to a quarter-mile around station areas. Within these radii, permitted floor area is increased by 30% and parking requirements are reduced. As currently structured, members of City Council opt into the overlay by passing bills applying it to specific stations. Thus far, the overlay exists around 13 Market-Frankford (L) Line stations. The TOC Overlay should also be applied to Broad Street (B) Line station areas including Lombard-South on the south side of downtown and the stations north of City Hall including Race-Vine, Spring Garden, Fairmount, and Girard. North Broad Street is the only stretch of subway outside of New York City served by a four-track service (that is to say, trains running both local and express service). This means the B Line can move huge numbers of people, connecting Center City to Temple University, Temple’s health system, and the many neighborhoods between City Hall and the northern boundary of Philadelphia. Focusing housing along this high-capacity transit spine is the best way to reduce traffic and congestion, limit the total number of car trips being taken by residents, and connect Philadelphians to jobs up and down the line as well as the many grocery stores, healthcare facilities, and other shops and services that exist at many B Line stations. Incentivizing housing development along our elevated and subway transit lines helps preserve the rowhouse character of areas farther from Broad Street. Northern Liberties and Fishtown are a good example of this: zoning was re-mapped in these areas to cluster CMX-3 districts — a medium-density designation — along the L Line. The result: thousands of apartment units near the Spring Garden, Girard, Berks, and York-Dauphin stations, just a five-minute walk from traditional, long-established two- and three-story rowhouse blocks.
Adjust the tax abatement Status: PAUSED
State legislation passed last year paves the way for Philadelphia to adopt a 20-year tax abatement. If adopted by the City, this tax abatement would be a more precise tool to meet housing goals by lowering the cost of converting some abandoned or underutilized buildings into housing. Pittsburgh is the only municipality that has enacted this abatement to date, and in that city it is limited to their downtown area through something called the Downtown LERTA (Local Economic Revitalization Tax Assistance). This is a geographically specific program that provides tax relief to developers who meet specific housing and job-creation standards. Philadelphia’s current tax abatement is not geographically limited in scope, applying to all new construction and improvements citywide. It is worth considering whether a more localized application of a more generous abatement might be appropriate given the unique challenges of converting large-scale office buildings to productive use. Focusing a 20-year abatement to certain geographies, building types and sizes, or zoning districts could also serve to focus investment and limit the fiscal impact of this longer-term tax abatement on city tax collections.
30
Center City District & Central Philadelphia Development Corporation
SEPTA is in the early stages of piloting its Key Advantage program in apartment buildings, using grant funds from the Delaware Valley Regional Planning Commission. Similar to the existing program’s structure within companies and schools, wherein the institution pays for the passes and workers and students are able to receive a free SEPTA key card offering unlimited monthly rides, the residential version will allow apartment building owners and management groups to purchase passes and then offer free transit as an extension of the building’s amenity package. Widespread adoption of SEPTA Key Advantage in residential settings will serve to reinforce the value and convenience of transit for residents, encourage more ridership and discourage car use and ownership.
Center City Housing Report | September 2026
31
Pursue opportunities for Turn the Key program in Greater Center City Status: ONGOING
While most opportunities in Greater Center City are larger-scale, given lot sizes and denser zoning designations, the area also contains 287 RFP-ready lots owned by public agencies (117 by the Land Bank, 97 by the City, and 73 by the Redevelopment Authority) that could be used for the Turn the Key program. Through this program, eligible buyers can receive up to $75,000 in mortgage buydown assistance and $10,000 grants as first-time homebuyers.
Leverage publicly controlled land Status: TBD
Center City includes several large parcels controlled by public entities that could provide large quantities of housing through redevelopment. One such site is the former police department headquarters, known to many as the Roundhouse, with 2.7 acres of land adjacent to PATCO and SEPTA stations and within walking distance of major employment destinations. Another opportunity is the former Philadelphia Department of Health facility at Broad and Lombard. The previous agreement with a private developer for this parcel has expired, opening opportunities for more housing directly above the Lombard-South station on the B Line.
32
Center City District & Central Philadelphia Development Corporation
Looking ahead: Center City’s role in citywide housing production In the 18 months of L&I data analyzed for this report (January 1, 2025 – June 30, 2026), housing completions in Greater Center City made up 40% of all units created in Philadelphia. Looking at active permits for housing projects — those not yet completed but currently in development — there are around 5,700 units with active permits, and just over 1,330 of them (23%) are in Greater Center City, and an additional 1,370 are in the adjacent northern ZIP codes of 19121, 19122, and 19125. This is a reminder of the pivotal and outsized economic role our downtown and its adjacent neighborhoods play in our city and region. Greater Center City is 6% of Philadelphia’s land, but within its boundaries we saw not only 40% of housing production last year but we also know that 42% of all jobs in the city are found here. On the fronts of both living and working, our urban core punches well above its weight. This is by design. Center City is designed to accommodate high densities of housing and jobs as the center of our transit system, the most walkable downtown in the country, and the place where zoning enables development of significant scale. Zoning in Core Center City allows for far more development than has been built to date. Tens of millions of square feet of already permitted capacity sit unbuilt or underbuilt, including parking lots east of Broad at 800 and 1301 Market Street, those west of Broad at 21st and 22nd and Market, parcels up and down Broad Street, and older low-rise and vacant buildings on certain blocks of Walnut, Chestnut, and Arch streets. The density that makes certain pockets of Center City so vibrant and lively can be extended to underutilized and sometimes barren blocks, allowing more people to live in amenity-rich and walkable areas. Take the 66.5 million square feet of unused zoning capacity within CMX-4/5 zoning districts in Core Center City: even if we assume that half of this capacity is never used due to market demand and financial realities, and that half of all future development is non-residential, these parcels could still accommodate another 15,000 to 25,000 housing units depending on unit mix. Growing population density in and near Center City also supports SEPTA operations by locating residents around transit stations, lessening or even eliminating the need for car ownership by connecting Philadelphians to jobs, shopping, and services by subway, trolley, train, and bus. Attracting more residents to Center City also makes business and retail attraction easier, as companies across industries as well as major shopping brands focus on the concentration of people more than any other factor. Center City is already the city’s housing engine, but that engine can be revved even more through smart programmatic and policy changes supported in the H.O.M.E. Initiative.
Center City Housing Report | September 2026
33
Acknowledgments Report Team This report was researched and written by Clint Randall, Vice President of Economic Development and Lauren Smith, Director of Research and Special Projects, and designed by Bryant Gosnell, Graphic Designer. The Center City Housing Report team also includes Jessie Brain, Manager of GIS; Jaime Gialloreto, Digital Communications Manager; Prema Katari Gupta, President and CEO; Sophia Hernandez, Economic Development Analyst; JoAnn Loviglio, Vice President of Communications and Public Relations; Leo Manning, Director of Strategic Communications; Jimmy Salfiti, Manager of Economic Development; Bonnie Thompson, Senior Director of Digital Marketing; and Dana Womack, Digital Marketing Manager. Drone photography by A1RMedia and on-street photography by Matt Stanley. For any questions or inquiries about development projects within Center City District, contact our team at research@centercityphila.org. CPDC Members We are grateful for the ongoing support of Central Philadelphia Development Corporation members, who make reports such as this one possible. For more information on CPDC and how to join, visit joincpdc.org. ABM Allan Domb Real Estate Allied Universal Alterra Property Group LLC Aramark Ballard Spahr LLP Bank of America BDO Blank Rome LLP Blueprint Commercial Brandywine Realty Trust Brickstone Realty Brown & Brown CBP Architects CBRE Inc. Chubb Clemens Construction Company Colliers Comcast Commonwealth Land Title Insurance Company Conner Strong & Buckelew CosciaMoos Architecture Cozen O’Connor LLP CraftNOW Philadelphia Cushman & Wakefield of Pennsylvania Inc. Dranoff Properties Duane Morris LLP Econsult Solutions Inc. Field Operations
34
Firstrust Bank Fulton Bank Gensler The Goldenberg Group Goldman Properties Greater Philadelphia Cultural Alliance Greenberg Traurig LLP HDR Inc. HNTB Corporation JKRP Architects JLL KieranTimberlake Klehr Harrison Harvey Branzburg LLP The Klein Company Korman Communities Inc. The Lighting Practice Lubert-Adler Morgan, Lewis & Bockius LLP MPN Realty MSC Narducci Electric Company LLC National Real Estate Development O’Donnell & Naccarato Olin Parkway Corporation Pearl Properties LLC PECO Energy Company Pennoni Pennsylvania Horticultural Society Philadelphia Parking Authority
PIDC PMC Property Group PNC Bank NA Posel Management Company Post & Schell PC Post Brothers Preservation Alliance for Greater Philadelphia Reading Terminal Market Corporation Saul Ewing LLP Savills Scully Company Seravalli Inc. SSH Real Estate Stockton Real Estate Advisors LLC Strada Stradley Ronon Stevens & Young LLP TD Bank University of Pennsylvania Urban Engineers Inc. William Penn Foundation WRT
Center City District & Central Philadelphia Development Corporation
100 S.City Broad Street, 1N, Philadelphia, PA 19110 Center Housing ReportSte | September 2026
centercityphila.org 36