


Tyler Beachler
Managing Partner, Portfolio Mangement
Deputy Chief Investment Strategist

John Chapman Chief Executive Officer Chief Investment Strategist


Tyler Beachler
Managing Partner, Portfolio Mangement
Deputy Chief Investment Strategist
John Chapman Chief Executive Officer Chief Investment Strategist


Clearwater Capital Partners was founded in 2006 by John Chapman to address long standing shortcomings in the financial industry, including conflicts of interest, limited transparency, and unmet promises. From the beginning, the firm was built on the belief that investors deserve clear, honest guidance focused on real world needs, not fragmented sales driven solutions. That commitment to integrity and competence continues to guide every decision we make. Shaped by principles established at our founding, Clearwater has grown primarily through client referrals, reflecting deep trust and lasting relationships. Today, we are a well established and thriving firm, grounded in experience and driven by purpose.
Board of Directors
John Chapman
Al Krause
John Sleeting
Jeffrey DeHaan
Operating Committee
John Chapman
John Sleeting
Jeffrey DeHaan
Al Krause
James Chapman
Tyler Beachler
Katie Berganske-Frank
Danuta Garb
Wealth Advisors
John Chapman
John Sleeting
Jeffrey DeHaan
Greg Davis
James Chapman
Melissa Dailey-Newman
Valerie Hogan
Jacob Clark
Braden Maher
Kevin Rochford

Institutional Advisory Services
Kevin Carani
John Ellis
Carter King
Portfolio Management
Tyler Beachler
Rocky Byrd
Tyler Bertsche
Advanced Planning
Kevin Nolte
Conor Durkin
Global Strategies
Hunter Sims
Operations Specialists
Ty Sampson
Andrea Patterson
Phillip Richardson
Phillip McCloskey
Riki Husic
Brand and Marketing
Katie Berganske-Frank
Hayley Holmes
Human Resources and Accounting
Al Krause
Danuta Garb
Client Experience
Katie Berganske-Frank
Liza Alexanian
Hayley Holmes
Compliance and Risk Management
Jeffrey DeHaan
James Chapman
Ty Sampson
Rocky Byrd
Riki Husic
Accounting Services
Al Krause
Danuta Garb
Erica Rangel
Our team’s expertise spans with designations that include: AIF®, AWMA®, CDFA®, CEPA®, CFA®, CFP®, CPA®, CPFA®, CTFA®, CRPS®, J.D., QKA®.
We are pleased to share the inaugural edition of Clearwater Capital’s Private Markets Outlook. This publication reflects a meaningful evolution in how we serve you. Our firm has grown, the complexity of your needs has evolved, and over the last several years we’ve deliberately built out our private market capabilities to match.
The private markets landscape has fundamentally shifted over the past decade. What was once a relatively exclusive domain has evolved into a far more crowded and complex ecosystem. Capital has flooded into the asset class— global private equity AUM alone has grown from roughly $3 trillion in 2015 to over $10 trillion today (KKR). This growth has coincided with a persistent trend of high-quality companies staying private longer.
For family offices and ultra-high-net-worth investors, this shift presents both opportunities and challenges. On one hand, increased liquidity in secondaries markets, more flexible fund structures, and expanded GP relationships offer genuine advantages. On the other hand, the proliferation of capital has compressed returns in certain segments, created valuation discipline challenges, and introduced significant dispersion between best-in-class managers and the rest of the field.
The fundamental questions remain: What opportunities warrant your capital, at what terms, and with which partners? Our role is to be your guide through this complexity—delivering the same rigor, transparency, and forward-looking perspective in private markets that you’ve come to expect from us in public markets.
We have responded by significantly strengthening our private markets platform: forging deeper relationships with General Partners (GPs) and due diligence partners to provide institutional-quality access to primary fund vehicles as well as direct co-investment opportunities.
This inaugural Private Markets Outlook is both a reflection of that progress and a forward-looking guide. In the pages that follow, we lay out our balanced perspective on key asset classes: private equity, venture equity, real estate, and private debt. Our goal is to provide actionable, evidence-based insights that help you navigate this dynamic landscape with confidence.
We remain deeply grateful for your trust and partnership. Private markets investing is inherently long-term and relationship-driven, and we are committed to continuing to evolve our capabilities in service to your objectives.
With Appreciation,
Tyler Beachler Managing Partner, Portfolio Management Deputy Chief Investment Strategist
Market Overview
Private equity (PE) is still dealing with a regime shift that started in 2022 which marked the end of an era of free money, cheap debt, and reliance on multiple expansion. Capital raising, deployments, exits, and IPOs have all been weaker since peaking in 2021. However, a constructive macro backdrop—moderating inflation, stabilizing interest rates, and renewed deal activity—supports a more favorable outlook.
2025 should mark a second consecutive year of growth in private equity deal activity after bottoming in 2023. Pitchbook estimates 2025 deal count will reach approximately 9,000 deals (up 5.9% from 2024) with estimated total deal value reaching $1.15T (up 36.3% from 2024).
Valuations & Deployment
The leveraged buyout (LBO) market, which represents private equity firms buying majority/controlling stake in a company often using debt, contributed the most to 2025 deal value. U.S. PE buyout valuations came in at 11.2x as measured by EV/EBITDA for 2025 which is near the long-term average and below peak multiples seen in 2021 and 2022.
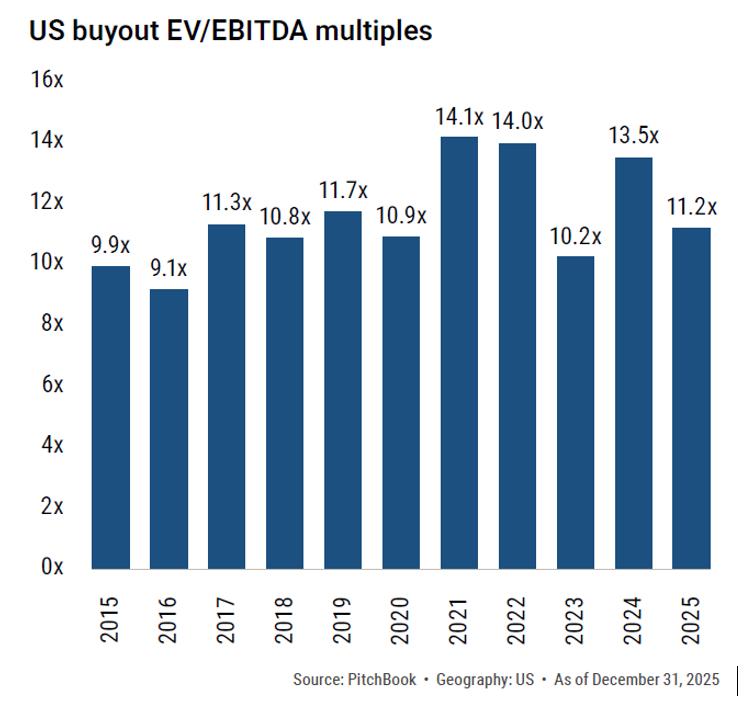
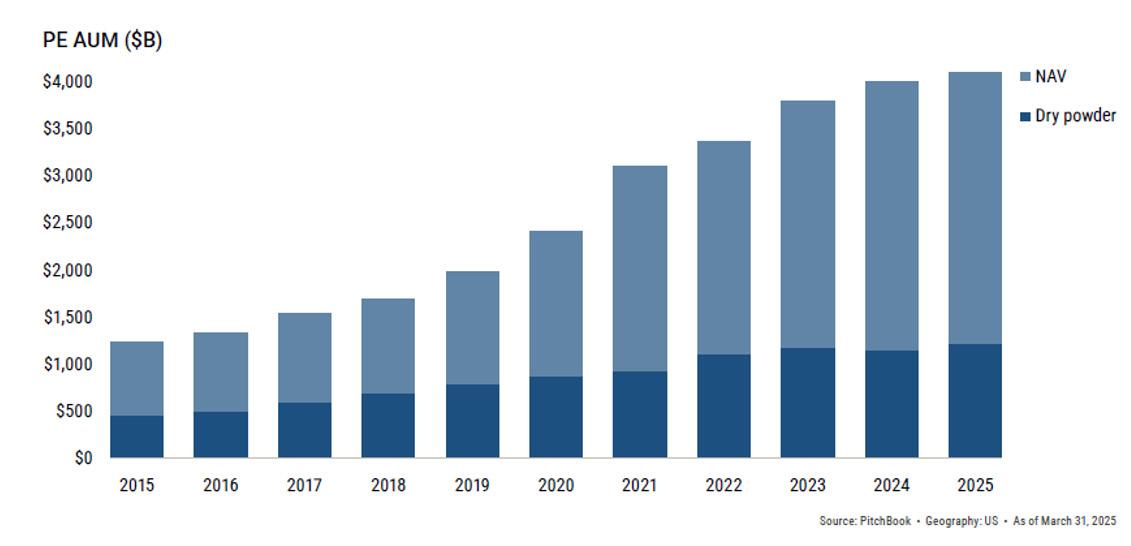
We believe multiples can remain supported given healthy corporate earnings, refinancing needs subsiding as rates stabilize, and substantial dry powder seeking deployment. According to Pitchbook, there is still roughly $1.1T of U.S. PE dry powder, the highest level of uncalled capital on record. The dry powder share of PE AUM now sits at nearly 30%.
Despite the vast amounts of dry powder, liquidity has been in focus the last several years given subdued exit activity in 2023 & 2024. As managers hold investments longer, this has lengthened Limited Partner (LP) hold periods, delaying distributions, and complicating capital planning.
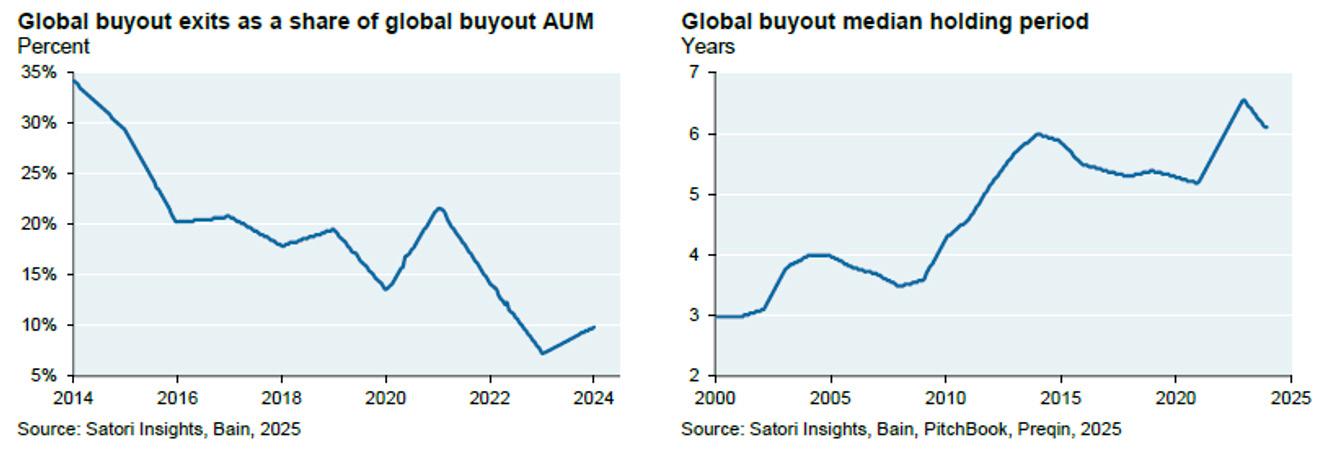
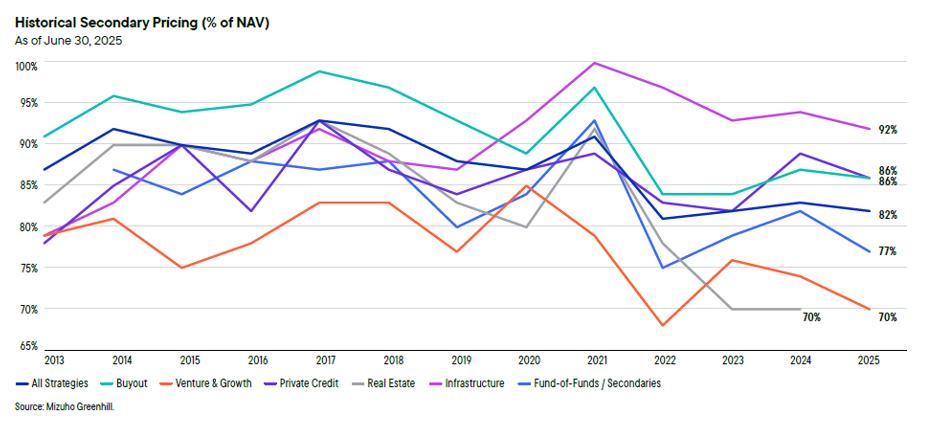
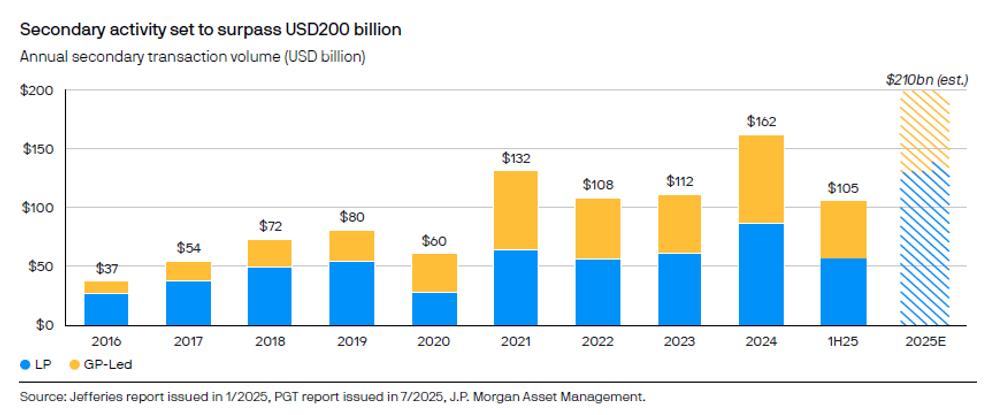
The secondaries market has seen strong AUM and volume growth as it has become a more popular liquidity solution. Secondaries managers can provide liquidity to LPs looking to exit their position for new ones but comes at a cost. LPs typically sell their interests at a discount to Net Asset Value (NAV). This benefits buyers—both secondary funds and other LPs—who can acquire mature assets at a discount with clearer visibility into underlying performance. Current transactions price at approximately 86% of NAV for buyouts (a 14% discount) and 70% of NAV for venture/growth equity (a 30% discount).
Global secondary transaction volume continues to pick up with 2025 estimated to be a record year (chart below). We expect strong secondary volume to continue given the vast amount of unrealized portfolio assets looking for an exit and the prioritization of liquidity from LPs.
Our Perspective
While private equity continues to navigate liquidity challenges, disciplined deployment, realistic pricing, and improving exit conditions support selective opportunities for patient capital.
Venture equity sits at the earliest stage of equity financing rounds starting with seed and series A rounds. Equity funding earlier in a company’s lifecycle creates more opportunity but also comes with greater risk, requiring longer time horizons and higher risk tolerance than traditional private equity. This is generally seen through wider dispersion of portfolio company performance with greater loss rates while providing opportunity in finding a few unicorns with massive returns.
Venture capital shares many of private equity’s challenges— particularly around liquidity and exit timing—but AI-driven innovation provides a compelling tailwind heading into 2026 building off 2025’s momentum.
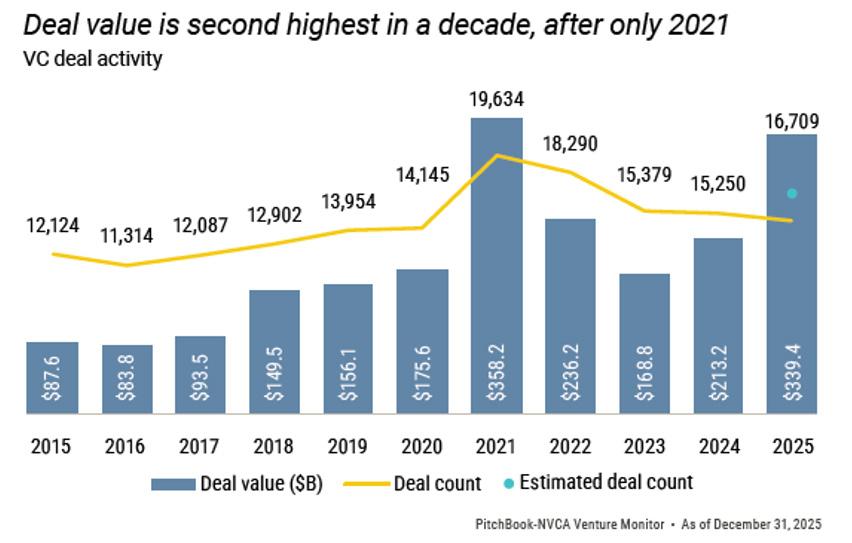
Dealmaking for U.S. Venture in 2025 saw a pickup relative to the subdued activity in 2023 and 2024. According to Pitchbook, estimated deal count is expected to grow nearly 10% yearover-year and estimated deal value is expected to grow 59%, reaching $339.4B just shy of the 2021 peak (see chart below). Pitchbook estimates that AI megadeals accounted for 65% of 2025’s total deals. For example, Anthropic’s $15B late-stage round was among the largest deals of the year. We expect dealmaking to build off 2025’s momentum.

With dealmaking picking back up, VC valuations also saw a rise across all stages of the venture lifecycle. In the graphics follow, the left-hand side highlights the absolute growth of median pre-money valuations which highlights the strong growth over the last few years. AI startups are driving most of the growth in valuations as highlighted in the right graphic generating significant premiums to their other VC cohorts especially later in the cycle.
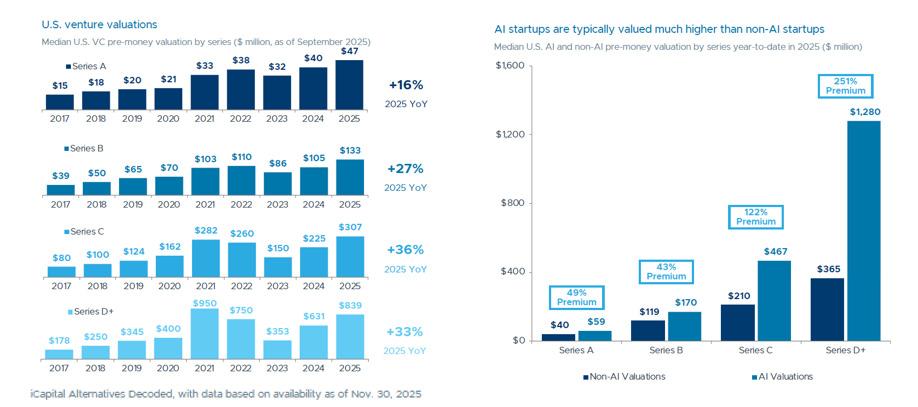
The transformative potential of AI has caused massive demand from investors and corporations. AI companies continue to garner a large share of VC deals and the mega cap tech companies’ projected capex for 2026 could be in the $600-$700B range with much of it going into AI infrastructure and enterprise adoption. While the AI theme is broad in terms of the entire ecosystem, we’ve also seen the significant capital concentrate to those handful of names exhibiting strong momentum as those companies are reaching scale faster than ever. As with any transformative technology cycle, selectivity will separate enduring winners from the inevitable failures.

The expectation going into 2025 was that M&A and IPO activity would accelerate significantly, and while 2025 showed growth, it didn’t really meet the high expectations. Uncertainty around trade and public market volatility likely contributed to the subdued exit environment. That said, both deal value and count grew in 2025 marking the 2nd consecutive year of growth after troughing in 2023.
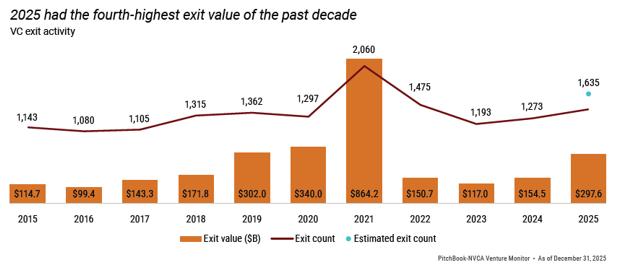
Despite the pickup in exits in 2025, IPOs remain relatively tame. Of the 2025 exits, acquisitions accounted for a majority of the count and value (Pitchbook). Public companies remain cautious about M&A activity, and with IPO window slow to open, more acquisitions are actually coming from other VC-backed companies. In fact, VC-backed buyers accounted for 38% of all VC M&A activity, up from around 20% in 2015 (Pitchbook).
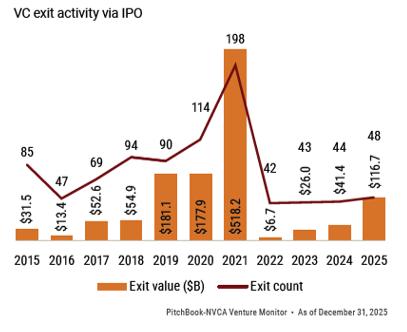
Exit liquidity remains critical to be able to turn the unrealized values into actual returns and distributions. Companies are staying private longer and fund managers are holding on to positions longer which is delaying the return of capital to LPs. We expect 2026 to build on 2025's positive momentum in exit activity. We may even see some of the large, mature AI companies IPO in 2026 or 2027.
As liquidity channels reopen and transformative technologies like AI continue to attract massive inflows, 2026 offers cause for optimism provided investors partner with managers who demonstrate disciplined deployment and a track record of identifying durable winners. Beyond AI, we favor areas exhibiting secular tailwinds and attractive risk/reward dynamics, including cybersecurity, defense tech, fintech, healthcare, robotics, and big data.

Market Overview
Commercial real estate is a very large and diverse asset class that’s been a core holding in private market portfolios for its risk-adjusted returns, diversification, and tax efficiency. The asset class comprises approximately $20.6T of value spread across sectors such as: Multifamily, Industrial, Office, etc (iCapital). While macro-economic trends may affect all of these sectors, they have their own unique fundamentals to be considered as well.
Broadly, real estate continues to digest a struggling office market since the COVID pandemic and higher interest rate environment. Valuations have broadly reset as prices of most sectors are still below their peak in 2022 but have stabilized. Cap rates have adjusted higher but are still compressed when comparing the spread over U.S. Treasuries.
Despite the resetting that has taken place, the real estate market still faces some challenges on the debt side. Mortgage Bankers Association estimates that 17% ($875B) of commercial mortgages held by lenders and investors is scheduled to mature in 2026, which represents a 9% decrease from 2025. The good news is that we’re moving past peak maturity wave, but there is still a lot of debt that will need to be refinanced higher, especially the 2021-2022 vintages that originated at peak valuations that will face a much higher cost of debt, often requiring capital infusions or loan modifications to bridge the gap.
So, while it does appear that real estate is broadly stabilizing, there are still some headwinds to be navigated. Below, we examine the key dynamics shaping the asset class and provide our perspective on individual sectors.
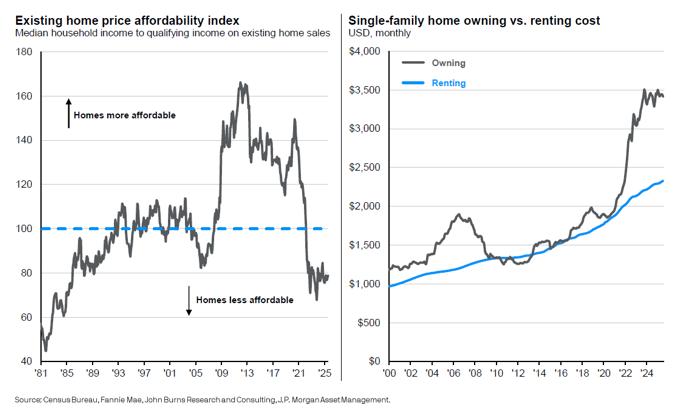
Multifamily continues to be viewed as a core allocation in real estate strategies. Housing affordability continues to be a challenge for aspiring homeowners in part due to higher mortgage rates, but also structural supply shortage of homes. In fact, Zillow estimates America’s housing shortage to be near 4.7 million units. Mortgage rates may be range bound for some time, so until regulatory changes accelerate new construction, renting will likely remain more economically accessible than home ownership for many households, supporting multifamily fundamentals.
Multifamily fundamentals are recovering. During the COVIDera stimulus period, developers accelerated construction starts in 2021-2022, leading to elevated supply in 20232024. Developers who underwrote deals at cap rates in the mid-4% range and didn’t account for higher interest rates are now facing some pressure, especially as oversupply over the last few years has led to an increase in vacancy rates and pressured rent growth.
This has led to an increase in delinquencies; however, this appears to be contained in private-label CMBS. Agencybacked debt through Fannie Mae and Feddie Mac which represents the largest cohort of multifamily debt, maintains delinquency rates below 1% according to the Mortgage Bankers Association.
However, new multifamily construction starts have fallen sharply. According to Blackstone, US multifamily starts are down 62% from their recent peak. The dramatic decrease in supply should help support occupancy rates and rent growth over the next few years.
We see attractive opportunities in ground-up multifamily development for patient capital, particularly in affordable housing, as well as value-add strategies given that 48% of US multifamily stock is over 45 years old (iCapital). Geographic selection will be critical. Sun Belt markets like Austin and Orlando currently face higher vacancy rates from oversupply, while gateway cities like New York and San Francisco have proven more resilient (JPMorgan). Careful analysis of local supply/demand dynamics will be essential in the years ahead.

The industrial segment has been one of the best performing areas of the real estate market over the last decade. However, the industrial market has had an imbalance of supply which has outstripped demand in the last few years resulting in higher vacancy rates and lower rent growth. With net supply expected to ease, we believe the industrial market will get in better balance which should support stabilizing rent growth.
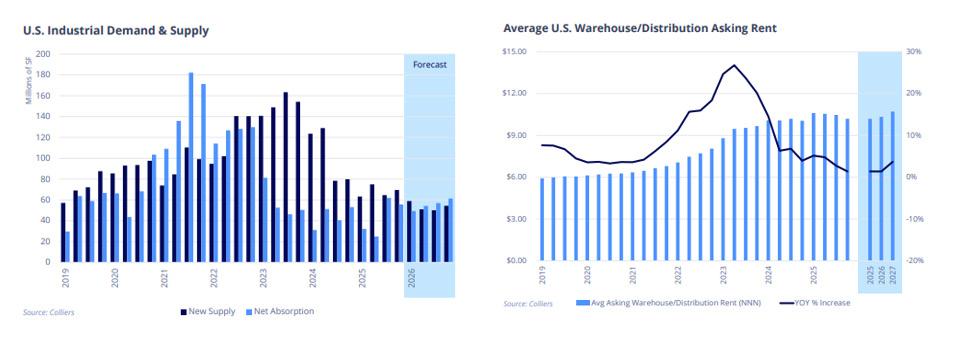
The industrial market is still supported by the structural growth of ecommerce sales relative to total sales. According to the U.S. Census Bureau and Prologis research, with ecommerce penetration currently at 24% and projected to reach 30% by 2030, they estimate that this shift alone would generate 250-350 million square feet of logistics demand.
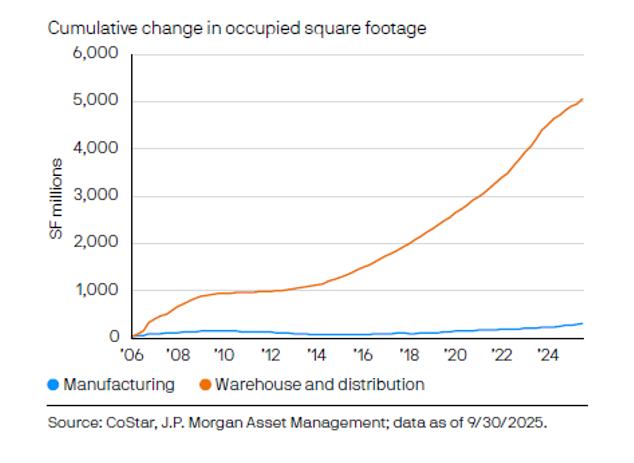
Much of the growth in the industrial market has been in logistics, warehouse, and distribution, while manufacturing has lagged. According to JPMorgan, since 2001, warehouse and distribution space in the US has grown by five billion square feet, whereas manufacturing has only added 350 million square feet. However, increased focus on reshoring critical manufacturing and supply chain resilience may catalyze demand for manufacturingoriented industrial assets.
The office sector warrants specific attention. Fundamentals continue to look weak, vacancies are high, net operating income growth has been negative, and delinquencies are high (JPMorgan). That said, the worst of the carnage appears to be behind us.
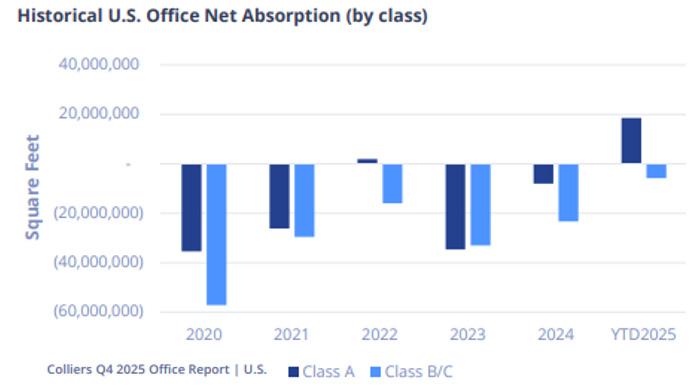
Office space under construction has been falling rapidly in the last several years which has resulted in 2025 (through Q3) seeing positive net absorption. Newer Class A properties have seen much stronger performance than older Class B/C properties, which account for most vacancies. Additionally, sublease availability appears to have peaked and has started descending.
While there are potential signs of bottoming, fundamental concerns persist. In addition, remote/work-from-home trend remains a reality in the post-pandemic environment. Office-toresidential conversions have proven far more difficult and costly than anticipated. The worst may be behind us, but we continue to take a cautious view of the office market.
Our Perspective
As markets digest post-pandemic shifts and higher rates, improving supply-demand dynamics across select sectors should support stronger risk-adjusted returns relative to recent years. For patient capital, selective investments in multifamily ground-up development, especially in workforce housing, appear attractive. Within Industrial, manufacturing may present some opportunities in addition to broad warehouse and distribution. While office is showing signs of bottoming, we’re not out of the woods, and still taking a cautious view of the space.

Broadly, we characterize private debt as loans provided by nonbank lenders that are not traded on public markets, but the industry sometimes uses the term private credit interchangeably with private debt. The main types of private debt include:
Direct Lending
Senior loans made to middle-market companies without an intermediary. Interest rate floats at premium to risk-free rate.
Mezzanine Debt
Subordinated debt with equity-like features that is often used in leveraged buyouts (LBOs).
Distressed Debt
Below investment grade or non-performing loans.
Real Estate Debt
Typically issued via direct lending for real estate acquisitions.
Special Situations
Debt made with the intent of gaining control of a company, generally one in financial distress.
Infrastructure Debt
Debt used for infrastructure development and investment in existing assets, generally with much longer terms.
Venture Debt
Short to medium term debt financing provided to venture-backed companies by specialized banks or nonbank lenders.
Of these, direct lending is the largest and most common strategy. However, all debt types have unique characteristics that warrant careful consideration before investment. For purposes of this report, we’ll mainly focus on direct lending.
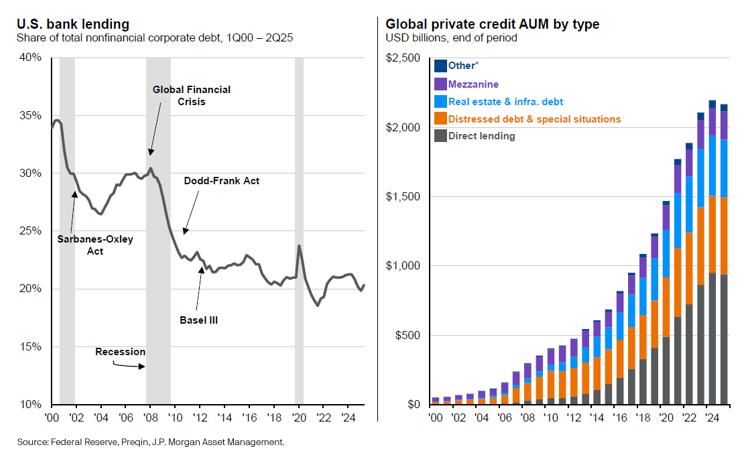
Private debt assets under management (AUM) have grown substantially over the last decade but growth accelerated post the Global Financial Crisis. The passing of the Dodd-Frank Act and Basel III were designed to enhance bank safety by requiring them to hold more higher-capital assets and improve liquidity essentially reducing banks’ ability to hold illiquid, higher-risk loans. Since then, U.S. banks’ share of nonfinancial corporate debt has moved lower paving the way for private debt managers to take more share of illiquid, higher-risk loans.
The growth of direct lending has enabled private debt lenders to move beyond middle-market debt and compete for larger borrowers. These larger borrowers have historically sourced capital from banks through the leveraged loan market of which the largest cohort is Broadly Syndicated Loans (BSL). These loans generally are senior secured, floating rate loans with higher liquidity through an active secondary market. Given the similar purpose of leveraged loans and private direct lending, they are often compared to one another yet carry some important distinctions.and distribution. While office is showing signs of bottoming, we’re not out of the woods, and still taking a cautious view of the space.
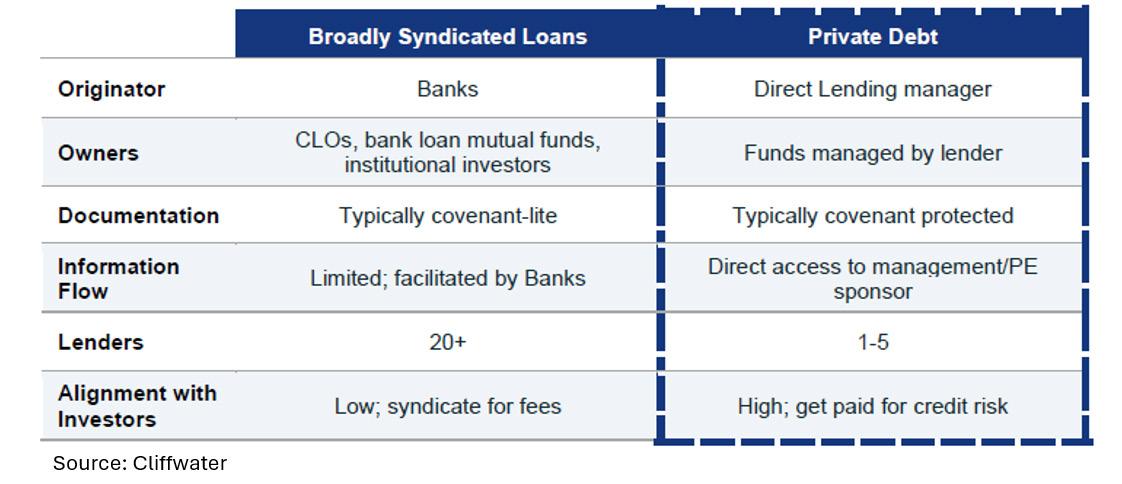
At a high level, private direct lending offers higher yields in exchange for concentrated portfolios of illiquid and higher risk debt. However, private direct lending typically includes stronger covenant protection, whereas most BSLs are covenant-lite. Covenants are lender protection against a company’s poor financial performance and generally include financial tests such as leverage tests, interest coverage tests, etc. If a covenant is triggered, lenders have several options: waive the breach, renegotiate terms with higher rates or penalties, or (in sponsorbacked deals) request cash equity infusions. That said, we’ve seen a growing share of large private credit loans having lower underwriting standards and being deemed covenant-lite.
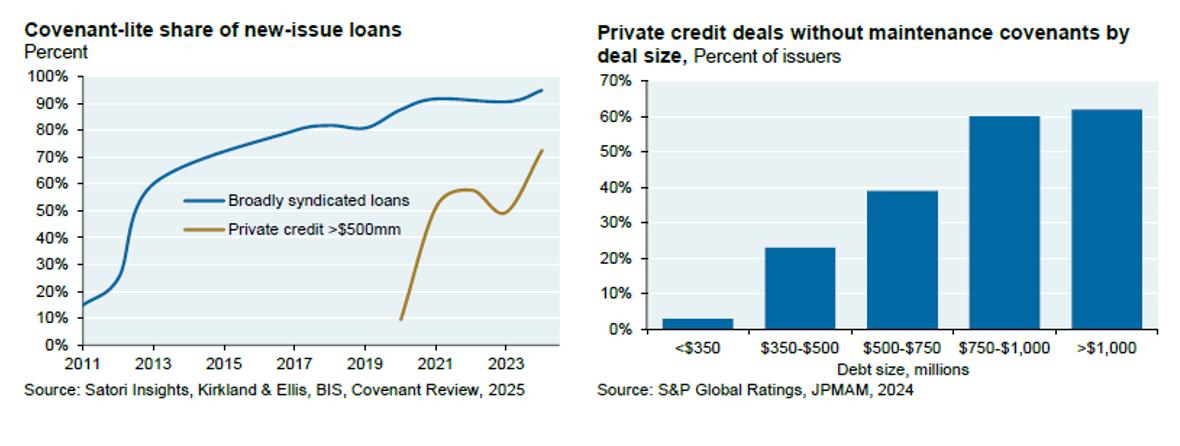
The differences are important because often private credit loan yields are compared to leverage loan yields and the risk-free rate (yield spreads). While private direct loans typically offer higher yields, the spread of those yields changes over time as shown below. In recent years, we’ve seen spreads decline relative to the riskfree rate (SOFR) and leveraged loans. So, while absolute yields are high, the compensation for illiquid and higher credit risk has compressed.
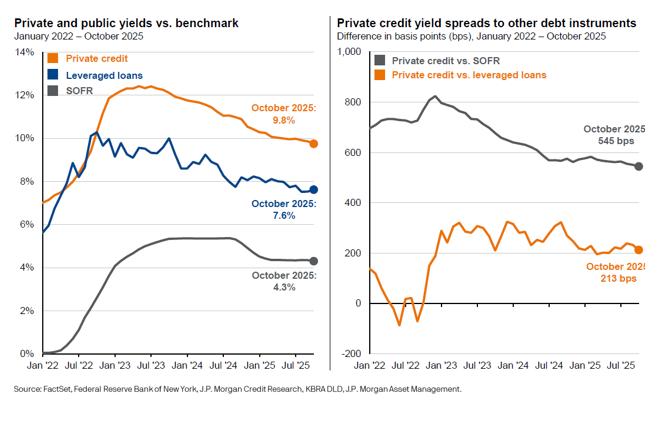
Defaults in private credit have been relatively low in recent years—as expected during nonrecessionary periods. Combined with increased competition for deals, this explains the spread compression. Another growing trend that is raising concerns on the creditworthiness of private credit borrowers is the increased usage of Payment-InKind (PIK). This feature in private credit allows borrowers to defer paying interest by adding the interest to the loan’s principal balance. It provides flexibility to the borrower, but in some cases can be a leading sign of distress. Distinctions are often made between “good PIK” and “bad PIK”, whereby good PIK is an intentional feature added at origination for strong borrowers vs. bad PIK where the PIK feature is added as an amendment due to growing financial distress.
According to Lincoln International’s latest Q2 2025 report, the percentage of investments with PIK has grown from 6.6% in 2021 to 11.4% in Q2 of 2025.
However, the greater concern is that a growing share of those PIK features are classified as bad PIK. The percentage of PIK investments deemed as “bad PIK” was 33.3% in 2021 but has grown to be 53.3% in Q2 2025. Small companies with EBITDA below $50MM make up the largest share of bad PIK.
We take a cautious stance toward direct lending given weakening underwriting standards, rising use of ‘bad PIK,’ and compressed yield spreads despite these elevated risks Given these broader trends, selectivity will be paramount. Manager selection is critical, with a focus on those demonstrating experience navigating credit cycles, stringent underwriting standards, covenant-protected loans, and a commitment to higher-quality borrowers.
Private markets have never been more complex—or more consequential—for institutions, family offices, and ultra-high-networth investors. As we've outlined throughout this outlook, the landscape has fundamentally shifted: capital has flooded the asset class, competition for the best opportunities has intensified, and the dispersion between top-tier managers and the rest of the field has never been wider. In this environment, the questions we posed at the outset matter more than ever—what opportunities warrant your capital, at what terms, and with which partners.
The asset class-level dynamics reinforce this point. In private equity, improving exit conditions and substantial dry powder support continued deal activity, though disciplined pricing and patient capital remain essential. Venture capital offers compelling exposure to transformative technologies, particularly AI, but the concentration of returns among a handful of managers demands careful selection. Real estate is finding its footing as supply-demand dynamics improve across multifamily and industrial, though the office sector warrants continued caution. In private debt, while absolute yields remain attractive, weakening underwriting standards and the rising use of "bad PIK" underscore the importance of partnering with experienced managers who maintain covenant protections and credit discipline.
Across all asset classes, three principles guide our approach: manager quality matters more than ever, structural protections and liquidity terms require scrutiny, and portfolio construction must account for the long-term, illiquid nature of these commitments. Private markets continue to offer opportunities unavailable in public markets—but success requires patient capital, disciplined manager selection, and rigorous due diligence.
We are committed to helping you navigate this complex landscape with clarity, rigor, and transparency. Private markets are not appropriate for every portfolio or every situation, but when deployed thoughtfully and with proper alignment, they can serve as powerful tools in achieving your long-term objectives.
We remain deeply grateful for your partnership and look forward to continuing this work together.
THIS COMMENTARY HAS BEEN PREPARED BY CLEARWATER CAPITAL PARTNERS. THE OPINIONS VOICED IN THIS MATERIAL ARE FOR GENERAL INFORMATION ONLY AND ARE NOT INTENDED TO PROVIDE OR BE CONSTRUED AS PROVIDING LEGAL, ACCOUNTING, OR SPECIFIC INVESTMENT ADVICE OR RECOMMENDATIONS FOR ANY INDIVIDUAL. ALL ECONOMIC DATA IS DERIVED FROM PUBLIC SOURCES BELIEVED TO BE RELIABLE. TO DETERMINE WHICH INVESTMENTS MAY BE APPROPRIATE FOR YOU, PLEASE CONSULT WITH US PRIOR TO INVESTING. INVESTING INVOLVES RISK WHICH MAY INCLUDE LOSS OF PRINCIPAL.
This material is not intended to be relied upon as a forecast, research or investment advice, and is not a recommendation, offer or solicitation to buy or sell any securities, insurance products, or to adopt any investment strategy. The opinions expressed are as of the date of writing and may change as subsequent conditions vary. The information and opinions contained in this material are derived from proprietary and nonproprietary sources deemed by Clearwater Capital Partners to be reliable, are not necessarily all-inclusive and are not guaranteed as to accuracy. Past performance is no guarantee of future results. There is no guarantee that any forecasts made will come to pass. Reliance upon information in this material is at the sole discretion of the reader. Investment involves risks. International investing involves additional risks, including risks related to foreign currency, limited liquidity, less government regulation and the possibility of substantial volatility due to adverse political, economic or other developments. Index performance is shown for illustrative purposes only. You cannot invest directly in an index. S&P 500 is a registered trademark of Standard & Poor’s Financial Services, a division of S&P Global (“S&P”) DOW JONES, DJ, DJIA and DOW JONES INDUSTRIAL AVERAGE are registered trademarks of Dow Jones Trademark Holdings (“Dow Jones”). NASDAQ-100 Index®, NASDAQ-100®, NASDAQ Composite Index® are registered trademarks of The NASDAQ OMC Group, Inc. The two main risks related to fixed-income investing are interest rate risk and credit risk. Typically, when interest rates rise, there is a corresponding decline in the market value of bonds. Credit risk refers to the possibility that the issuer of the bond will not be able to make principal and interest payments. Private Market investing is for Accredited Investors and Qualified Purchasers only. Private market investing involves liquidity risk as well as operational risk. Private debt is subject to credit and interest rate risk. Investment Advice Offered Through Clearwater Capital Partners, A Registered Investment Advisor. 20260303-6