Bonneville County Market Report March 2026

Page 1


March 2026

In March 2026, Bonneville County home prices were up 1 2% compared to last year, selling for a median price of $390,000. On median, homes in Bonneville County sell after 37 days on the market, down 21% from last year in March. There were 129 homes sold in March this year, up 0.8% from last year.

Median Sales Price

$390,000

Up 2.5% from prior month

Up 1.2% from prior year

Residential Closed Sales

129

Up 15% from prior month

Up 0.8% from prior year

Information pulled on 03/02/2026

Current Listing Inventory

366

Down 0.2% from prior month

Up 8.8% from prior year

Median Days On Market

37

Down 44% from prior month

Up 21% from prior year

The information in this report is compiled from a report given by the Snake River MLS and to the best of our knowledge is accurate and current.

As of 03/02/2026. By month dating from March 2024 to March 2026. Days on Market is the

Median Sales Price


Active Residential Listings

As of 03/02/2026. By month dating from March 2024 to March 2026. Active Inventory is the number of properties for sales at the end of the month, based on the contract date.

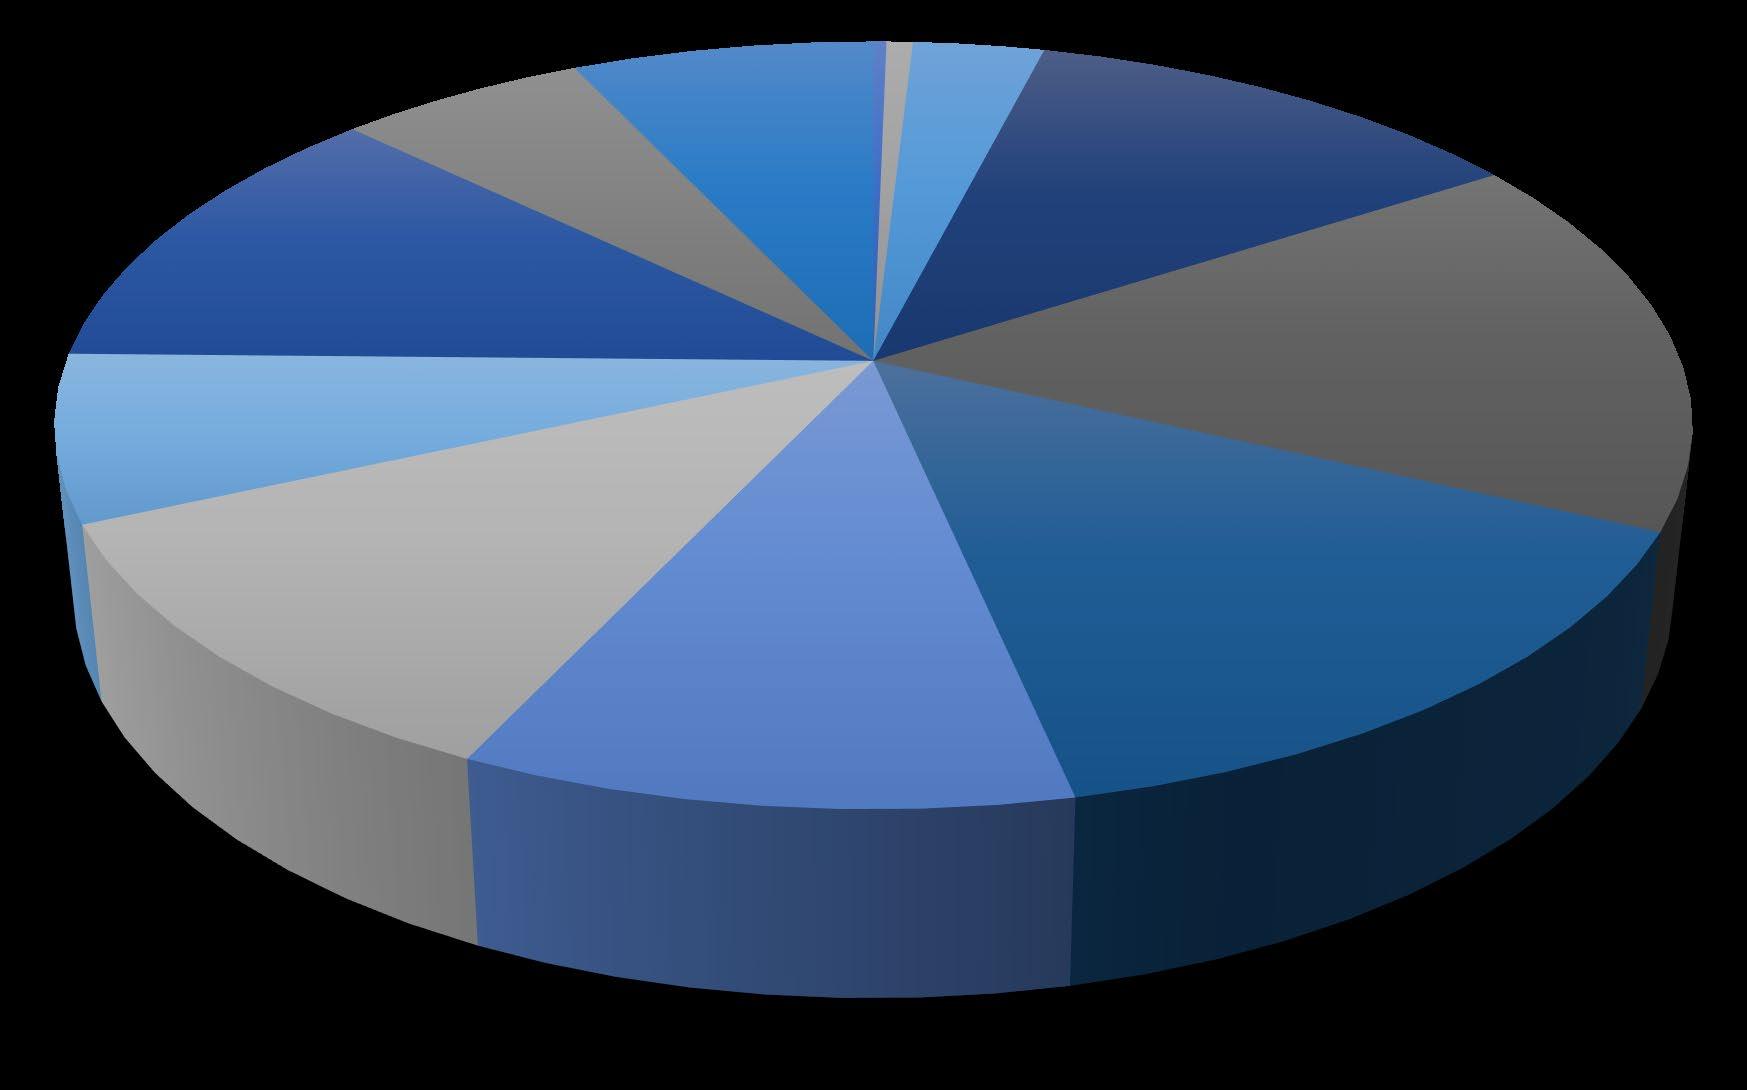
Active Listings By Price Range

As of 03/02/2026 for the month of March.

Residential Closed Sales

As of 03/02/2026. By month dating from March 2024 to March 2026. Closed Sales is the number of properties sold.

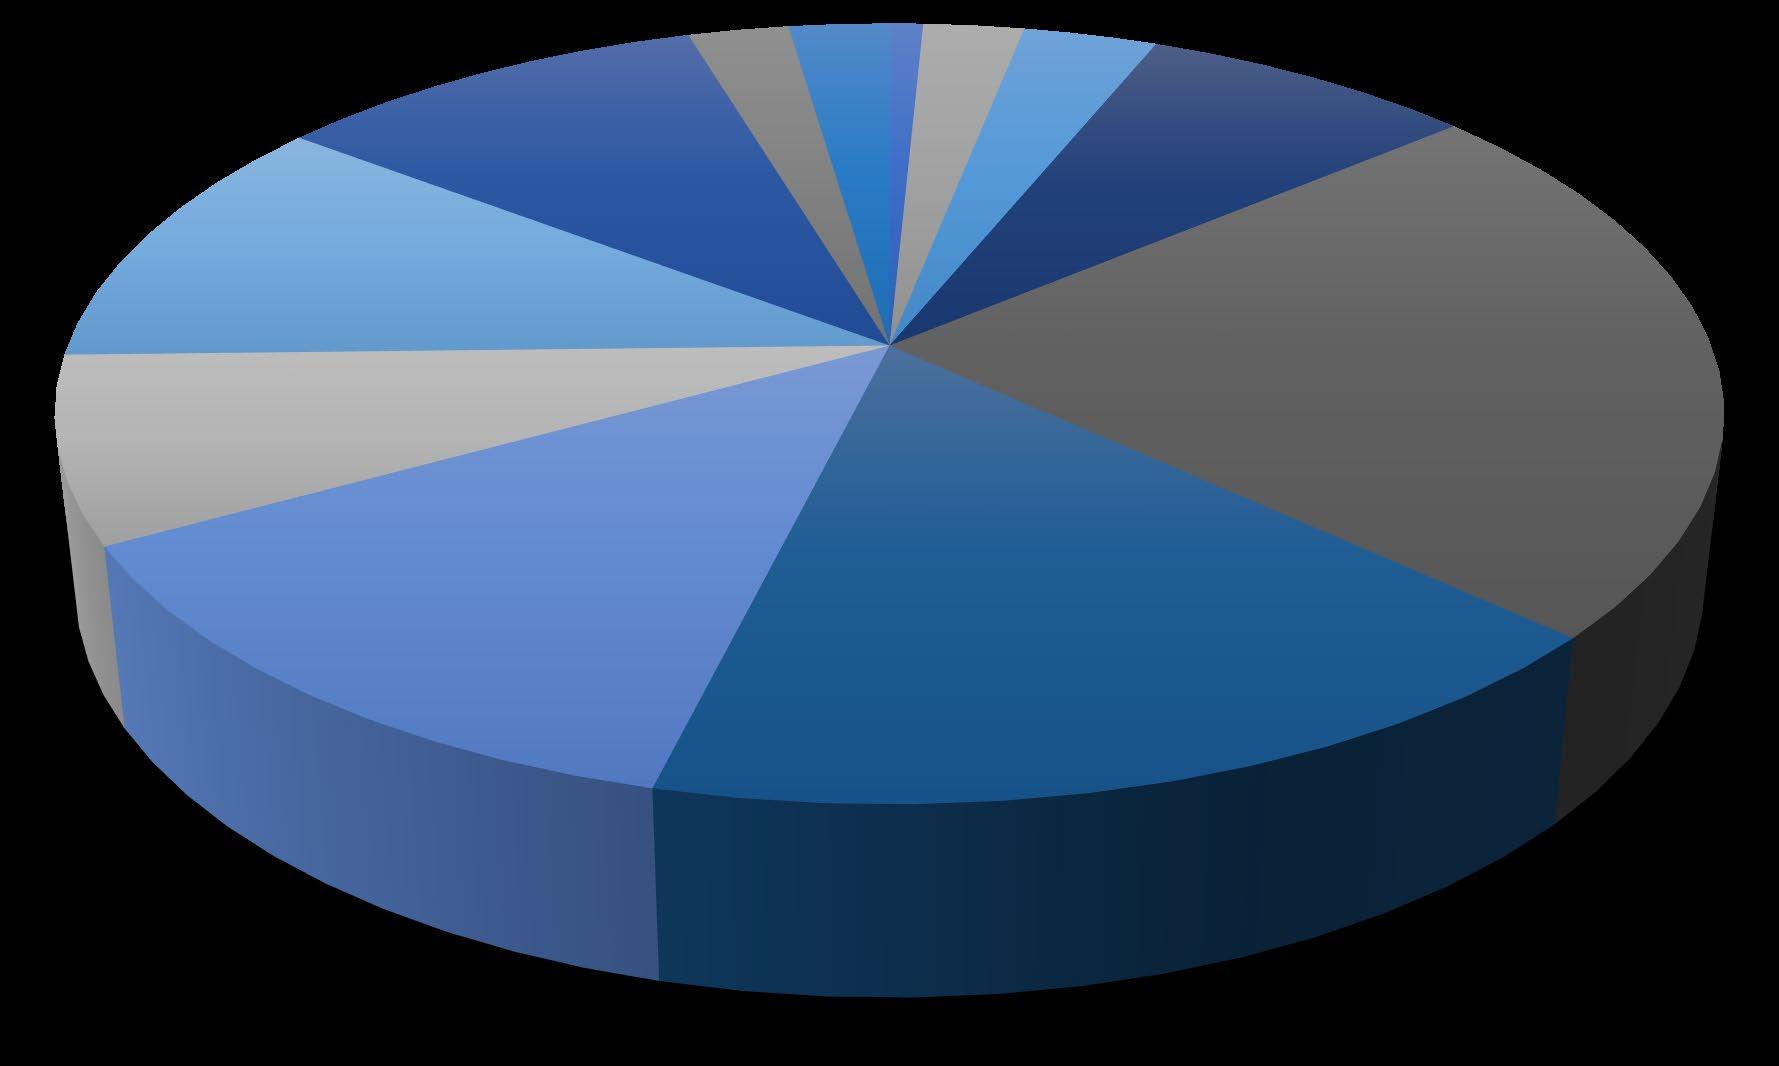
Sold Listings By Price Range

As of 03/02/2026 for the month of March.

Annual Median Sales Price

Annual Residential Closed Sales

Monthly Mortgage Rates

Monthly 30-year fixed mortgage rates highlighting the week ending Thursday, March 28, 2026.

Sale-to-List Price Ratio

As of 03/02/2026. By month dating from March 2024 to March 2026. Sale-to-List Price Ratio is the average of sales price divided by the final list price expressed as a percentage.

100.0%100.0%100.0%

Turn static files into dynamic content formats.

Create a flipbook
Bonneville County Market Report March 2026 by Coldwell Banker Tomlinson - Issuu