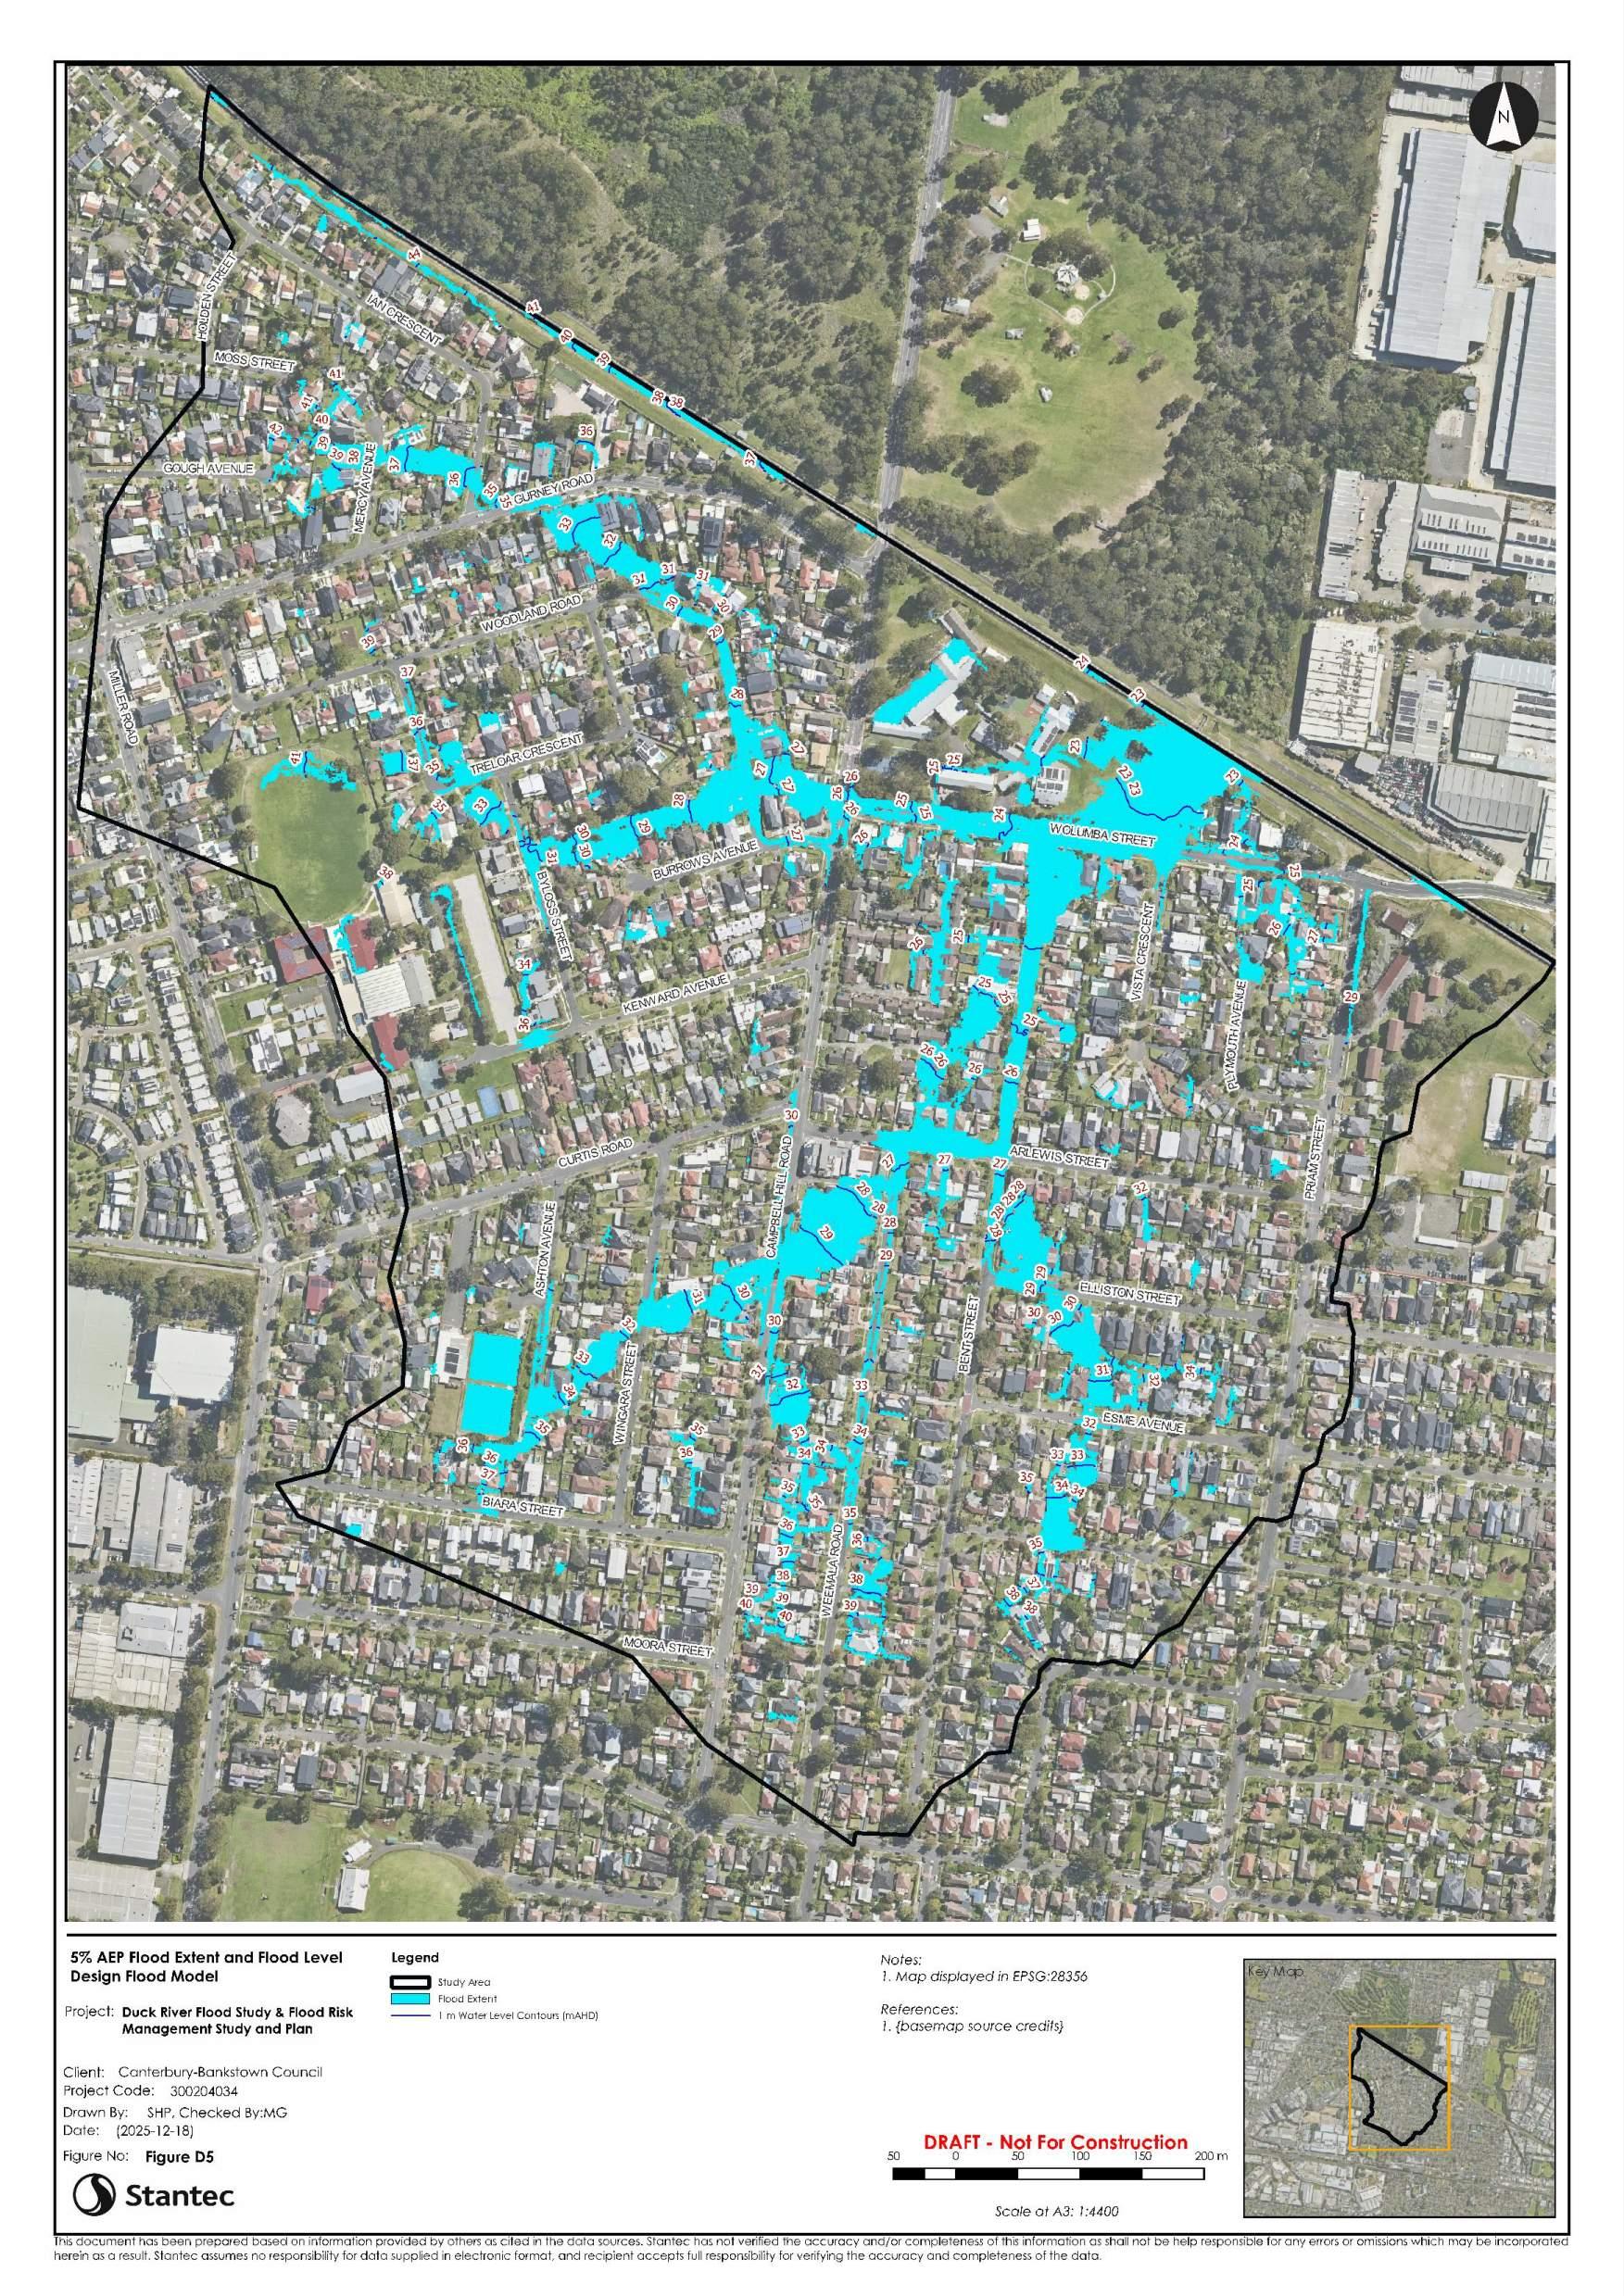
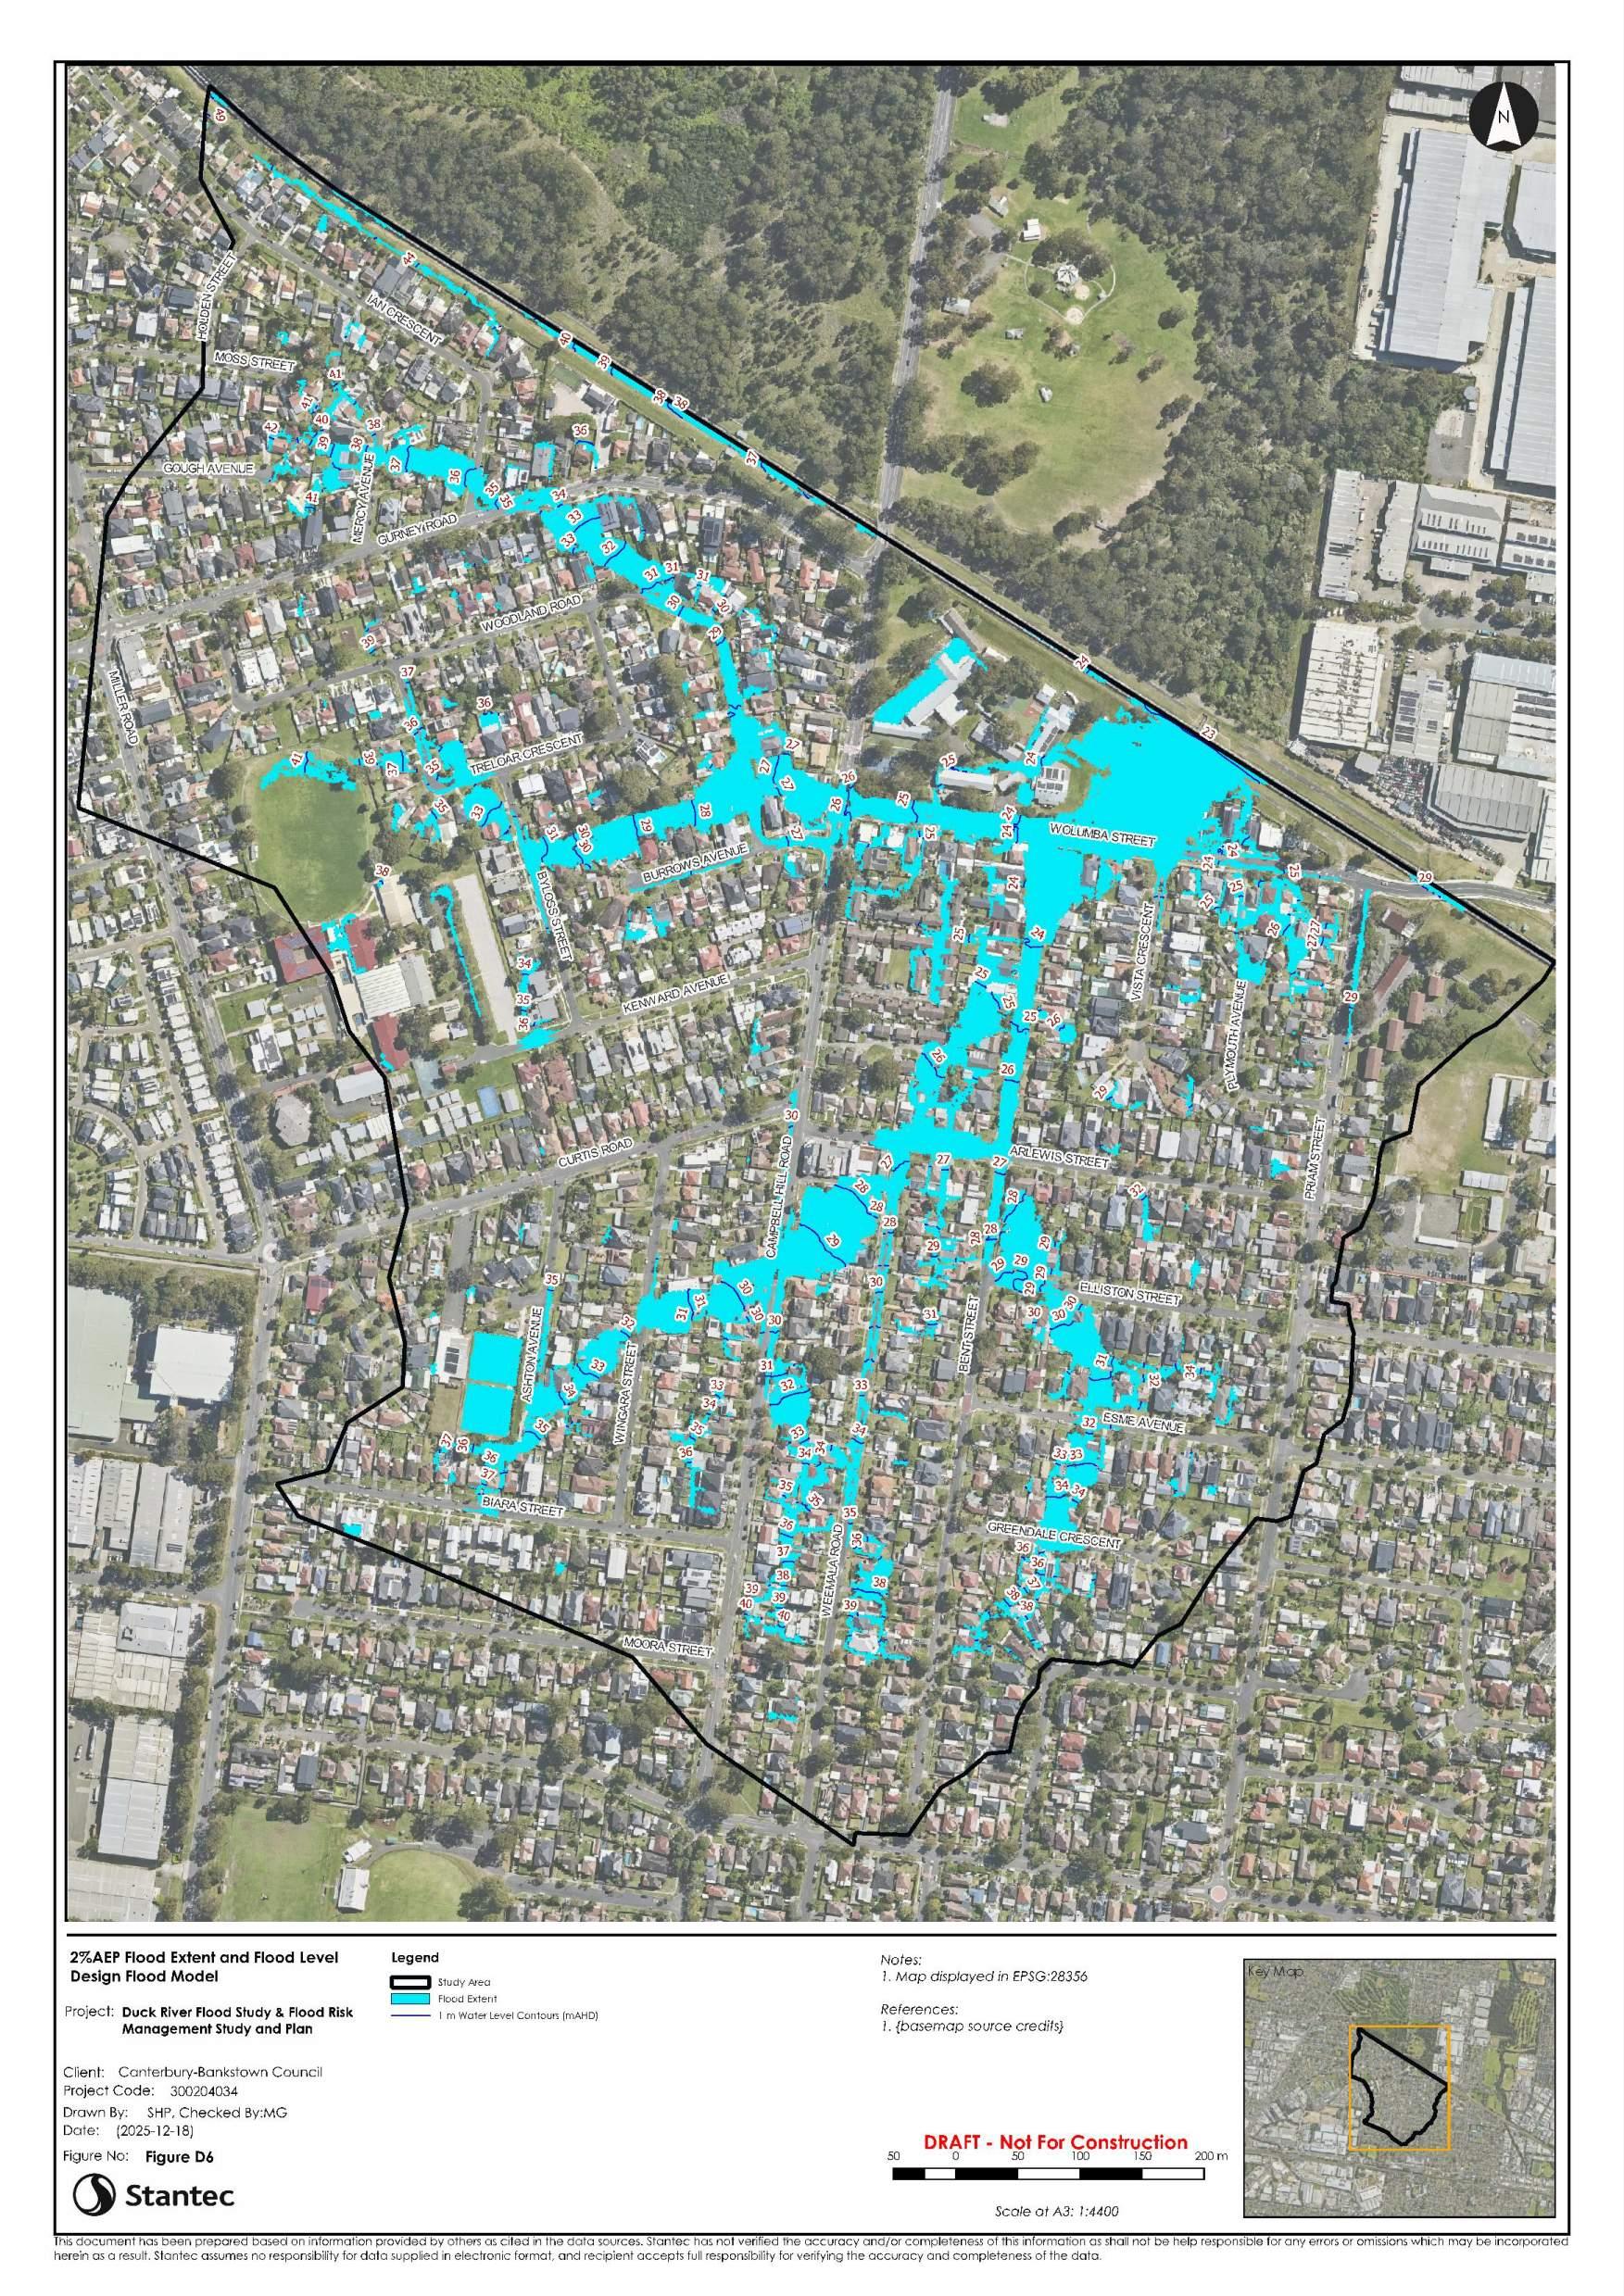
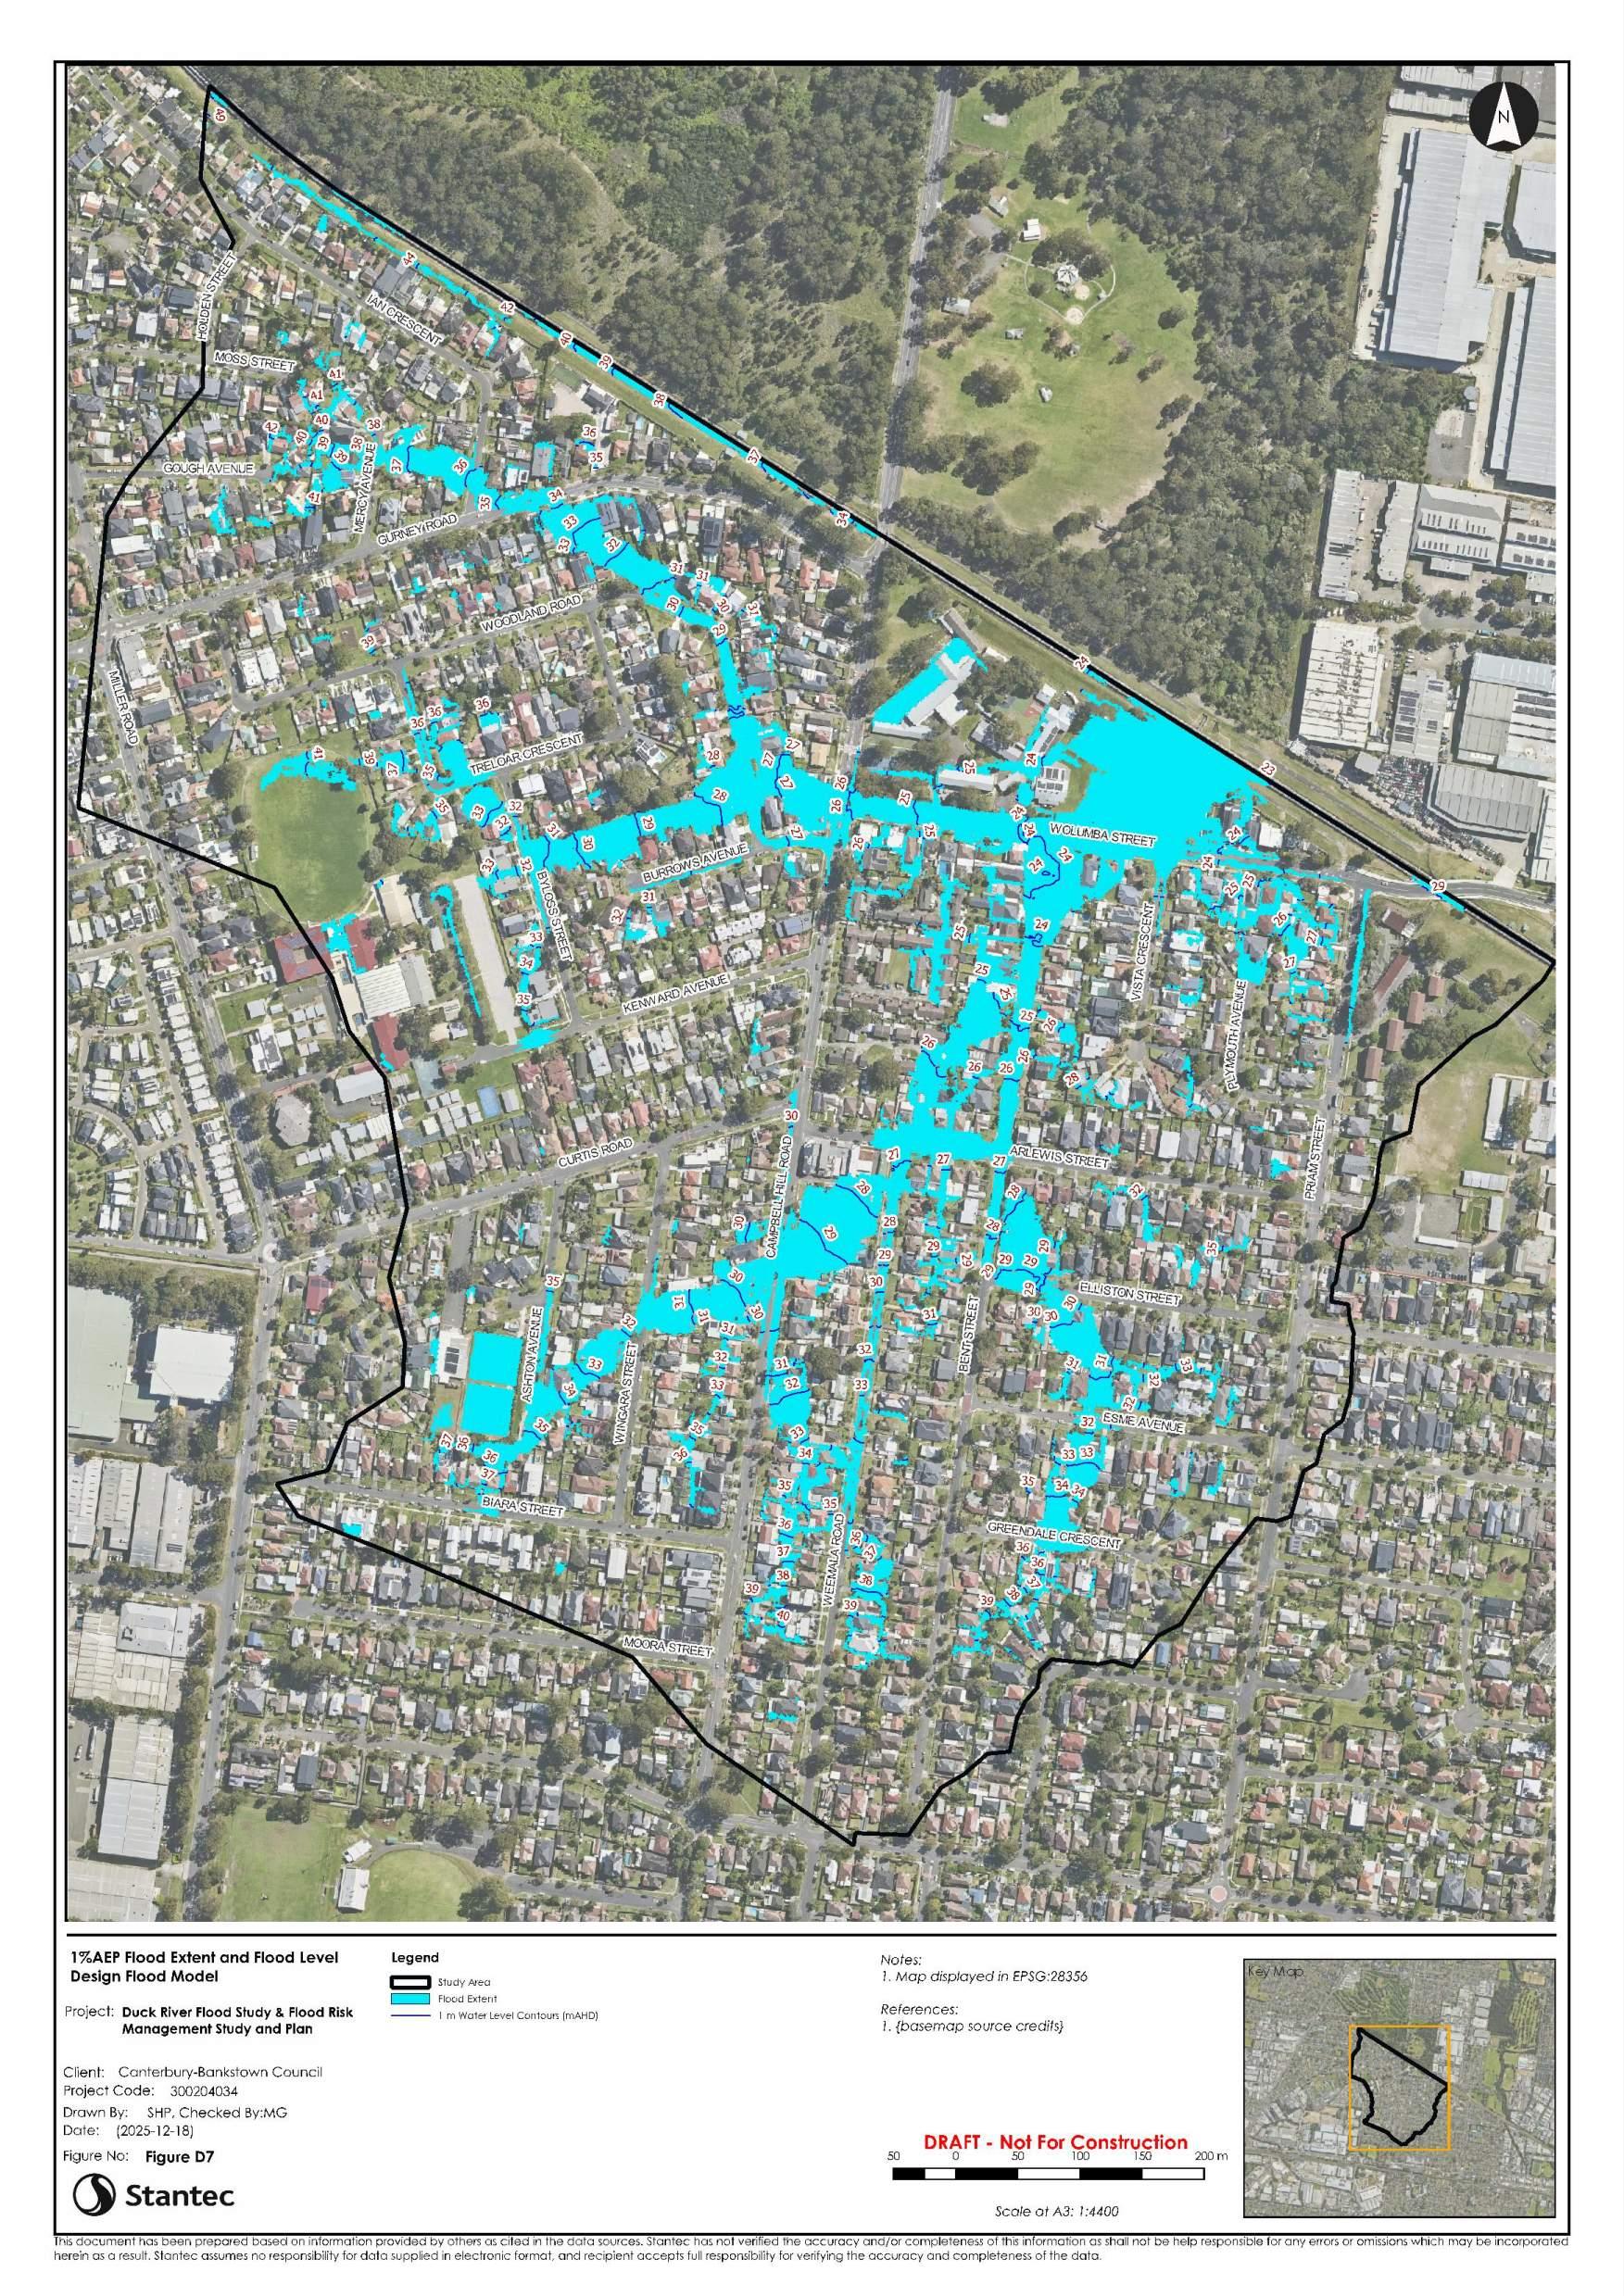
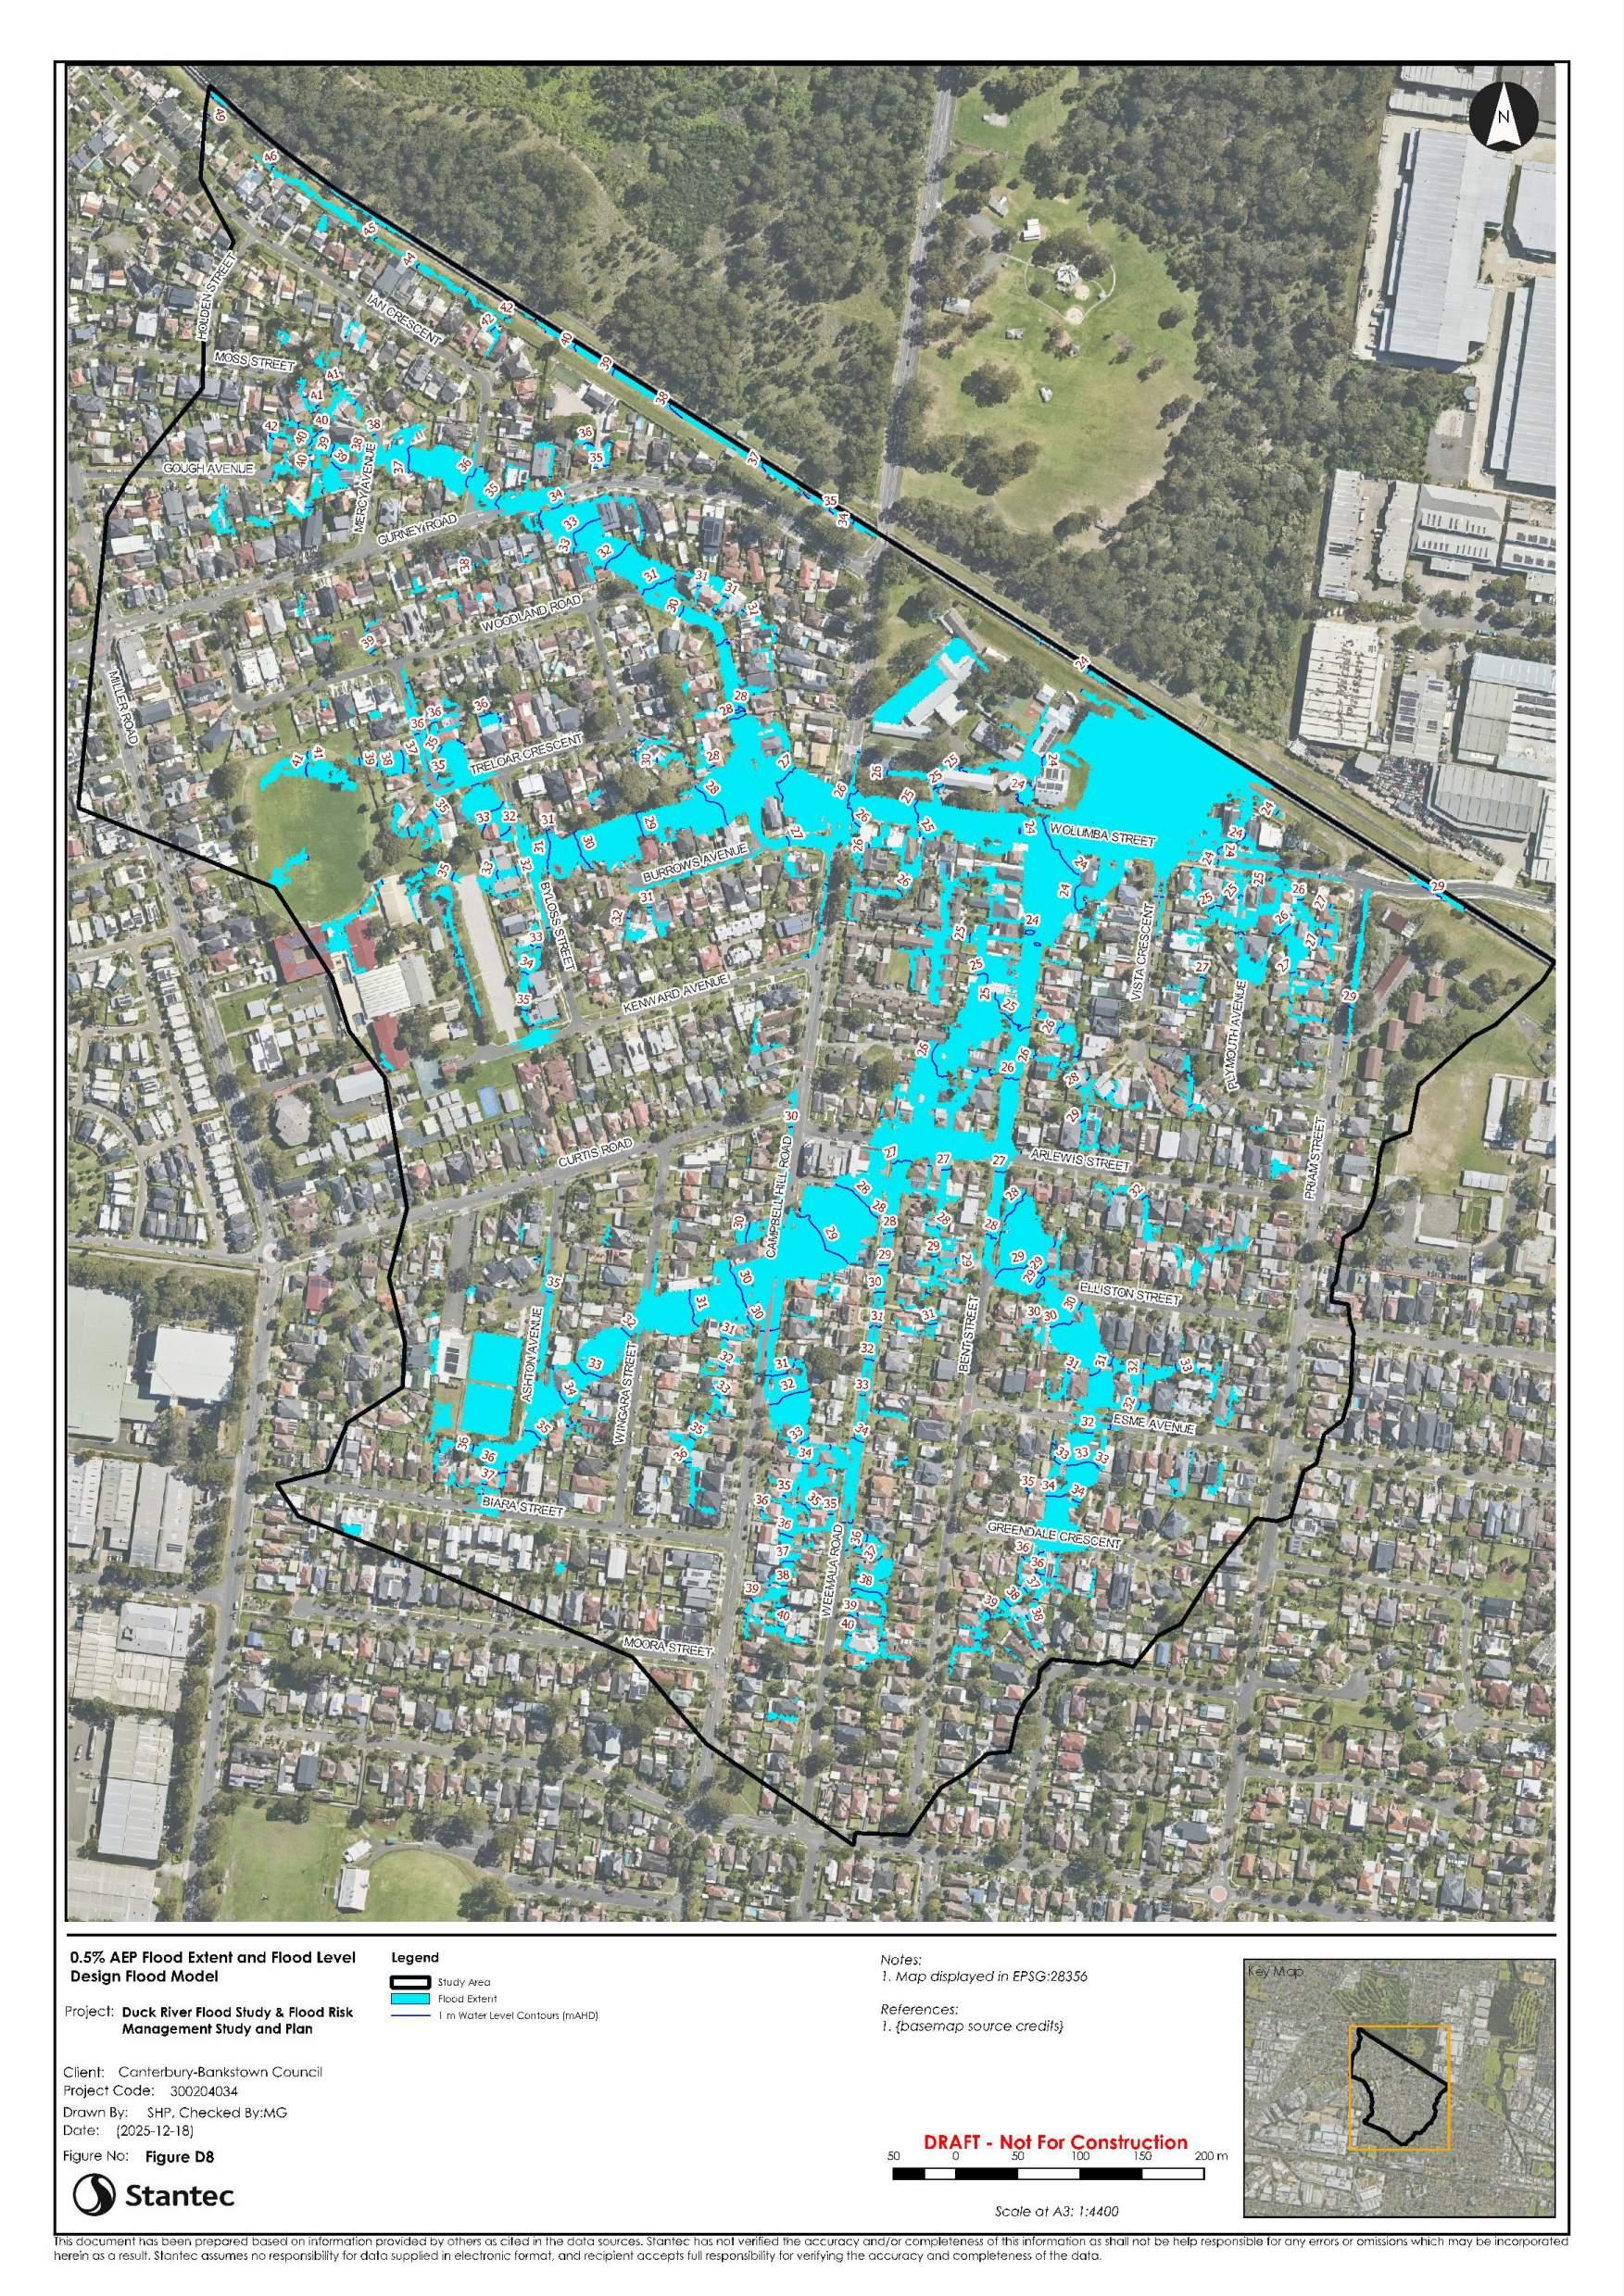
Project/File: Duck River Sub-Catchments Flood Study & Flood Risk Management Study and Plan
This document, Wolumba Flood Study Update, 2026, is licensed under the Creative Commons Attribution 4.0 Licence, unless otherwise indicated.
Please give attribution to: Canterbury-Bankstown Council, 2026 We also request that you observe and retain any notices that may accompany this material as part of the attribution.
Notice Identifying Other Material and/or Rights in this Publication:
The author of this document has taken steps to both identify third-party material and secure permission for its reproduction and reuse. However, please note that where these third-party materials are not licensed under a Creative Commons licence, or similar terms of use, you should obtain permission from the rights holder to reuse their material beyond the ways you are permitted to use them under the Copyright Act 1968. Please see the Table of References at the rear of this document for a list identifying other material and/or rights in this document.
Further Information
For further information about the copyright in this document, please contact: Canterbury-Bankstown Council 66-72 Rickard Road, Bankstown NSW 2200 council@cbcity.nsw.gov.au 02 9707 9000
DISCLAIMER
The Creative Commons Attribution 4.0 Licence contains a Disclaimer of Warranties and Limitation of Liability. In addition: This document (and its associated data or other collateral materials, if any, collectively referred to herein as the ‘document’) were produced by Stantec for CanterburyBankstown Council only. The views expressed in the document are those of the author(s) alone, and do not necessarily represent the views of the Canterbury-Bankstown Council. Reuse of this study or its associated data by anyone for any other purpose could result in error and/or loss. You should obtain professional advice before making decisions based upon the contents of this document.
Canterbury-Bankstown Council is undertaking this work with both technical and financial support from the NSW Department of Climate Change, Energy, the Environment and Water (DCCEEW) The contributions to the delivery of this project by the Canterbury-Bankstown Flood Risk Management Committee are also acknowledged
The conclusions in the report titled Wolumba Flood Study Update Report are Stantec’s professional opinion, as of the time of the Report, and concerning the scope described in the Report. The opinions in the document are based on conditions and information existing at the time the scope of work was conducted and do not take into account any subsequent changes. The Report relates solely to the specific project for which Stantec was retained and the stated purpose for which the Report was prepared. The Report is not to be used or relied on for any variation or extension of the project, or for any other project or purpose, and any unauthorized use or reliance is at the recipient’s own risk.
Stantec has assumed all information received from Canterbury-Bankstown Council (the “Client”) and third parties in the preparation of the Report to be correct. While Stantec has exercised a customary level of judgment or due diligence in the use of such information, Stantec assumes no responsibility for the consequences of any error or omission contained therein.
This Report is intended solely for use by the Client in accordance with Stantec’s contract with the Client. While the Report may be provided by the Client to applicable authorities having jurisdiction and to other third parties in connection with the project, Stantec disclaims any legal duty based upon warranty, reliance or any other theory to any third party, and will not be liable to such third party for any damages or losses of any kind that may result
Prepared by Signature
Sahar Hadi Pour Printed Name
Reviewed by Signature
Martin Griffin Printed Name
Approved by Signature
Martin Griffin
Printed Name
Foreword
The primary objective of the NSW Flood Prone Land Package 2021 is to reduce the impact of flooding and flood liability on communities and individual owners and occupiers of flood prone property, and to reduce private and public losses resulting from floods, utilising ecologically positive methods wherever possible.
The previous policy formed part of the New South Wales (NSW) Floodplain Development Manual (FDM) in 2005 Subsequent updates in NSW flood risk management include:
• The 2021 Flood Prone Land Package Update was released in July 2021. The Flood Prone Land package included a new planning direction, planning circular, guideline, standard floodrelated Local Environment Plan (LEP) instruments, and several planning legislation changes.
• The finalised and gazetted Flood Risk Management (FRM) Manual was adopted on 30 June 2023. The Manual replaces the FDM 2005 and a number of previous technical guides. The manual provides advice to local councils on the management of flood risk in their local government areas through the flood risk management framework and flood risk management process. This update builds on the 2005 manual and guides. It considers lessons learnt from floods and the application of the flood risk management process and manual since 2005. It considers a range of work on managing natural hazards across government, including relevant national and international frameworks, strategies and best practice guidance. Accompanying the manual is eight FRM Guidelines that comprise a new toolkit to provide guidance for local councils and their consultants
Under the 2021 package, Councils are primarily responsible for managing flood risk to reduce the risk to life, property damage and other impacts in their local government areas. The State Government subsidises flood management measures to mitigate existing flooding problems and provides specialist technical advice to assist Councils in the discharge of their flood risk management responsibilities. The Commonwealth Government often provides further subsidies to implement flood risk management options. The Flood Risk Management Manual 2023 identifies the following ‘process’ for the identification and management of flood risks:
1. Data Collection - Aims to gather the information needed to support the study being undertaken.
2. Flood Study - Aims to define flood behaviour in sufficient detail to support the understanding and management of flood risk.
3. Flood Risk Management Study (FRMS) - Provides the basis for examining and recommending FRM measures to manage risks to the existing and growing community, people and built environment. The measures aim to limit the residual flood risk to the community and how this may change over time.
4. Flood Risk Management Plan (FRMP) - Builds on the recommendations of the FRM study by clearly outlining council’s decision on how it intends to effectively manage flood risk in the study area.
The Wolumba Flood Study Update and Flood Risk Management Study and Plan (FS & FRMS&P) covers steps 1, 2, 3 and 4 in the FRM process and updates the existing understanding of mainstream and overland flow flood behaviour in the Wolumba catchment
Executive Summary
Background
Stantec has been commissioned by Canterbury-Bankstown Council (CBC) to undertake a flood study update and Flood Risk Management Study and Plan (FRMS&P) for the Wolumba catchment within the Canterbury-Bankstown Local Government Area (LGA)
This report summarises the flood study update for the Wolumba catchment, while the FRMS&P outcomes are documented in a separate report. This study will replace the previously adopted Wolumba Catchment Flood Study (BMT WBM, 2010)
The Wolumba study area is an 87 ha (0.87 km2) sub-catchment of Duck River located in the northern part of the CBC LGA to the west of the upper Duck River catchment. The study area covers the northern part of the suburb of Chester Hill, from Miller Road to the west, to Priam Street to the east, and Virgil Avenue to the south.
It is an urban catchment that drains through a stormwater pipe network in a north-easterly direction There have been no significant changes to the sub-catchment since the previous Flood Study was completed in 2010.
The downstream limit of the study area is the Sydney Water (SW) supply pipeline corridor at Sefton with a stormwater culvert and open channel underpass of the pipeline near Chester Hill North Public School.
The study will be used by CBC and various stakeholders to inform flood planning and emergency management in the study area. The outputs of the Flood Study will provide information on current and future flood risk which is important for increasing community awareness and for building resilience. As part of the flood study update, an updated TUFLOW model was developed which forms the basis of the FRMS&P of this study area.
Model Development
The basis for this Flood Study Update is the Wolumba Catchment Flood Study (BMT WBM, 2010), being the only major past study for the catchment. The TUFLOW model set-up adopted for this Flood Study Update included:
• The TUFLOW engine of the model is based on the 2025-1-1-iSP-w64 release. The TUFLOW HPC quadtree module has been adopted. The projection set up is MGA (Map Grid of Australia) Zone 56 GDA94 (Geocentric Datum of Australia 1994) consistent with CBC GIS (Geographic Information System) database.
• The rainfall-on-grid hydrology approach was adopted as in previous studies, with design rainfall and losses applied in accordance with Australian Rainfall and Runoff 2019 (ARR2019) version 4.2
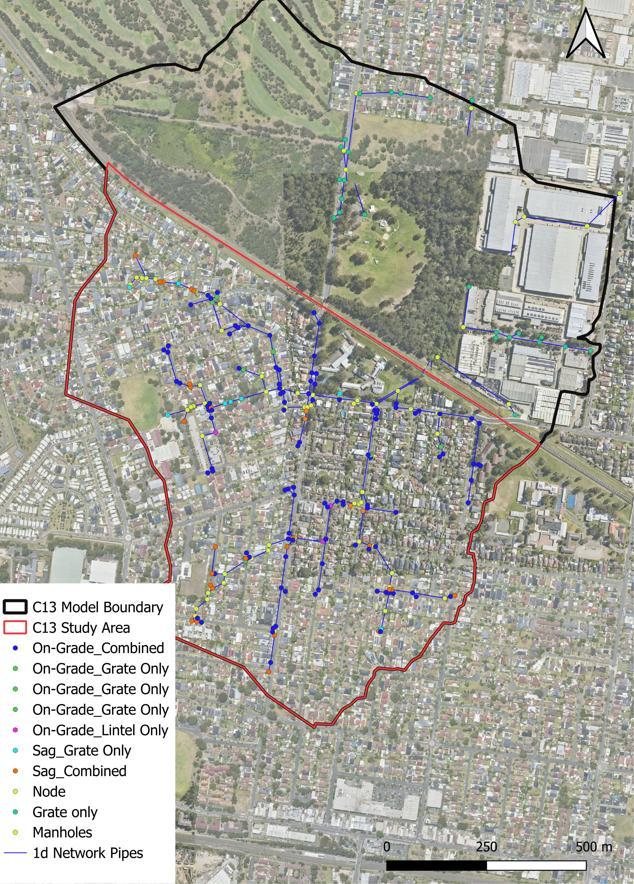
• 1D/2D (one-dimensional/two-dimensional) modelling approach was used whereby the stormwater pit and pipe network and open channel were modelled as 1D elements embedded within a 2D Digital Elevation Model (DEM).
• The model extent was expanded to include catchments to the north within Cumberland City Council (CCC) LGA. This model extension reduced the tailwater assumption sensitivity of the model.
• Use of a 1m, 2m, 4m quadtree grid with more refined grid cell size adopted for the 1% Annual Exceedance Probability (AEP) design flood and Probable Maximum Flood (PMF) extents in the study area.
• The stormwater pit and pipe network in the model was defined using the latest surveyed details made available by CBC. In addition, the stormwater network to the north for CCC LGA was included in the model. Pit capacity was defined by rating curves with 20% and 50% blockage applied to all on-grade and sag pits respectively.
• Buildings were modelled as one of three options - fully blocked (where 1% AEP flood depths were less than 0.3 metres), as high roughness (when 1% AEP depths exceed 0.3m), or raised to surveyed floor levels (for industrial buildings with large footprint).
• Surface roughness based on latest CBC Local Environmental Plan (LEP) land use groupings, with different roughness values also applied.
• The invert levels and details of the concrete-lined channel within the SW pipeline corridor was updated based on available survey, site observations and LiDAR data.
• A blocked (25% for openings less than 4m) and unblocked scenario of the 1% AEP design flood were modelled with results from these two scenarios enveloped. For all other AEPs only the blocked scenario was modelled
The model set-up outlined above is similar to other recent Flood Studies undertaken on behalf of CBC within the LGA
Design Flood Modelling
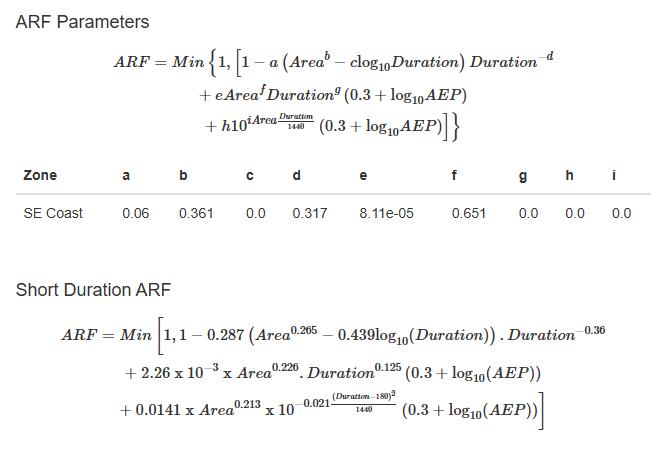
Design flood modelling was conducted using the latest guidance from the ARR2019 version 4.2 including adoption of the year 2030 SSP2 scenario as the design scenario. This adopted scenario accounts for climate change impacts since the derivation of the baseline 2016 IFDs. Conservatively, no ARF was applied to the study area given the relatively small catchment size. The design flood modelling was conducted for ten (10) temporal patterns (TPs) per duration as per guidance from ARR2019.
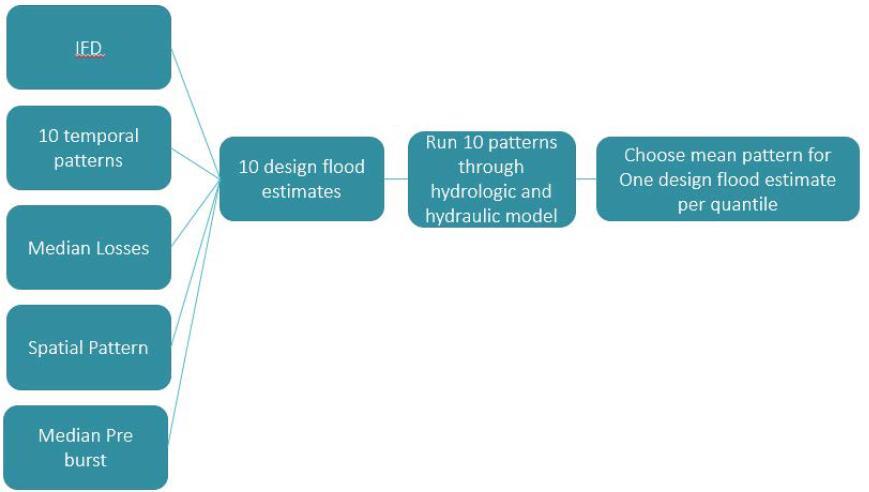
The ensemble modelling approach used a coarser TUFLOW model to efficiently assess temporal pattern (TP) variability across three representative AEPs (20%, 5%, and 1%), enabling selection of a single TP per duration closest to the mean response for detailed modelling. These selected TPs were then applied in the final design model across all events, with critical durations identified. For the 1% AEP, an envelope approach adopted to account for both blocked and unblocked culvert scenarios.
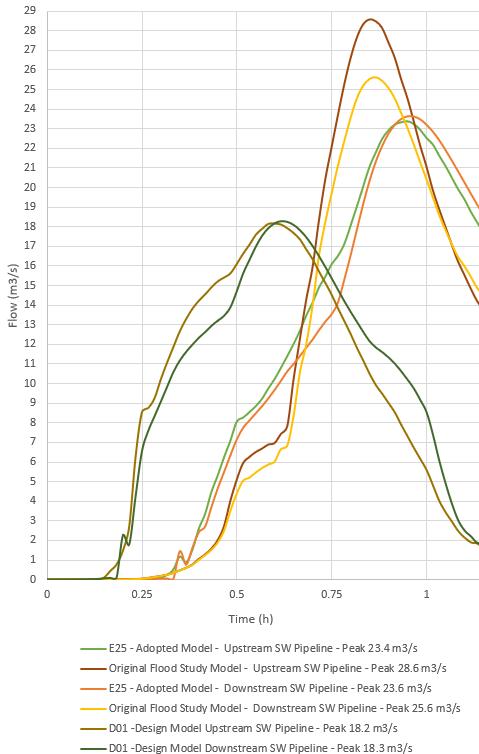
With insufficient data available for calibration for historical rainfall events, the model was validated to previous model results from the original Flood Study. With respect to flow hydrographs at the downstream boundary of the Wolumba catchment there is generally good agreement between the ARR87 version of the current model and the previous models, with slightly lower peak flows in the current model. For the adopted design runs of the current model, the peak flows are significantly lower, with a shorter critical duration as a result of the change from ARR87 to ARR2019 version 4.2.
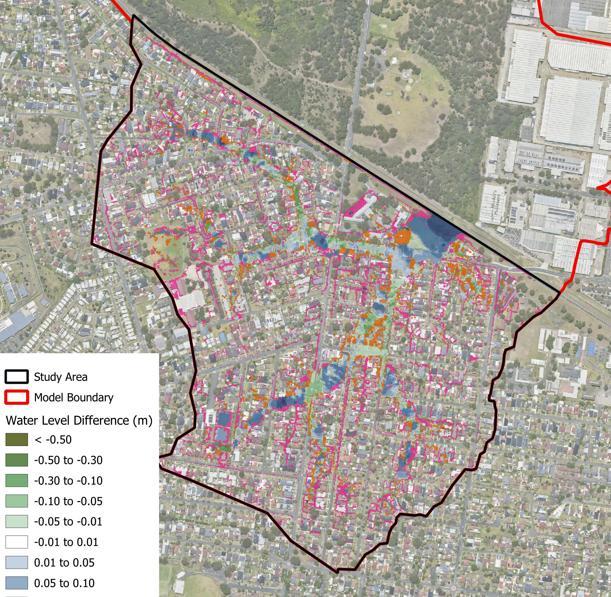
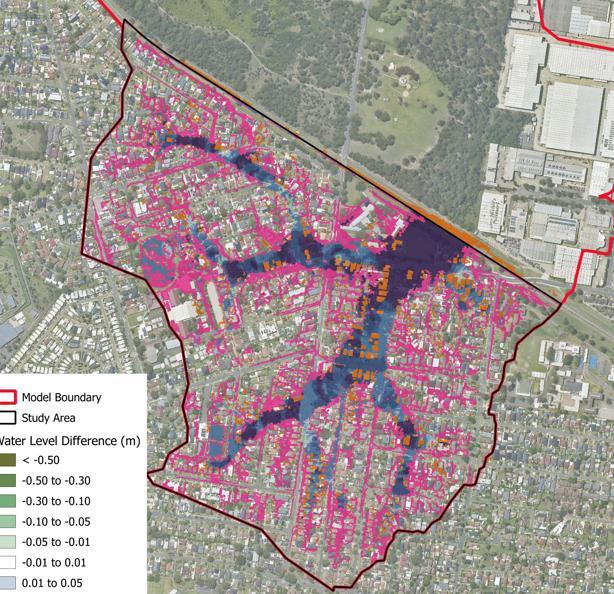
With respect to flood levels, there is generally reasonable agreement between the current model and the results of the 2010 Flood Study. The area of biggest difference is upstream of the SW pipeline corridor with higher levels across the ponding area at the study area boundary.
It is noted that ultimately the current TUFLOW model has been set-up using the latest available modelling practices, and software, with additional data now available for the study area as well. Differences reflect updated data and contemporary methods; validation provides confidence in the model outcomes
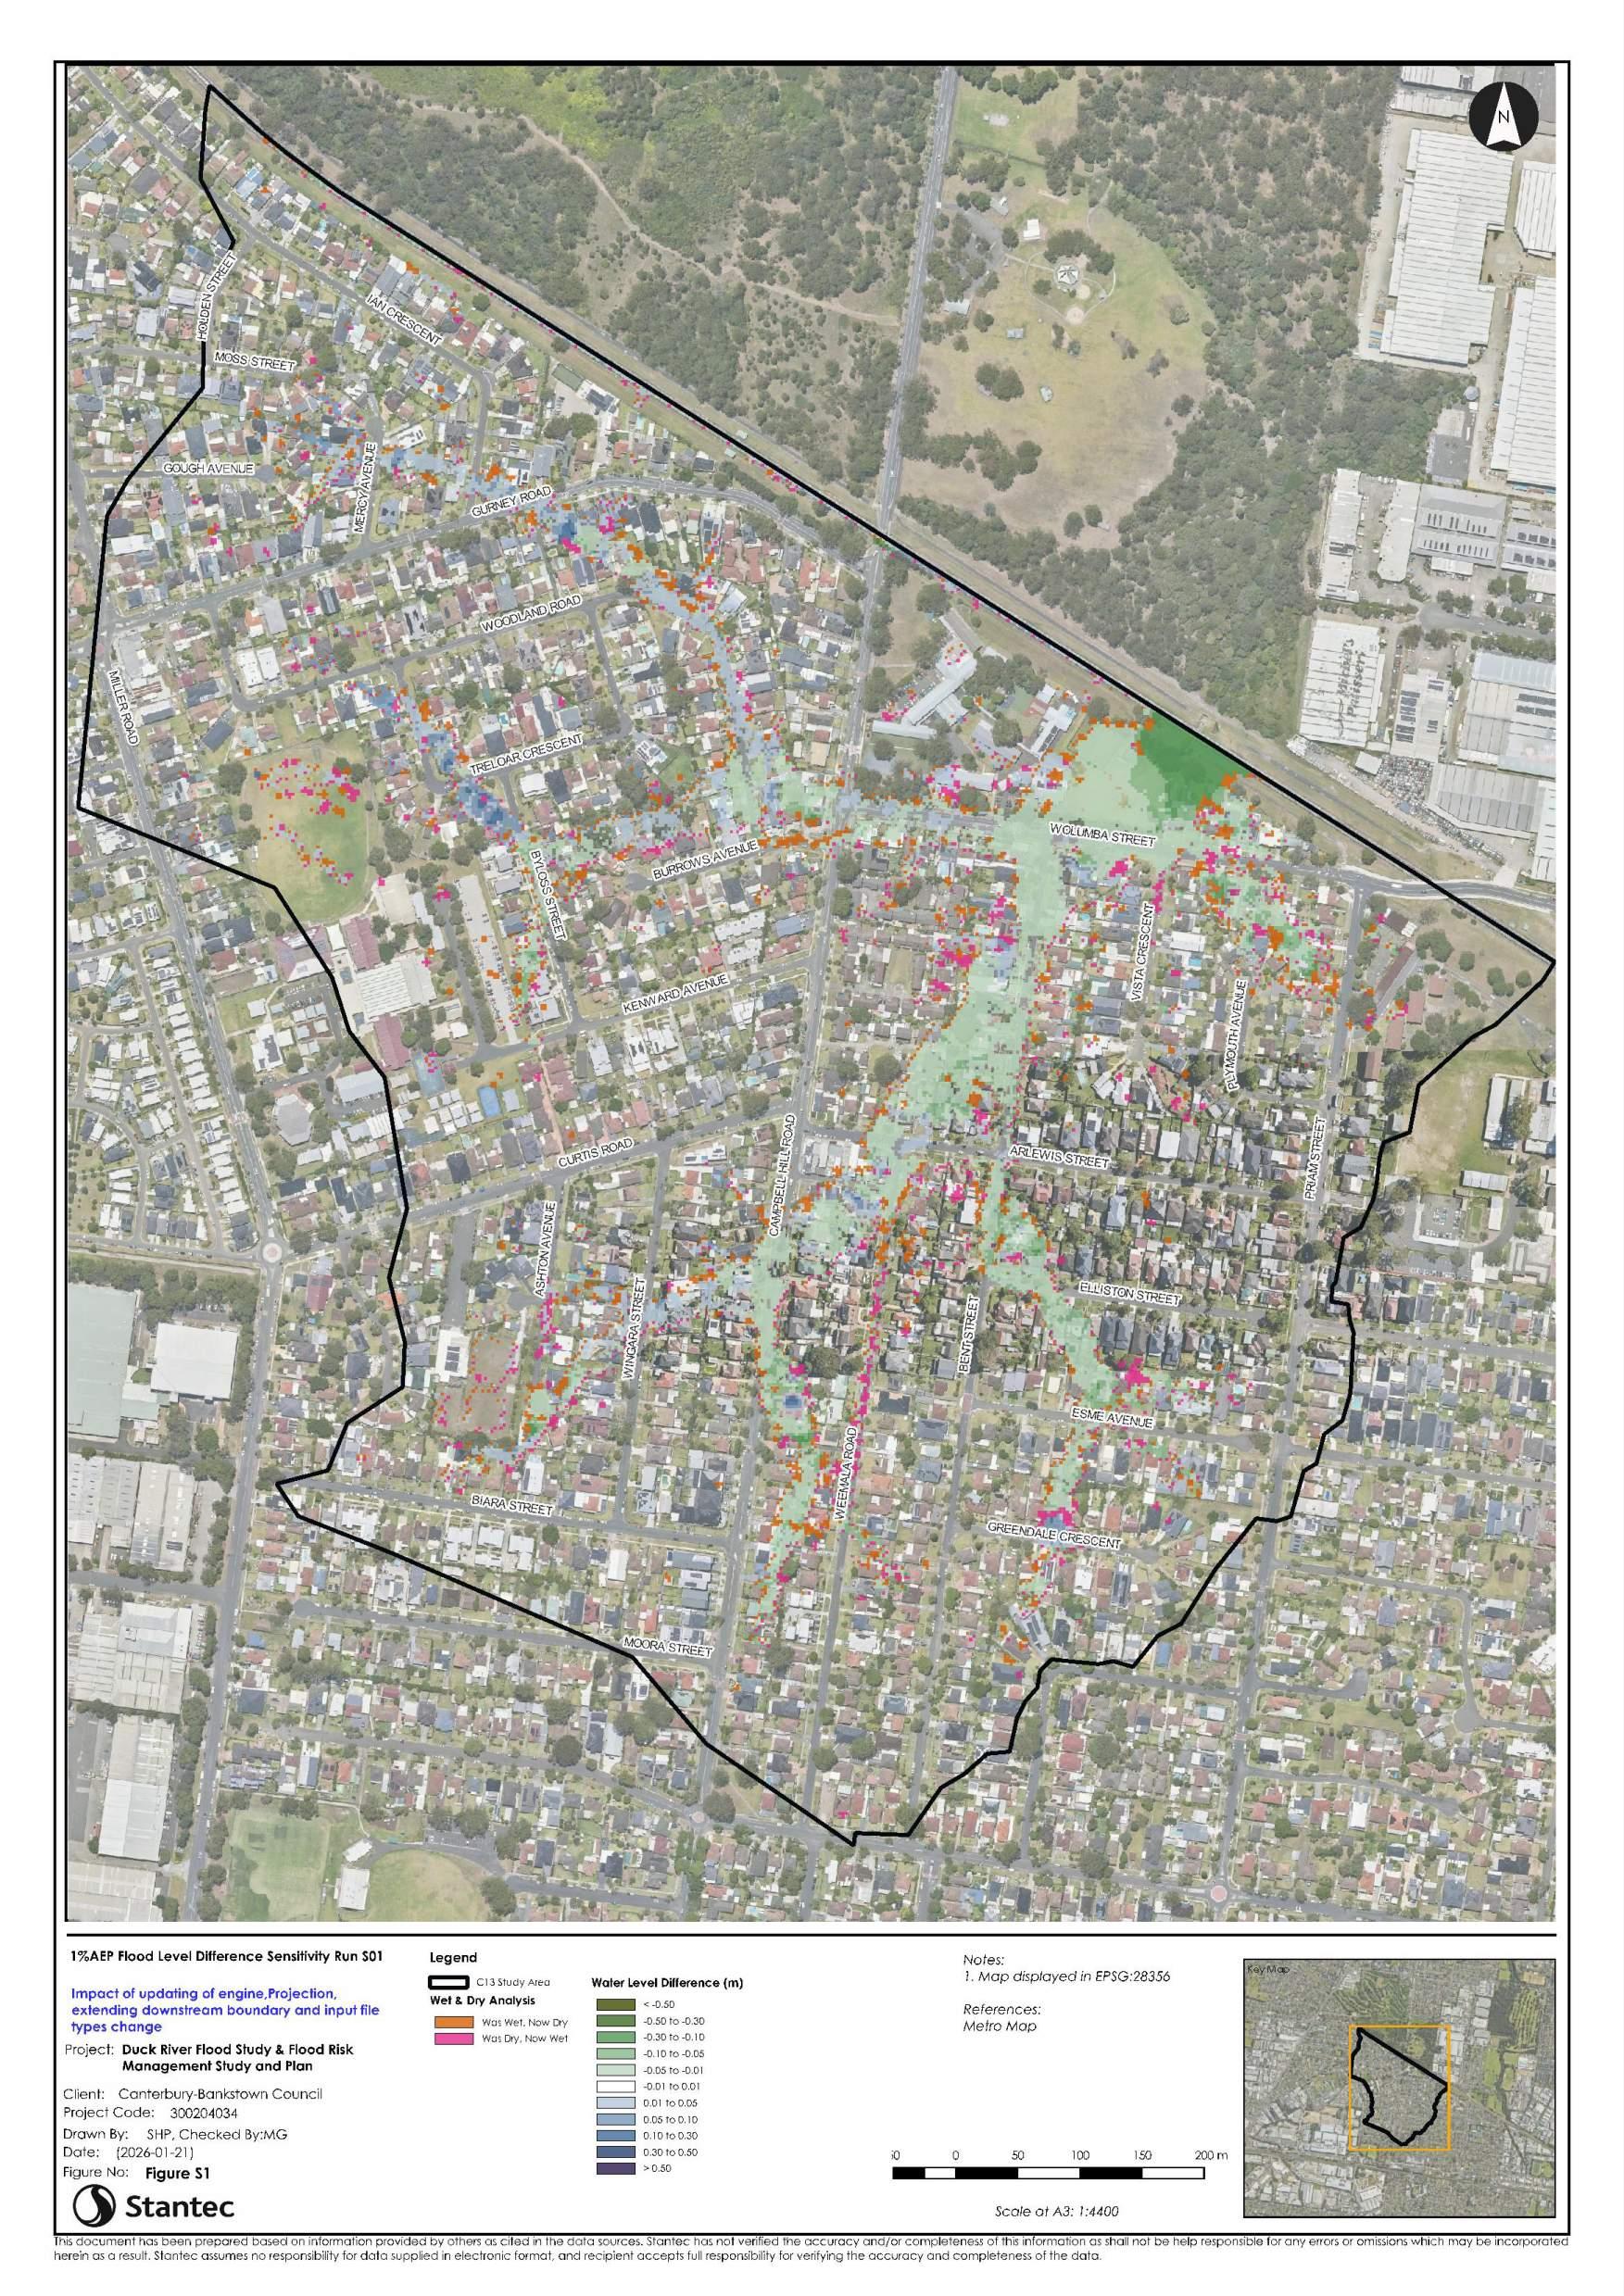
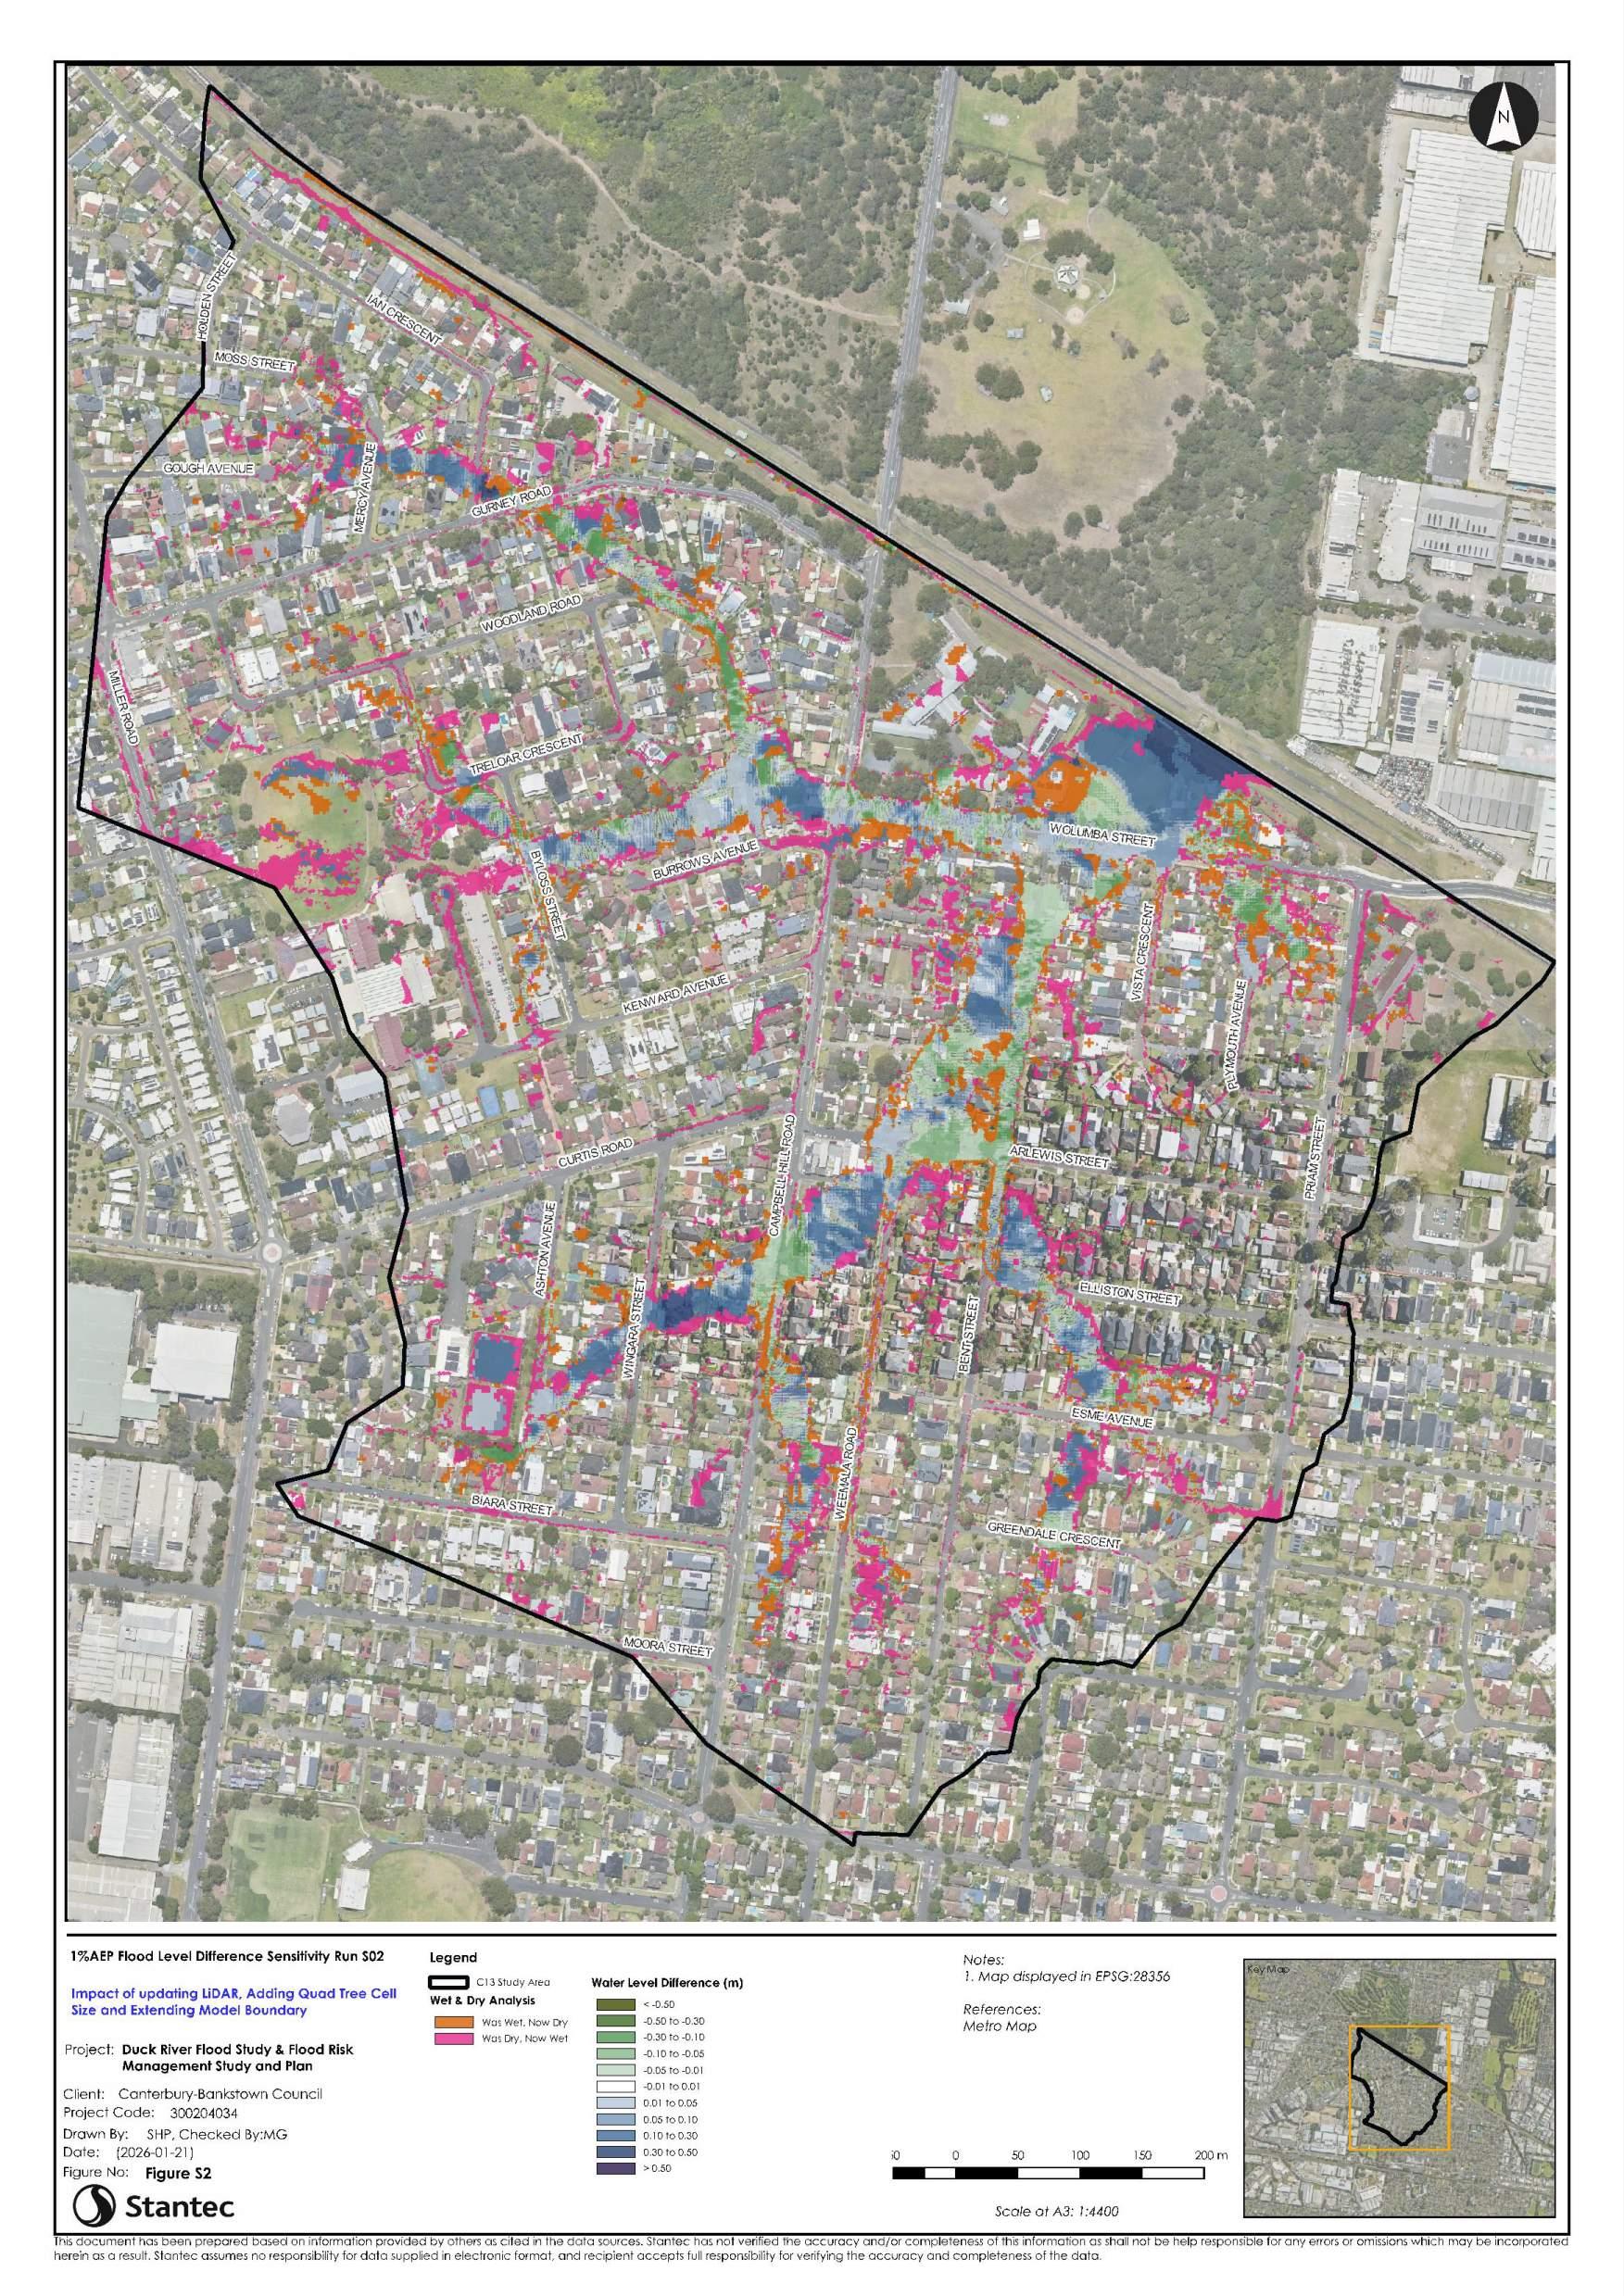
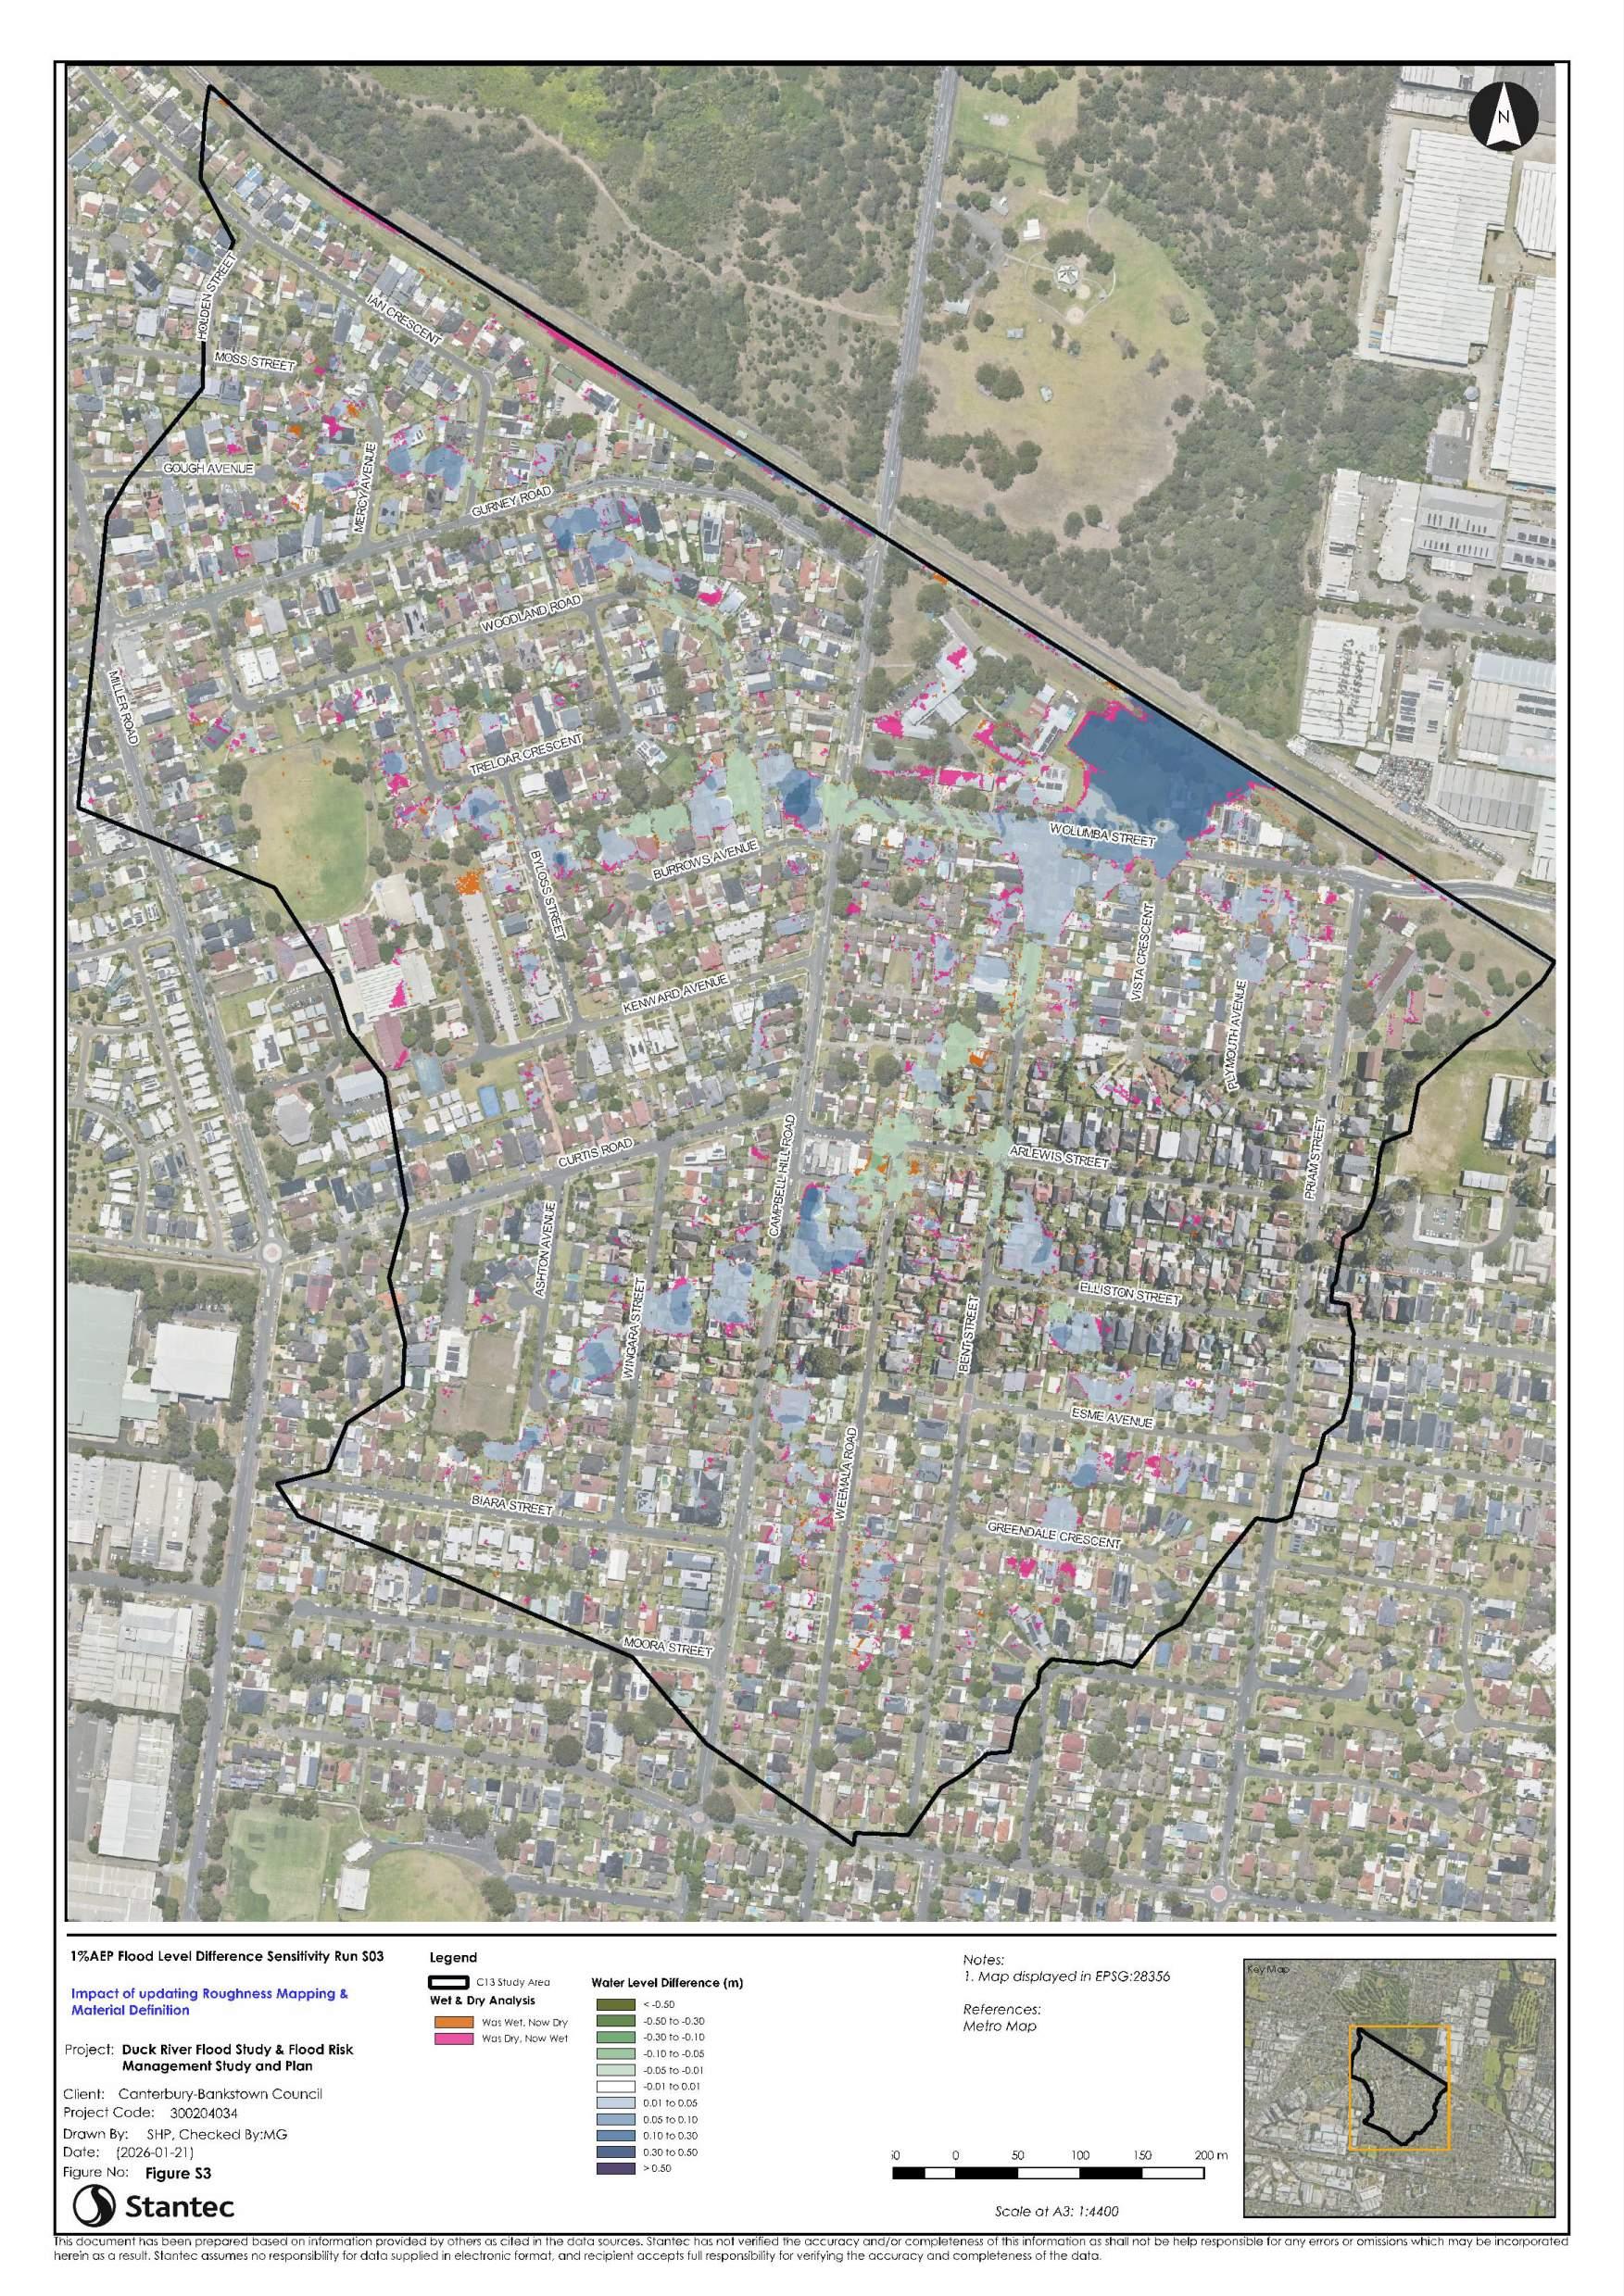
A sensitivity assessment of various model inputs and modelling approaches was conducted for assessing impacts of various model improvement iterations. A summary has been provided for sensitivity to seven (7) model components with mapping of sensitivity outcomes included in Appendix C
Design Flood Results
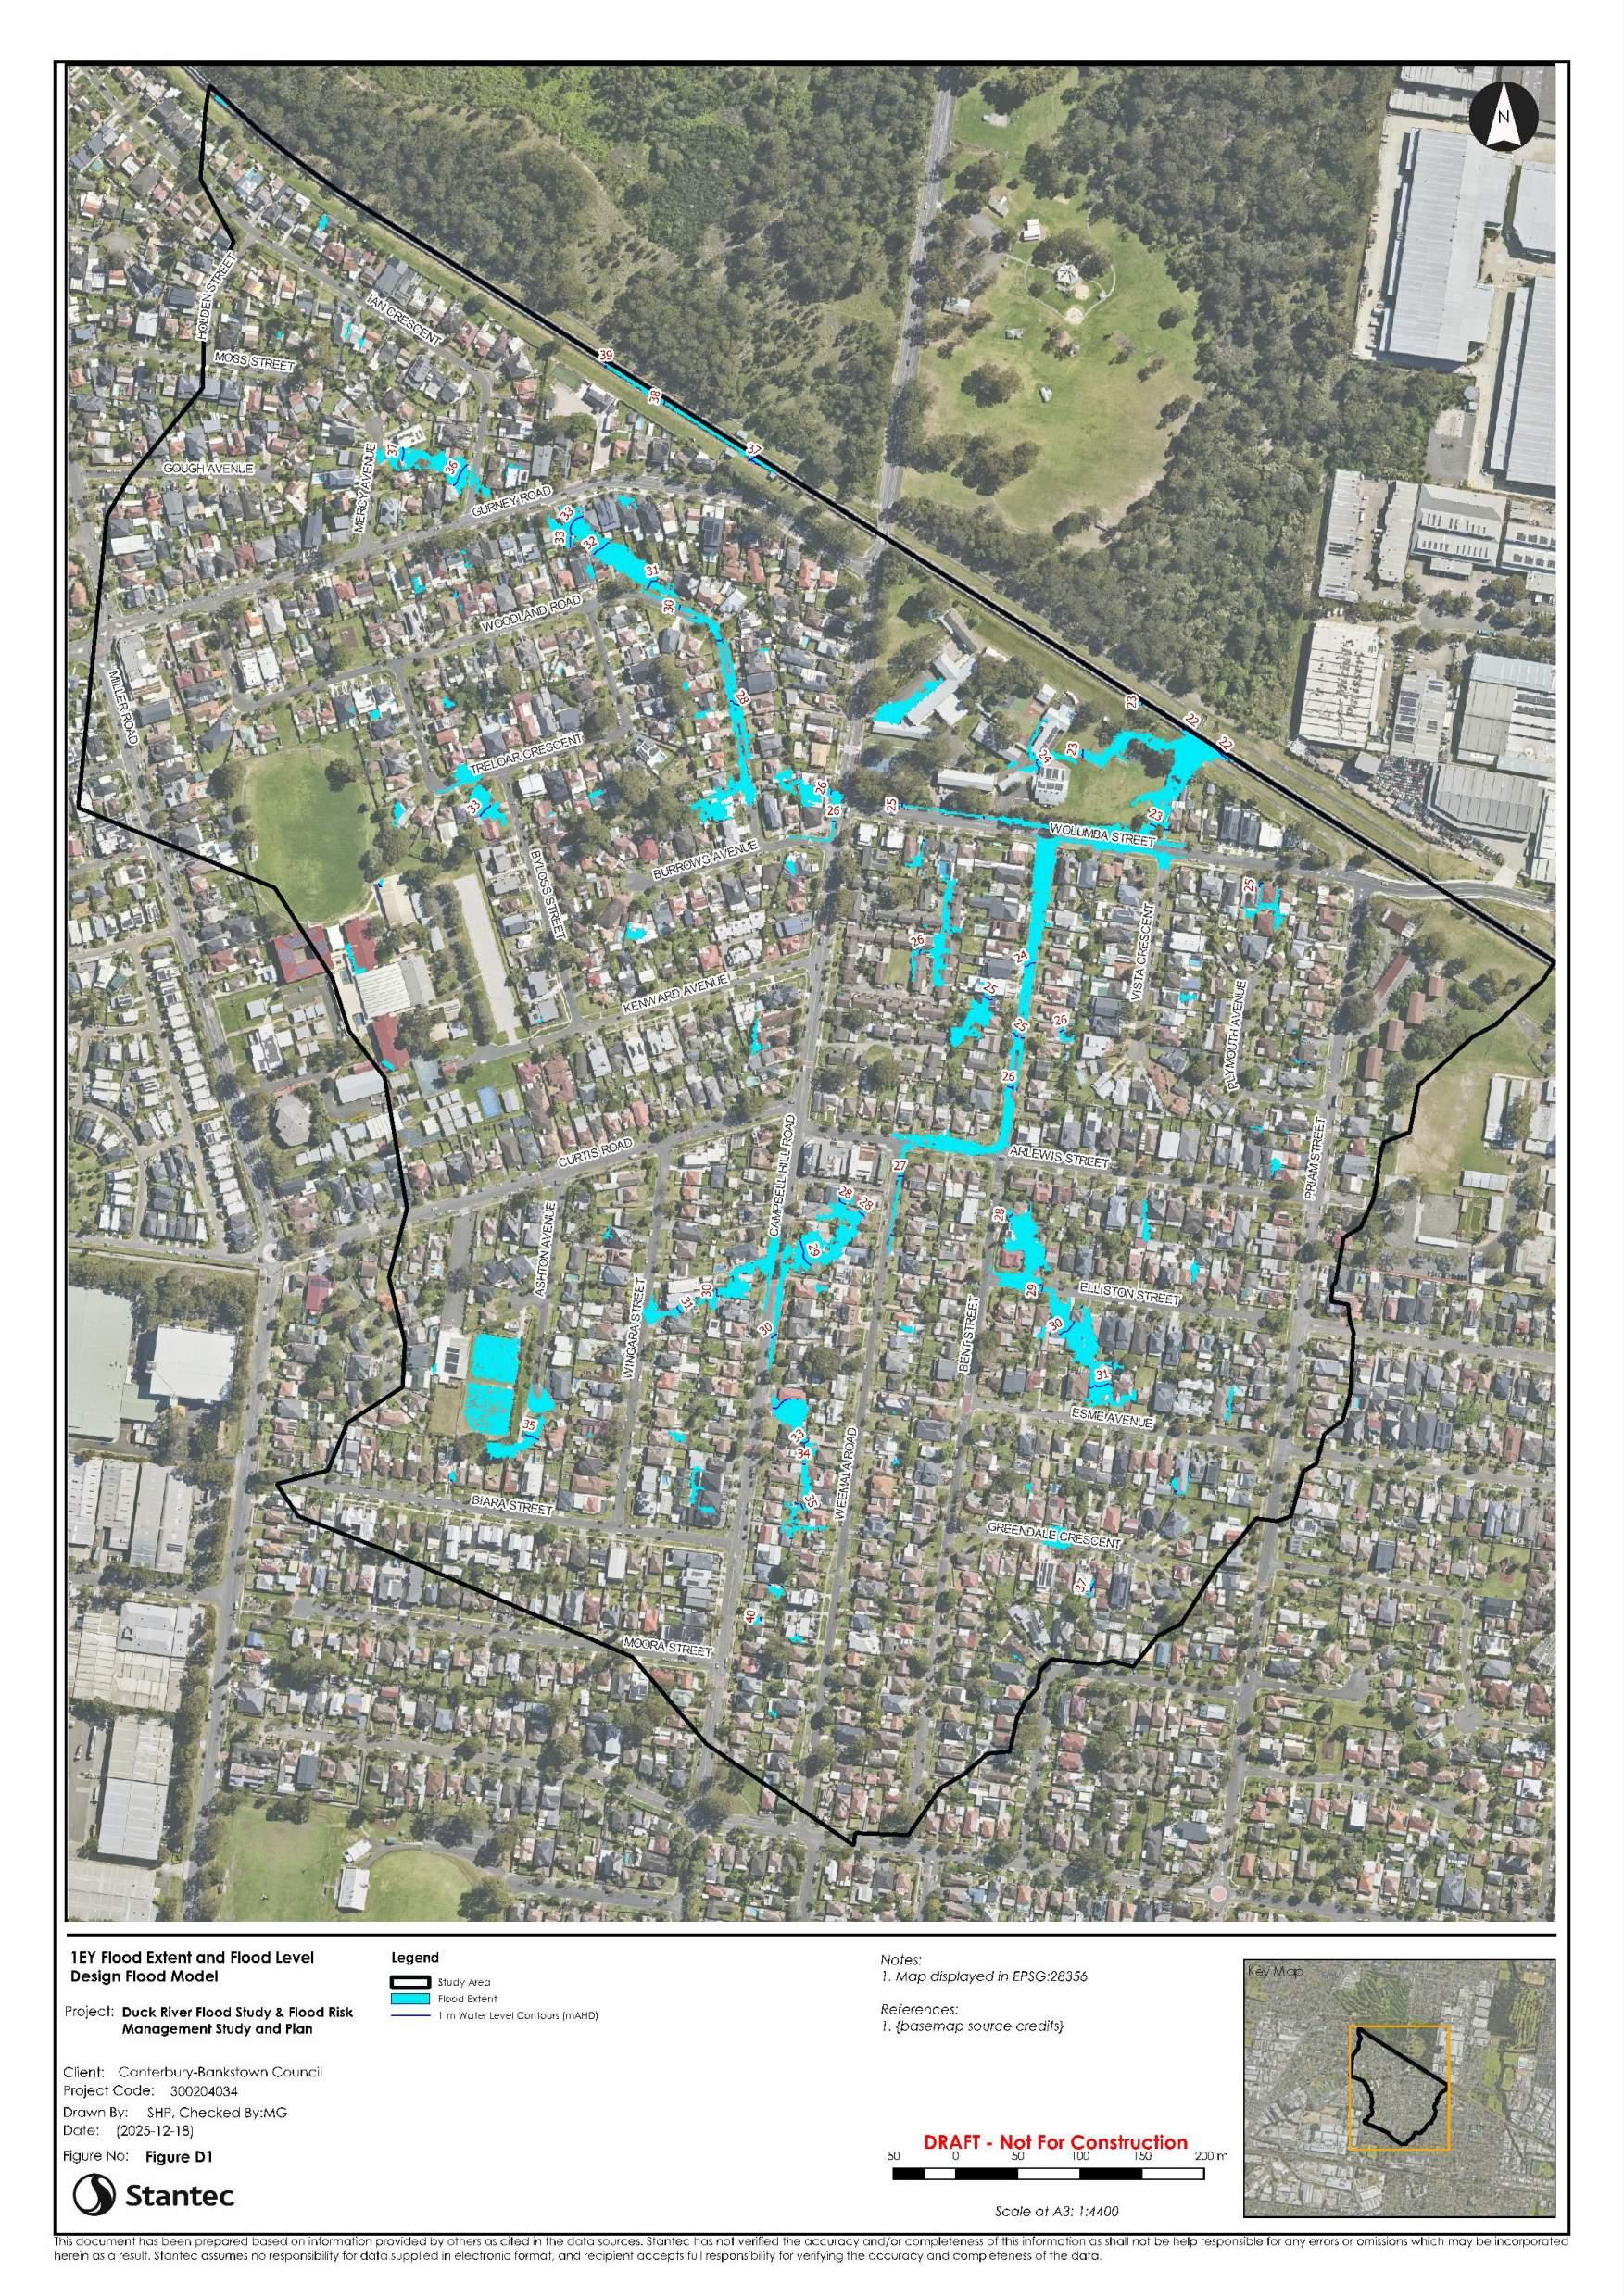
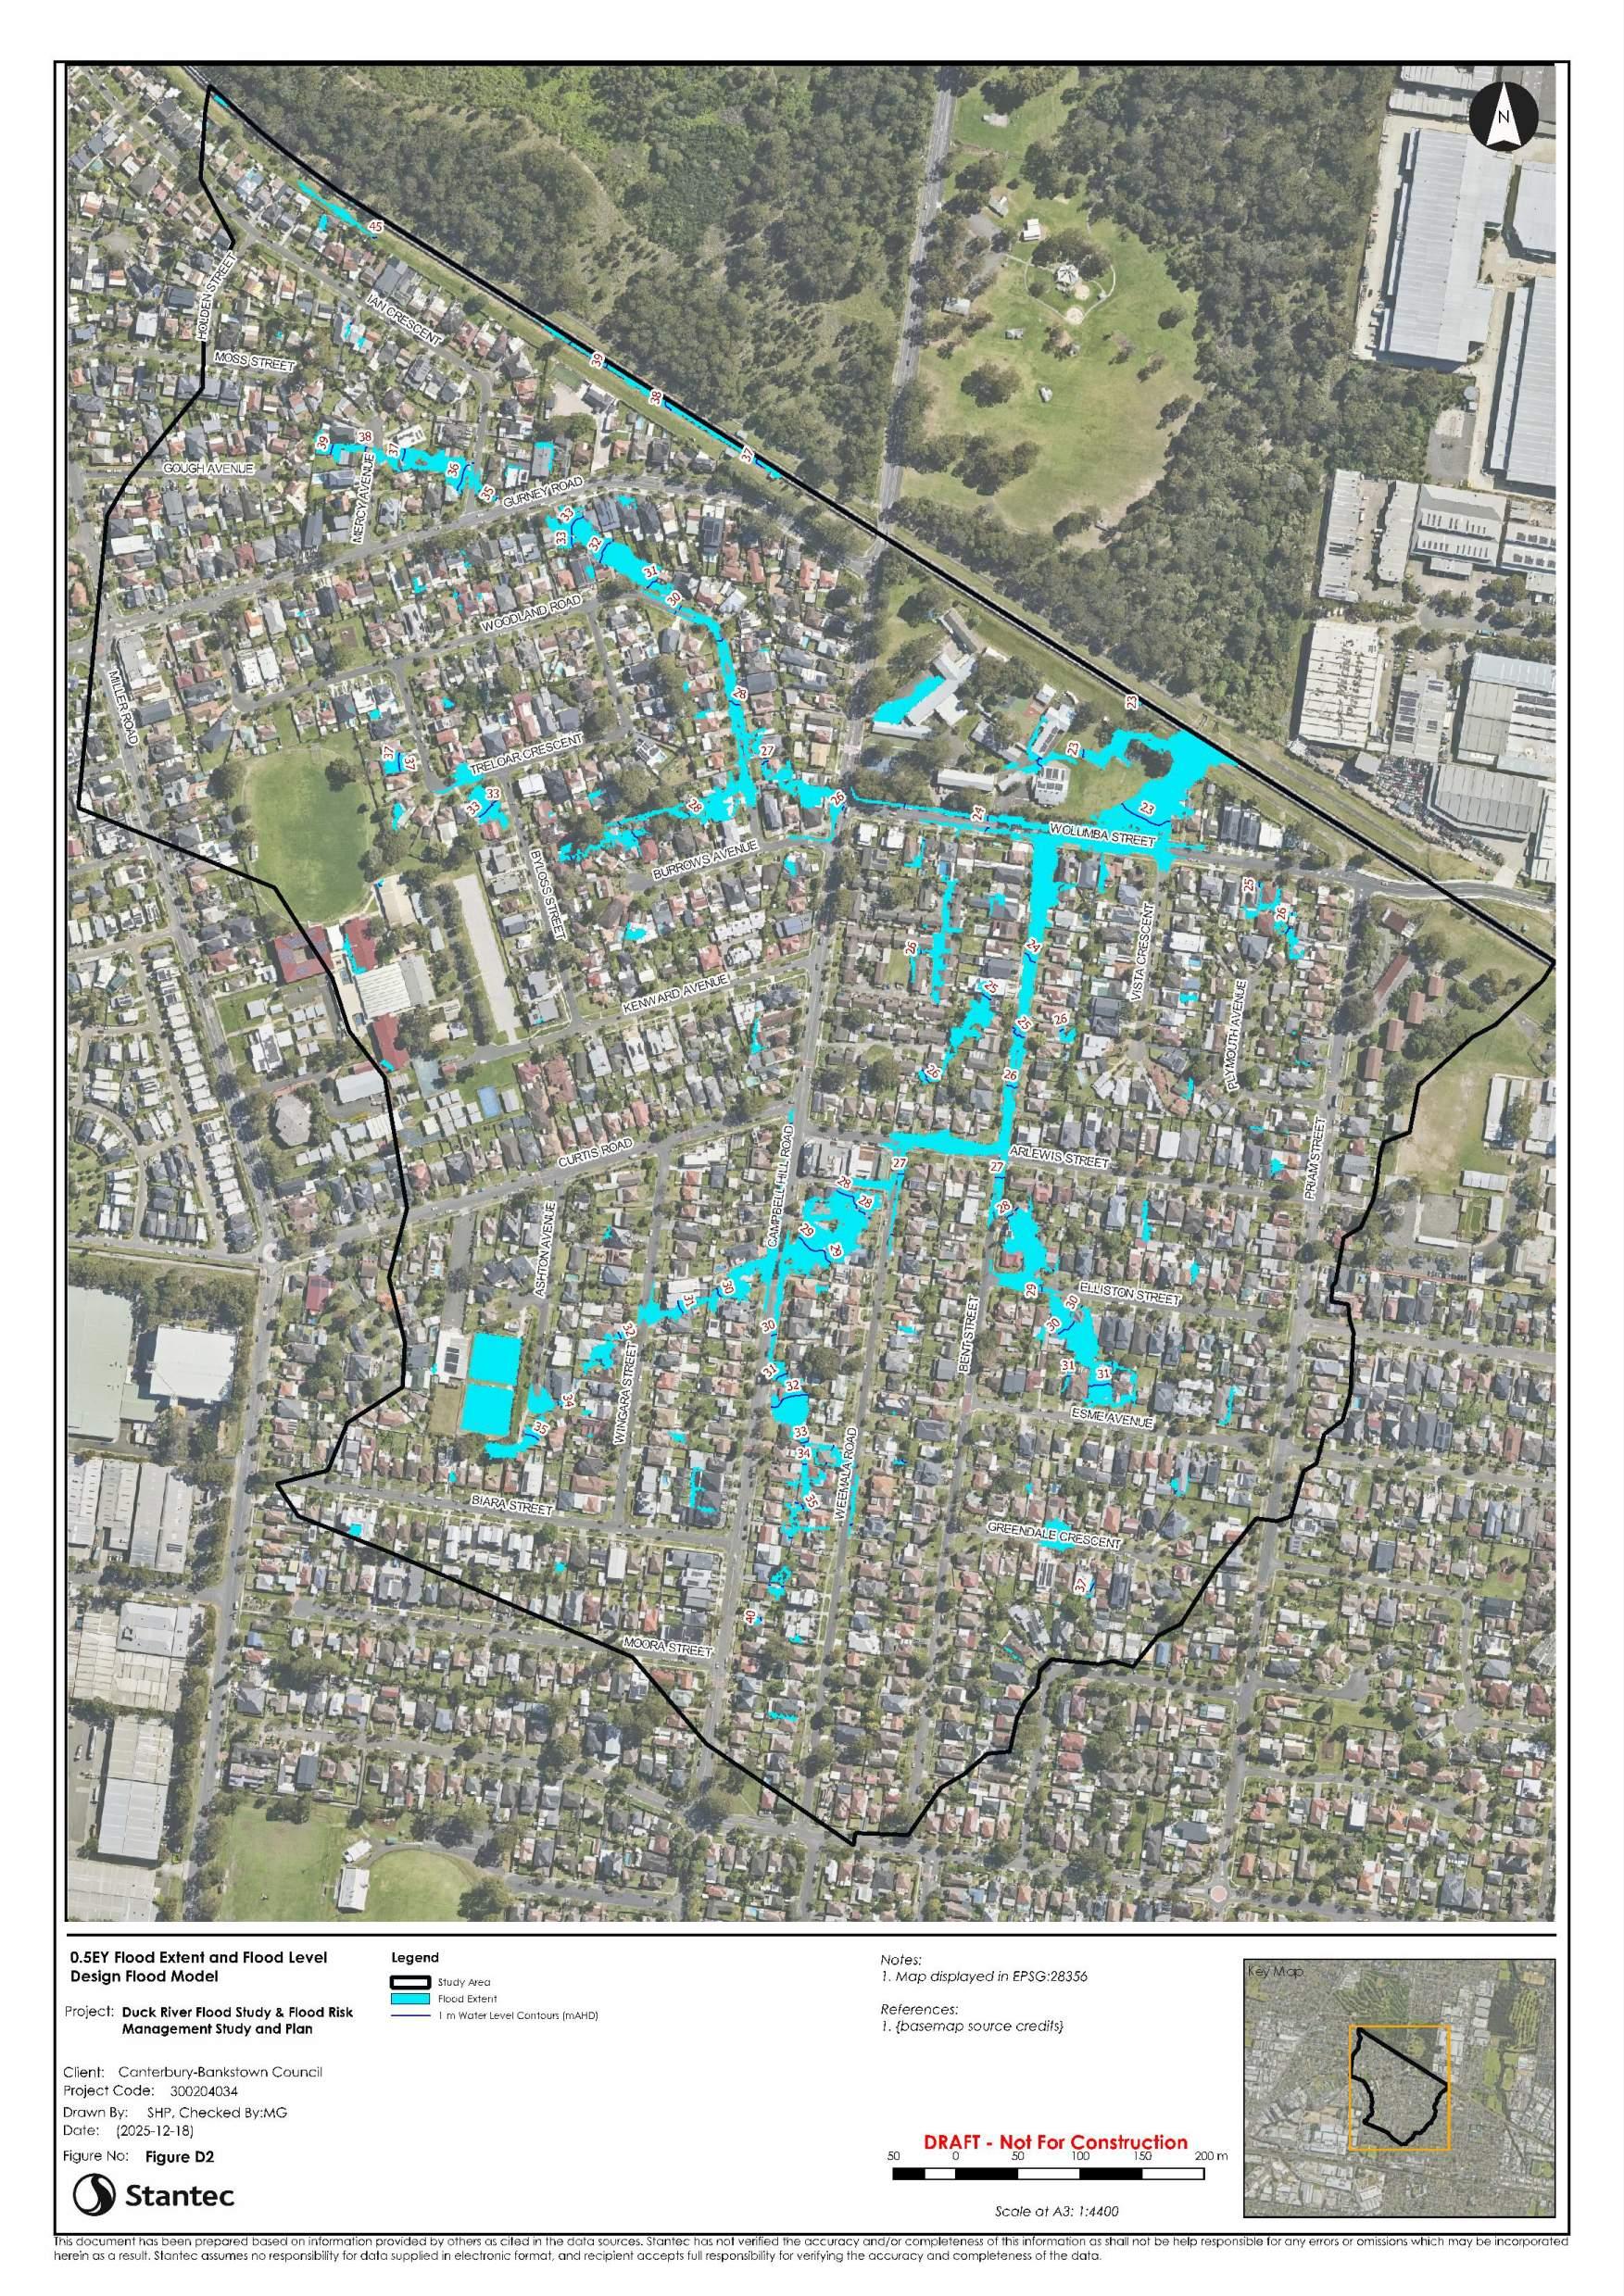
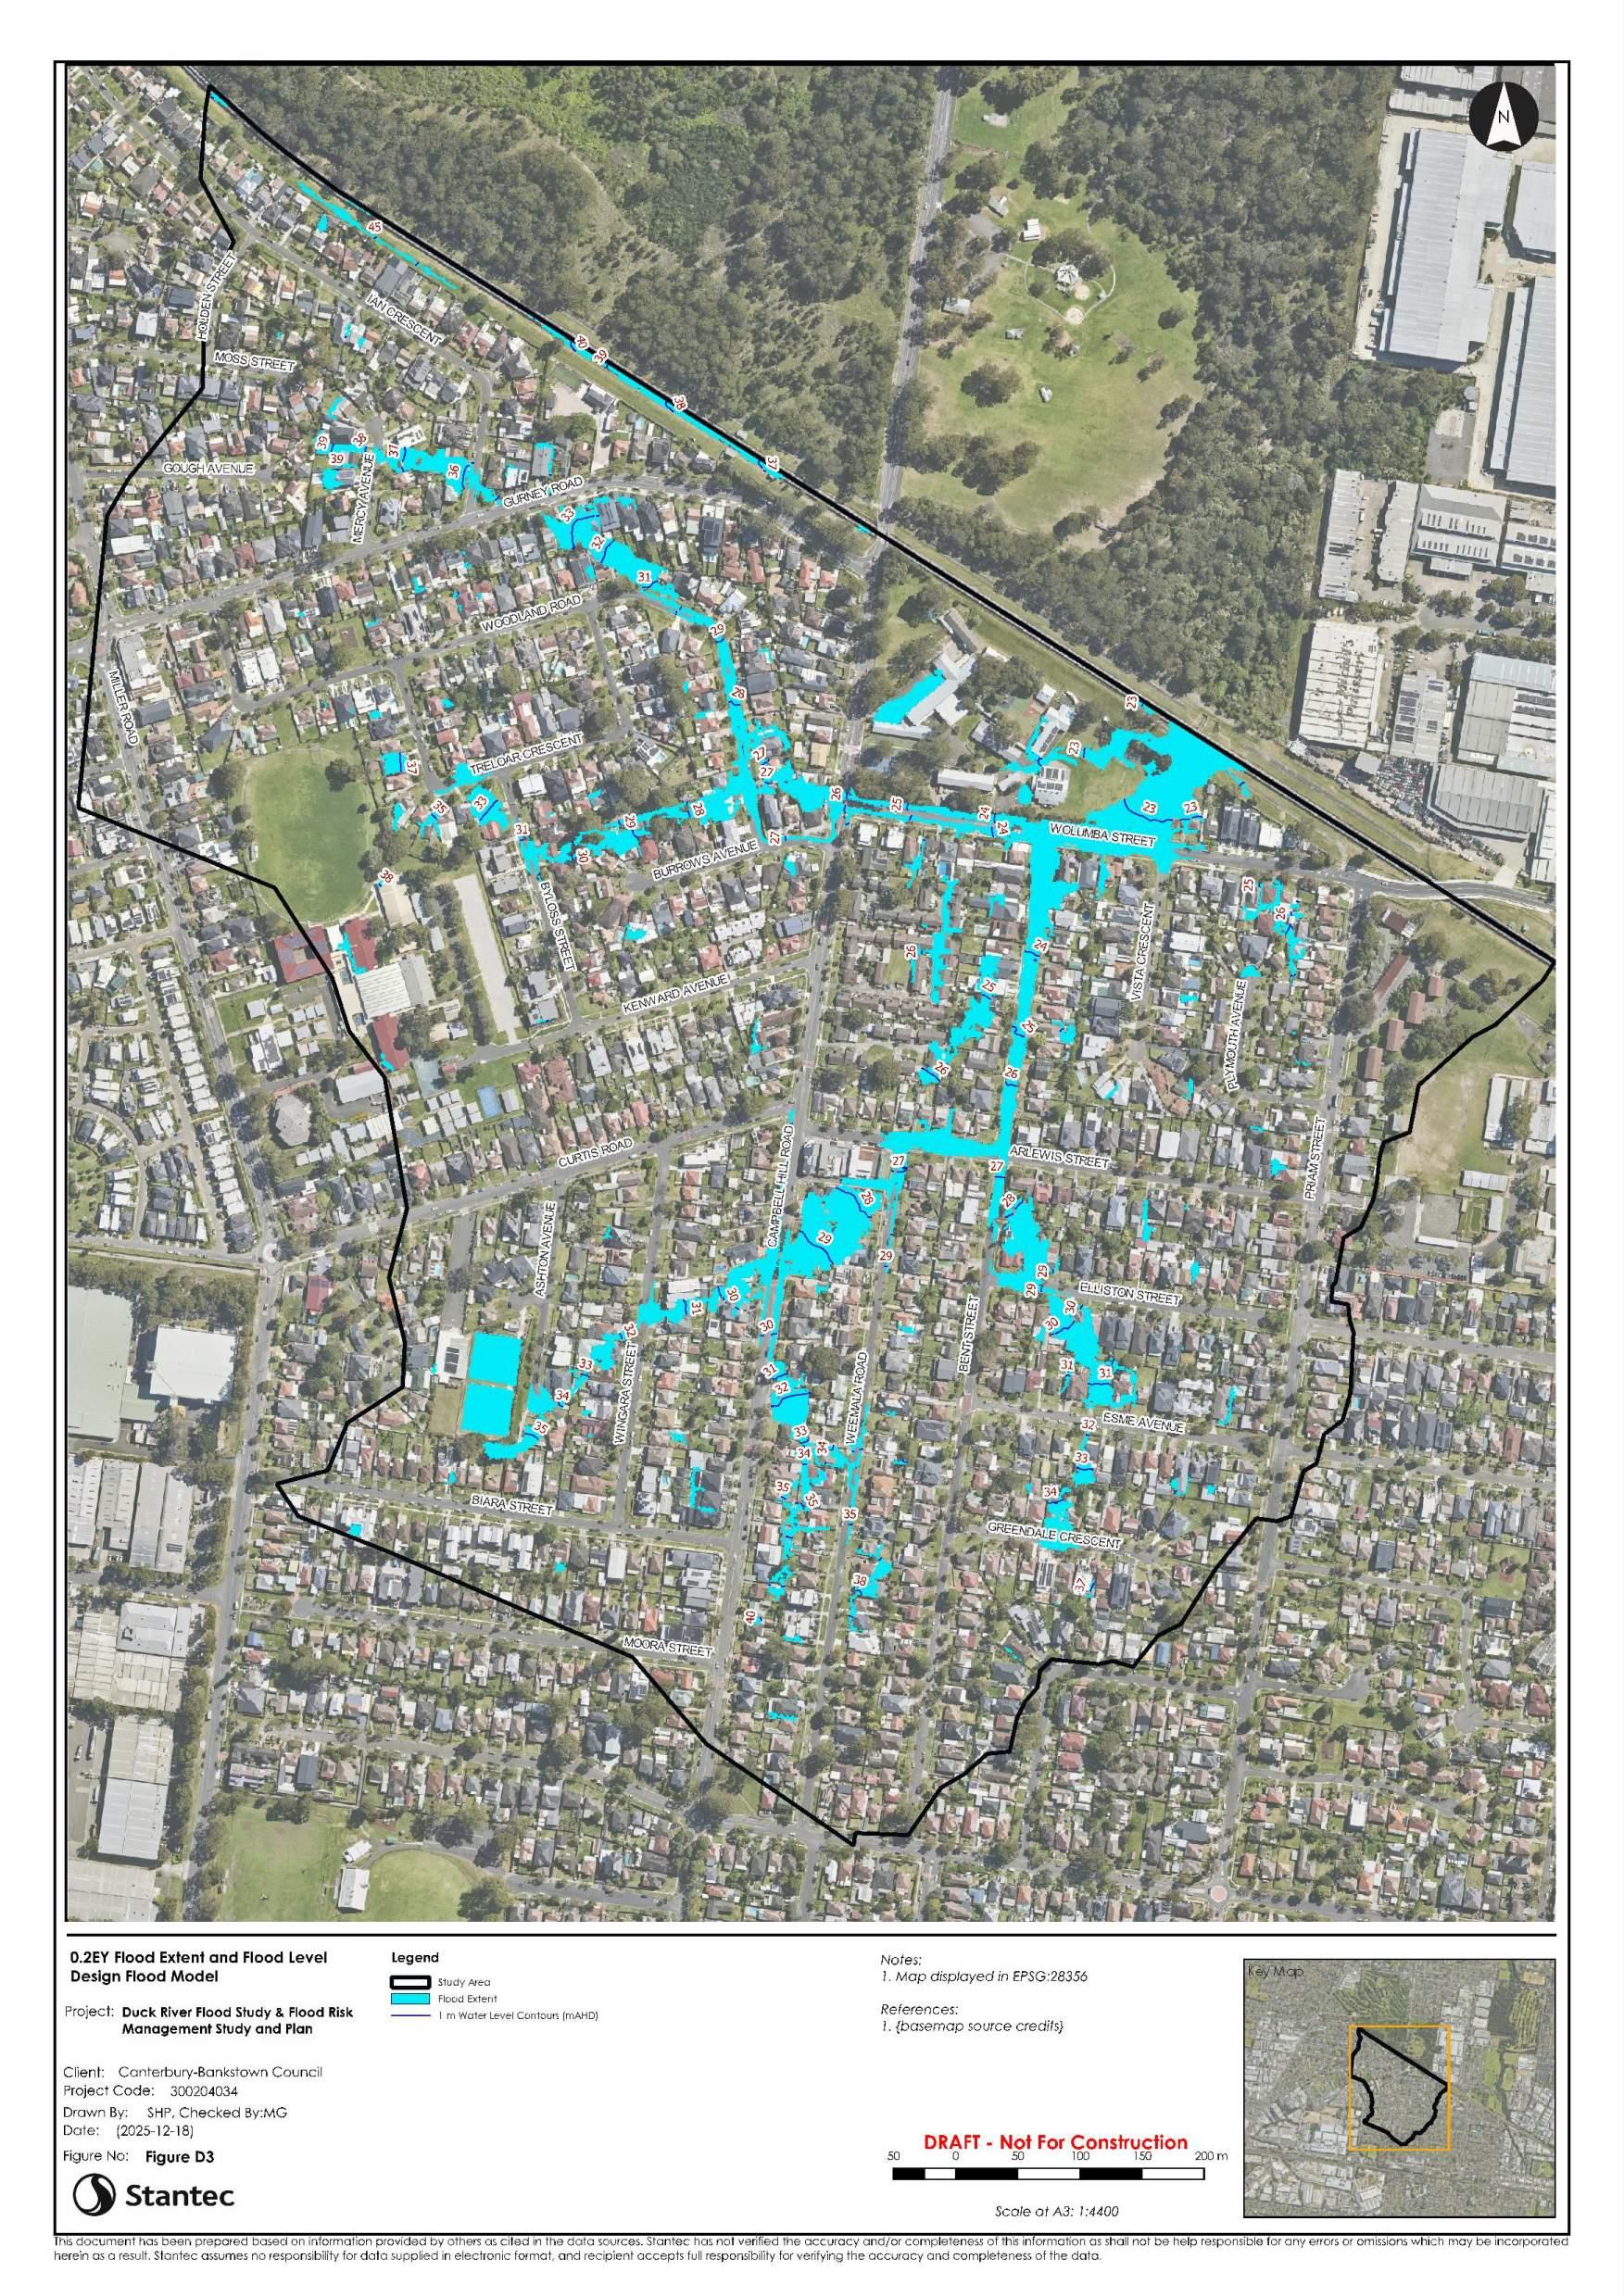
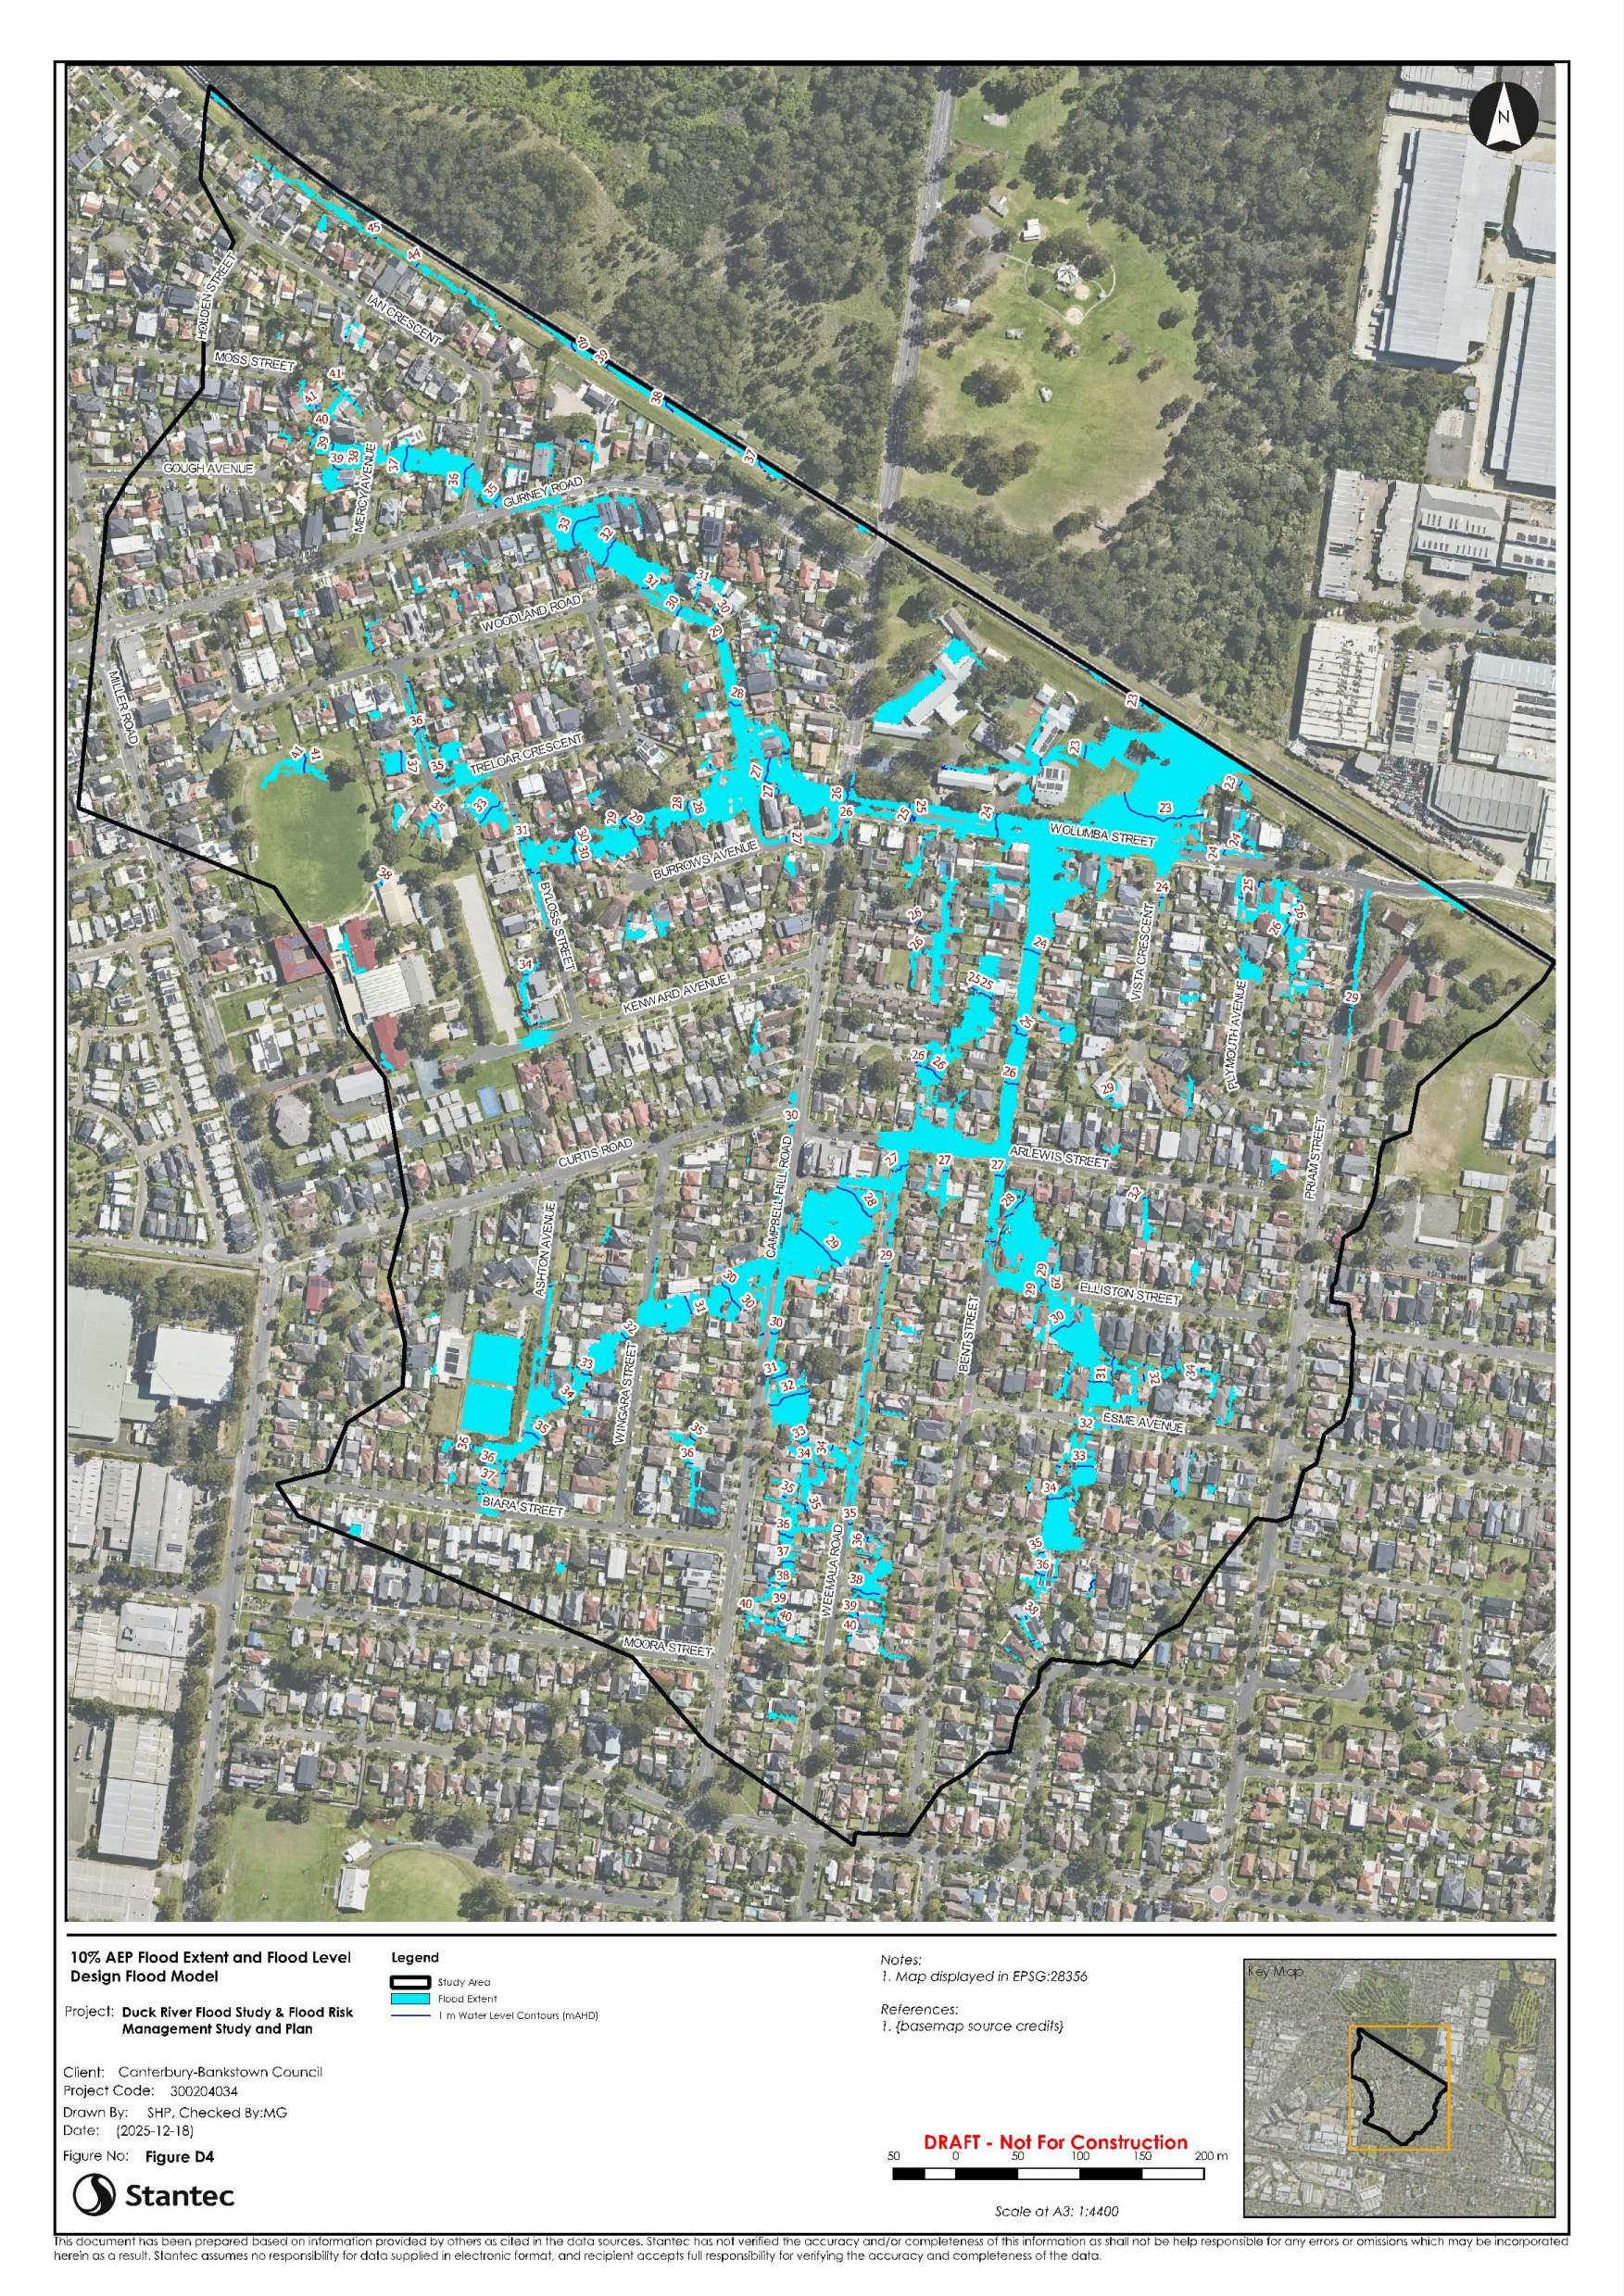
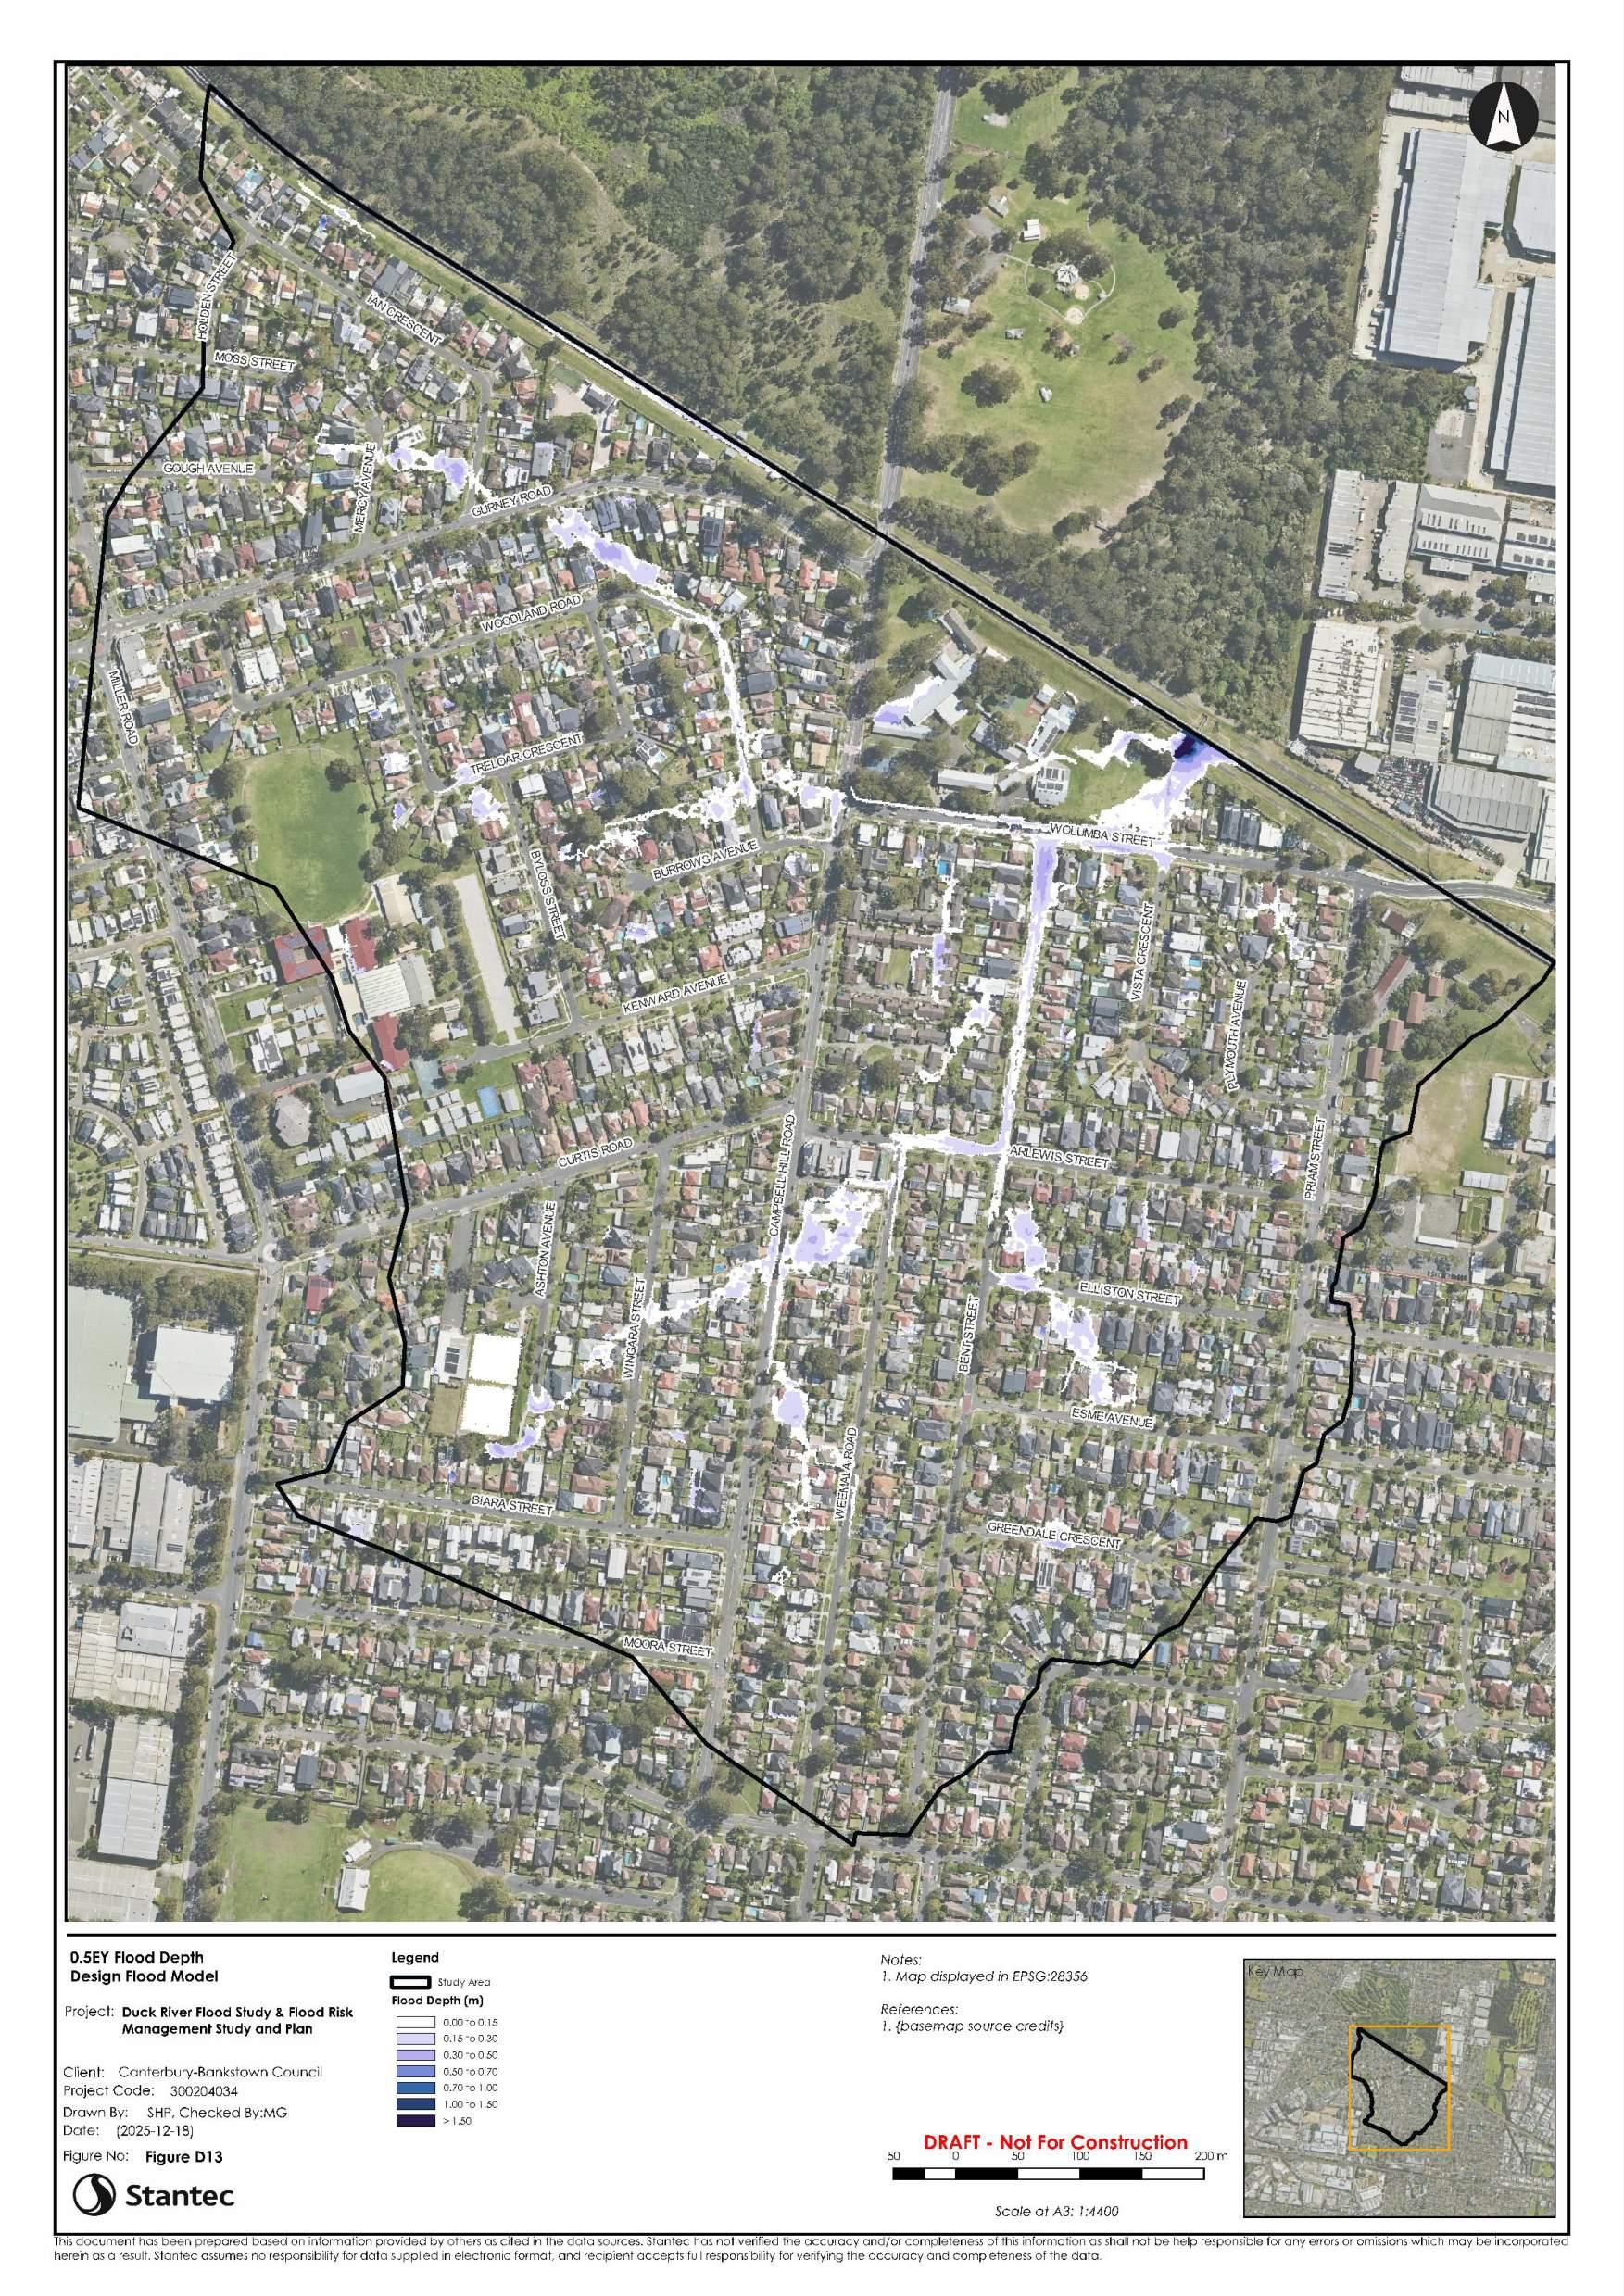
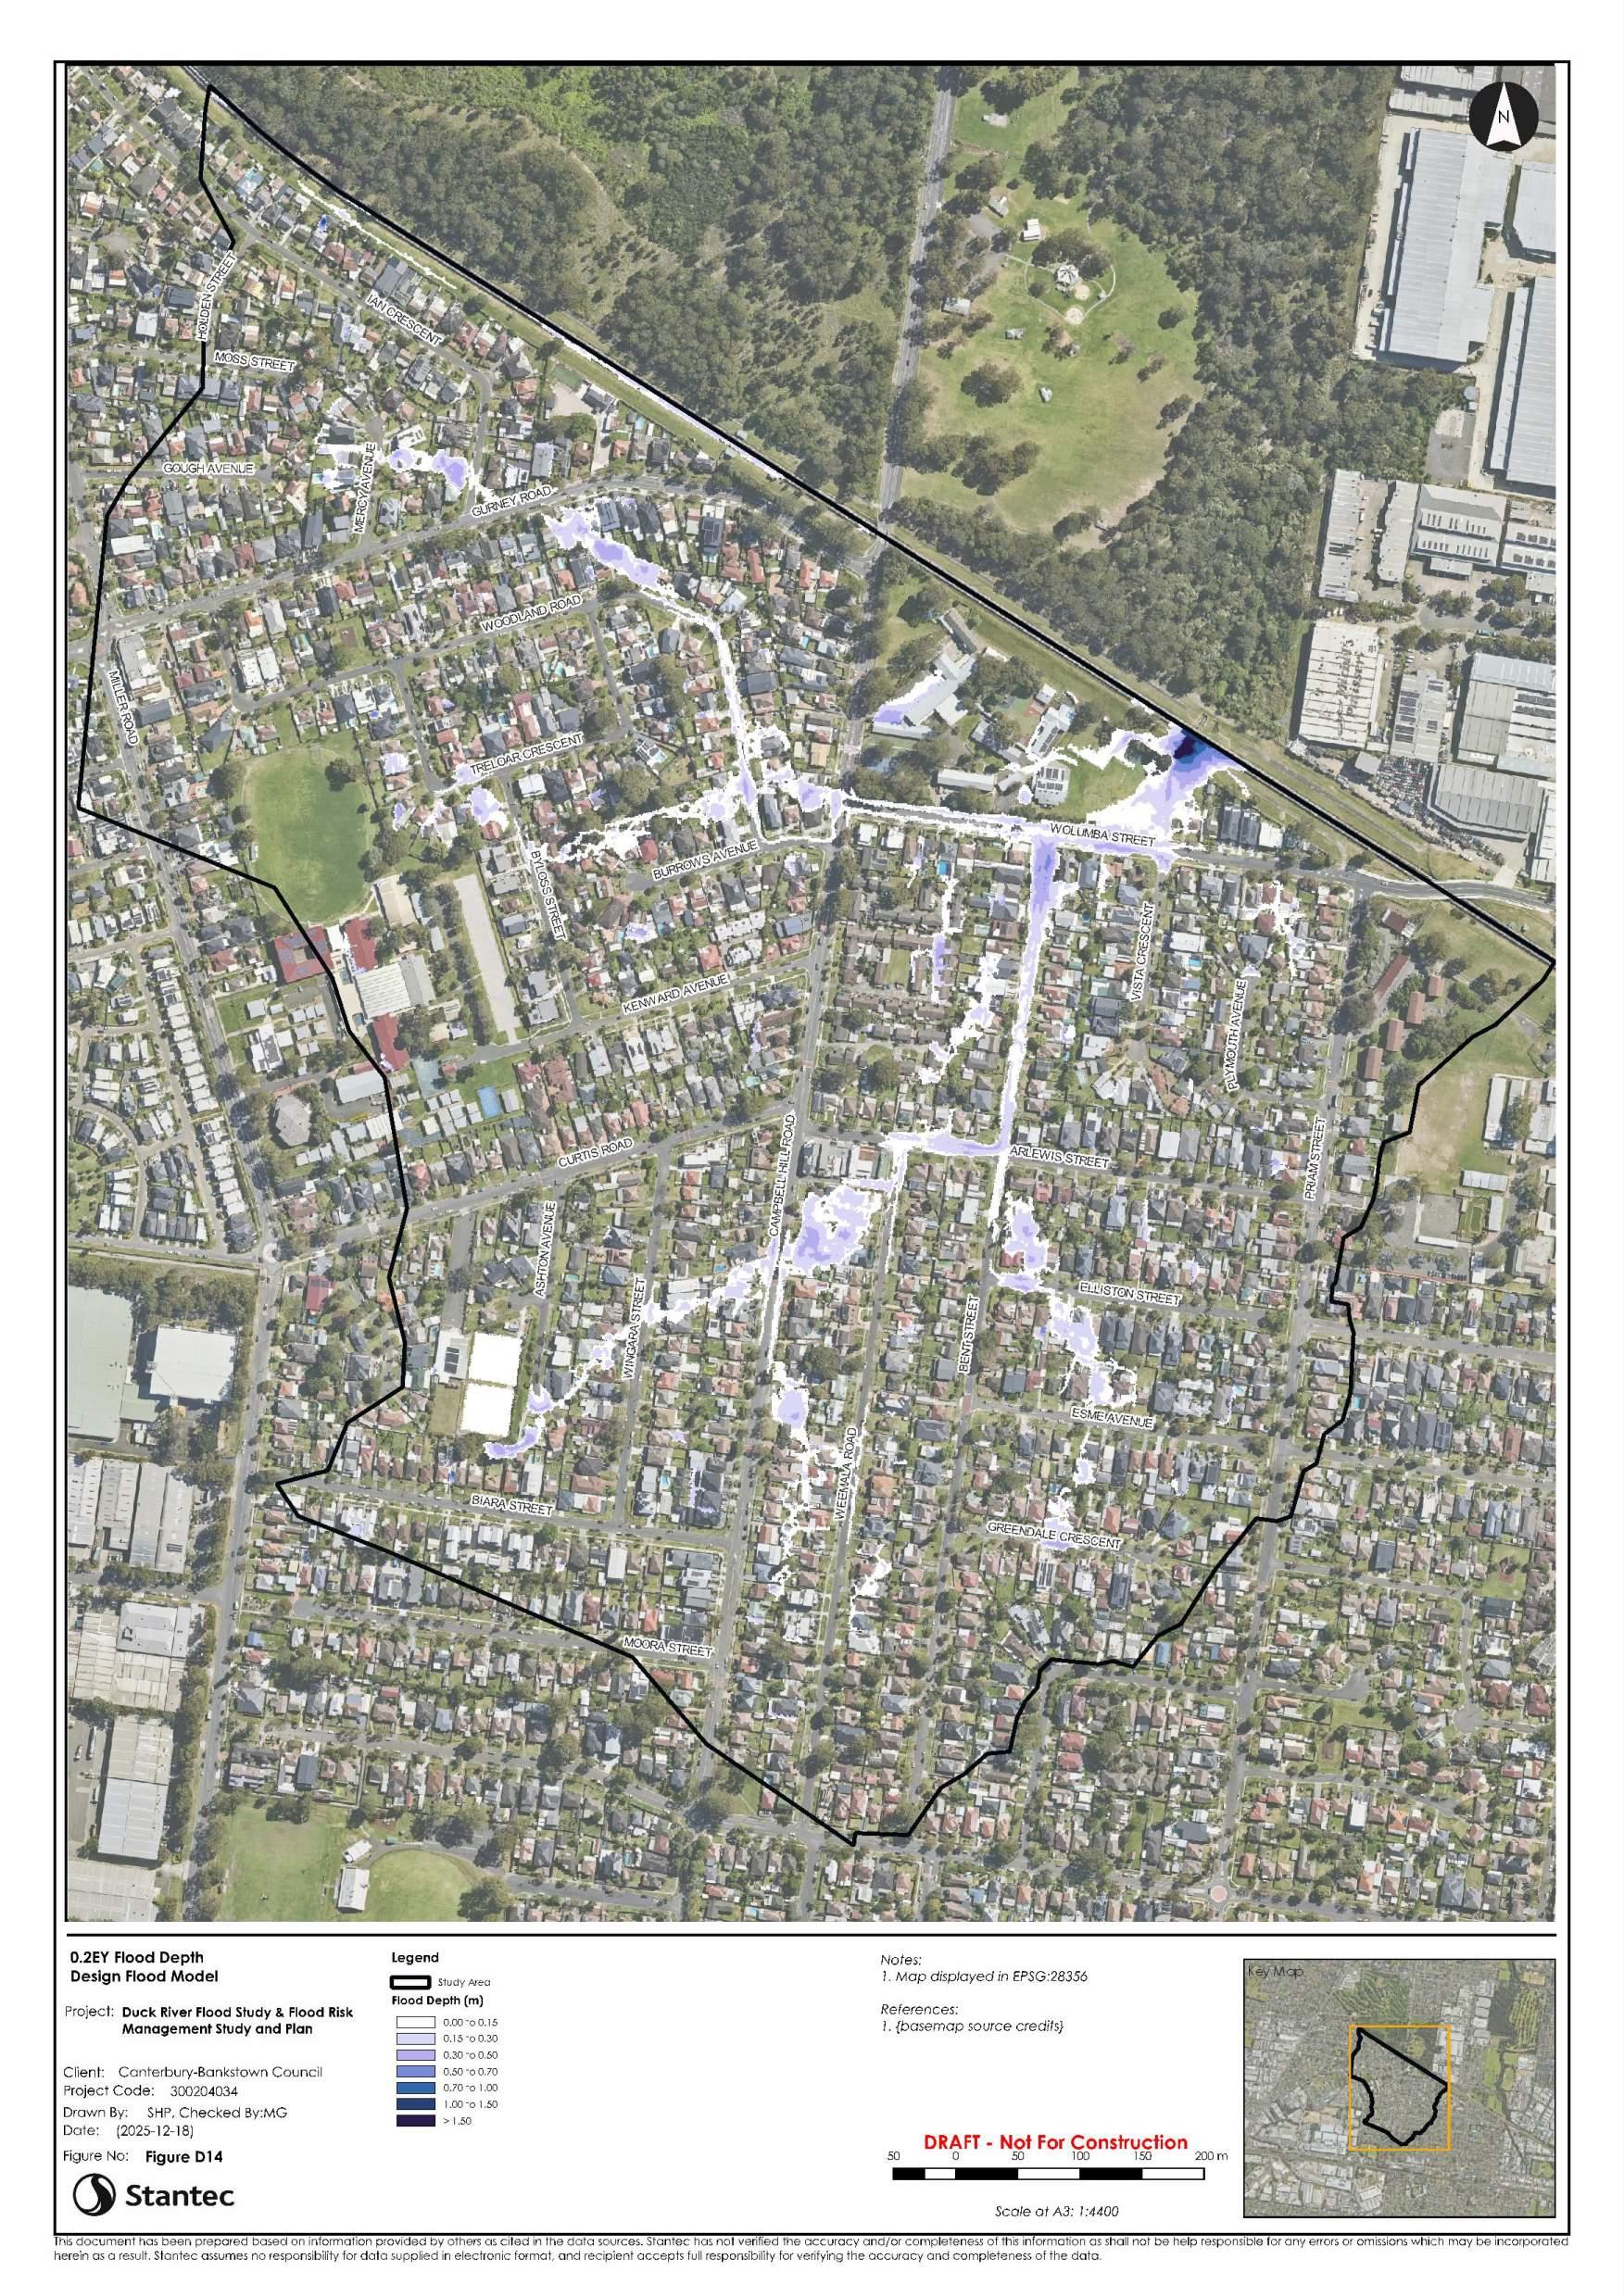
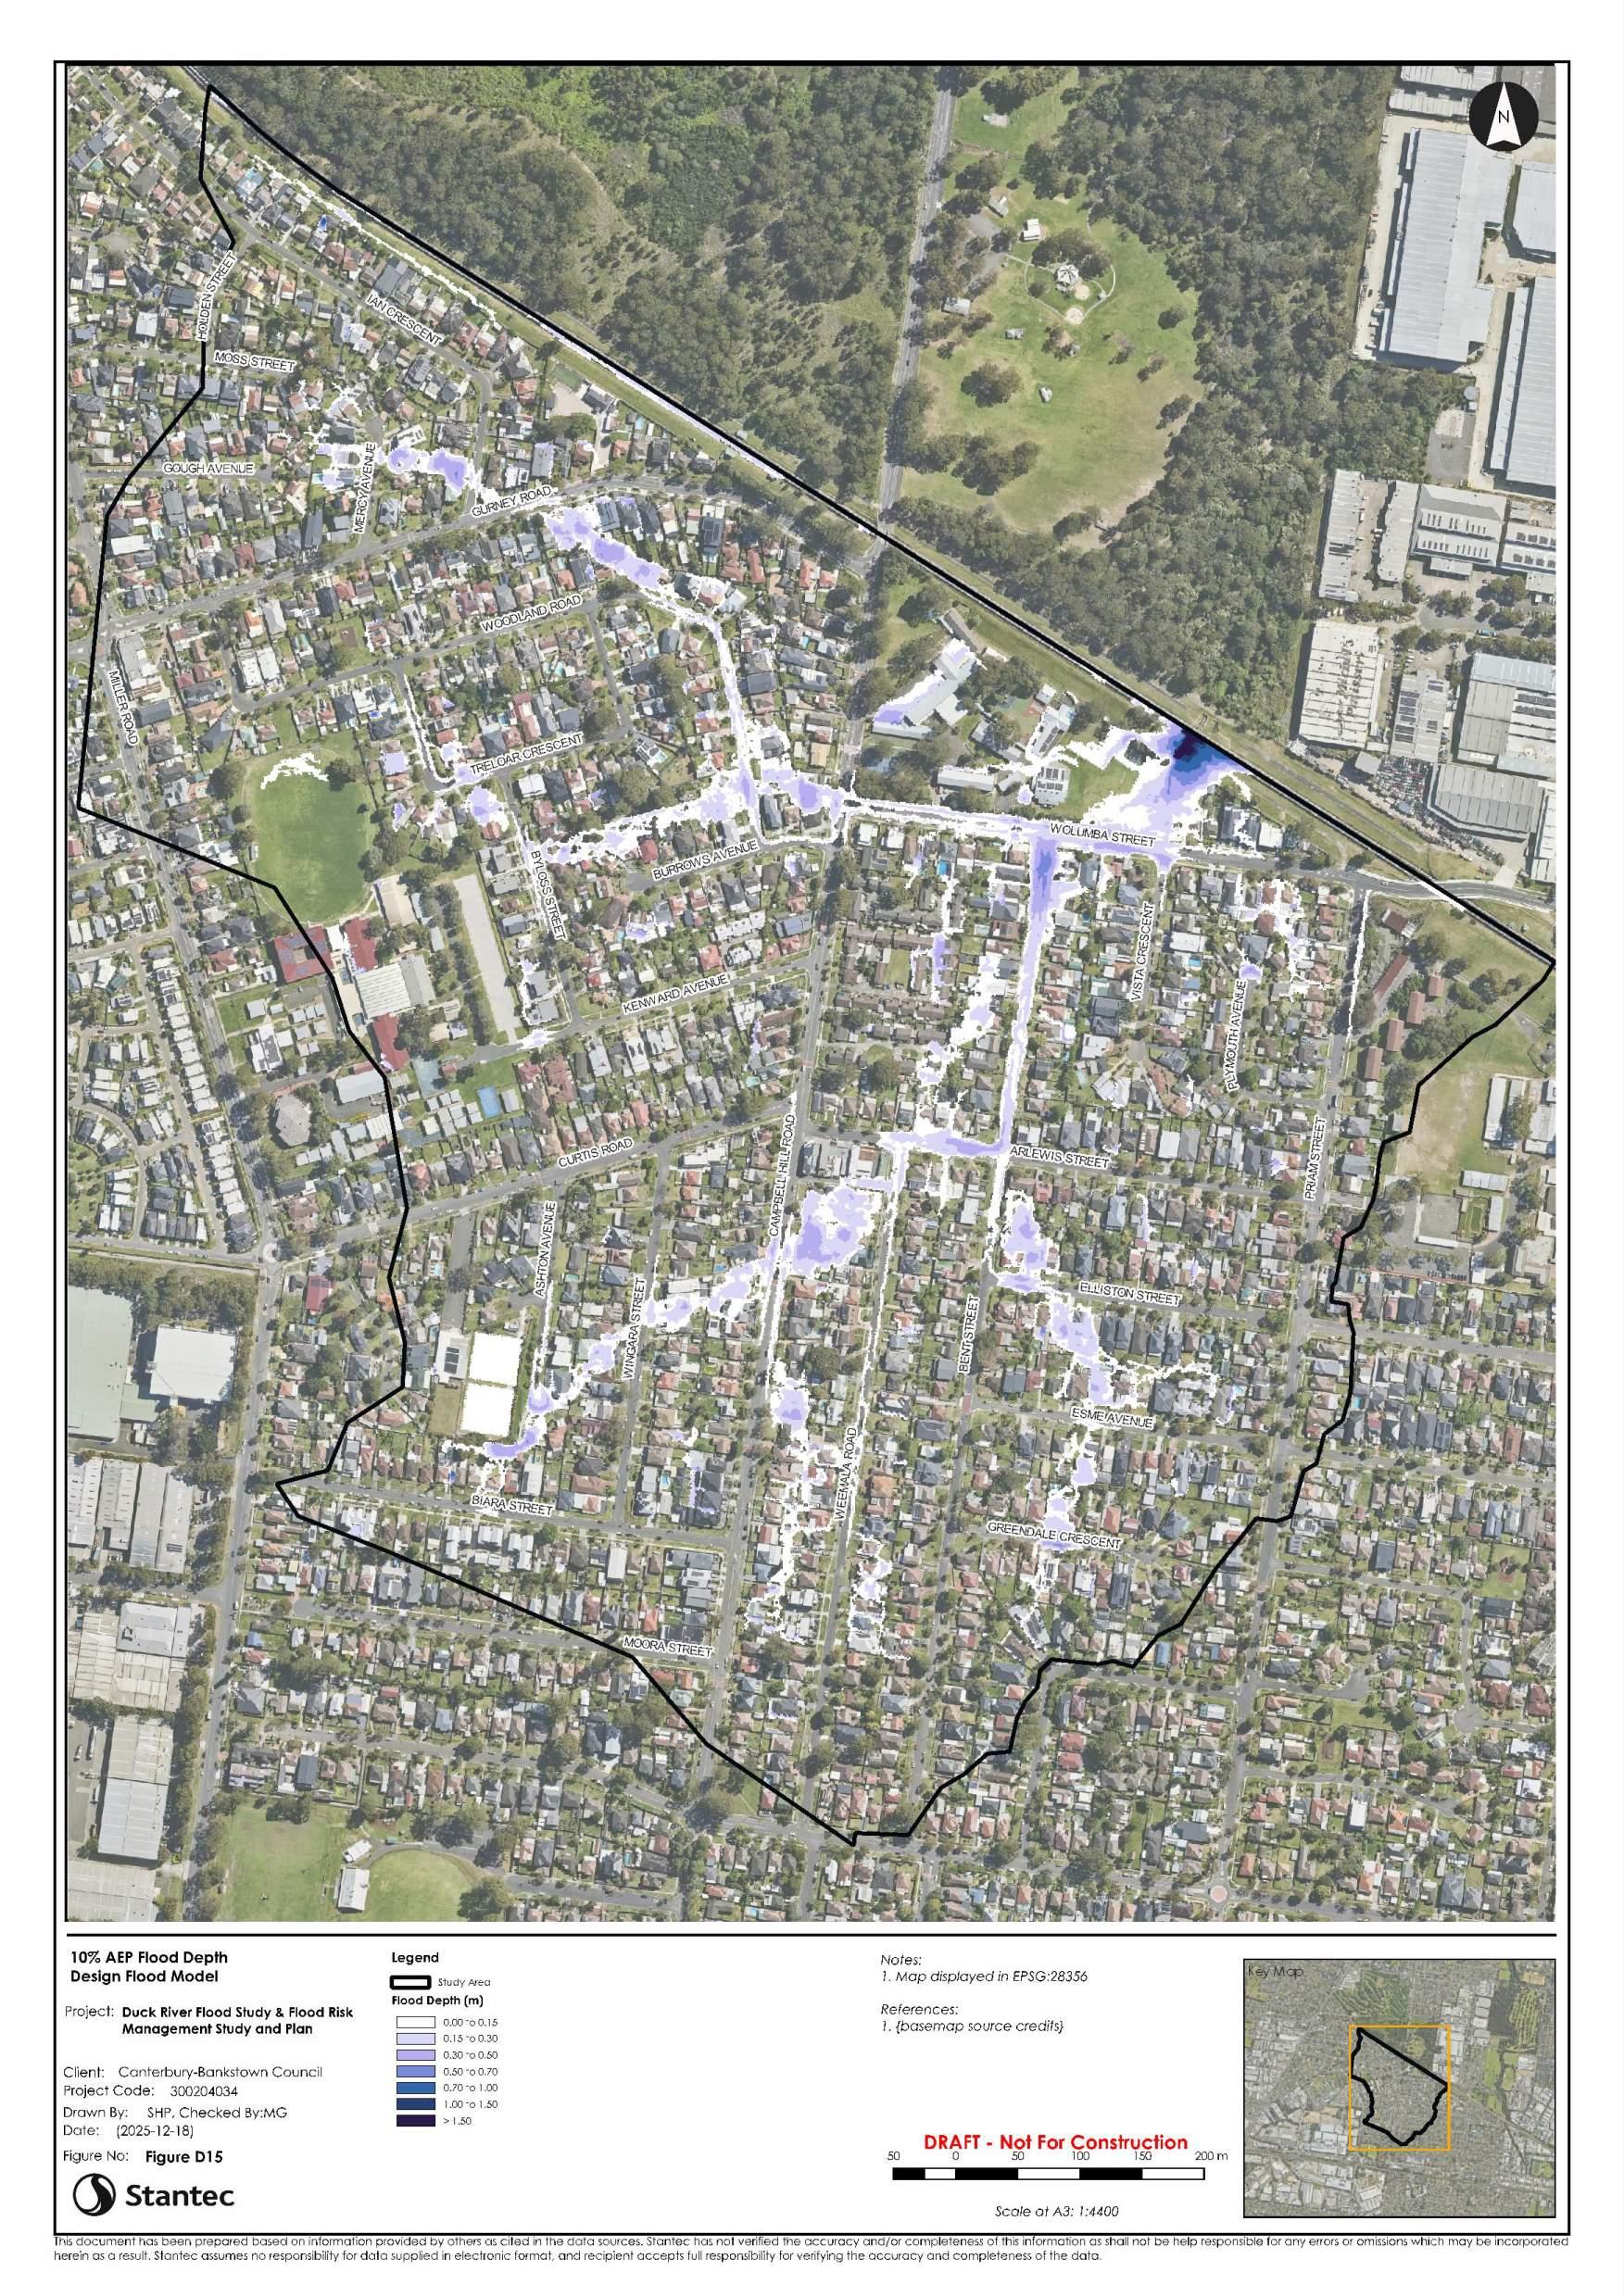
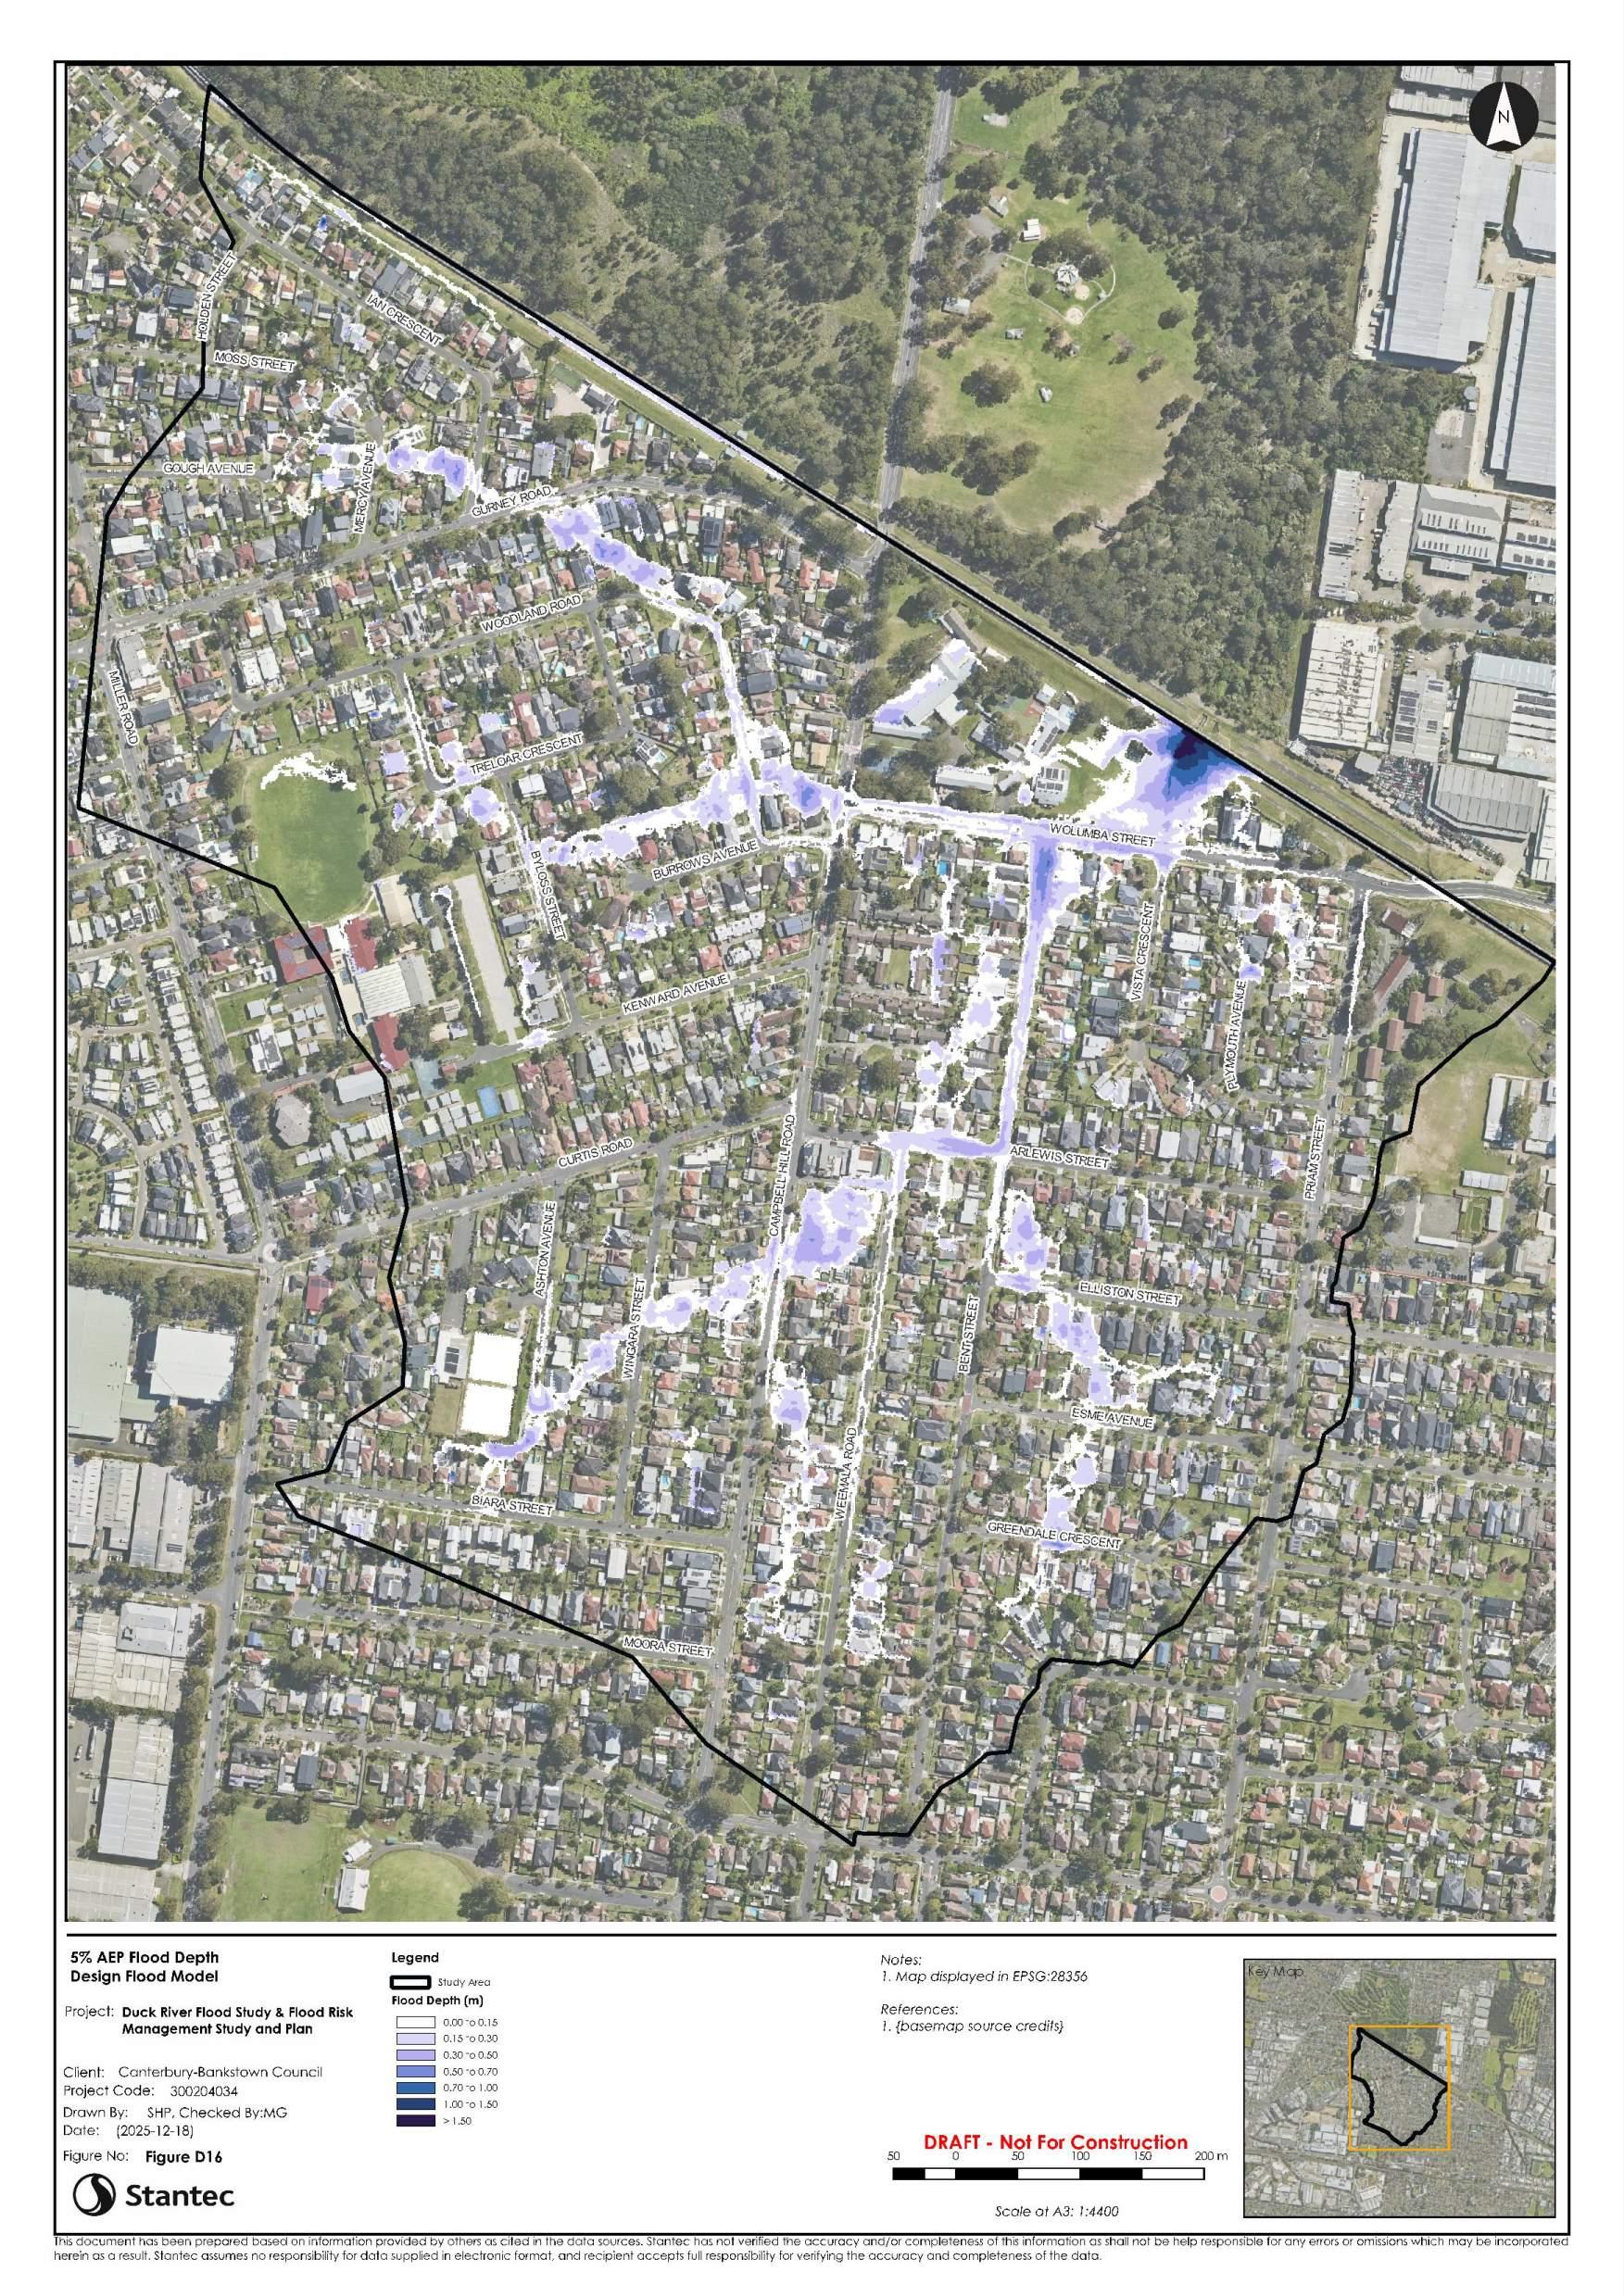
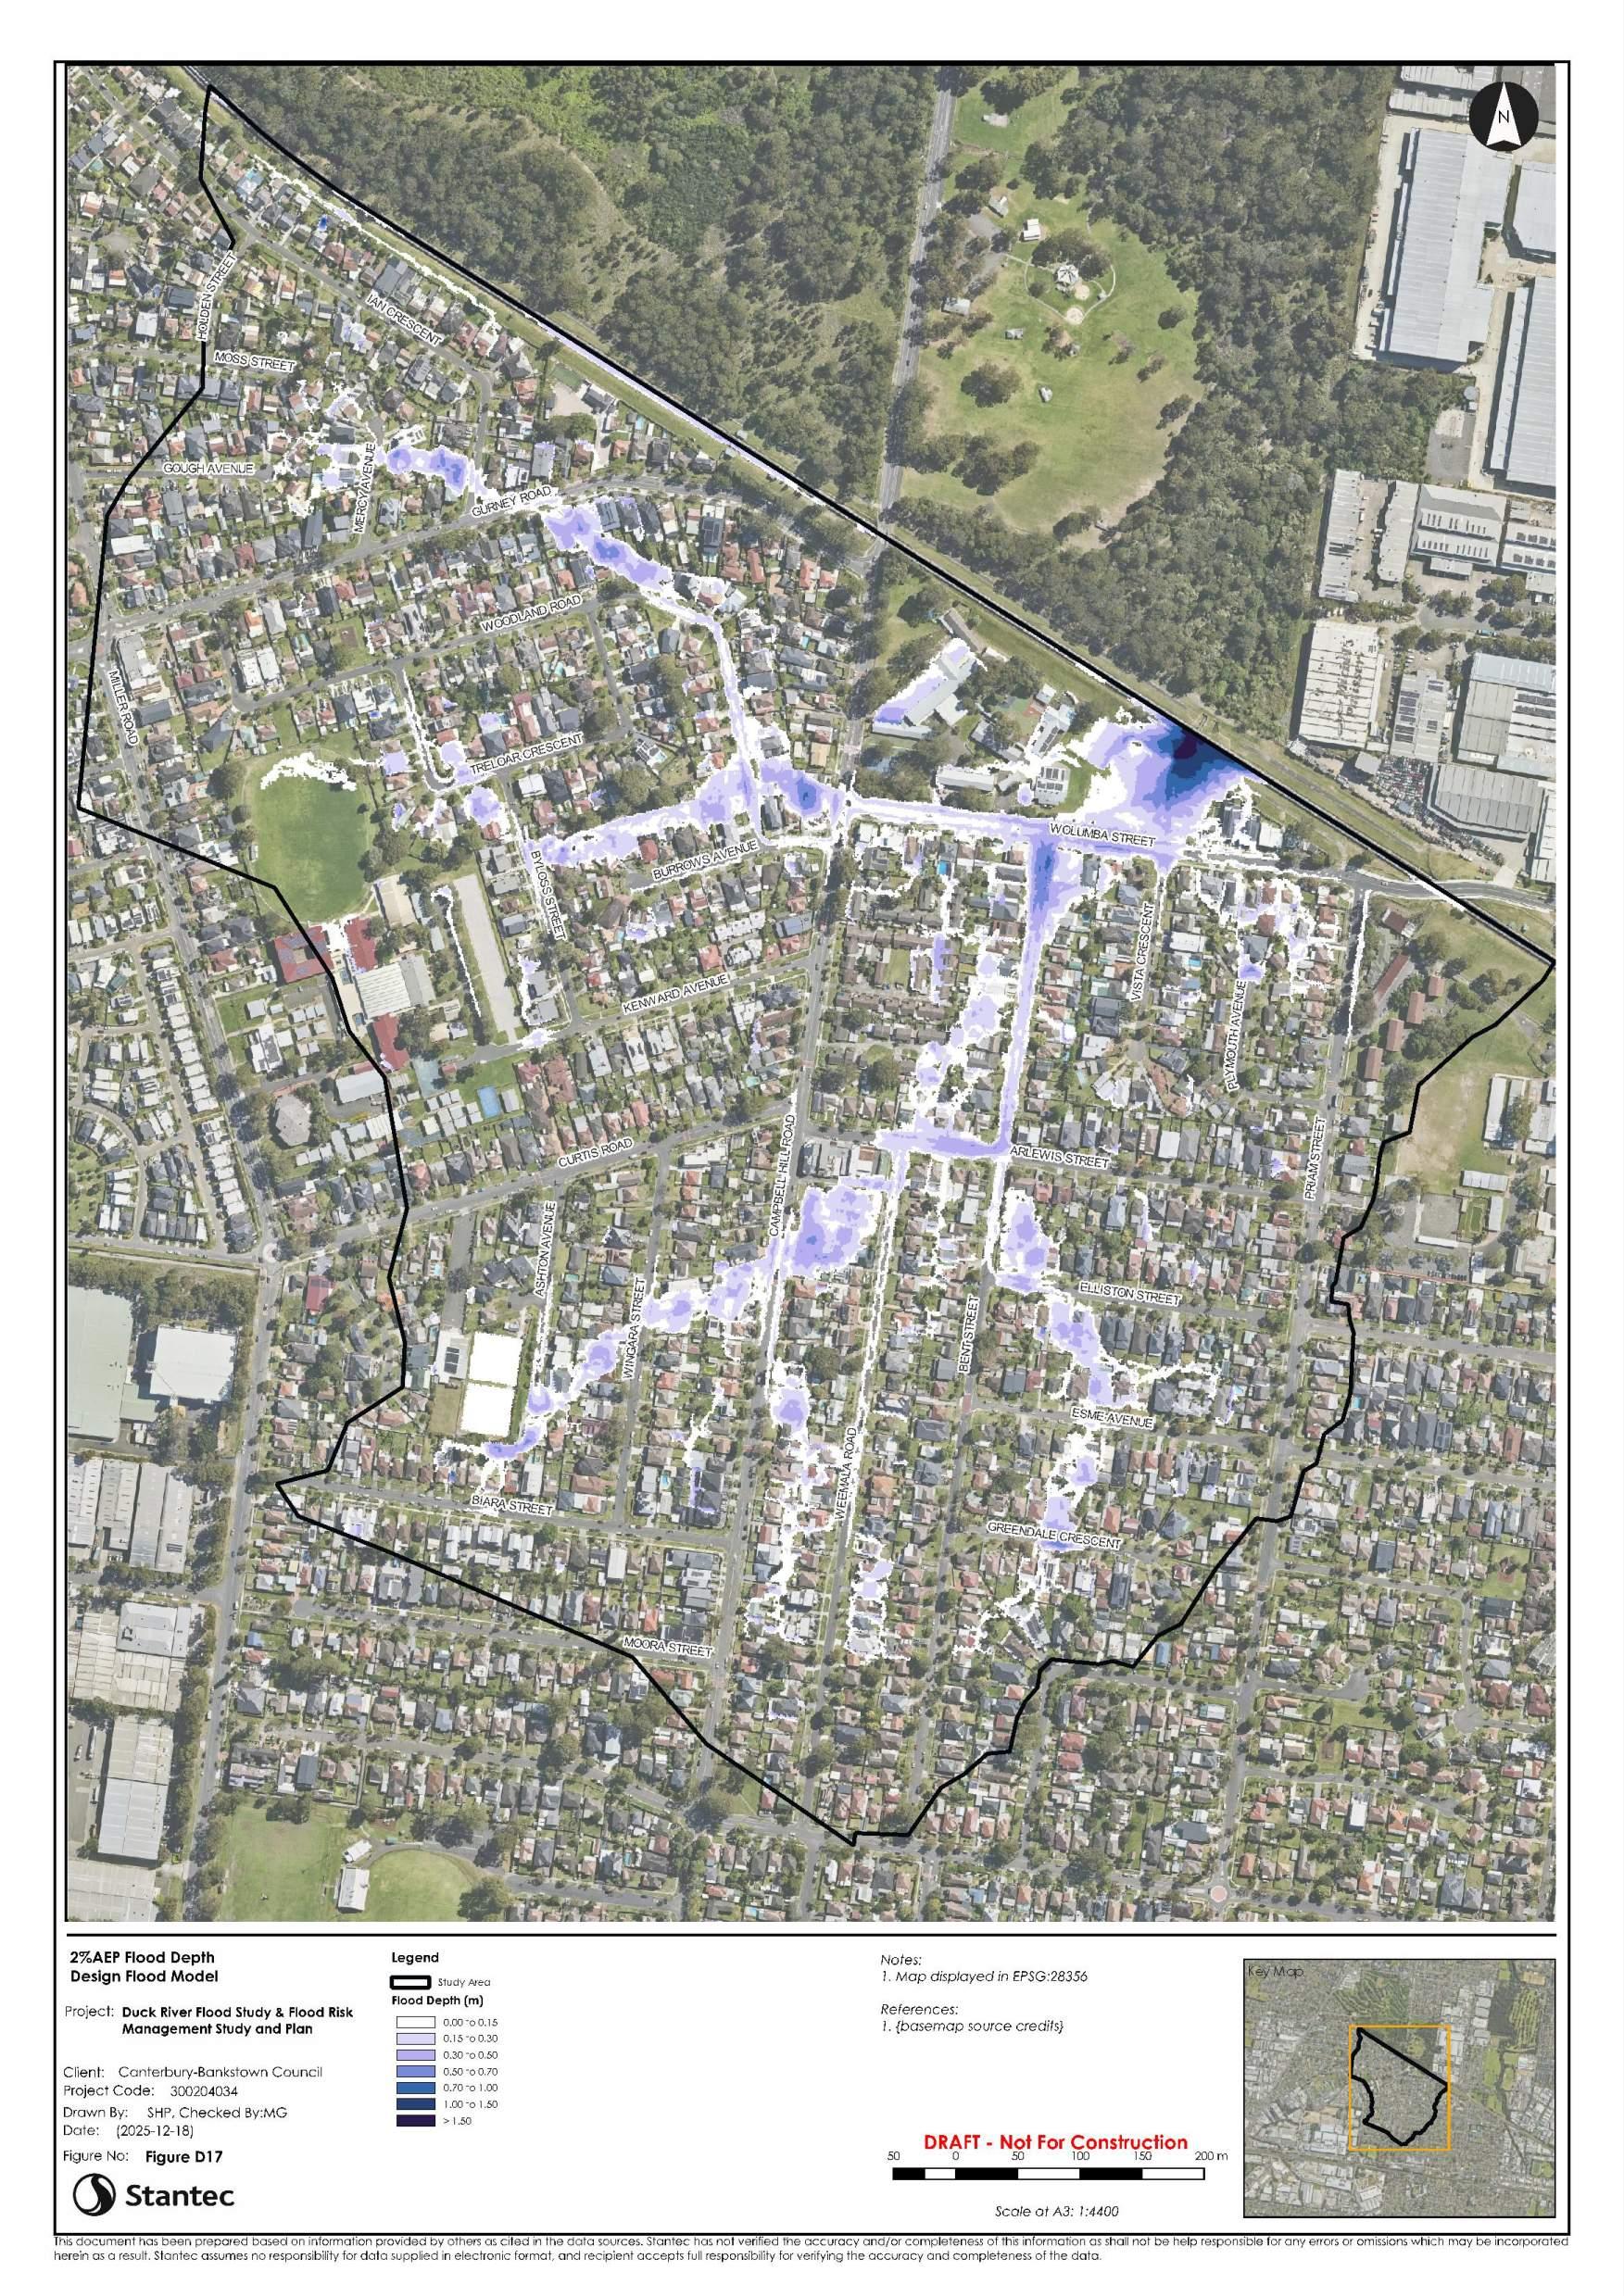
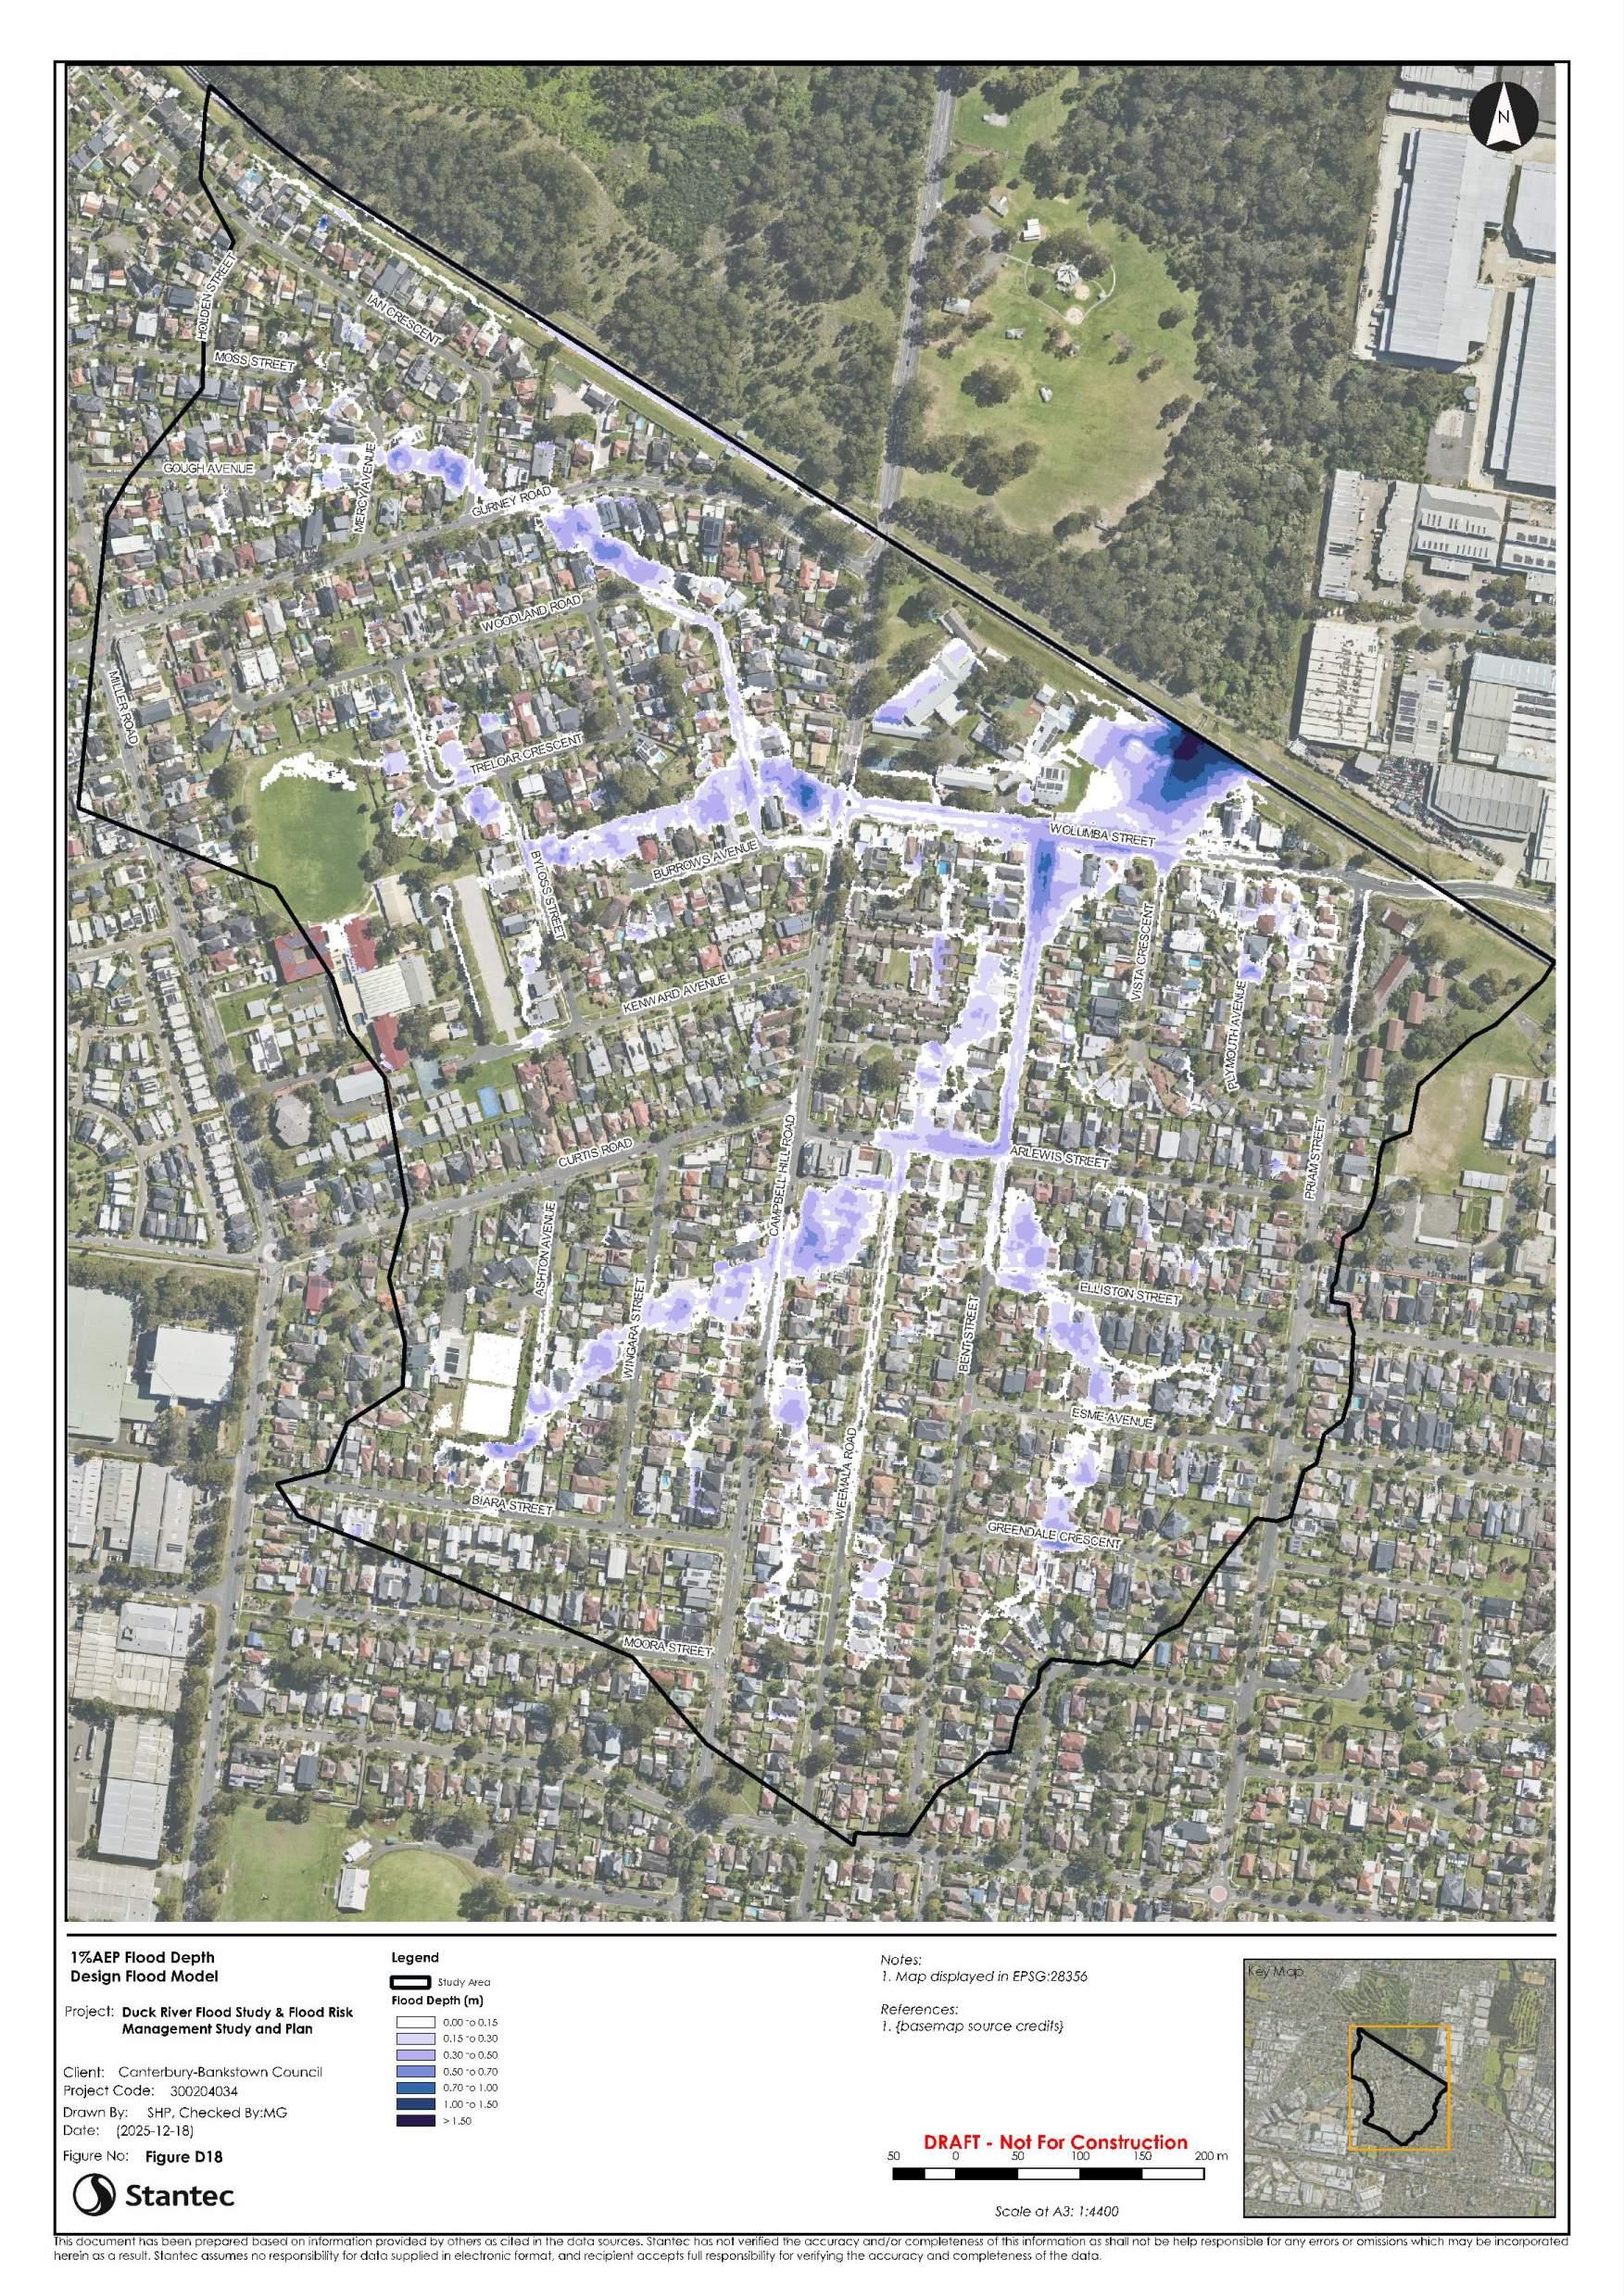
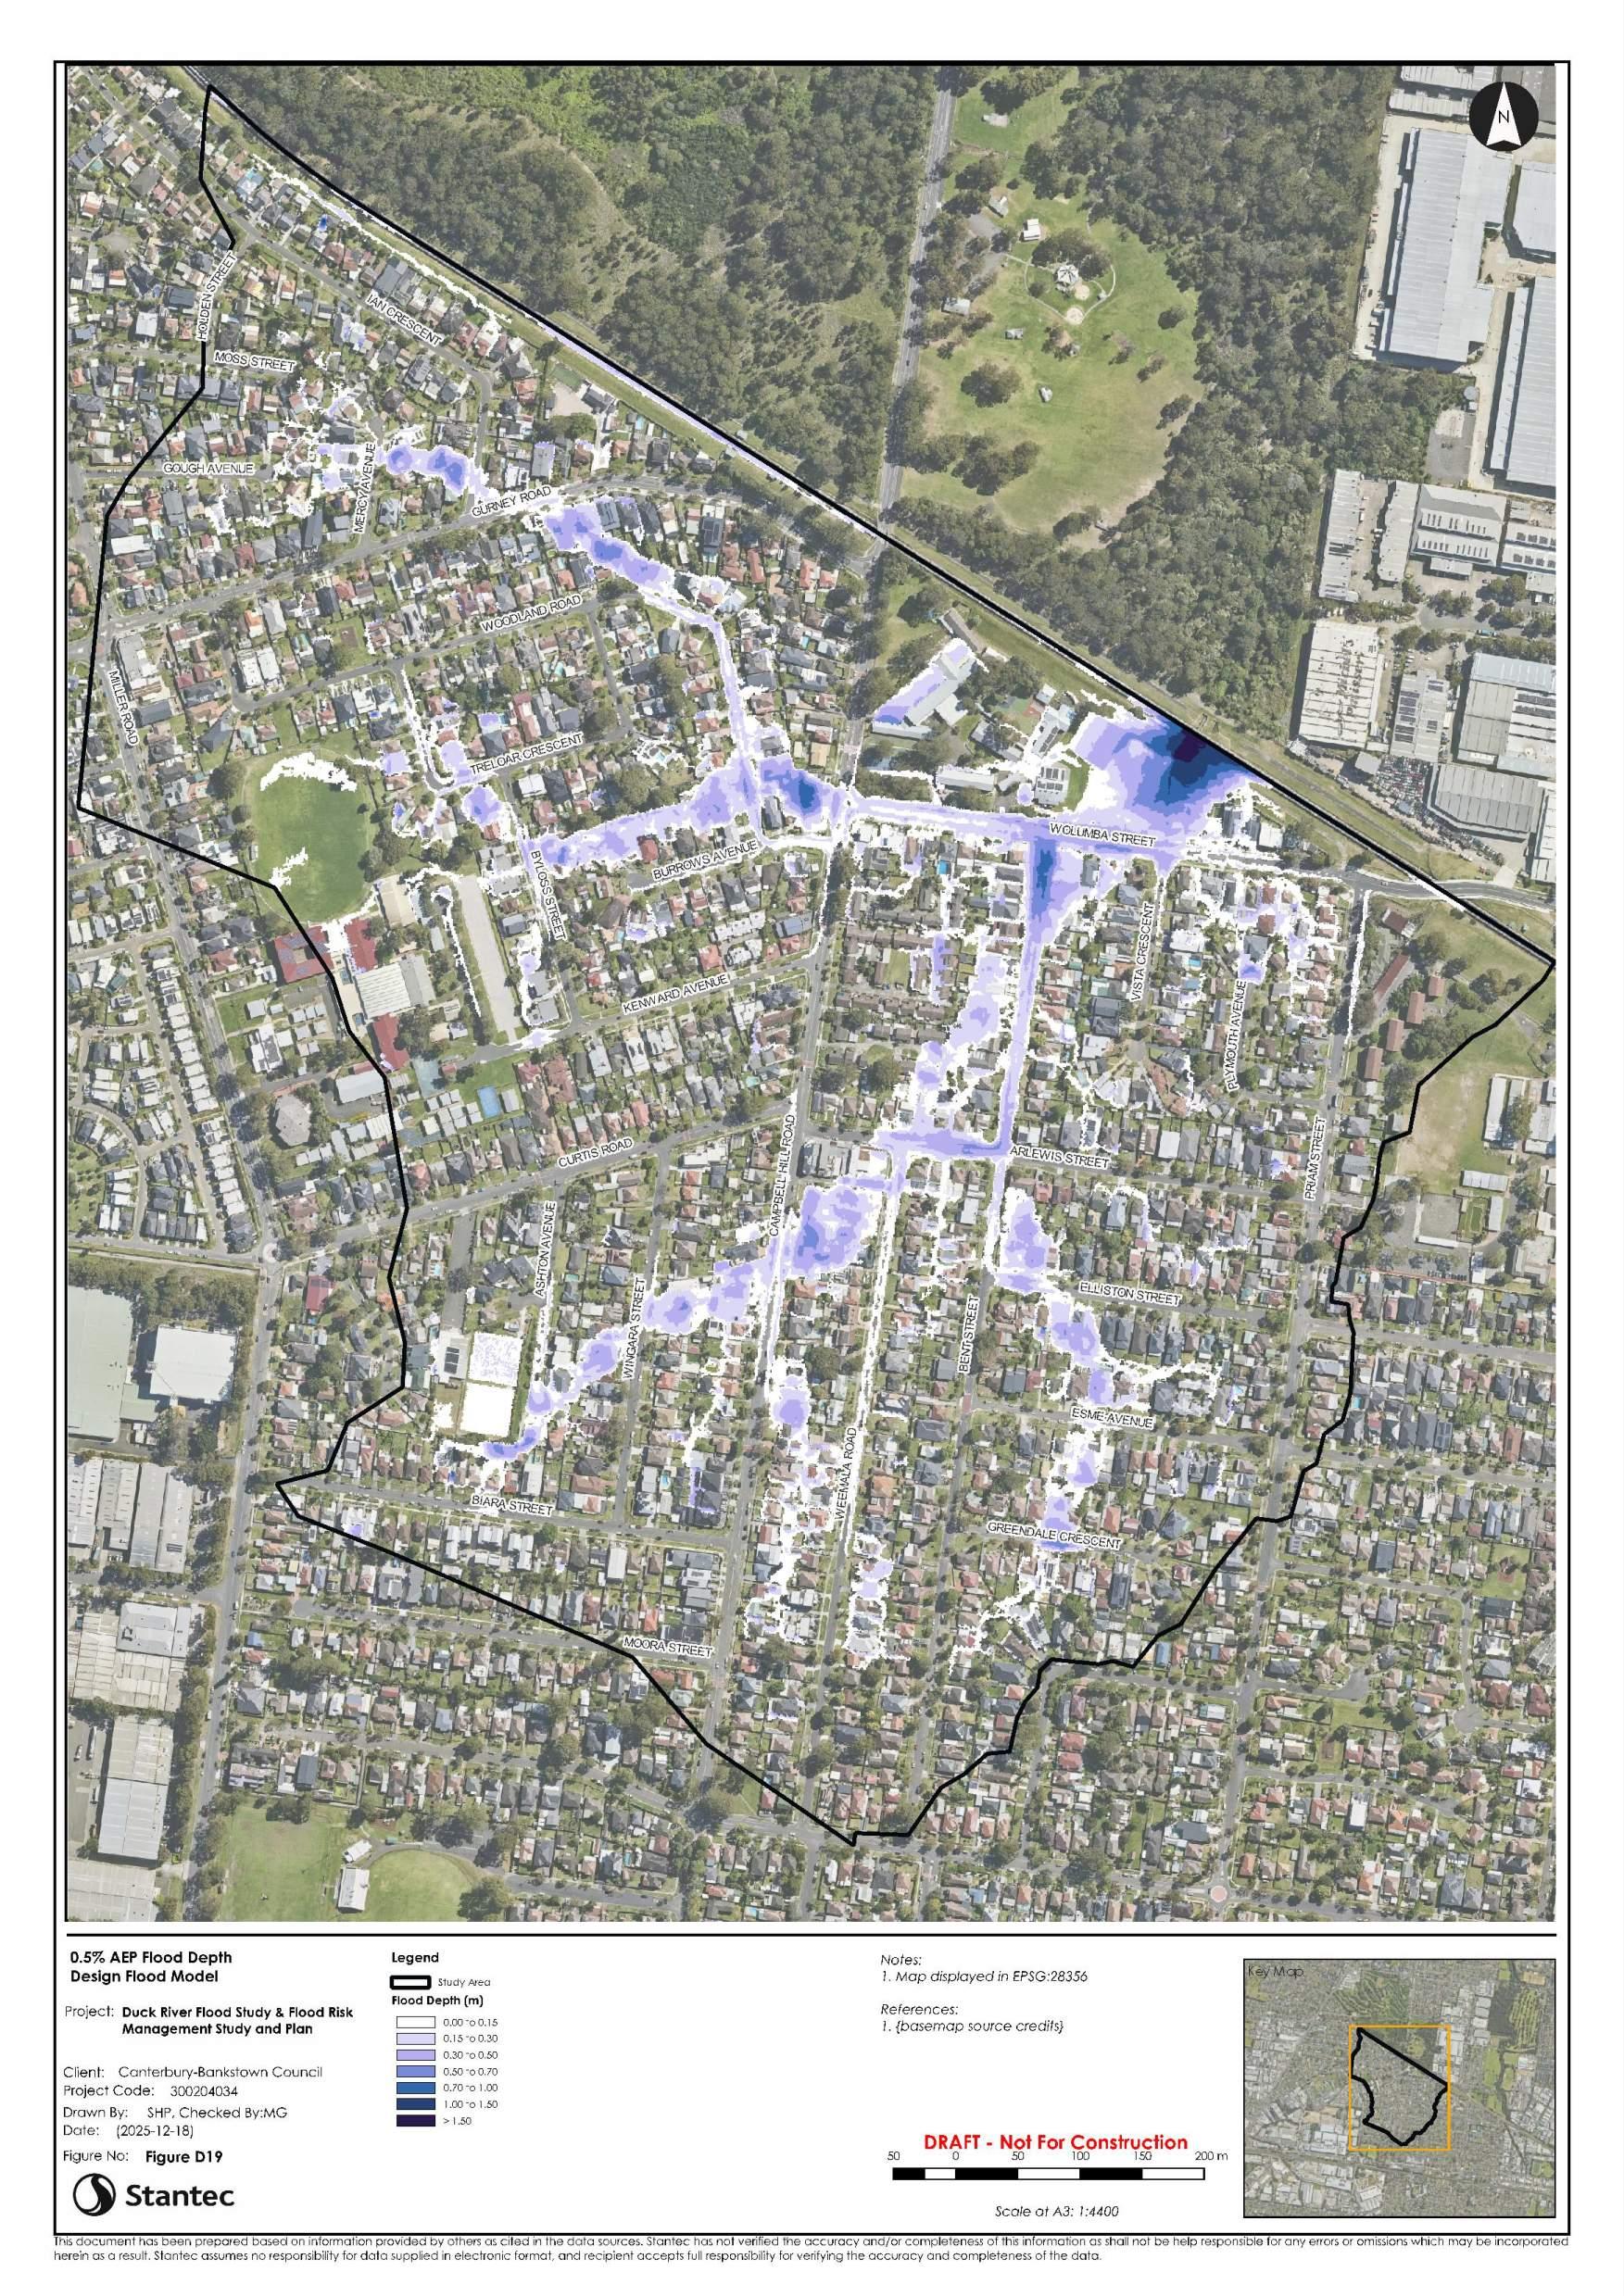
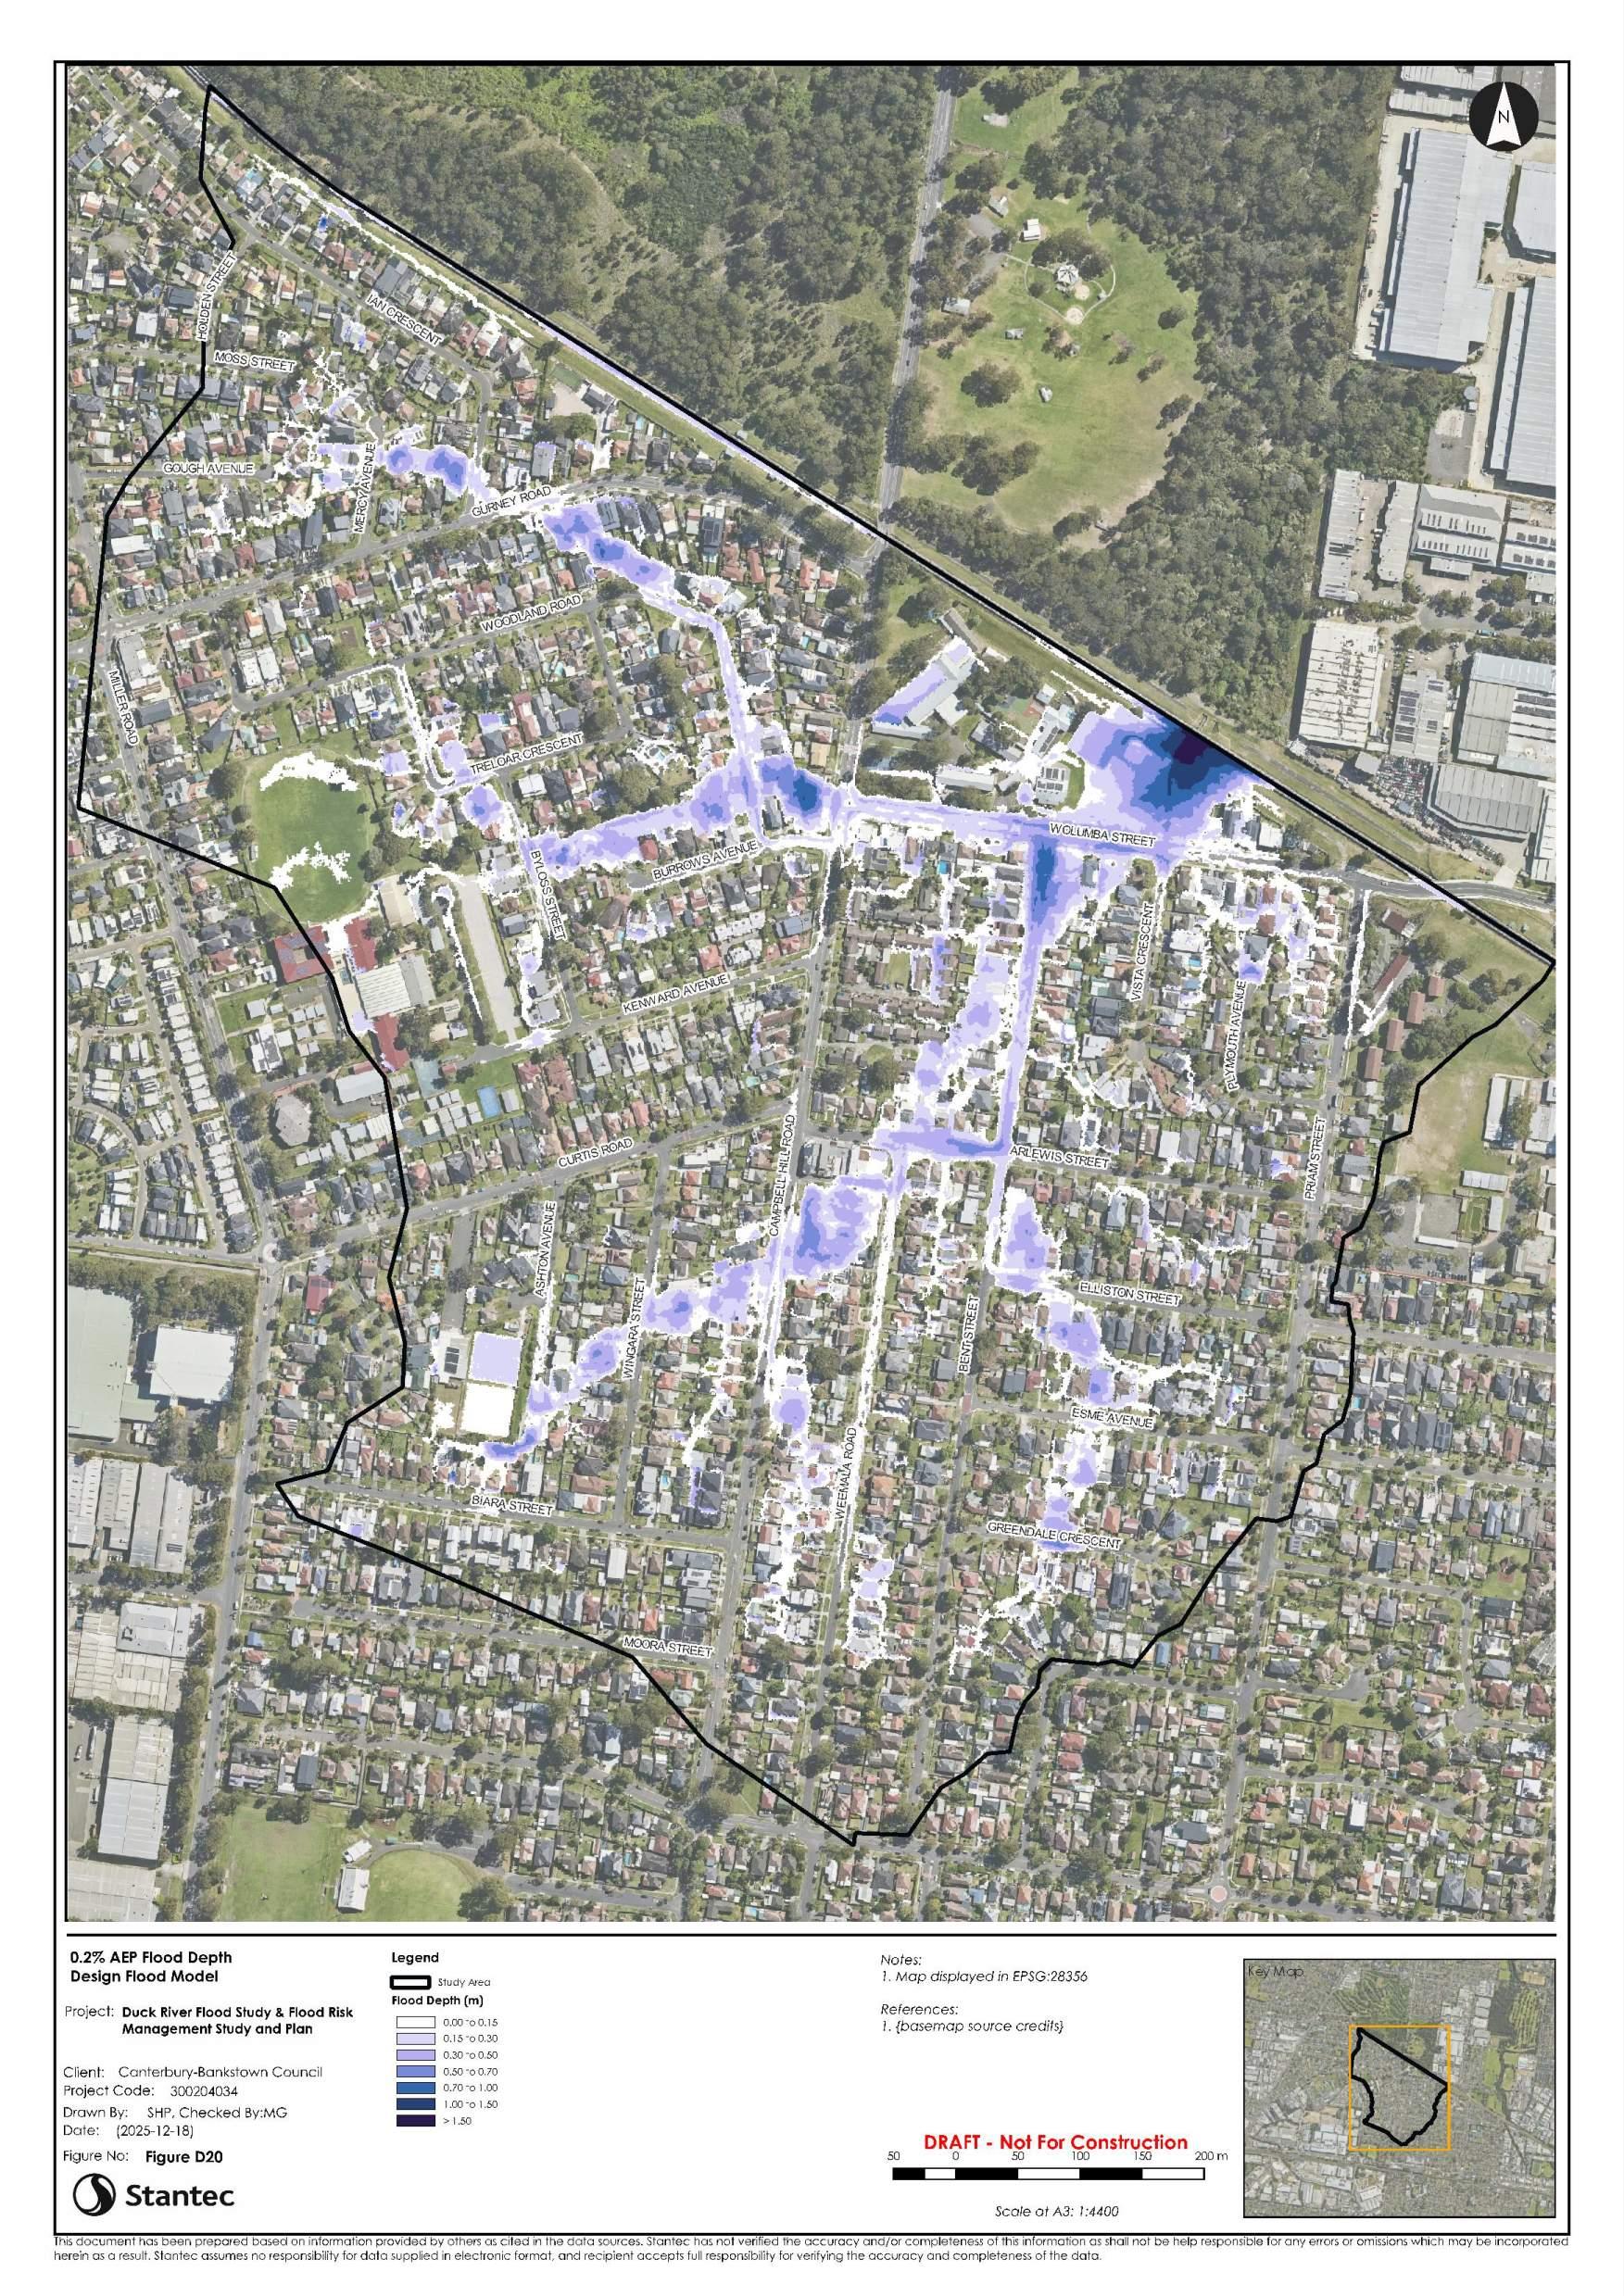
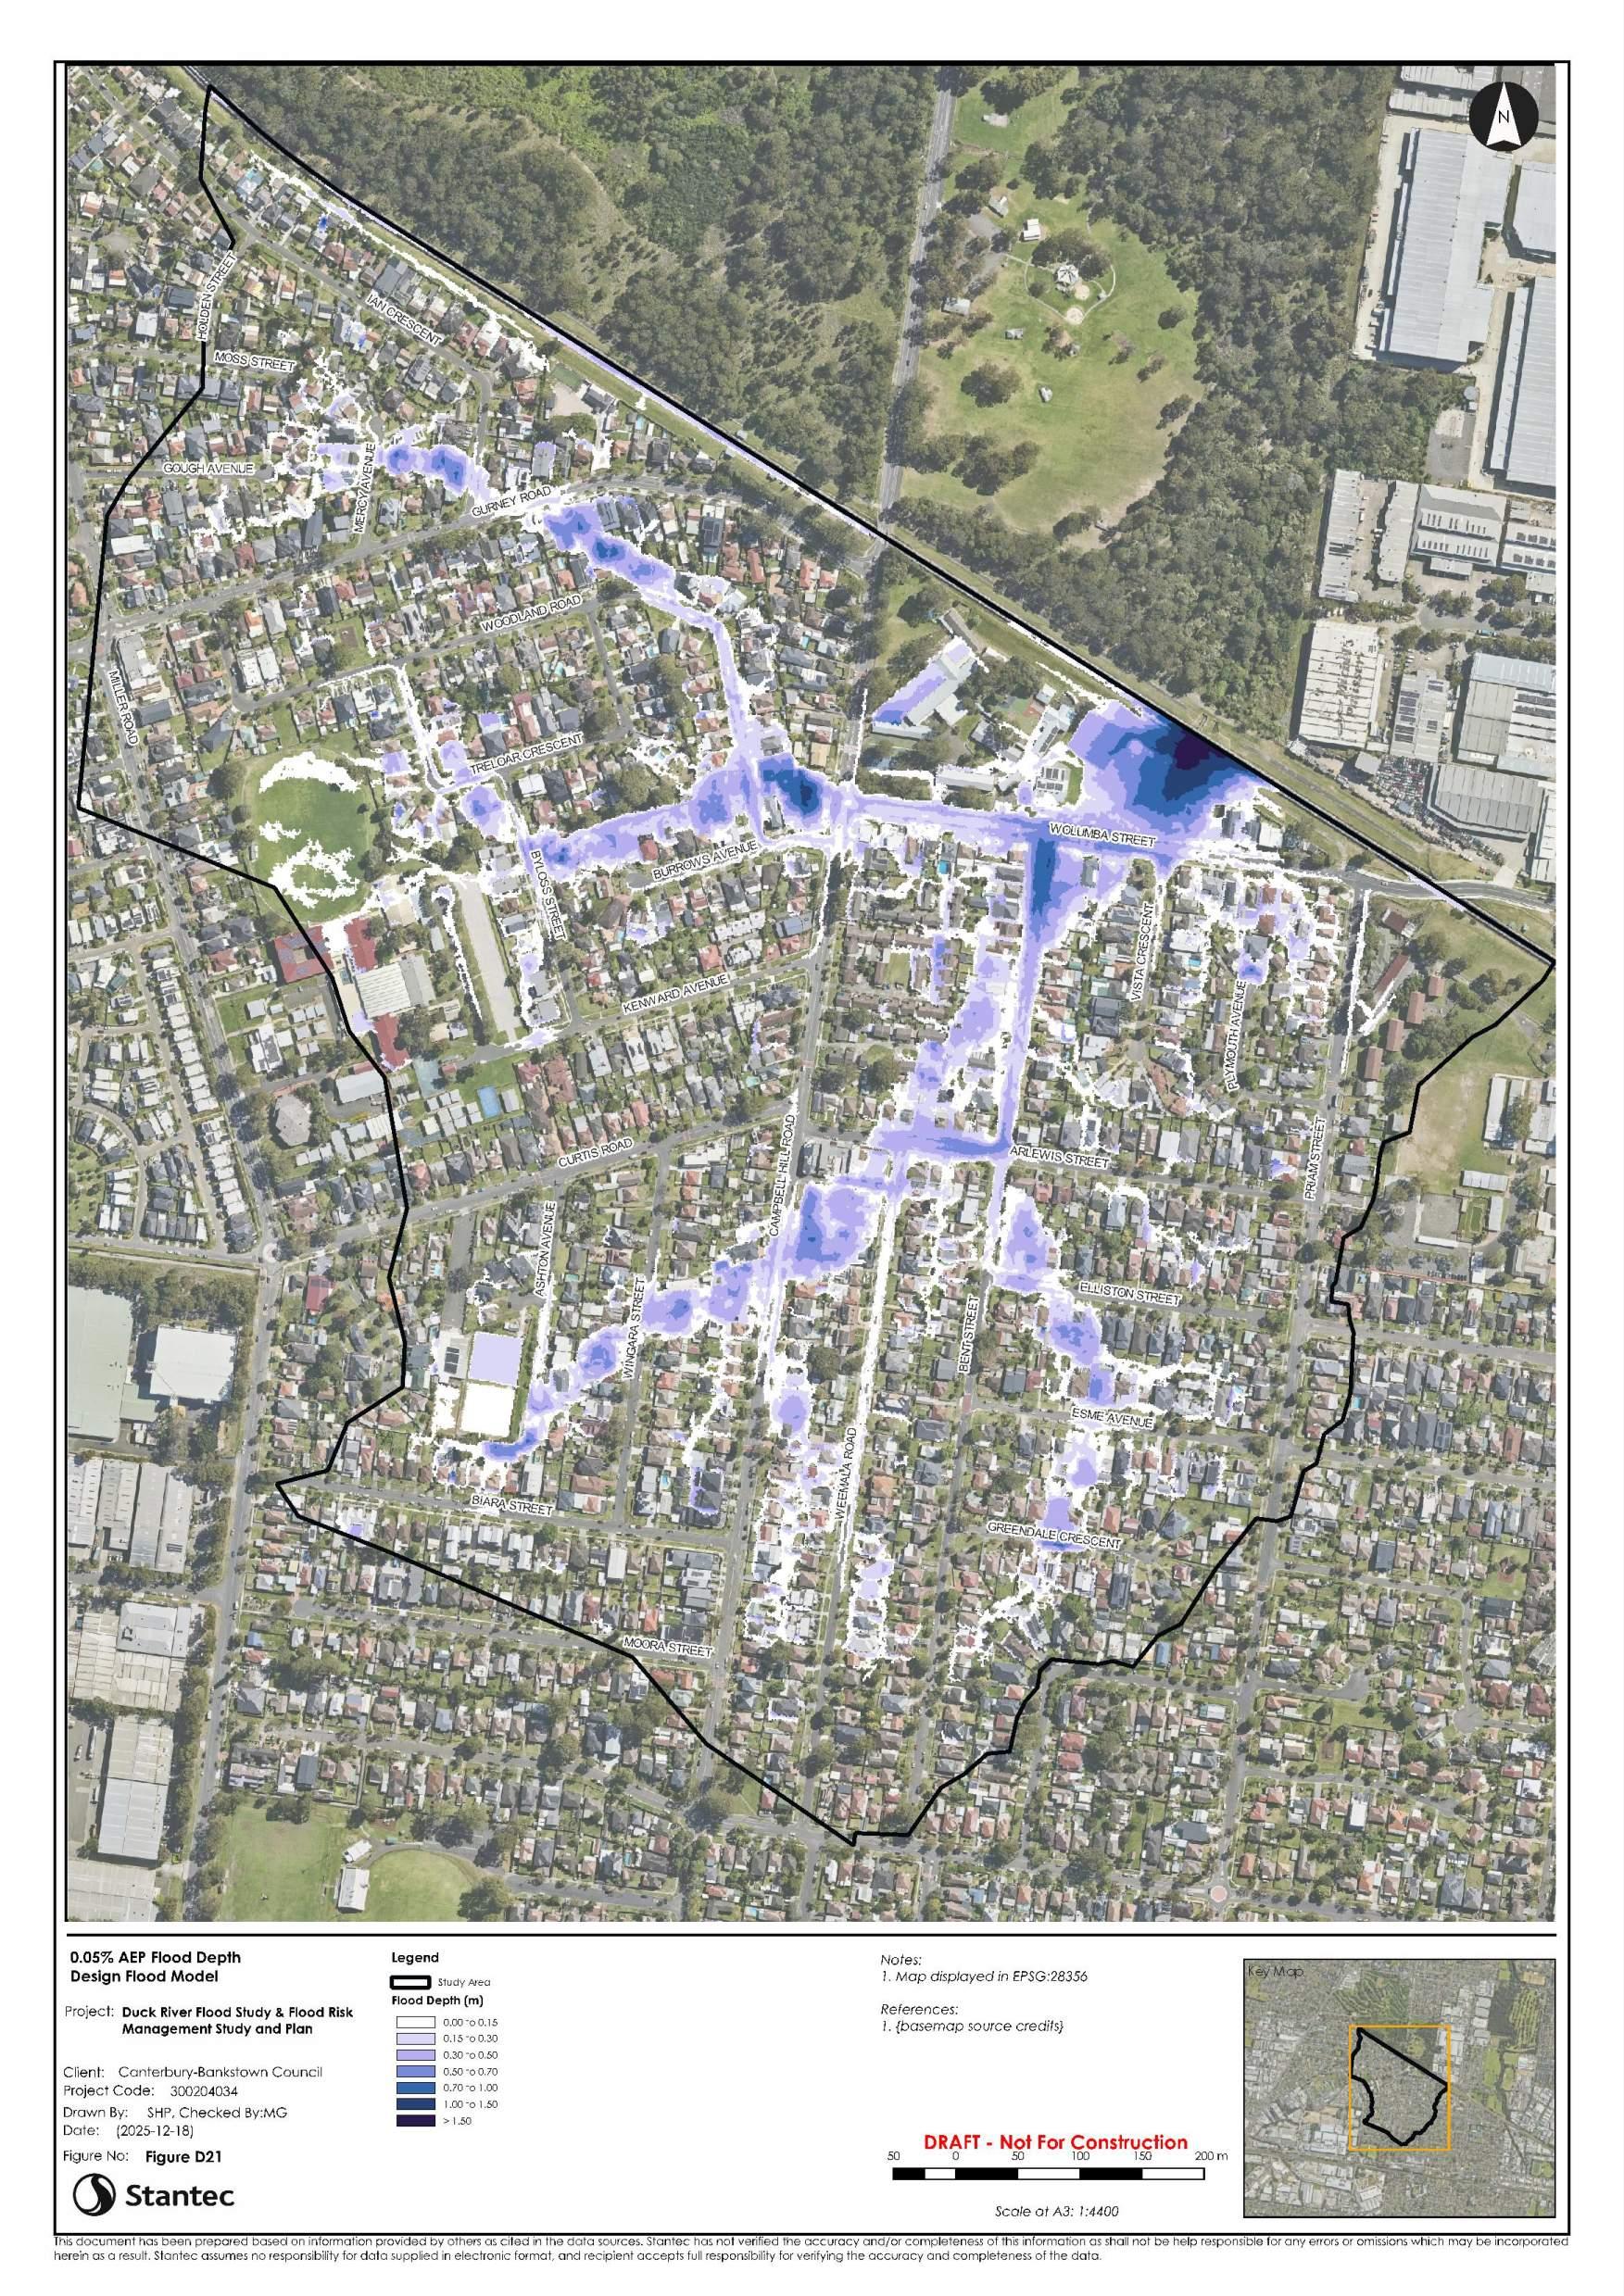
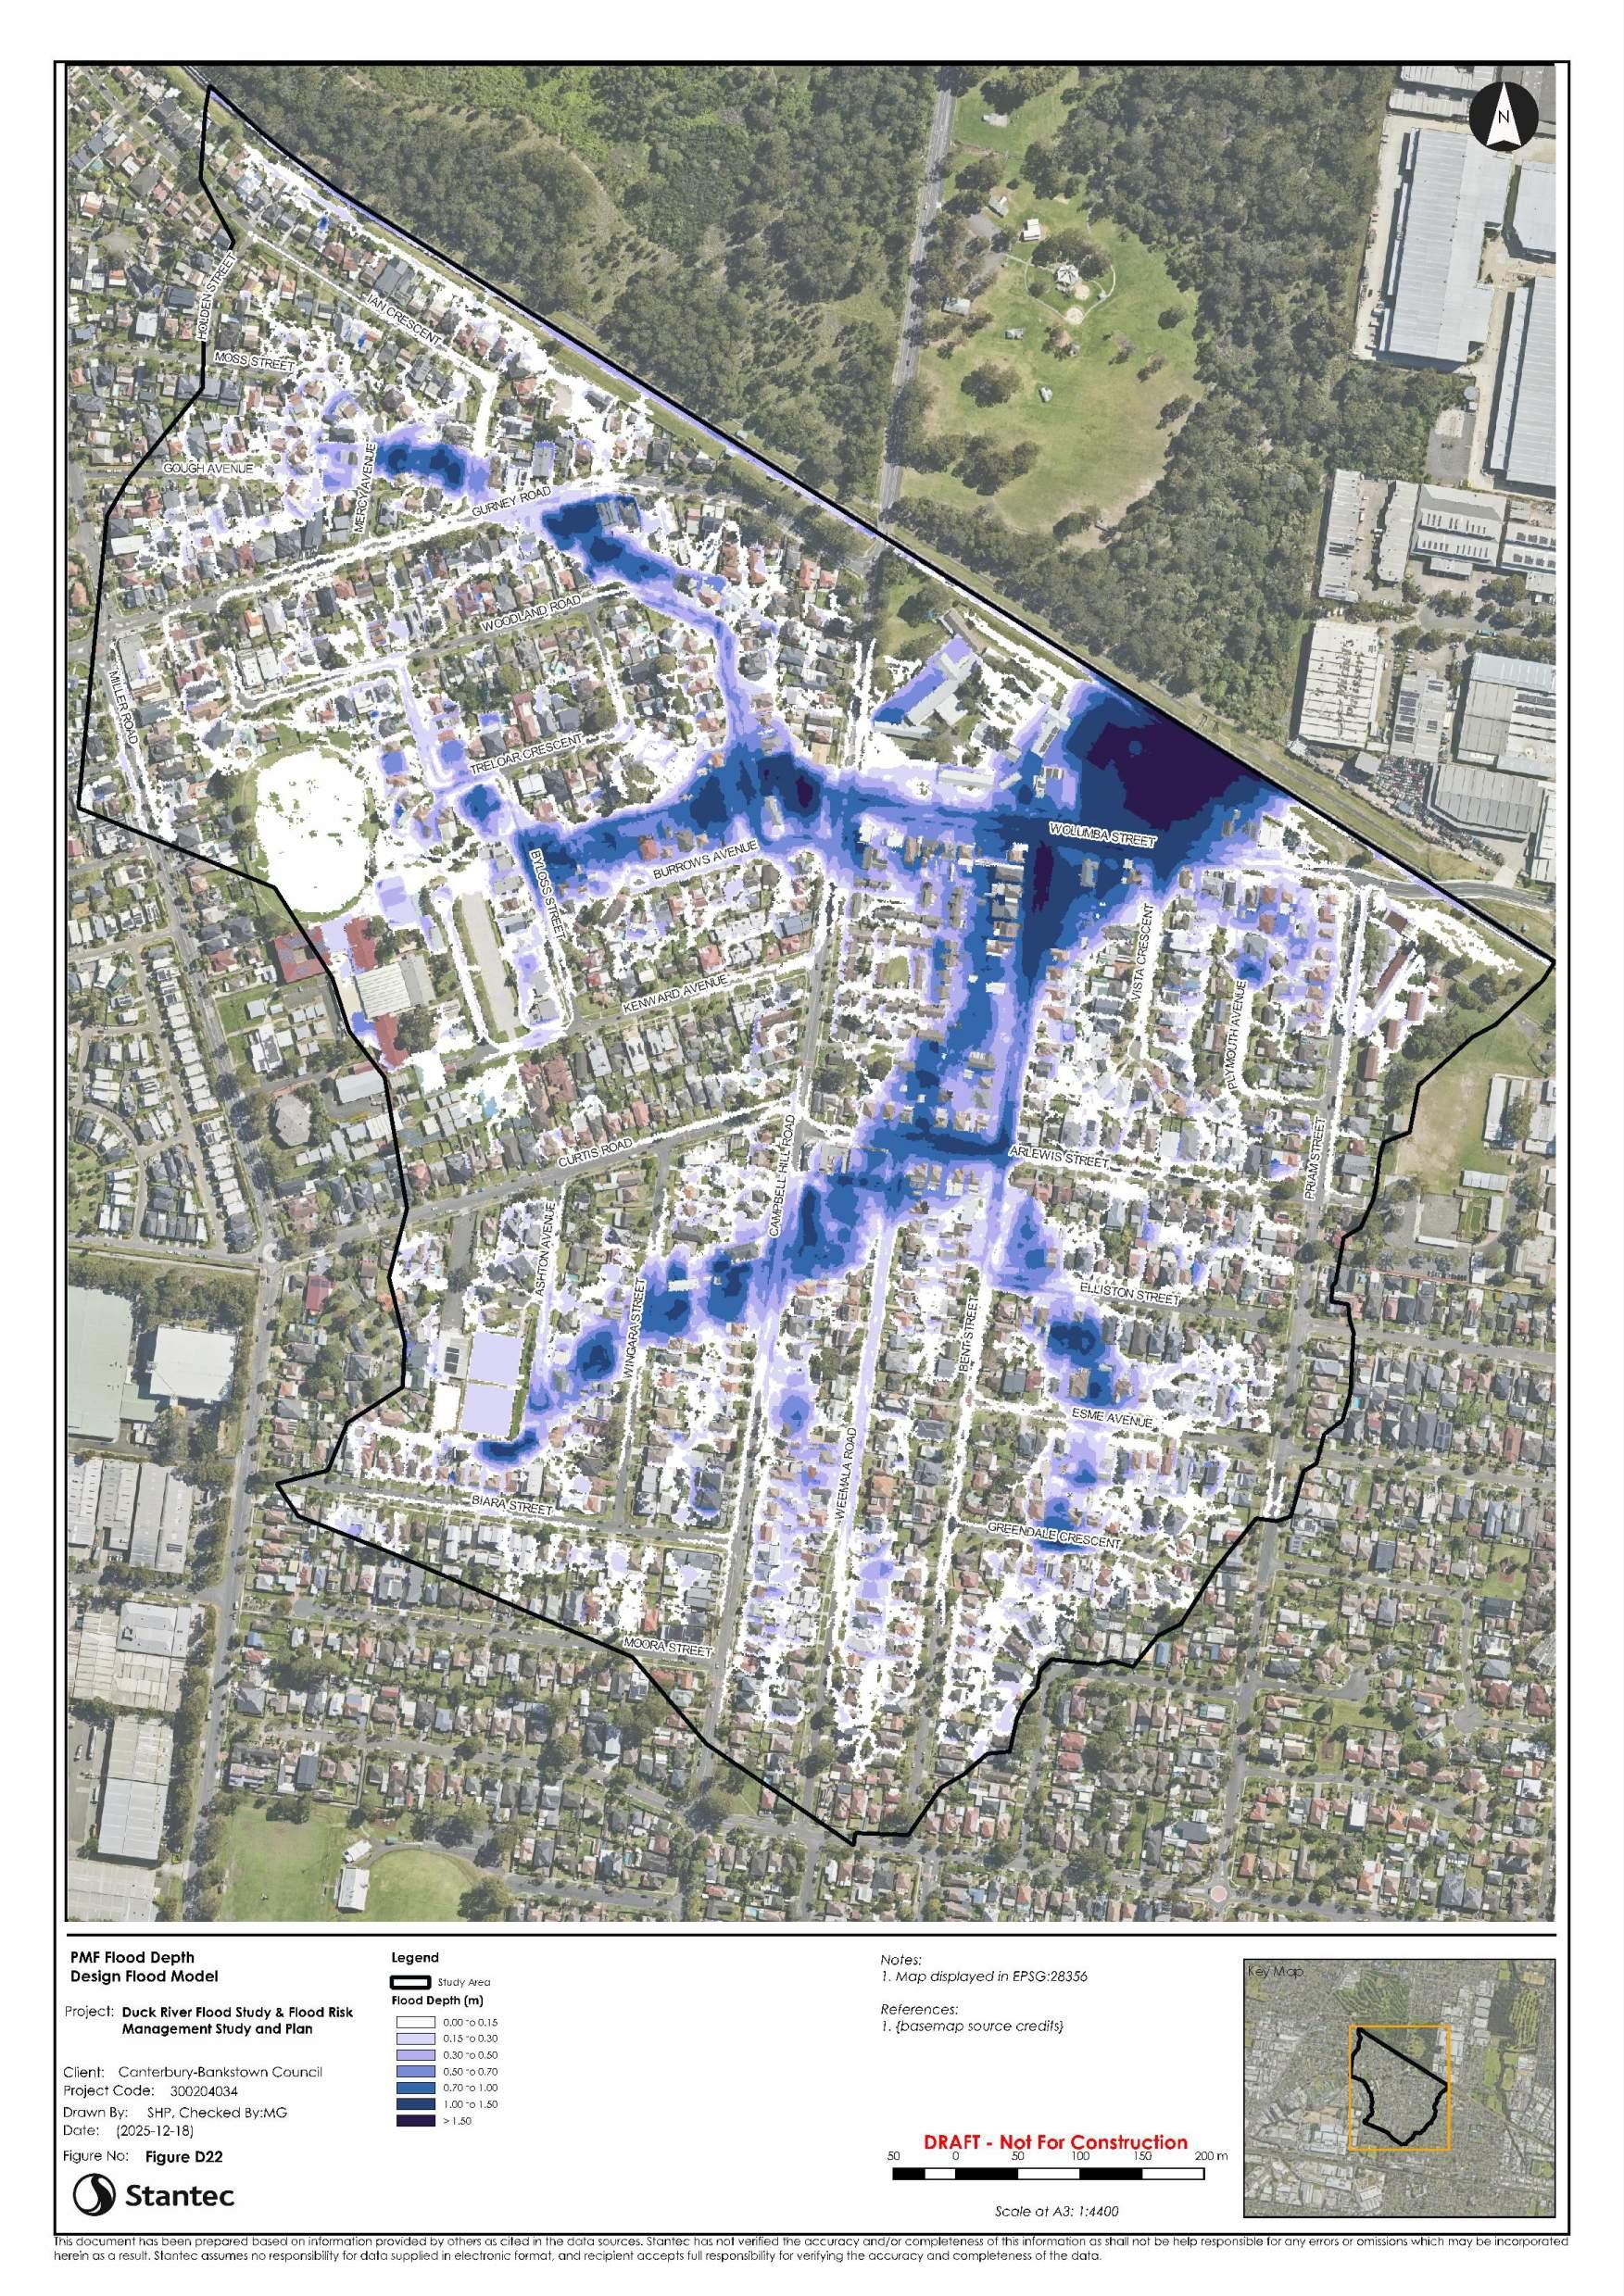
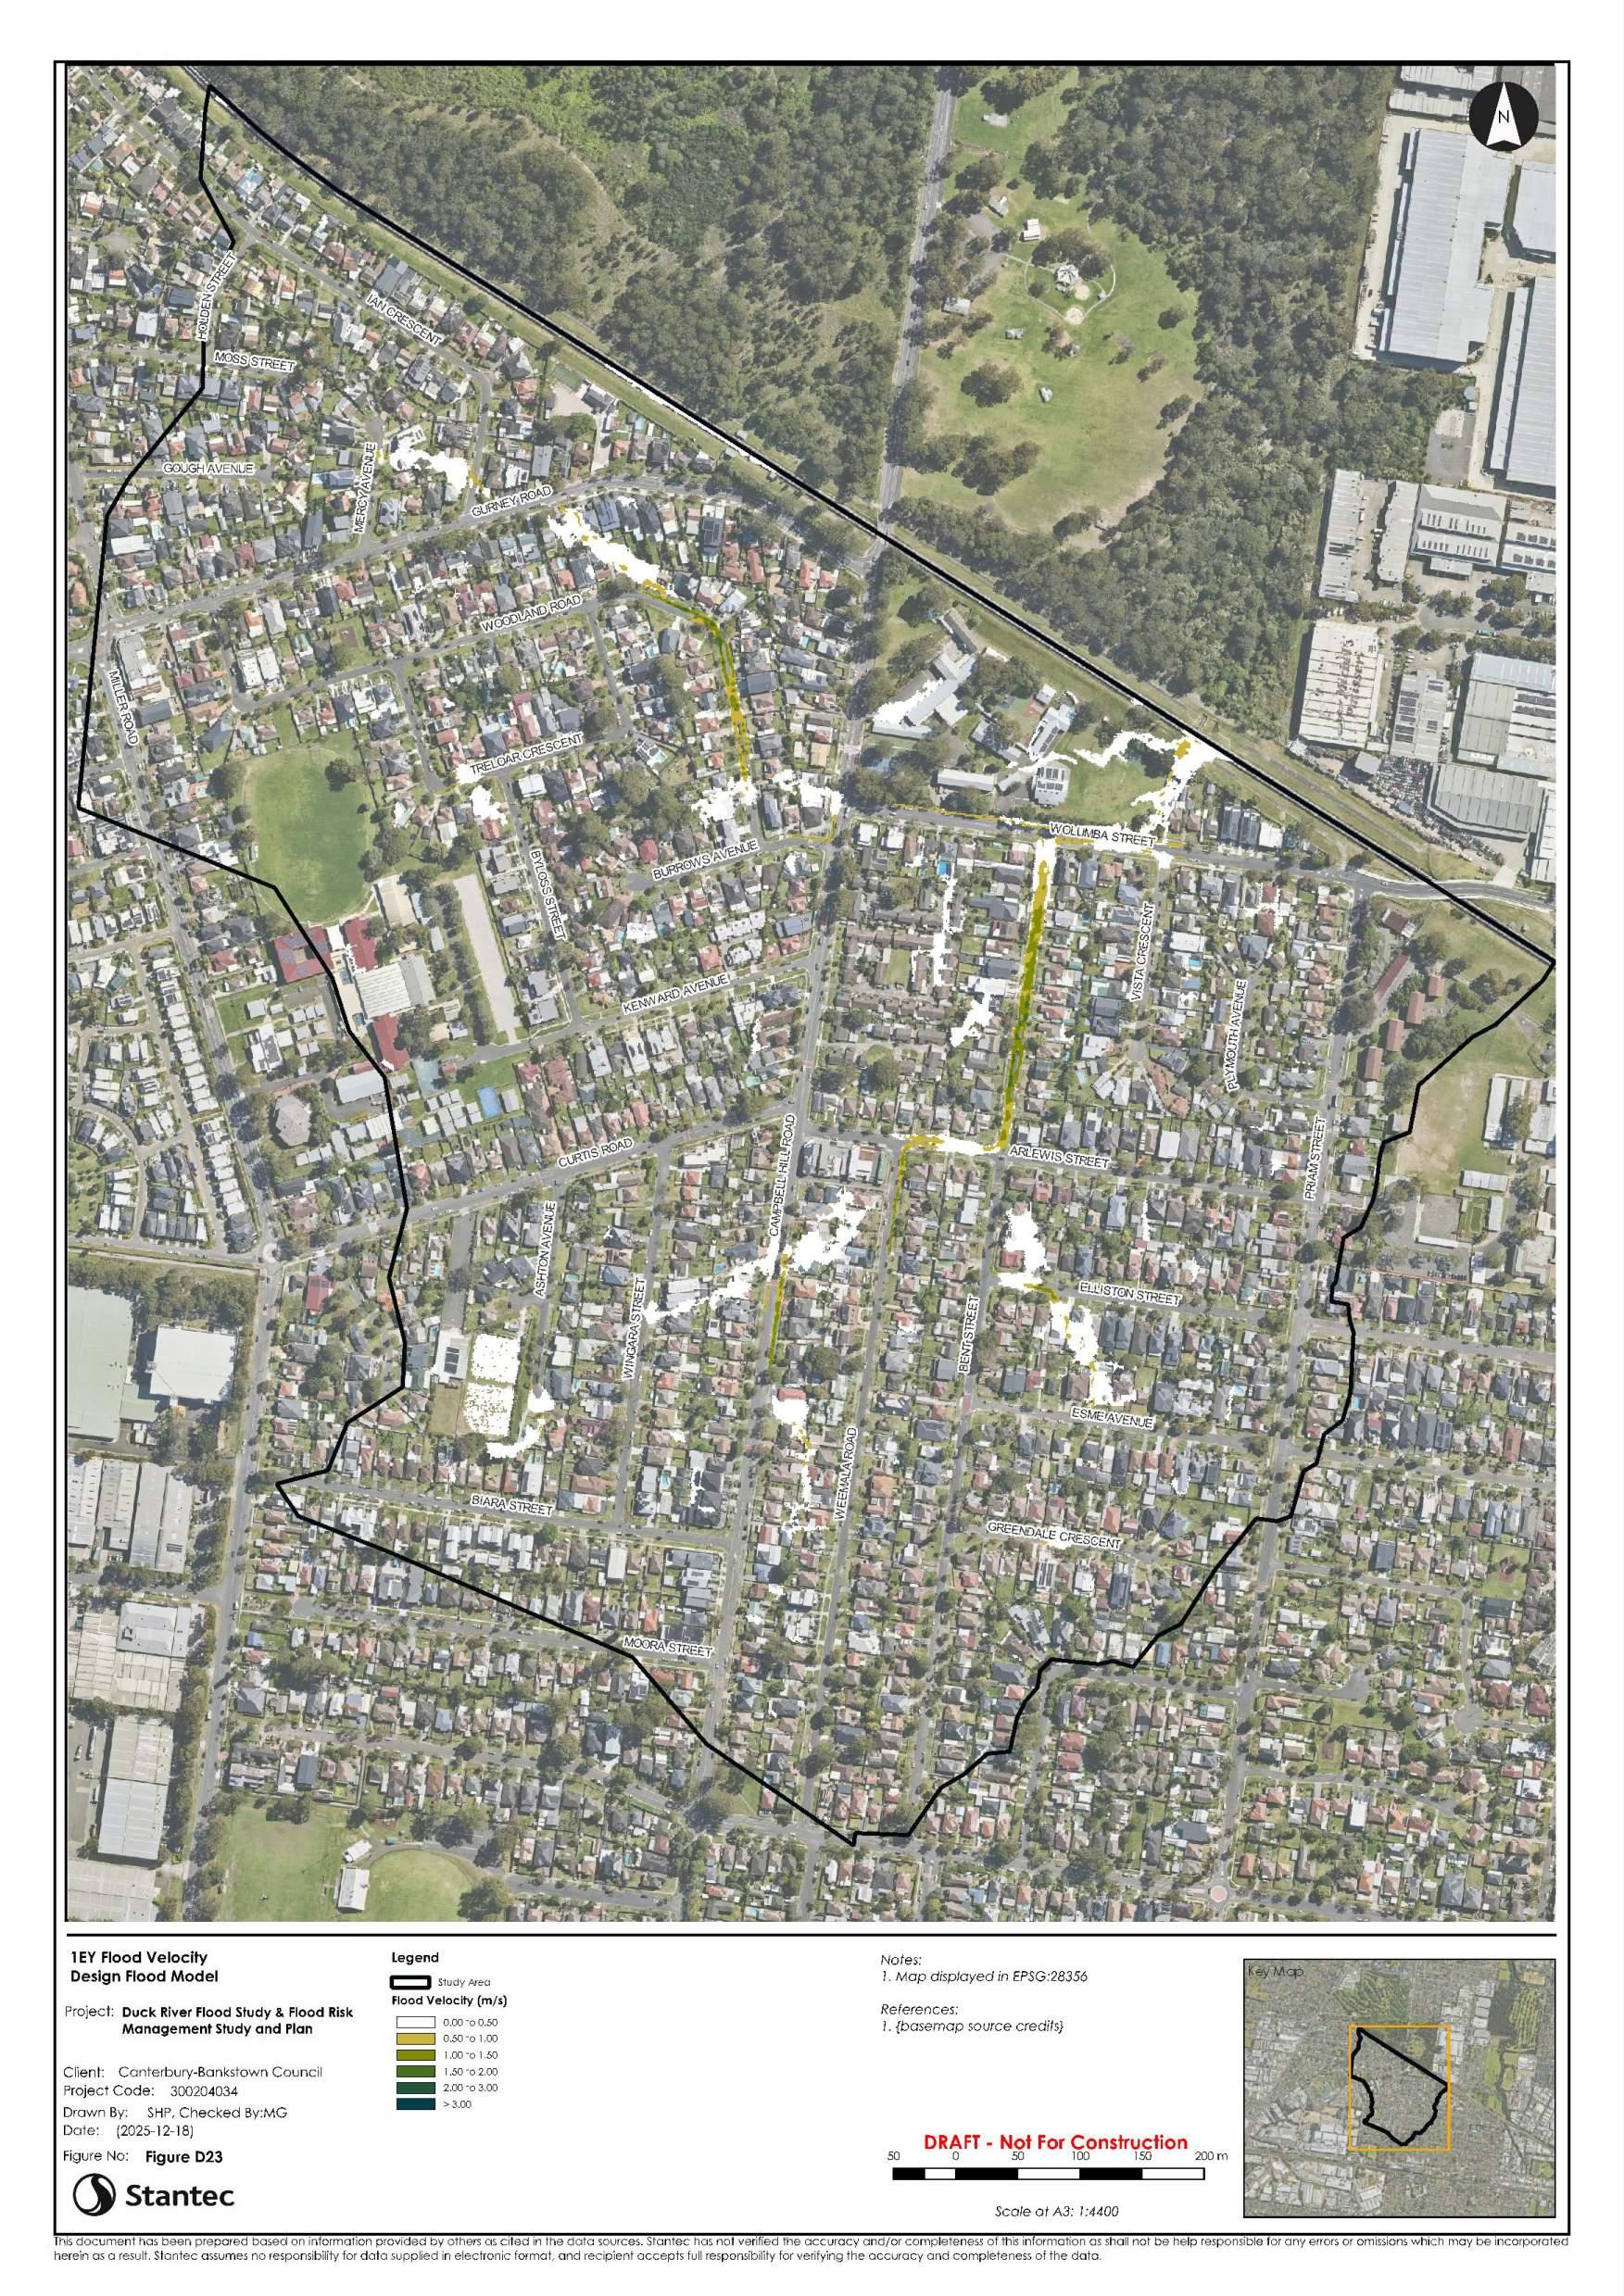
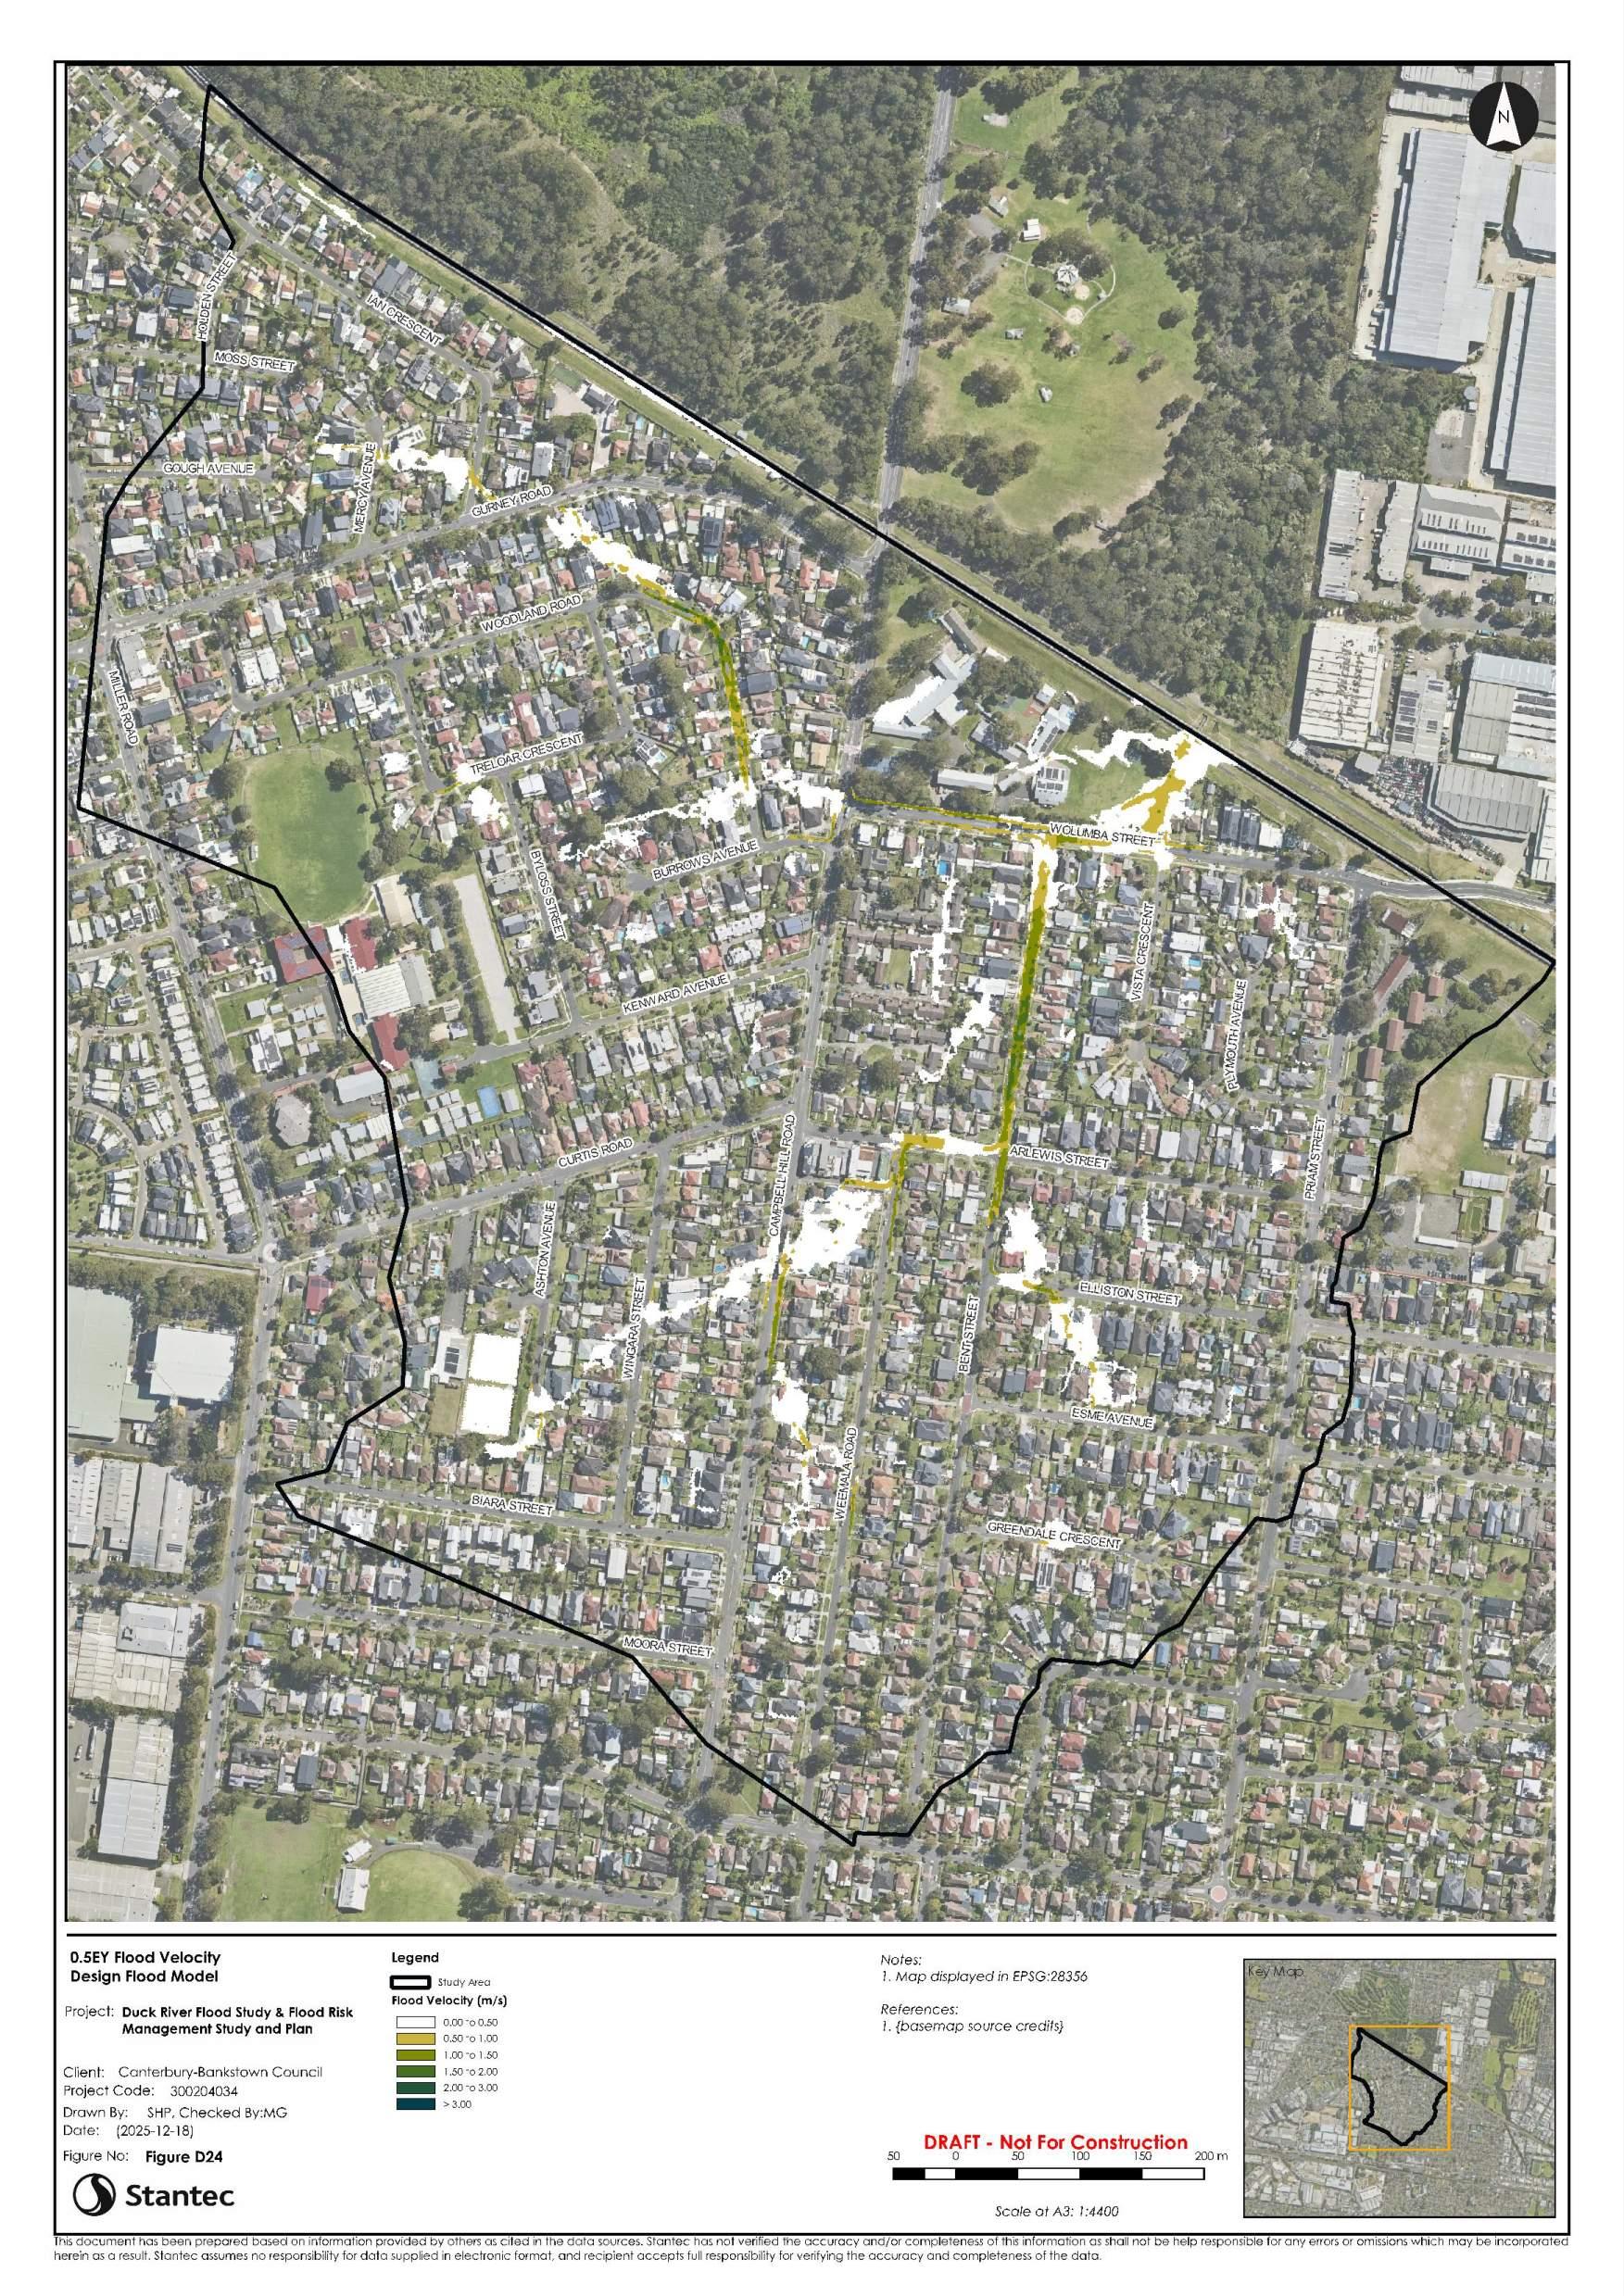
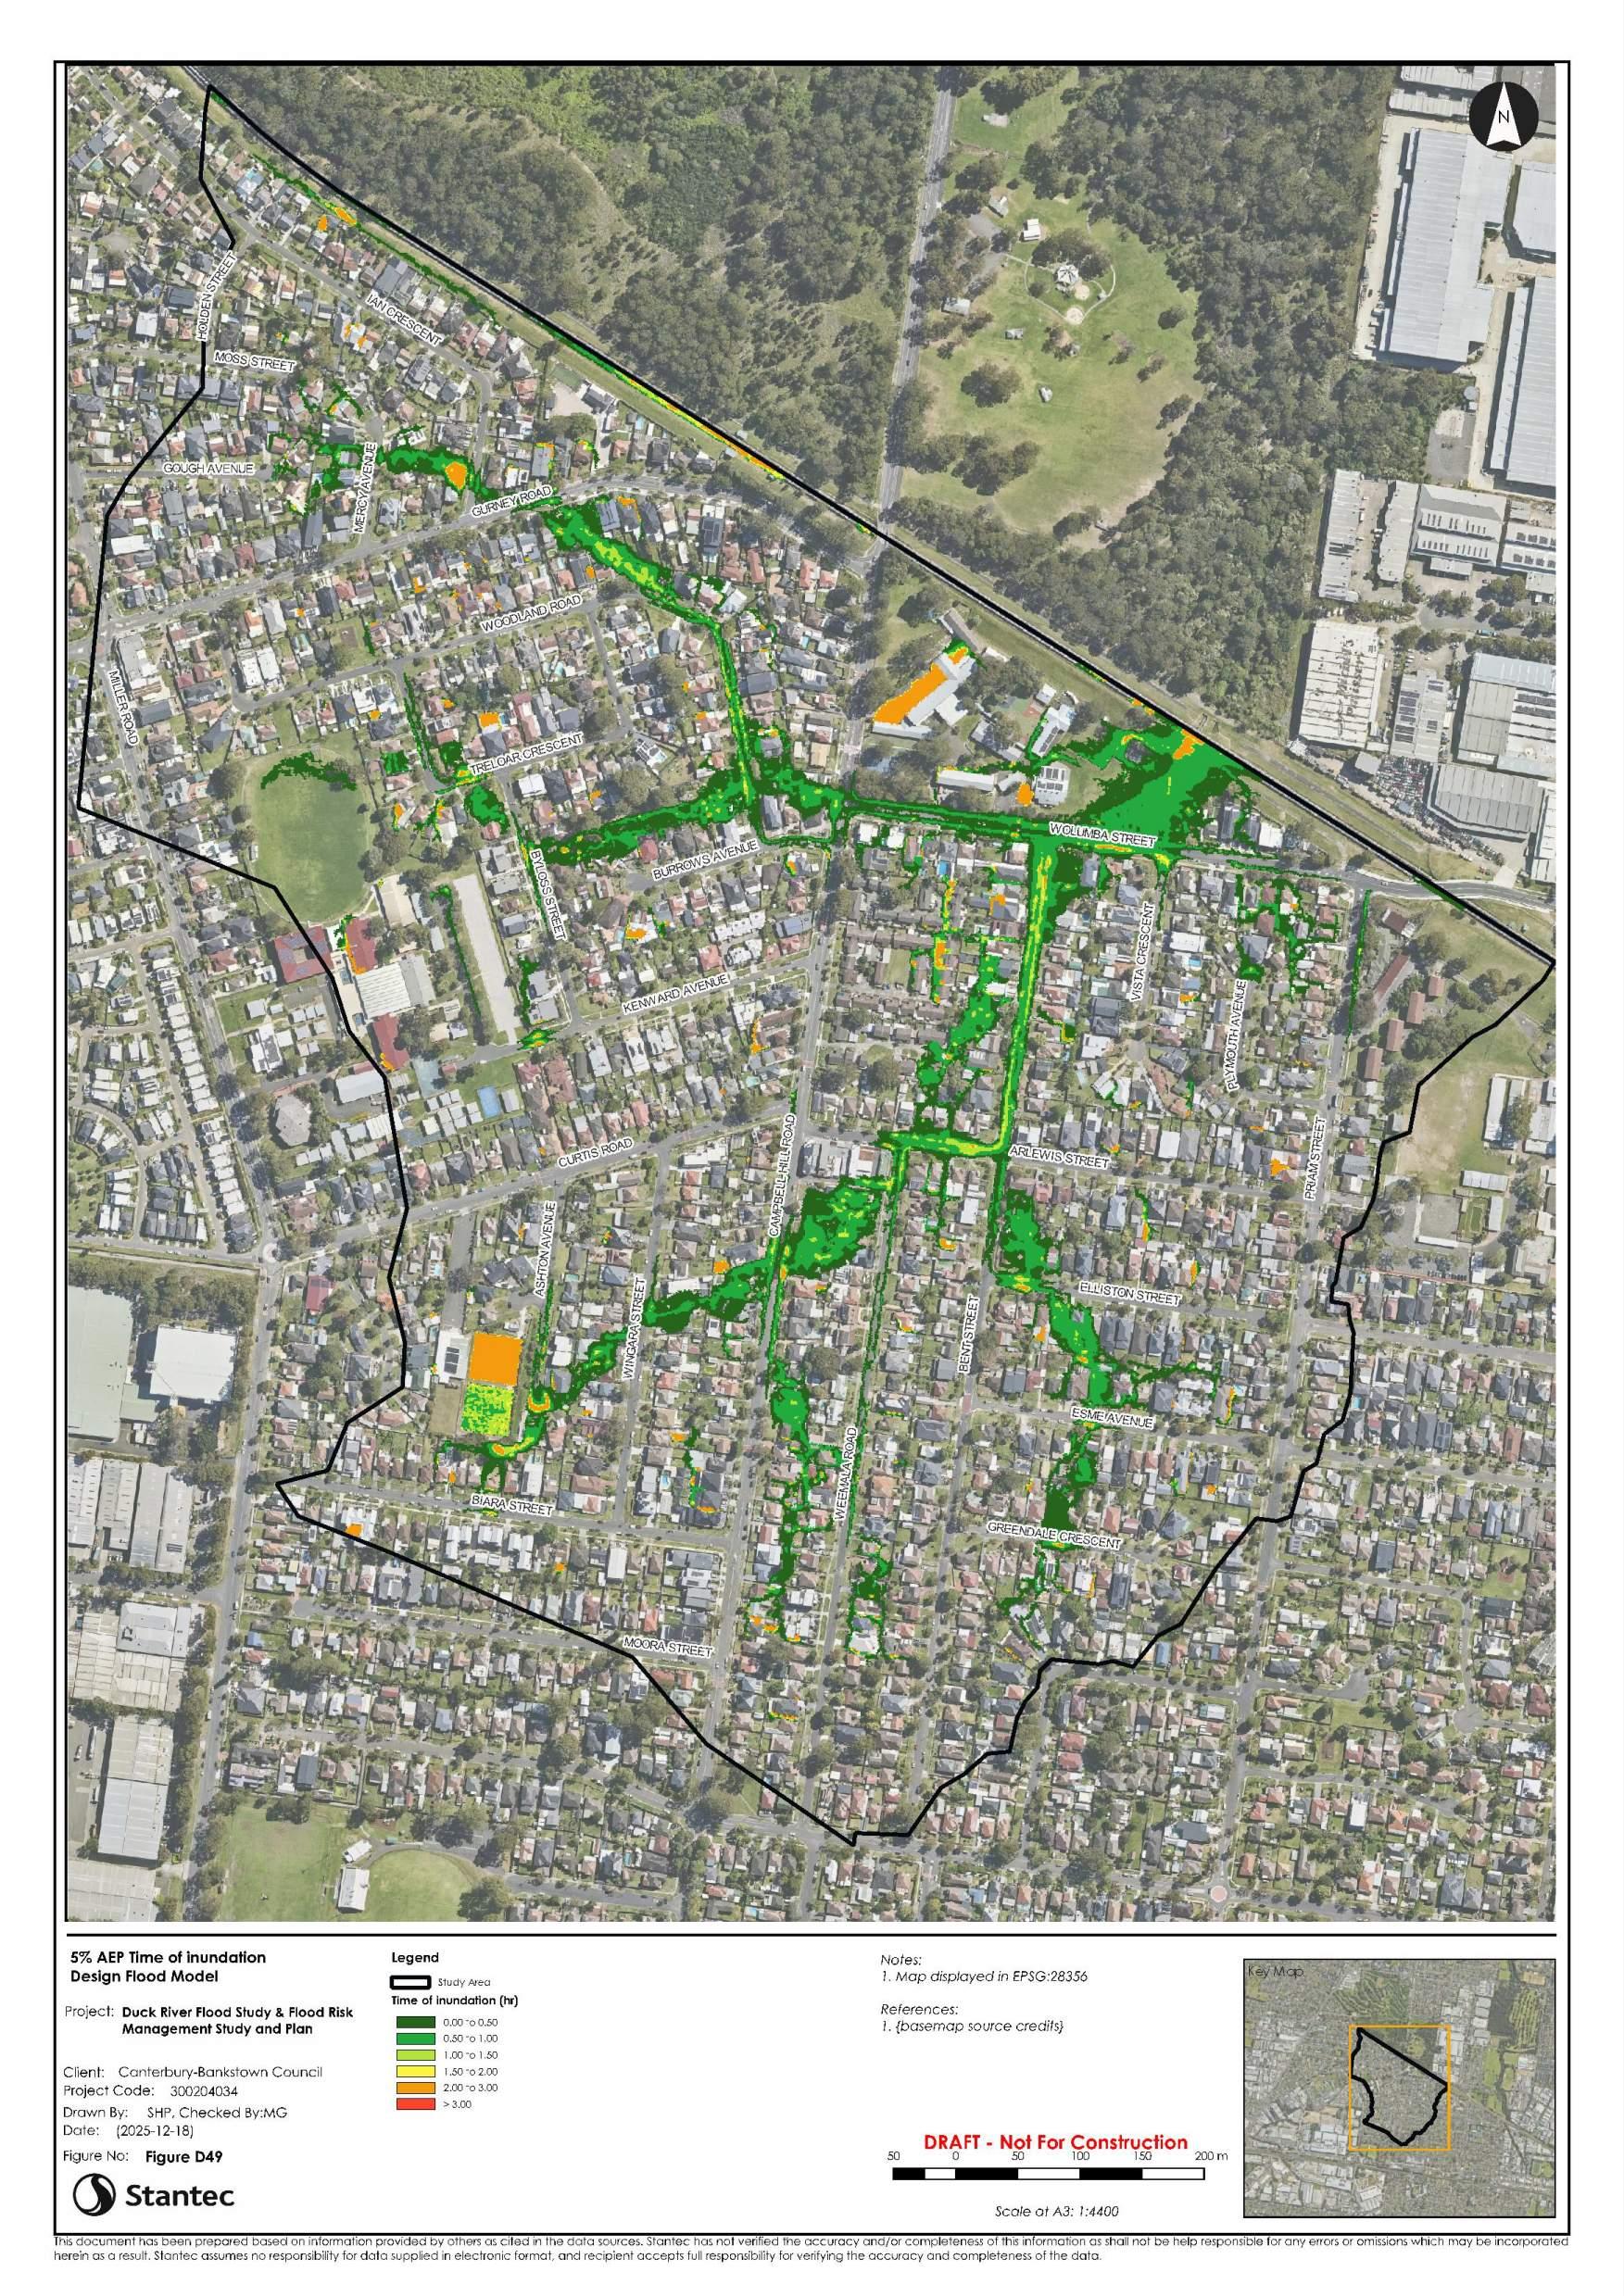
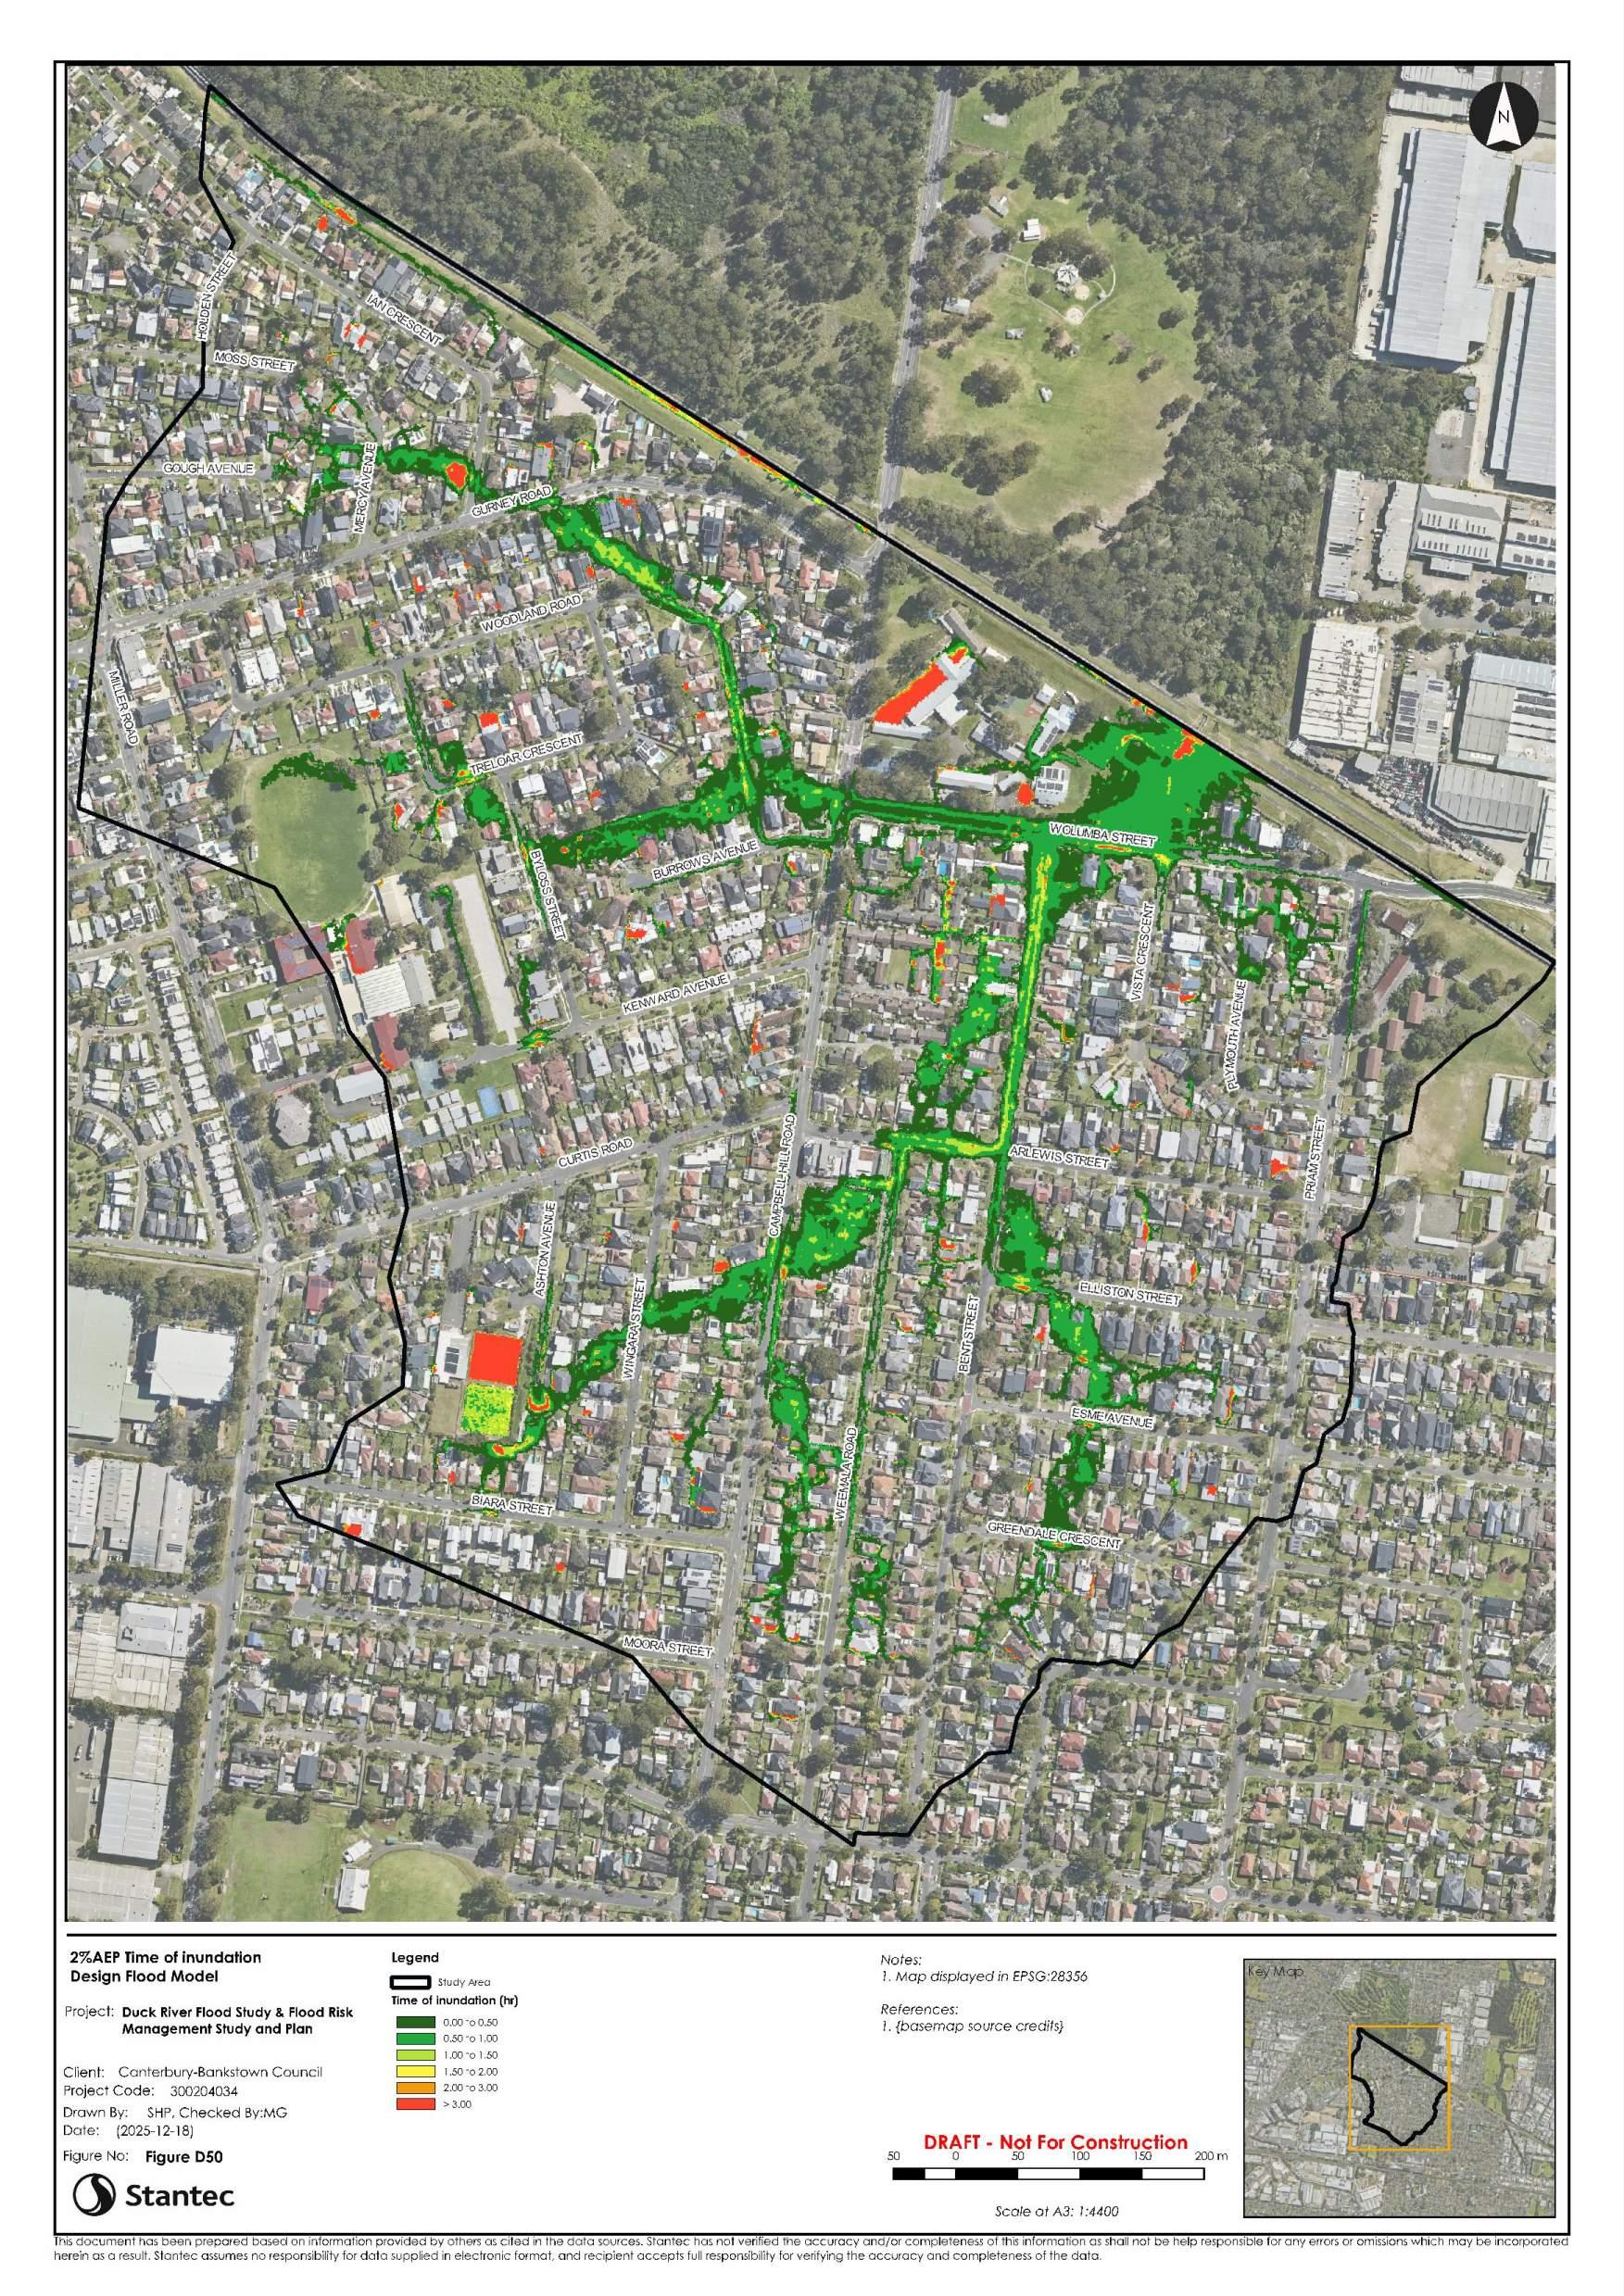
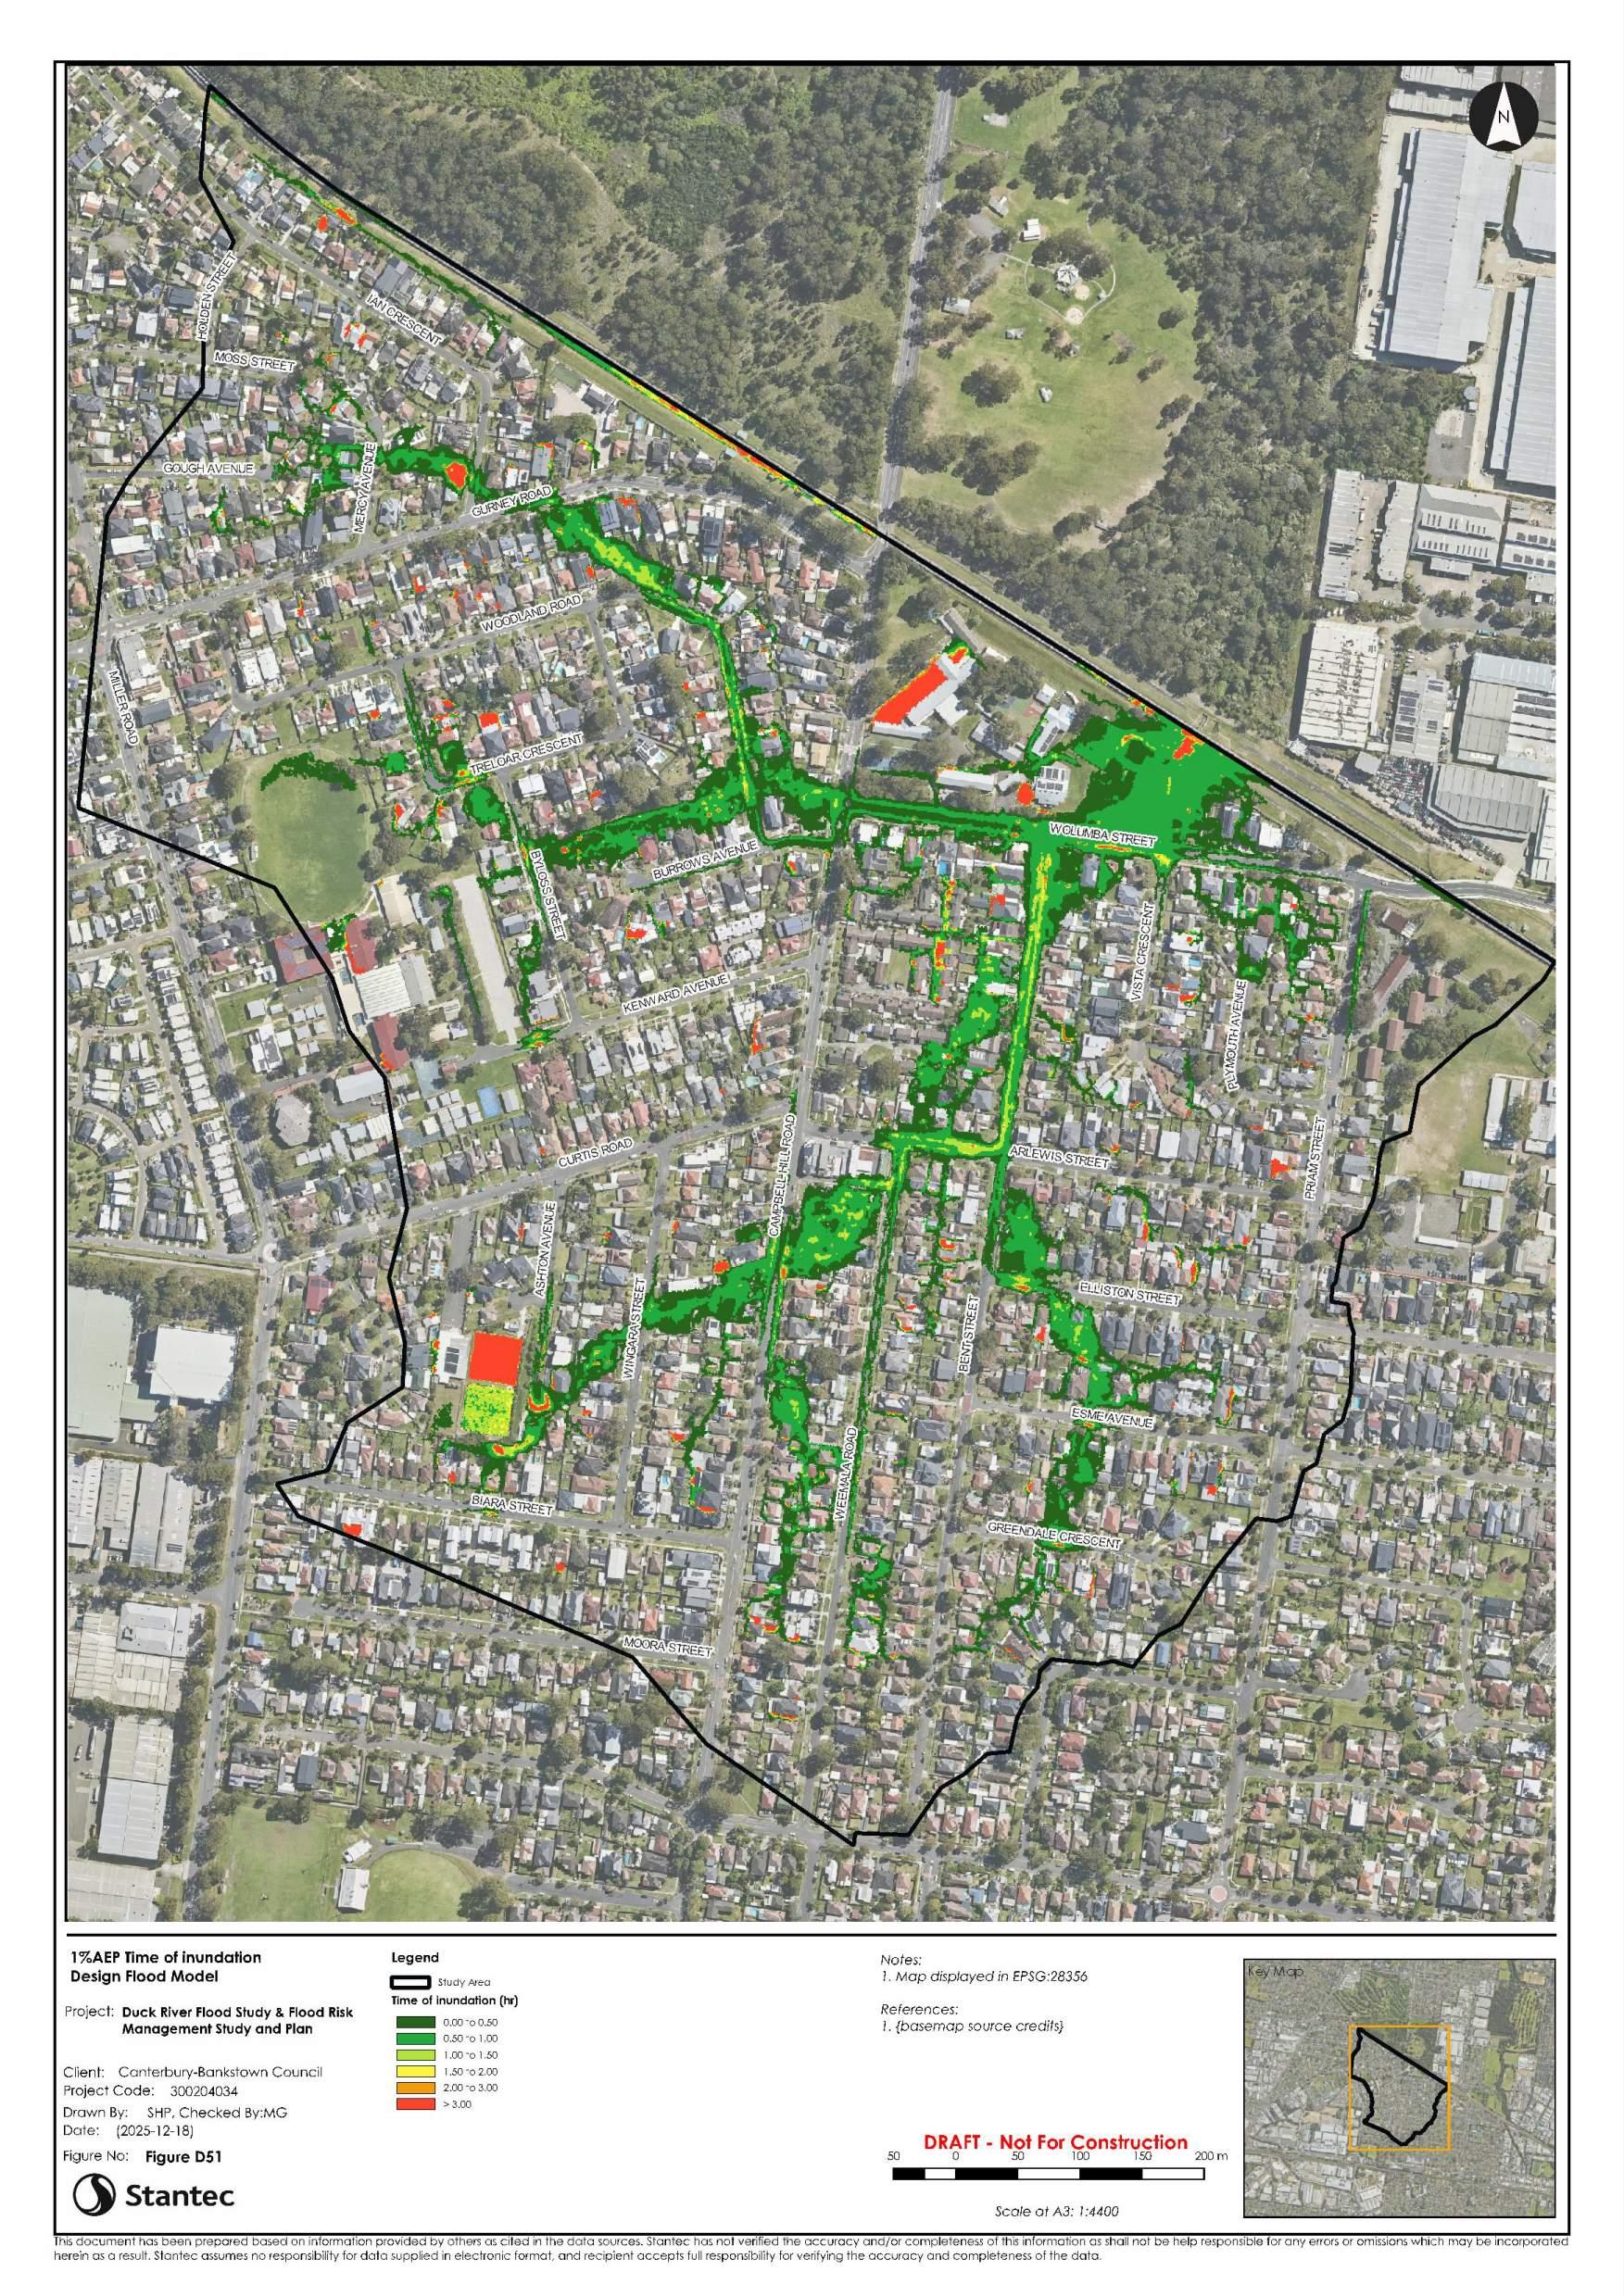
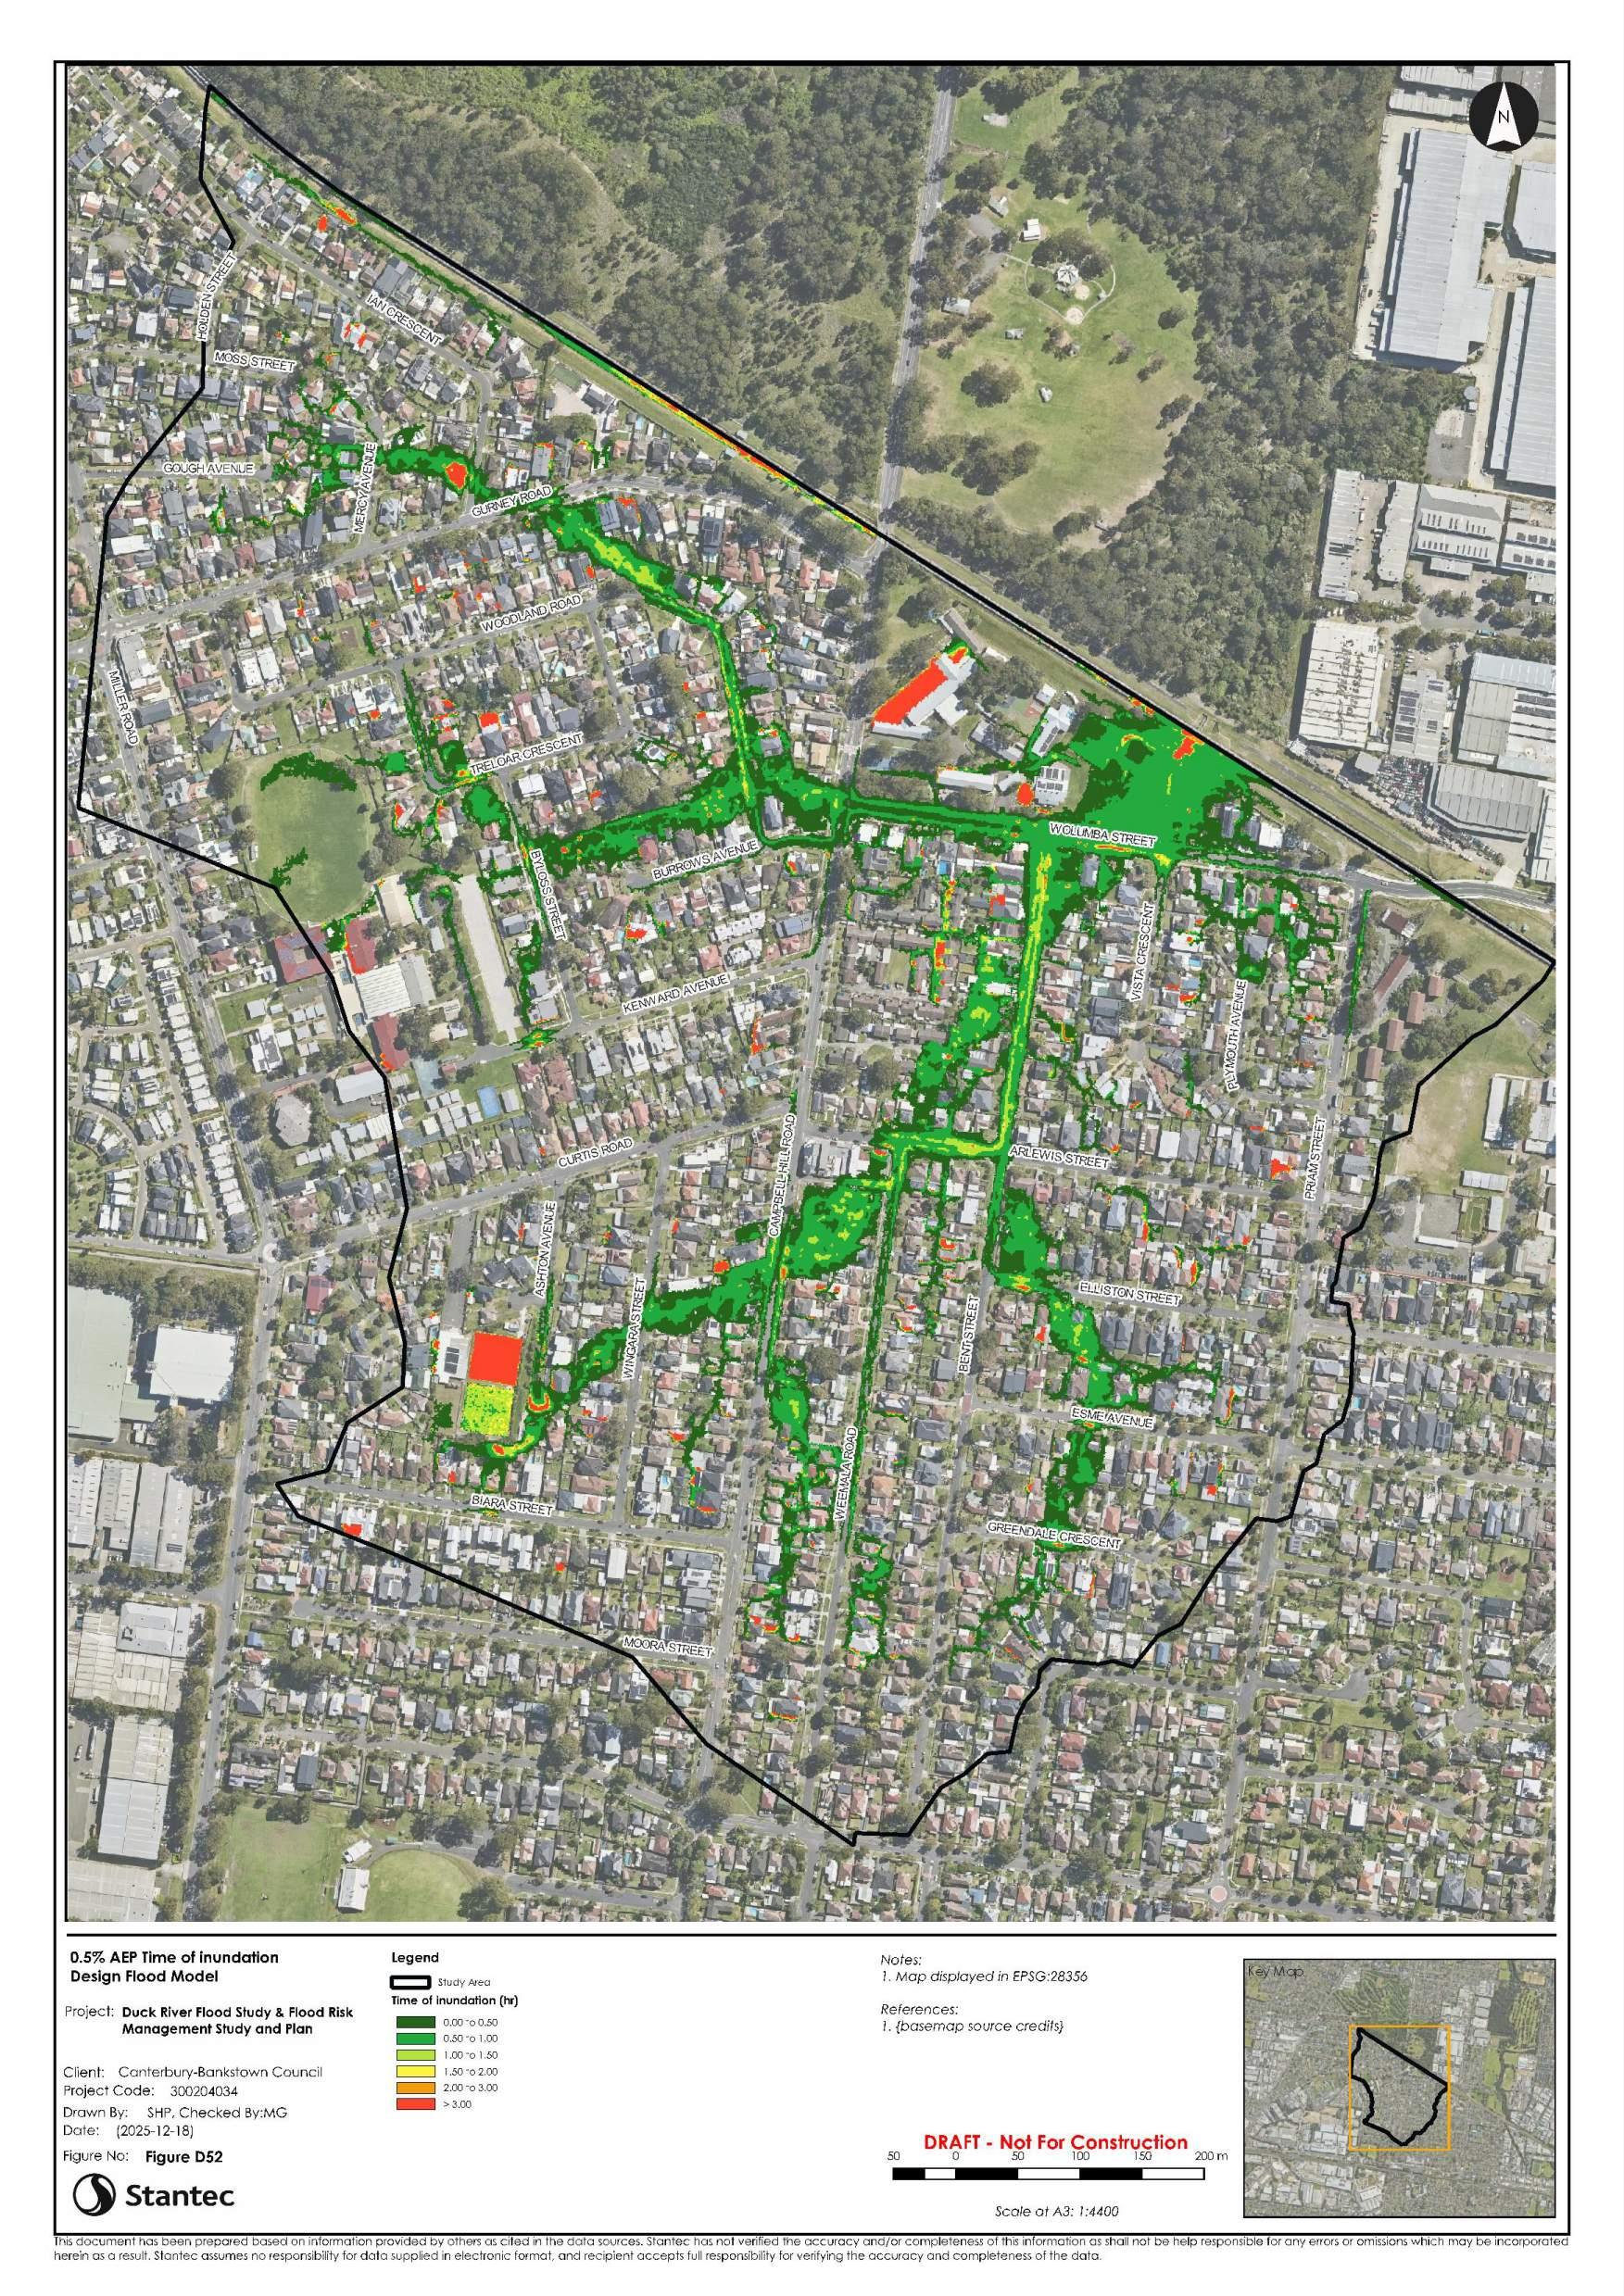
Flood model results have been post-processed using a filtering criteria consistent with CBC previous studies and trimmed to the study area boundary. Flood mapping has been prepared for all modelled events including the 1 EY, 0.5 EY, 0.2 EY, 10% AEP, 5% AEP, 2% AEP, 1% AEP, 0.5% AEP, 0.2% AEP, 0.05% AEP and PMF.
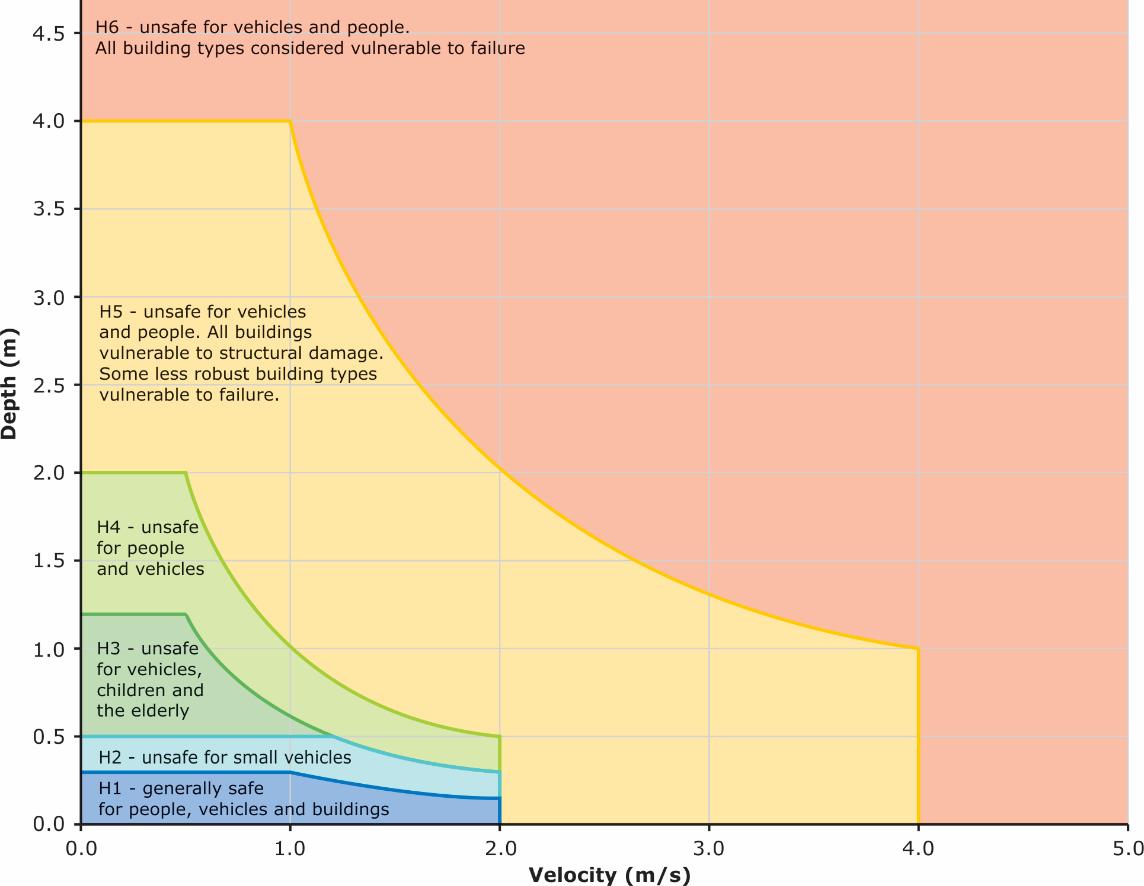
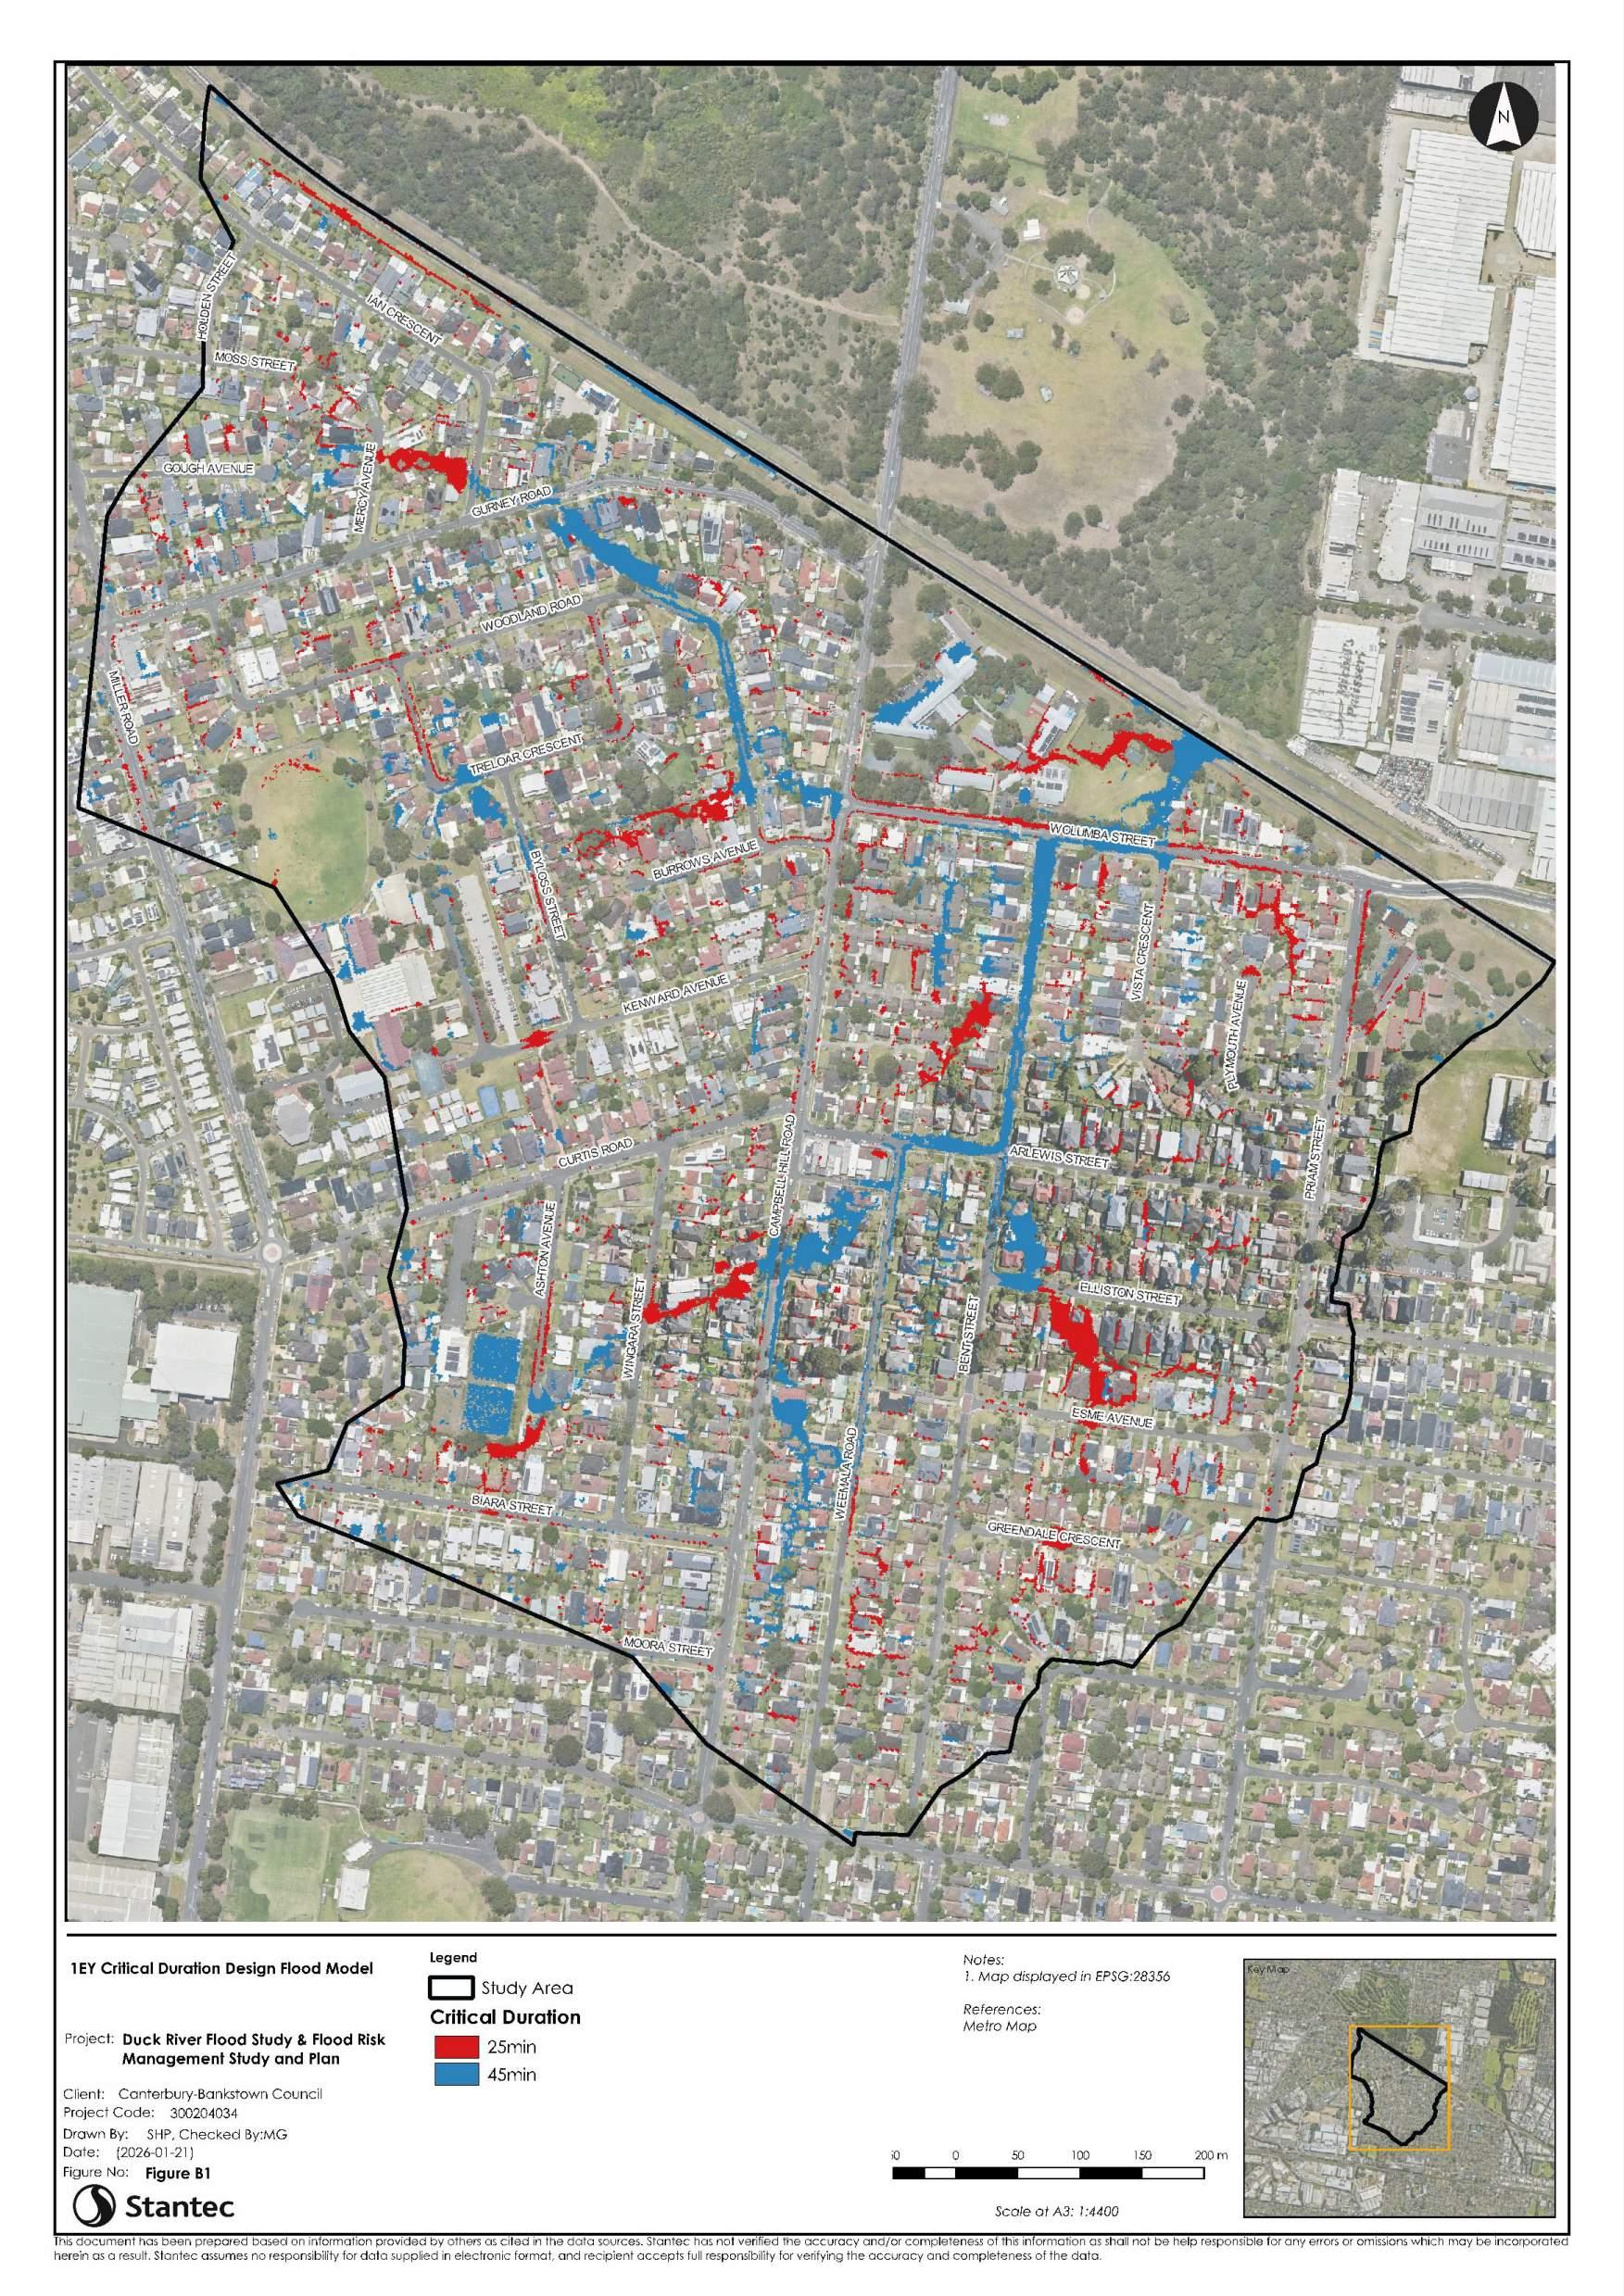
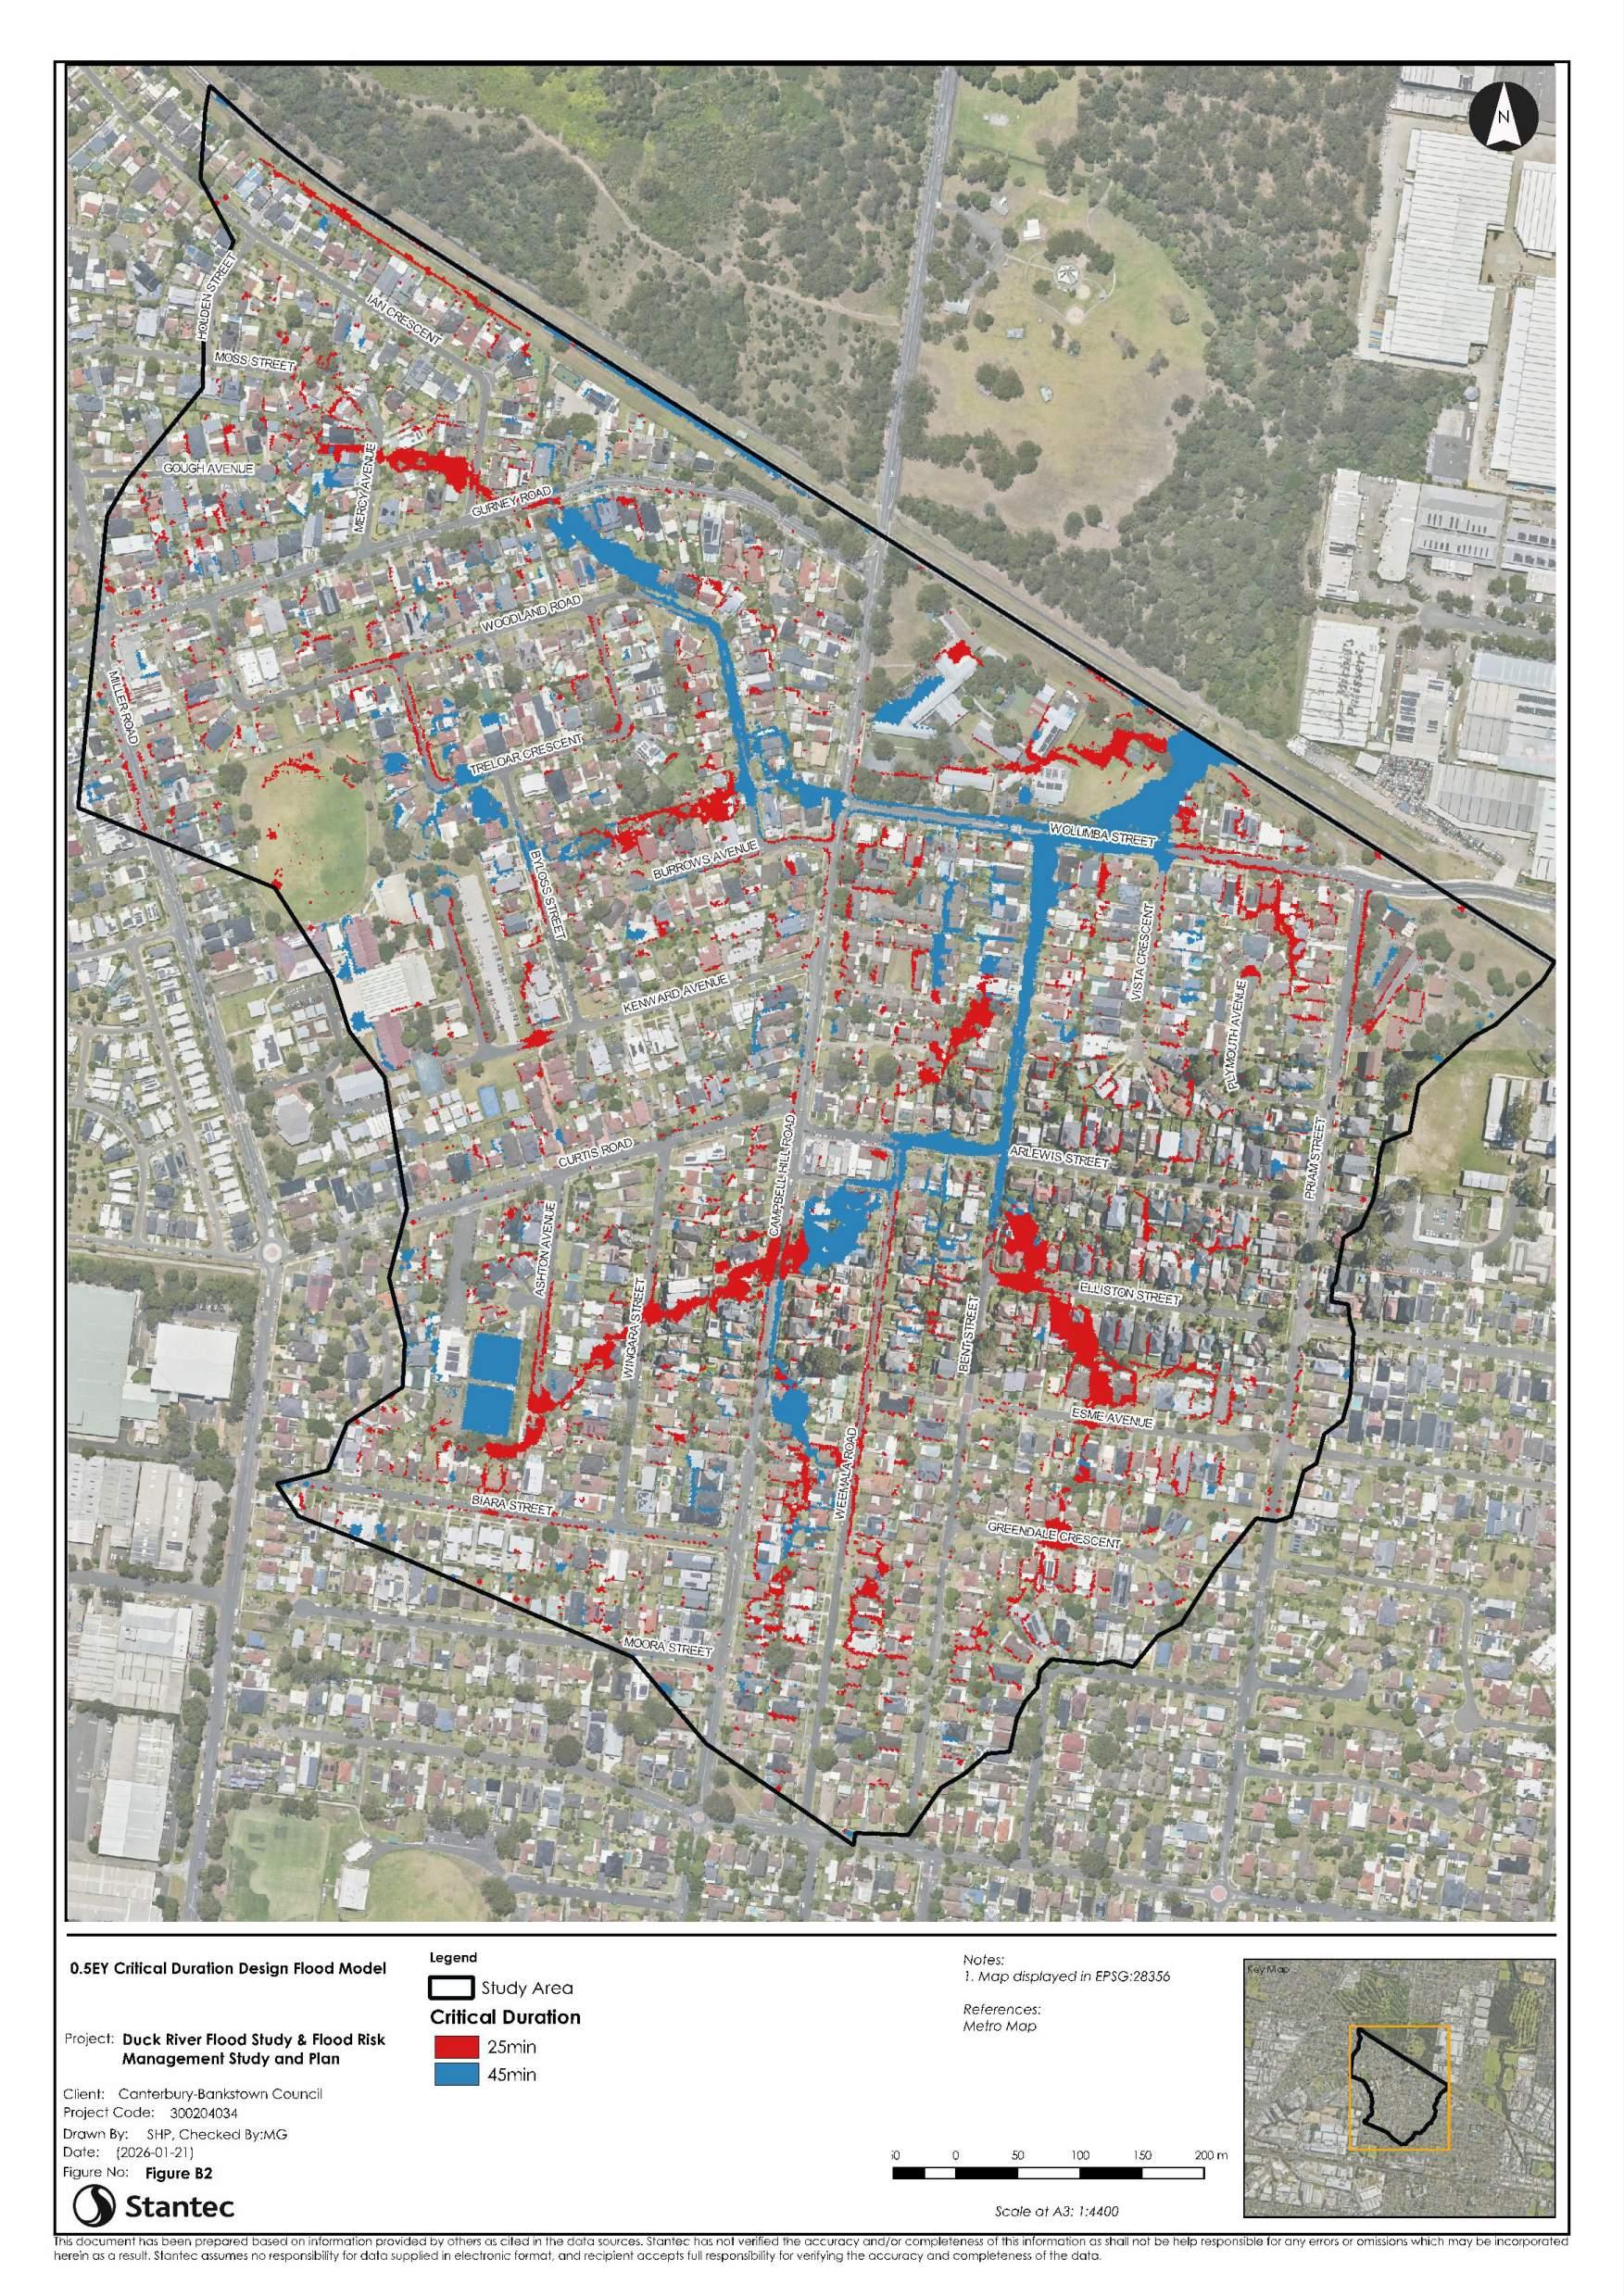
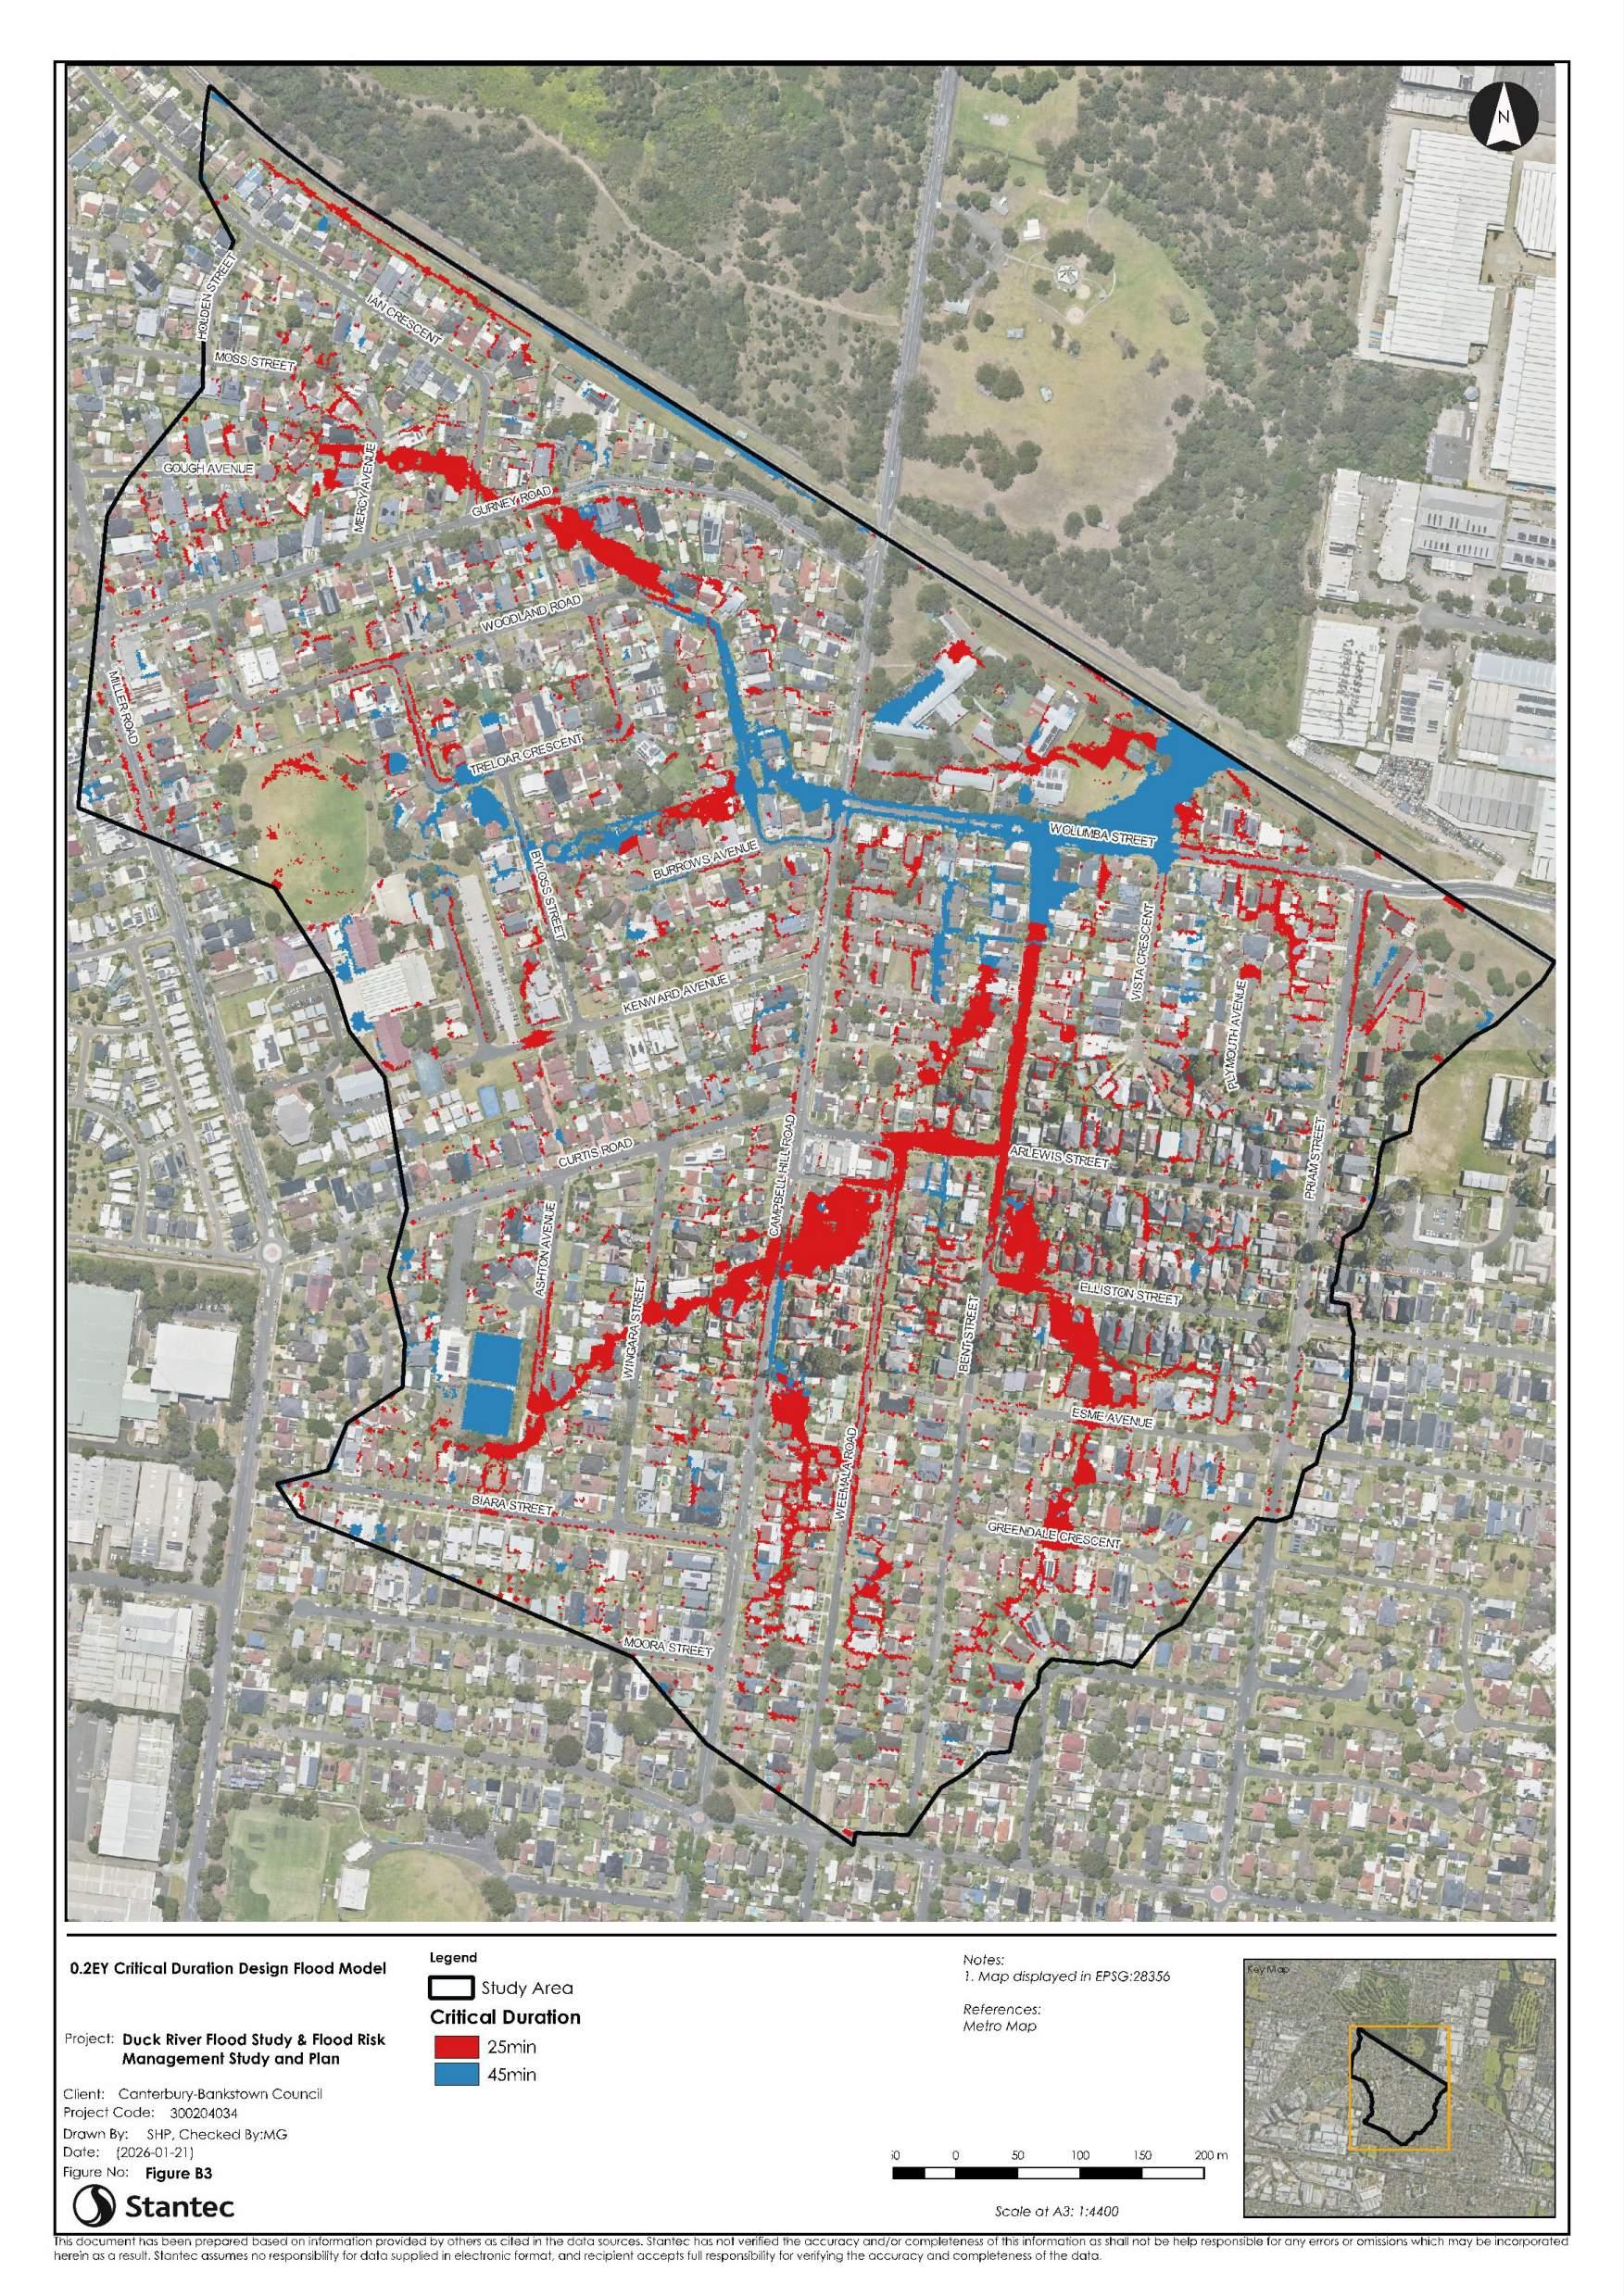
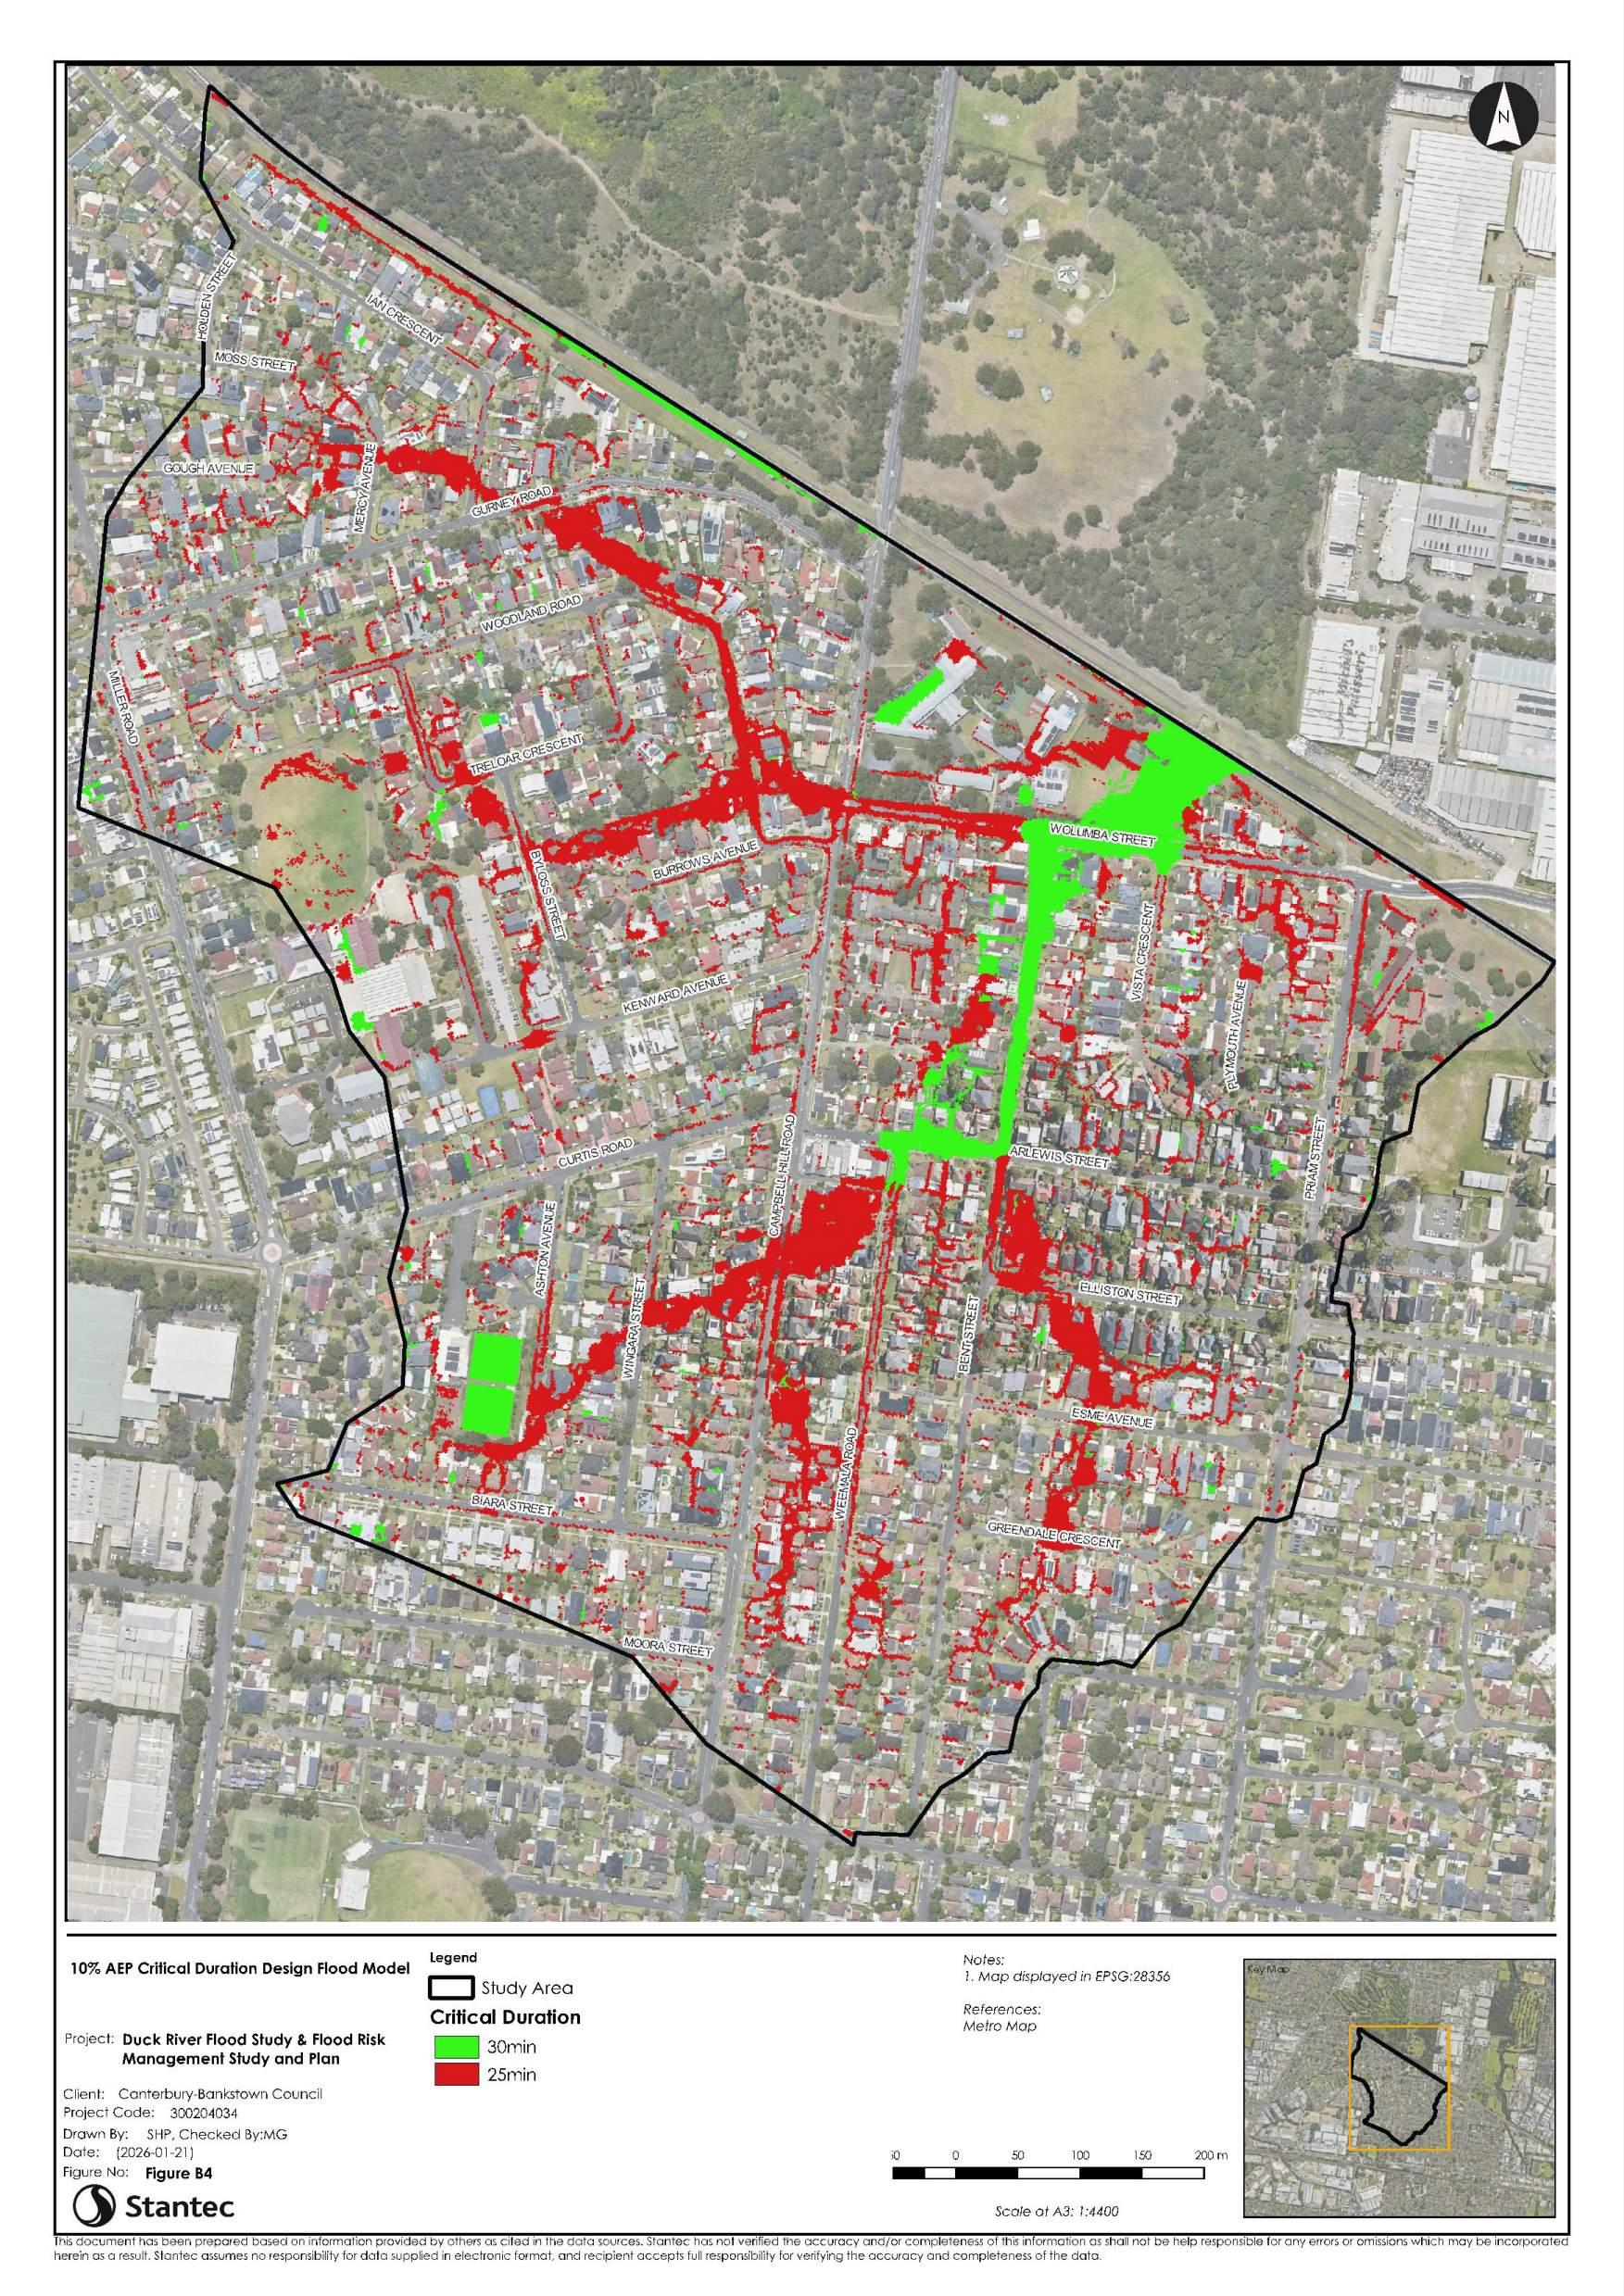
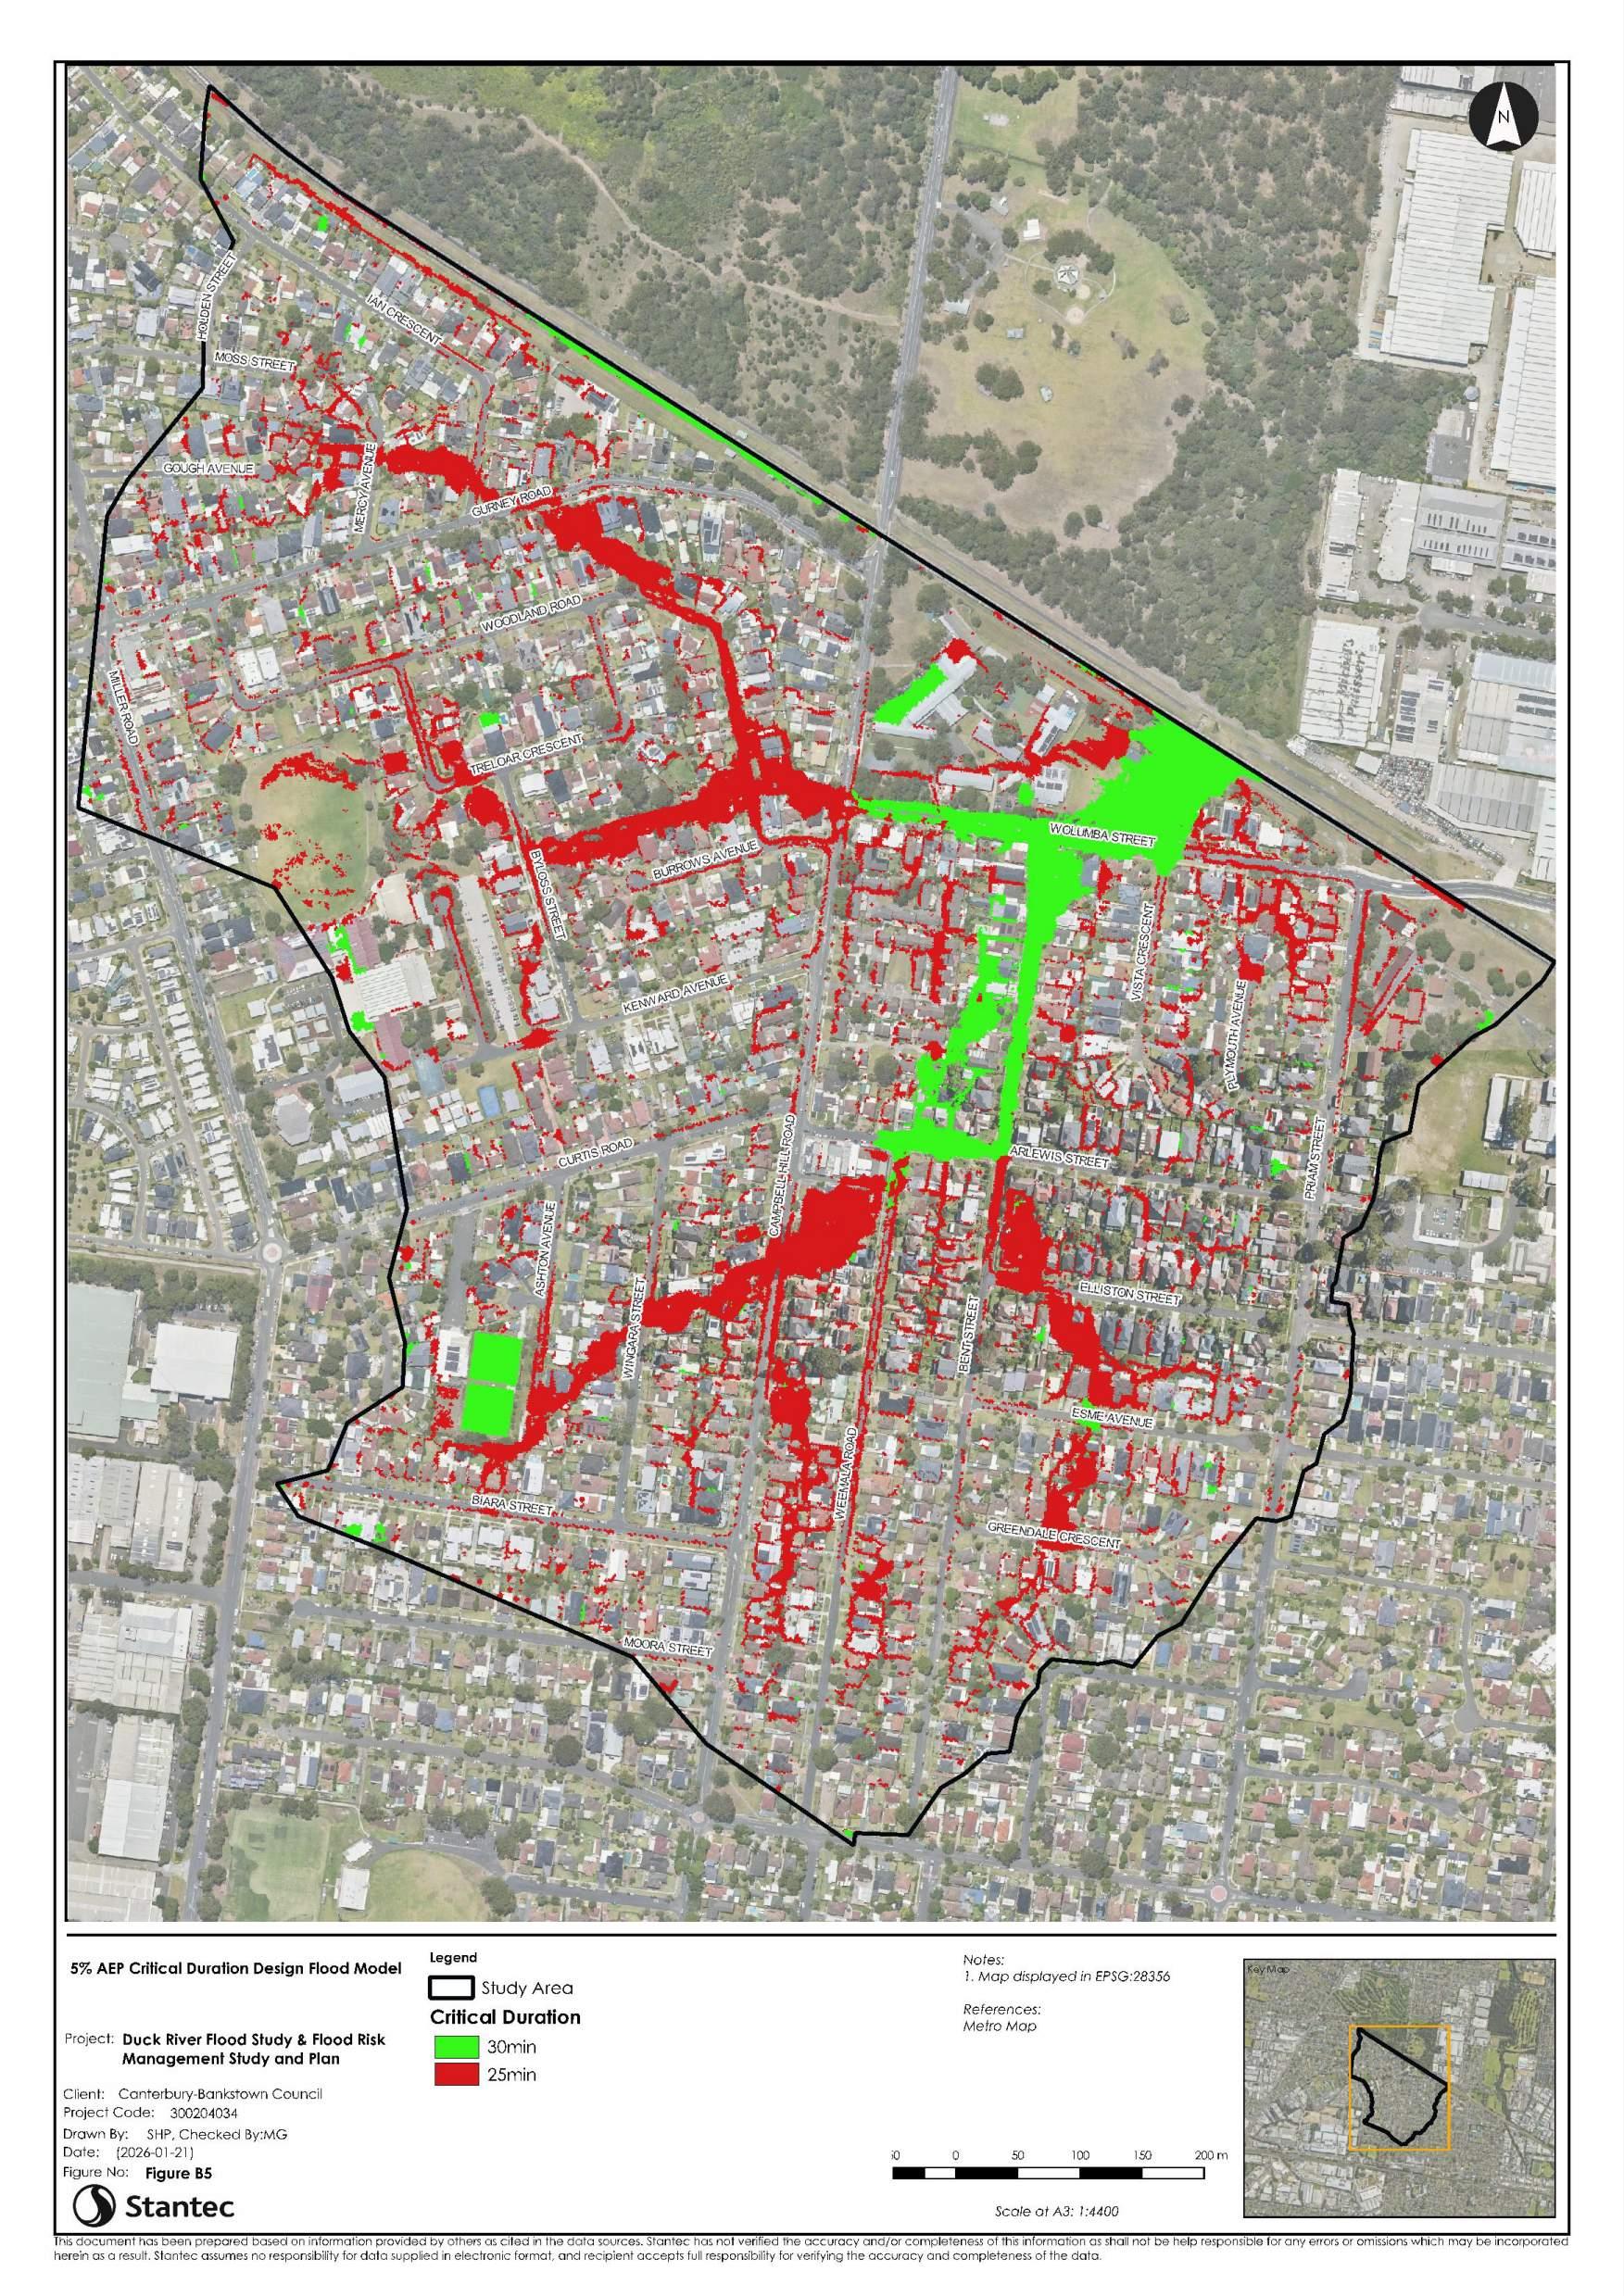
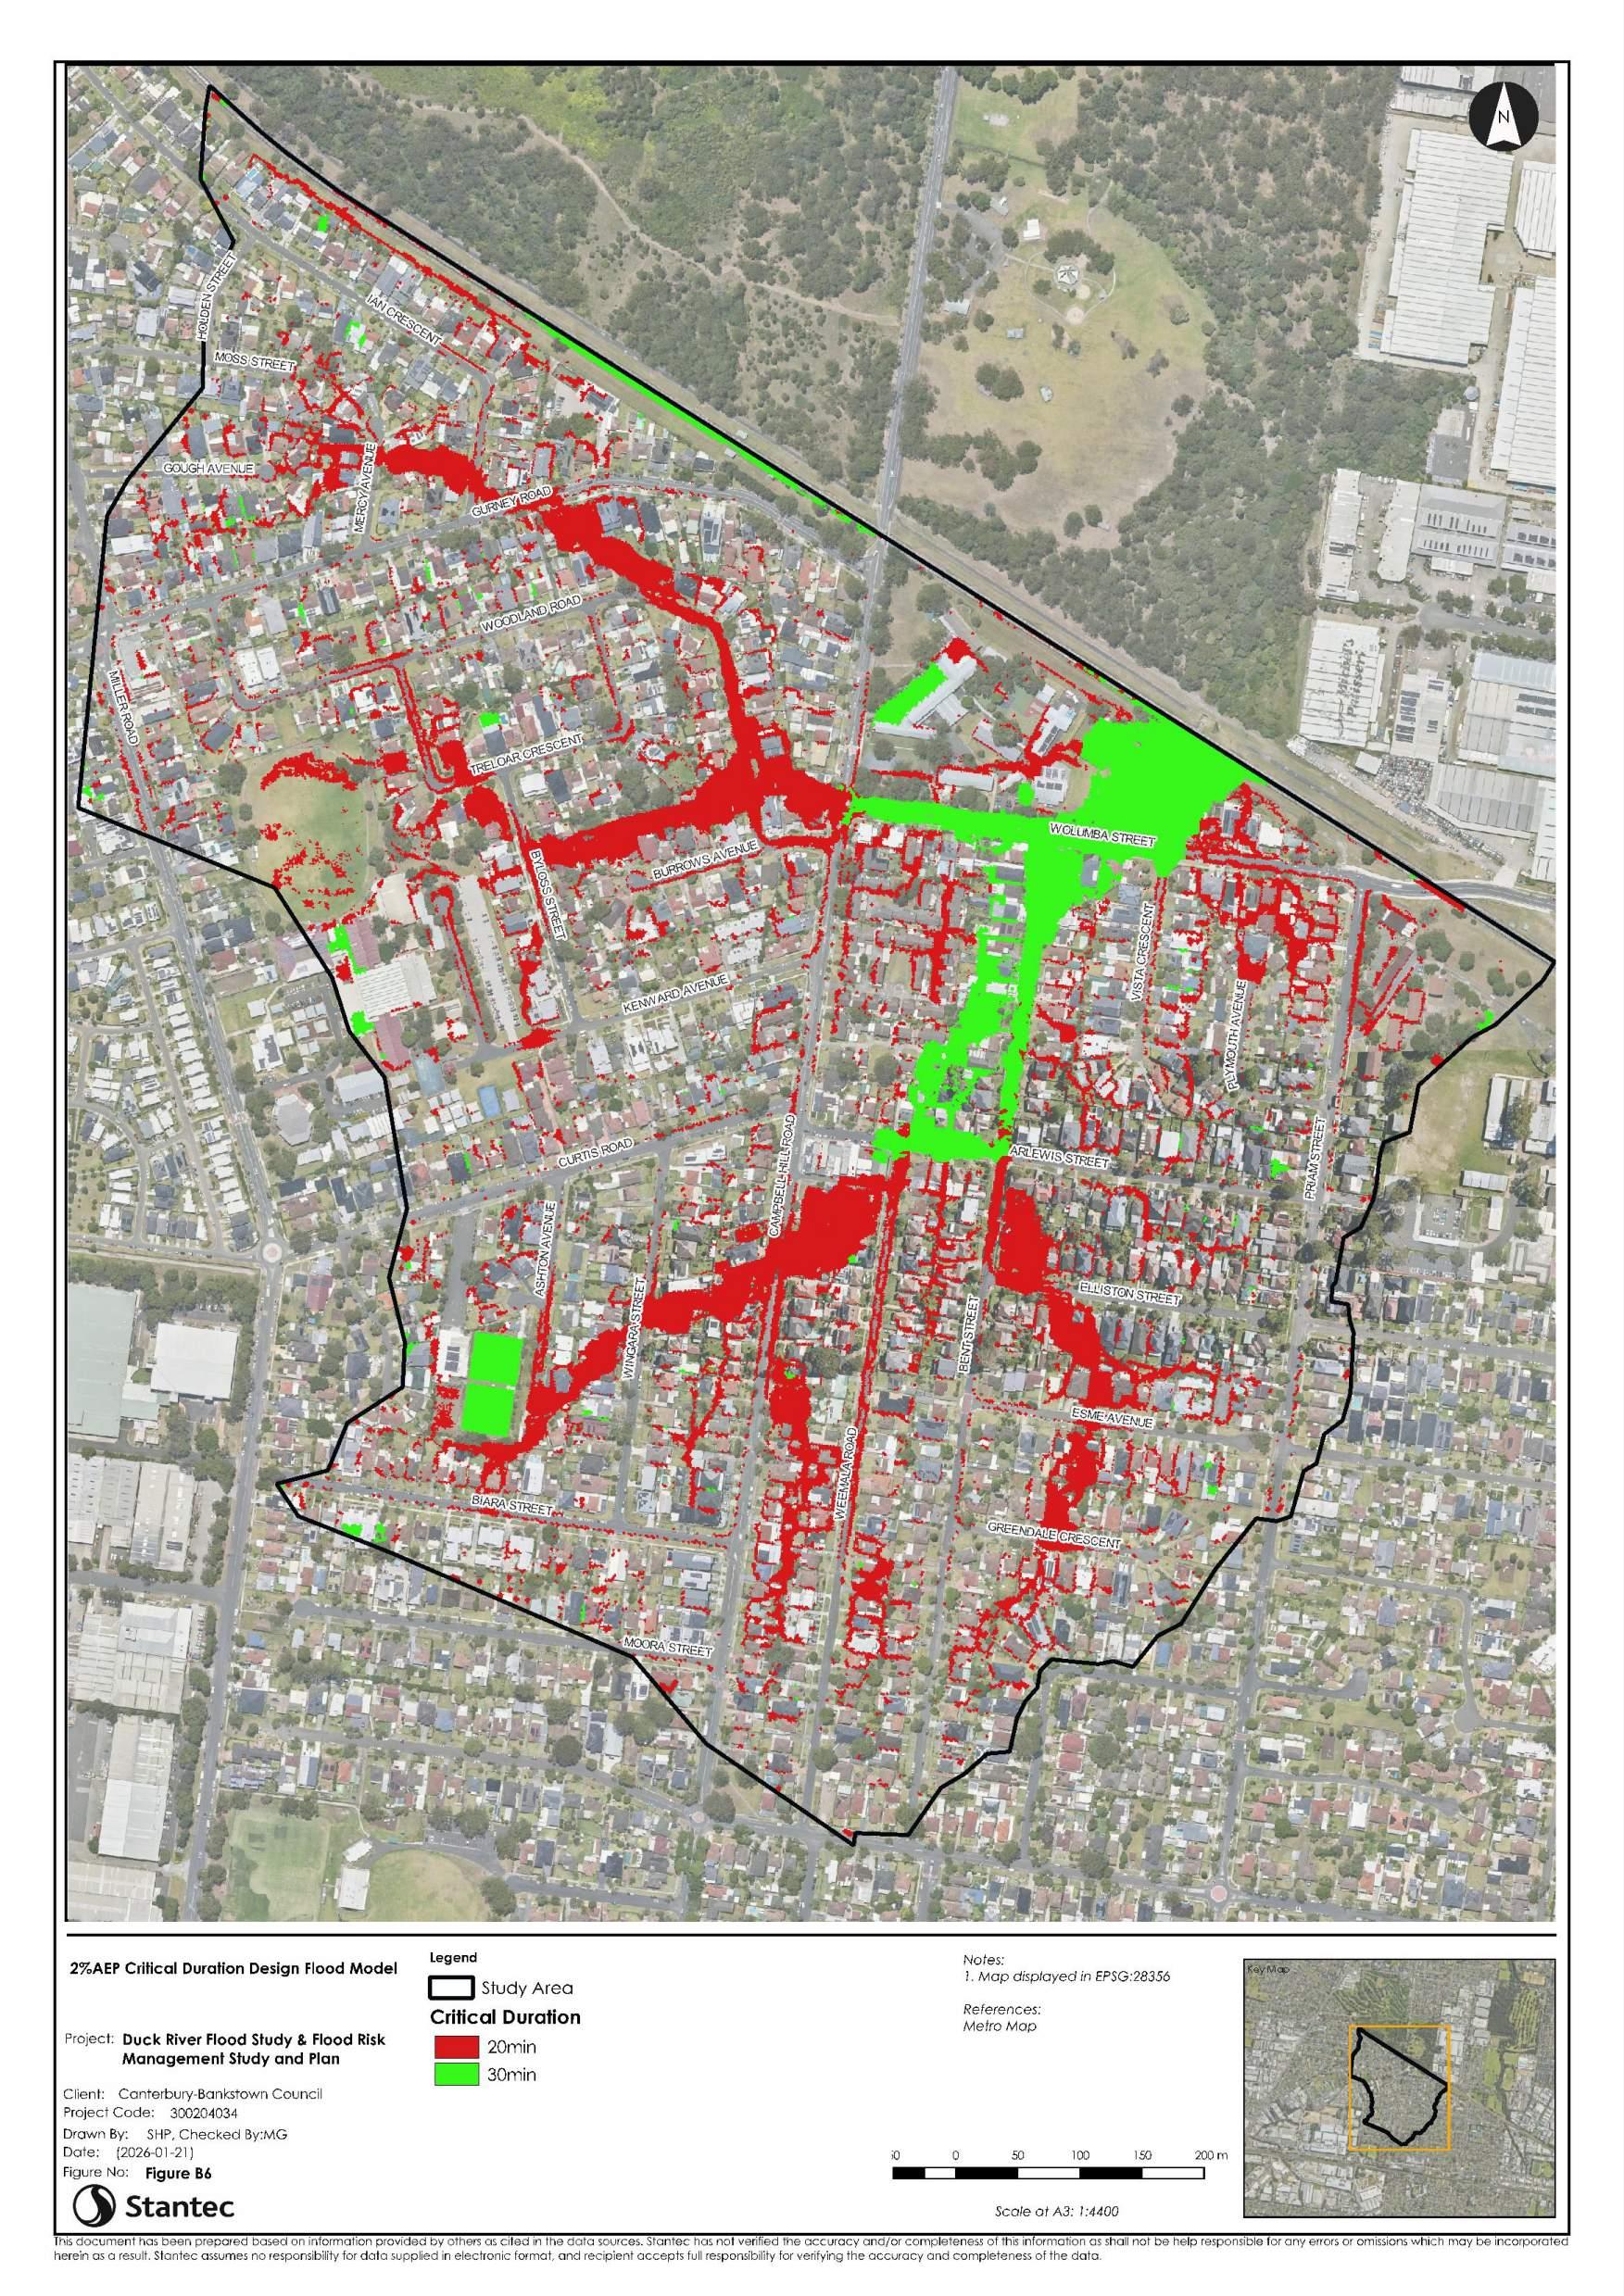
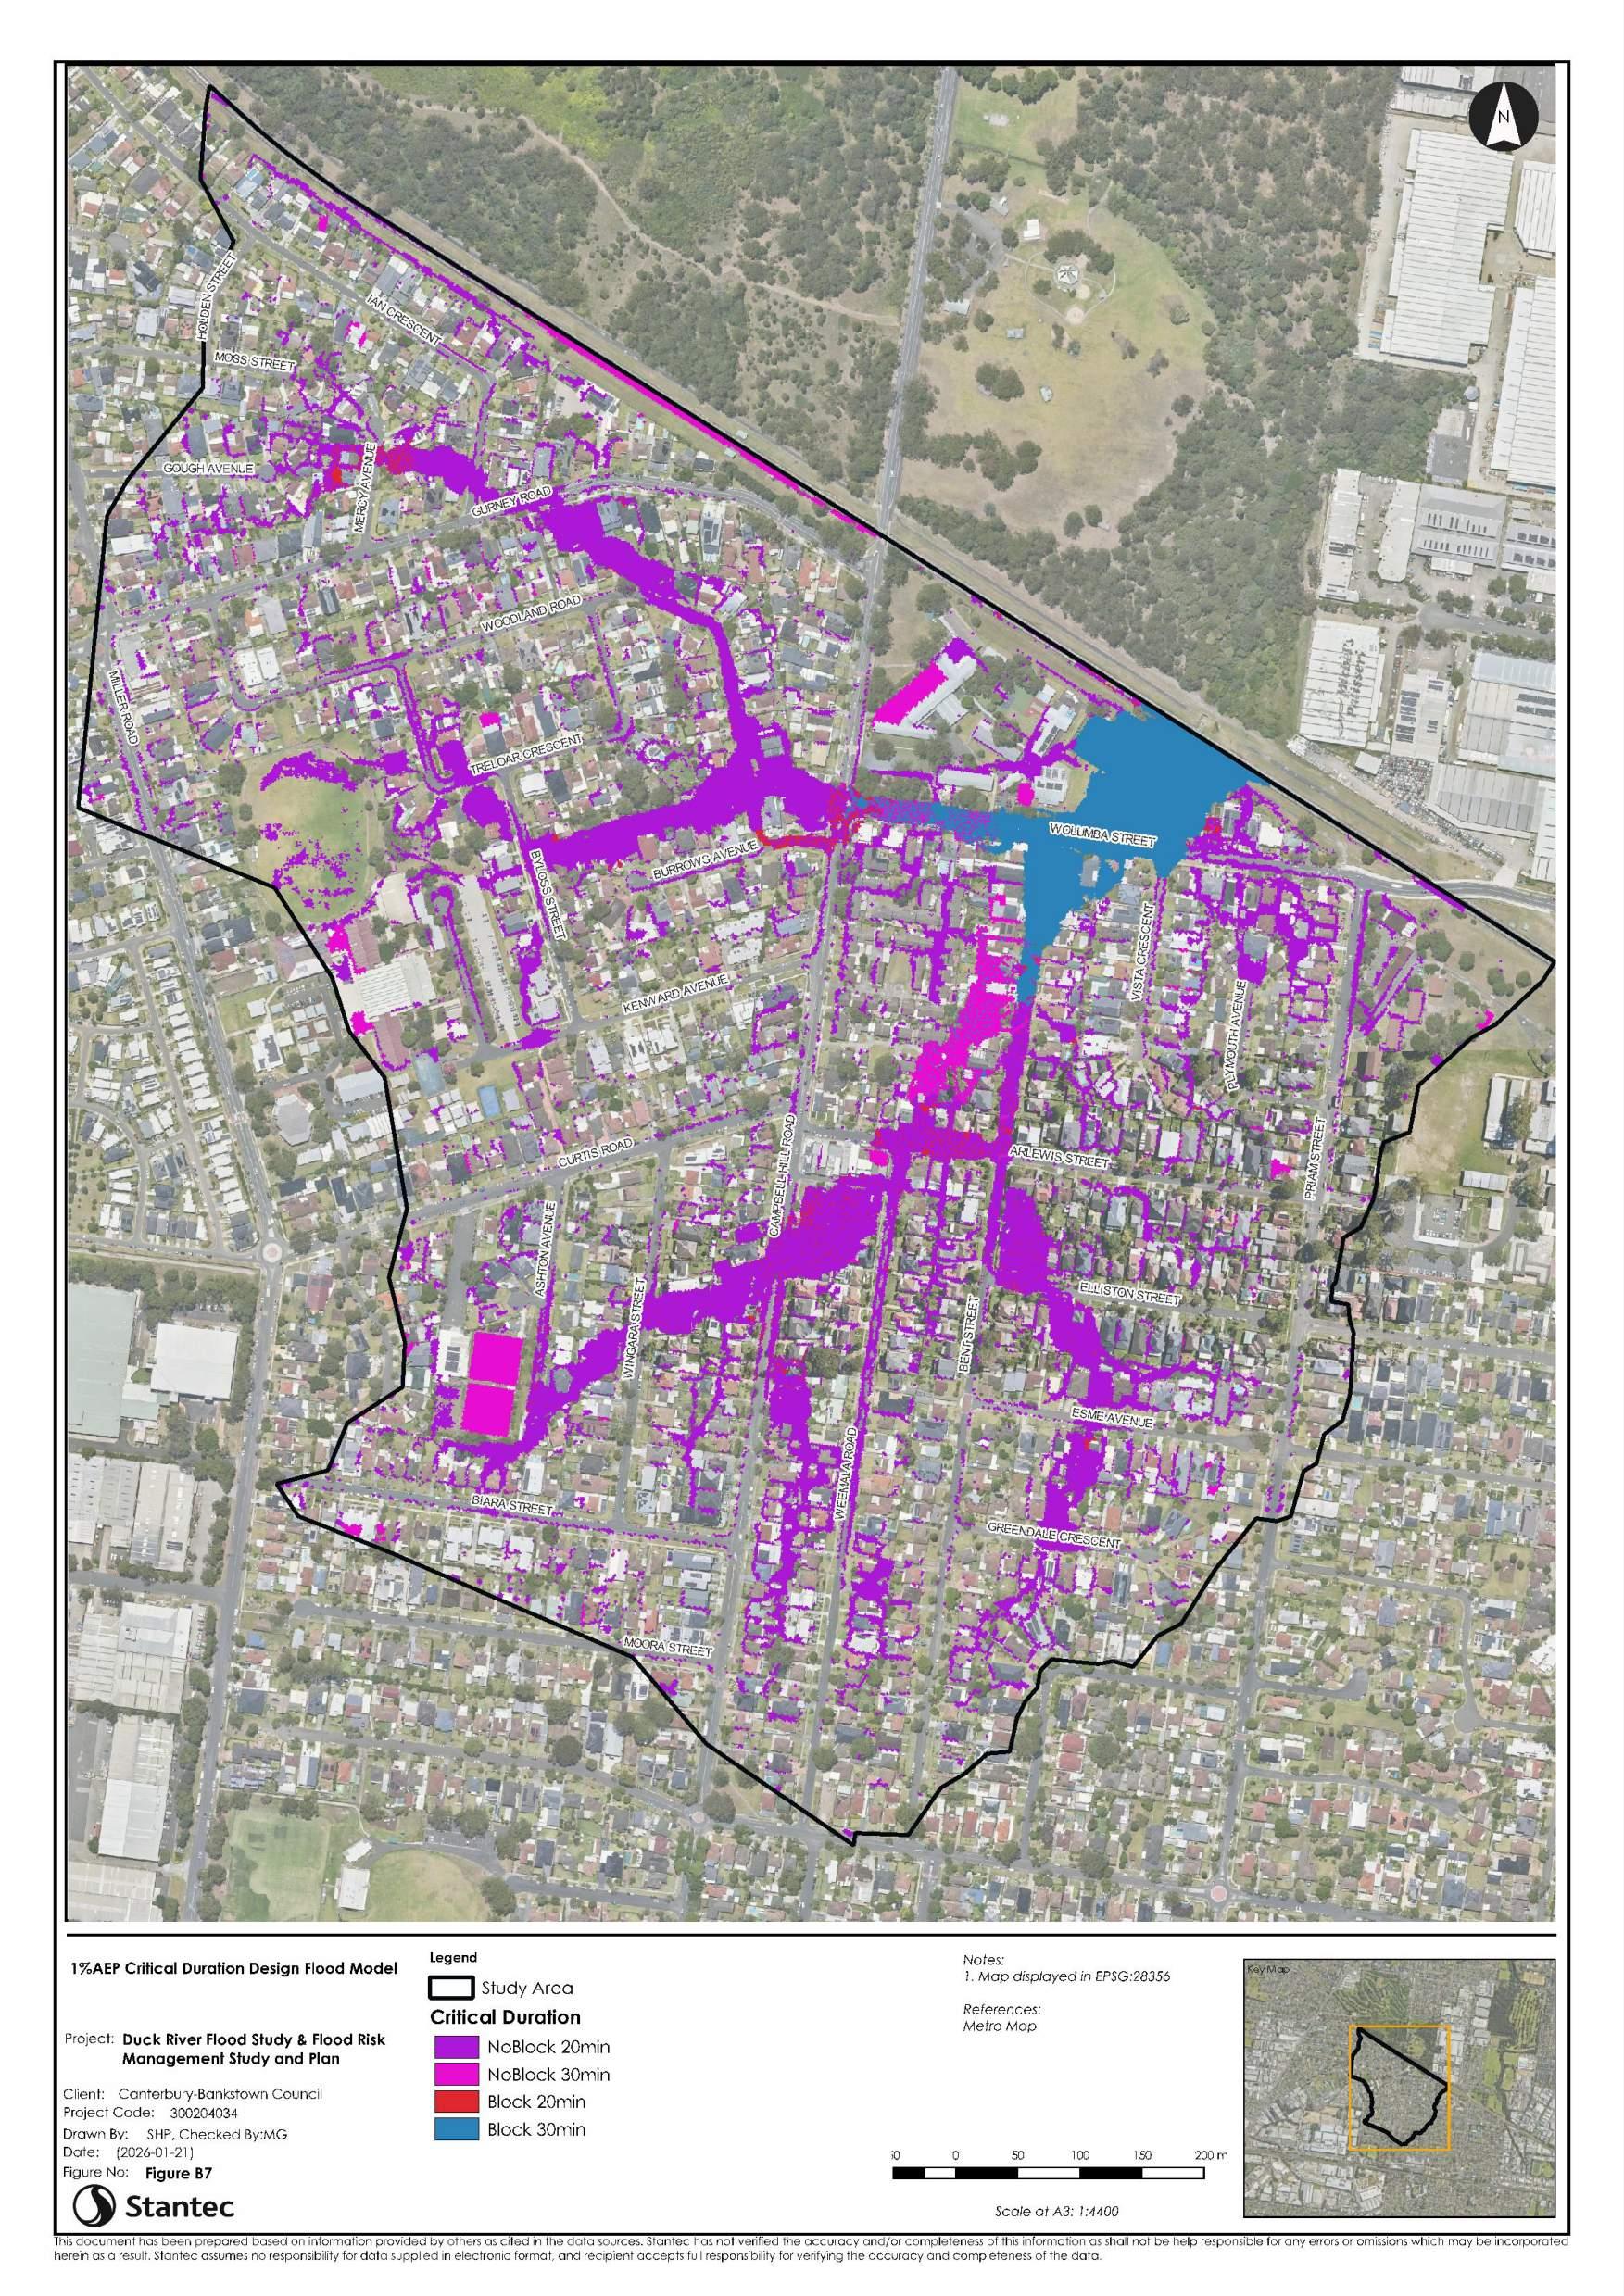
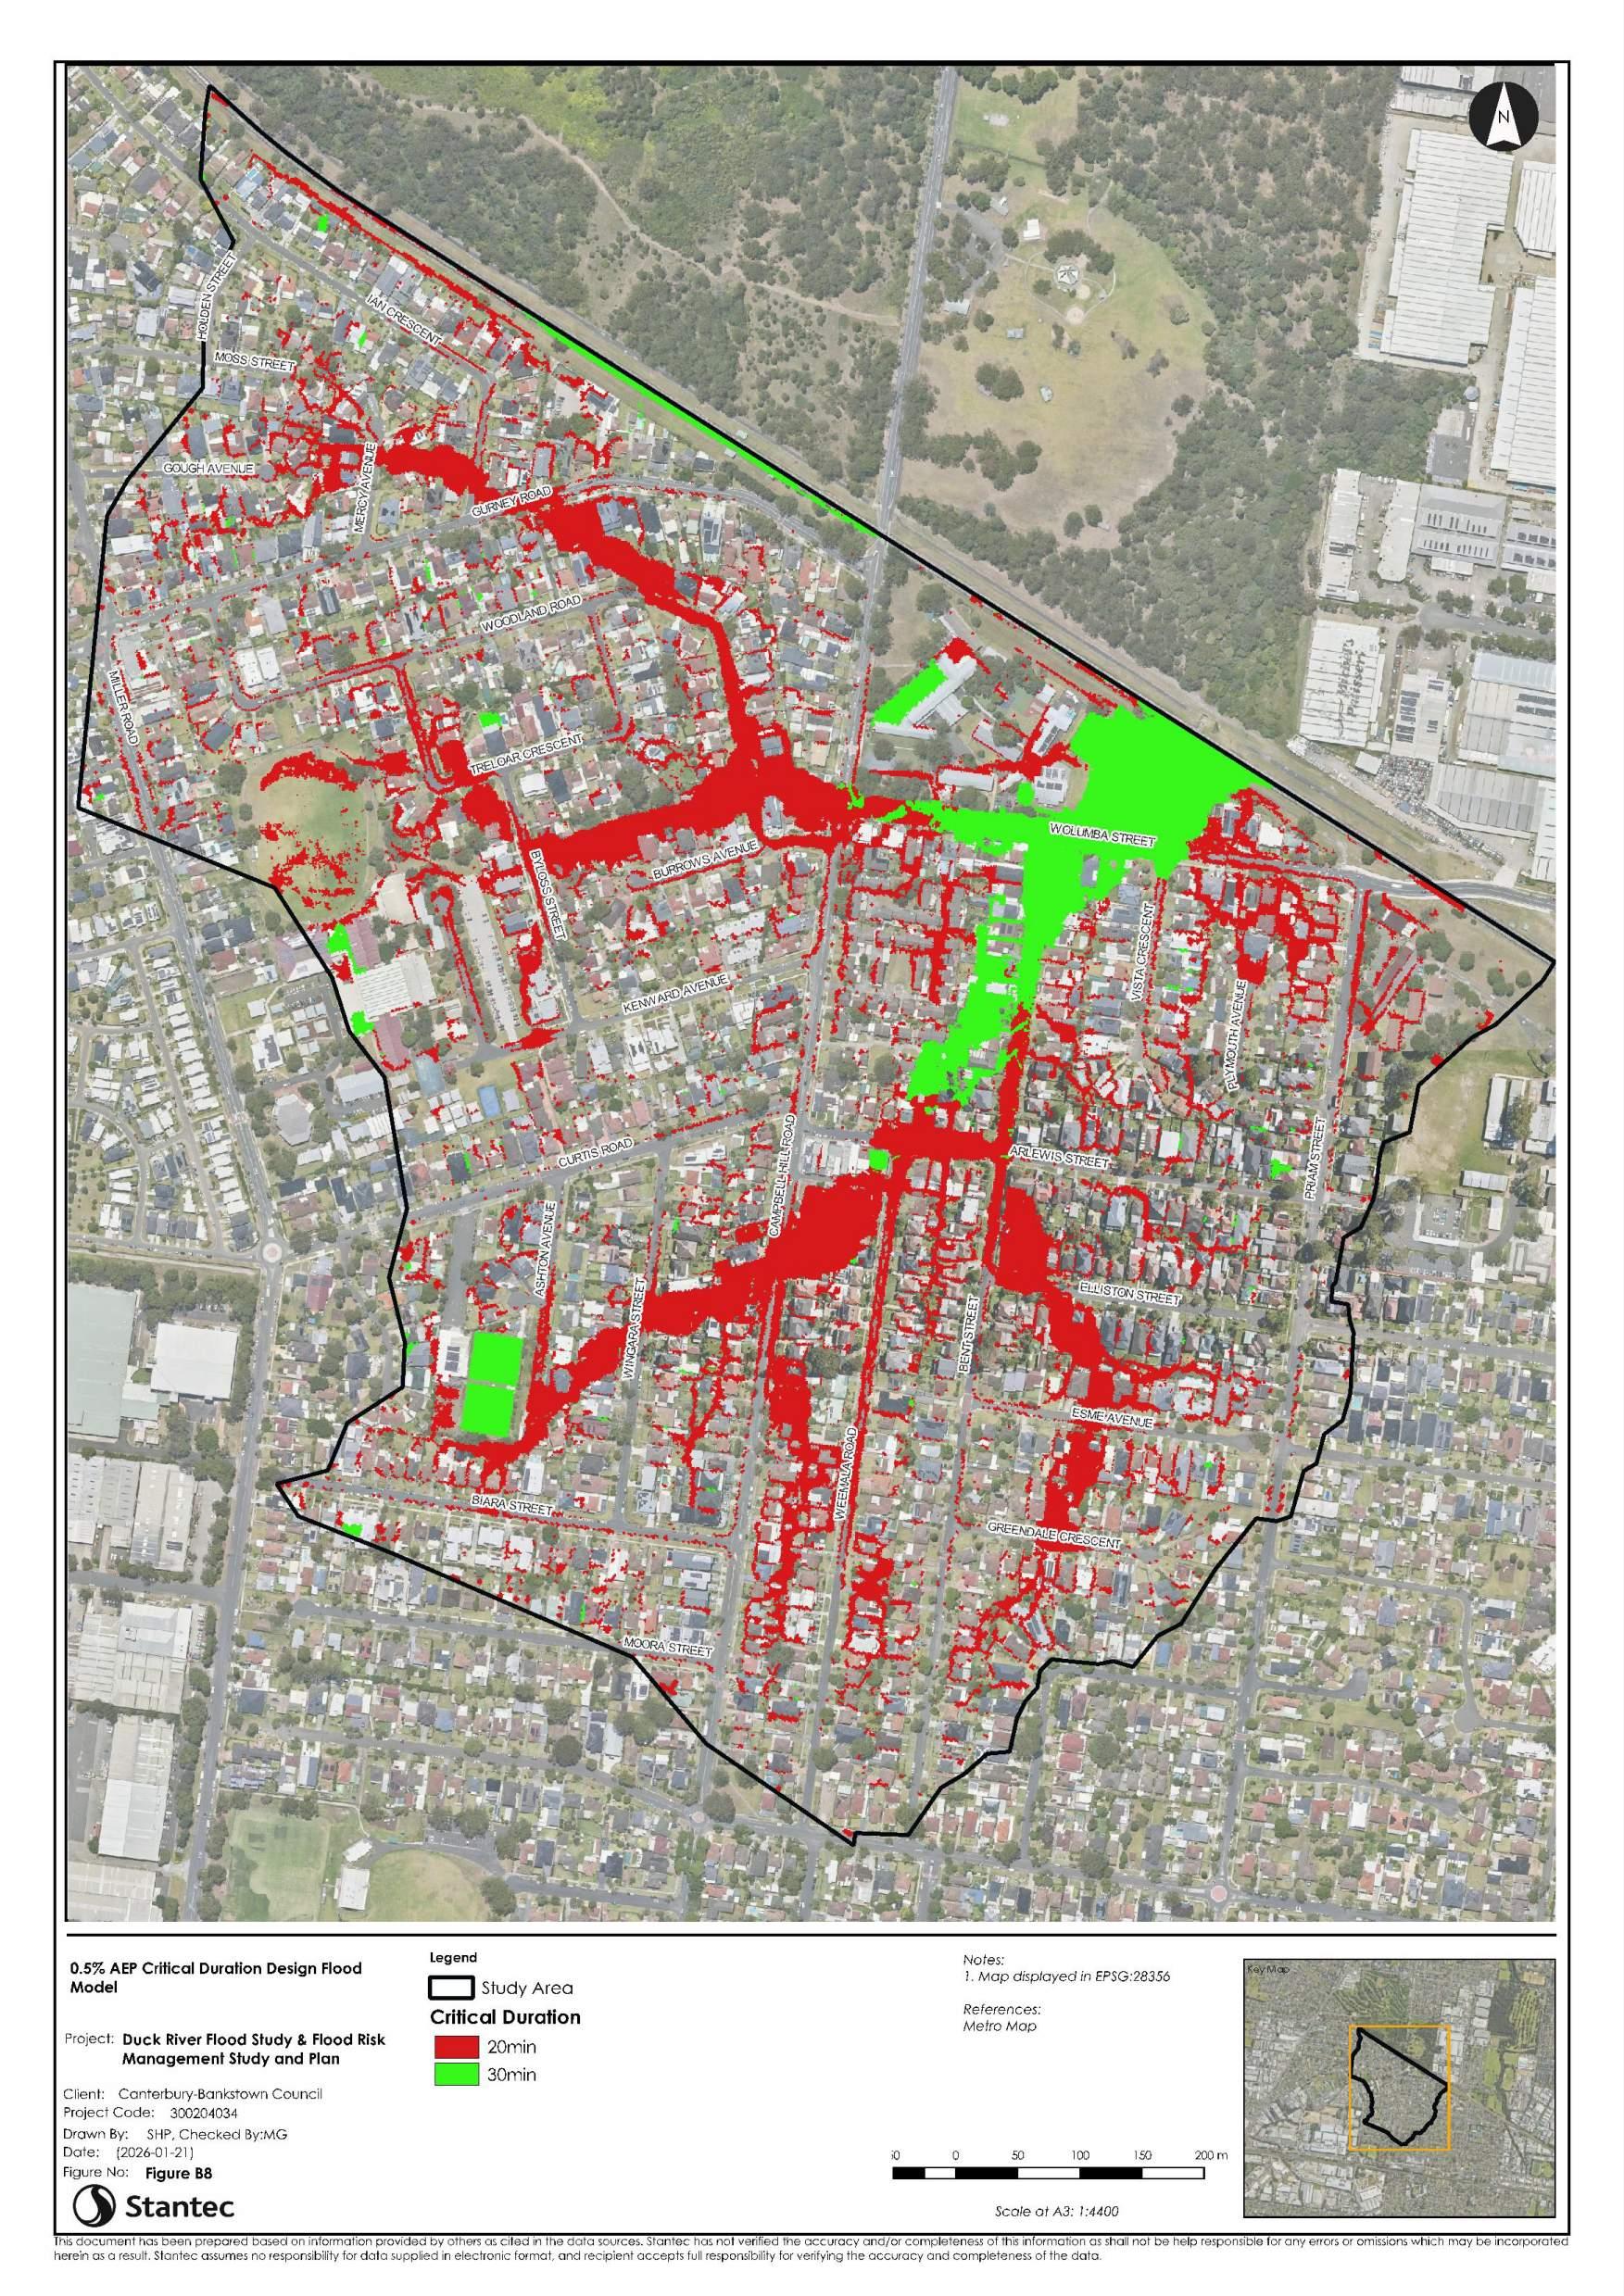
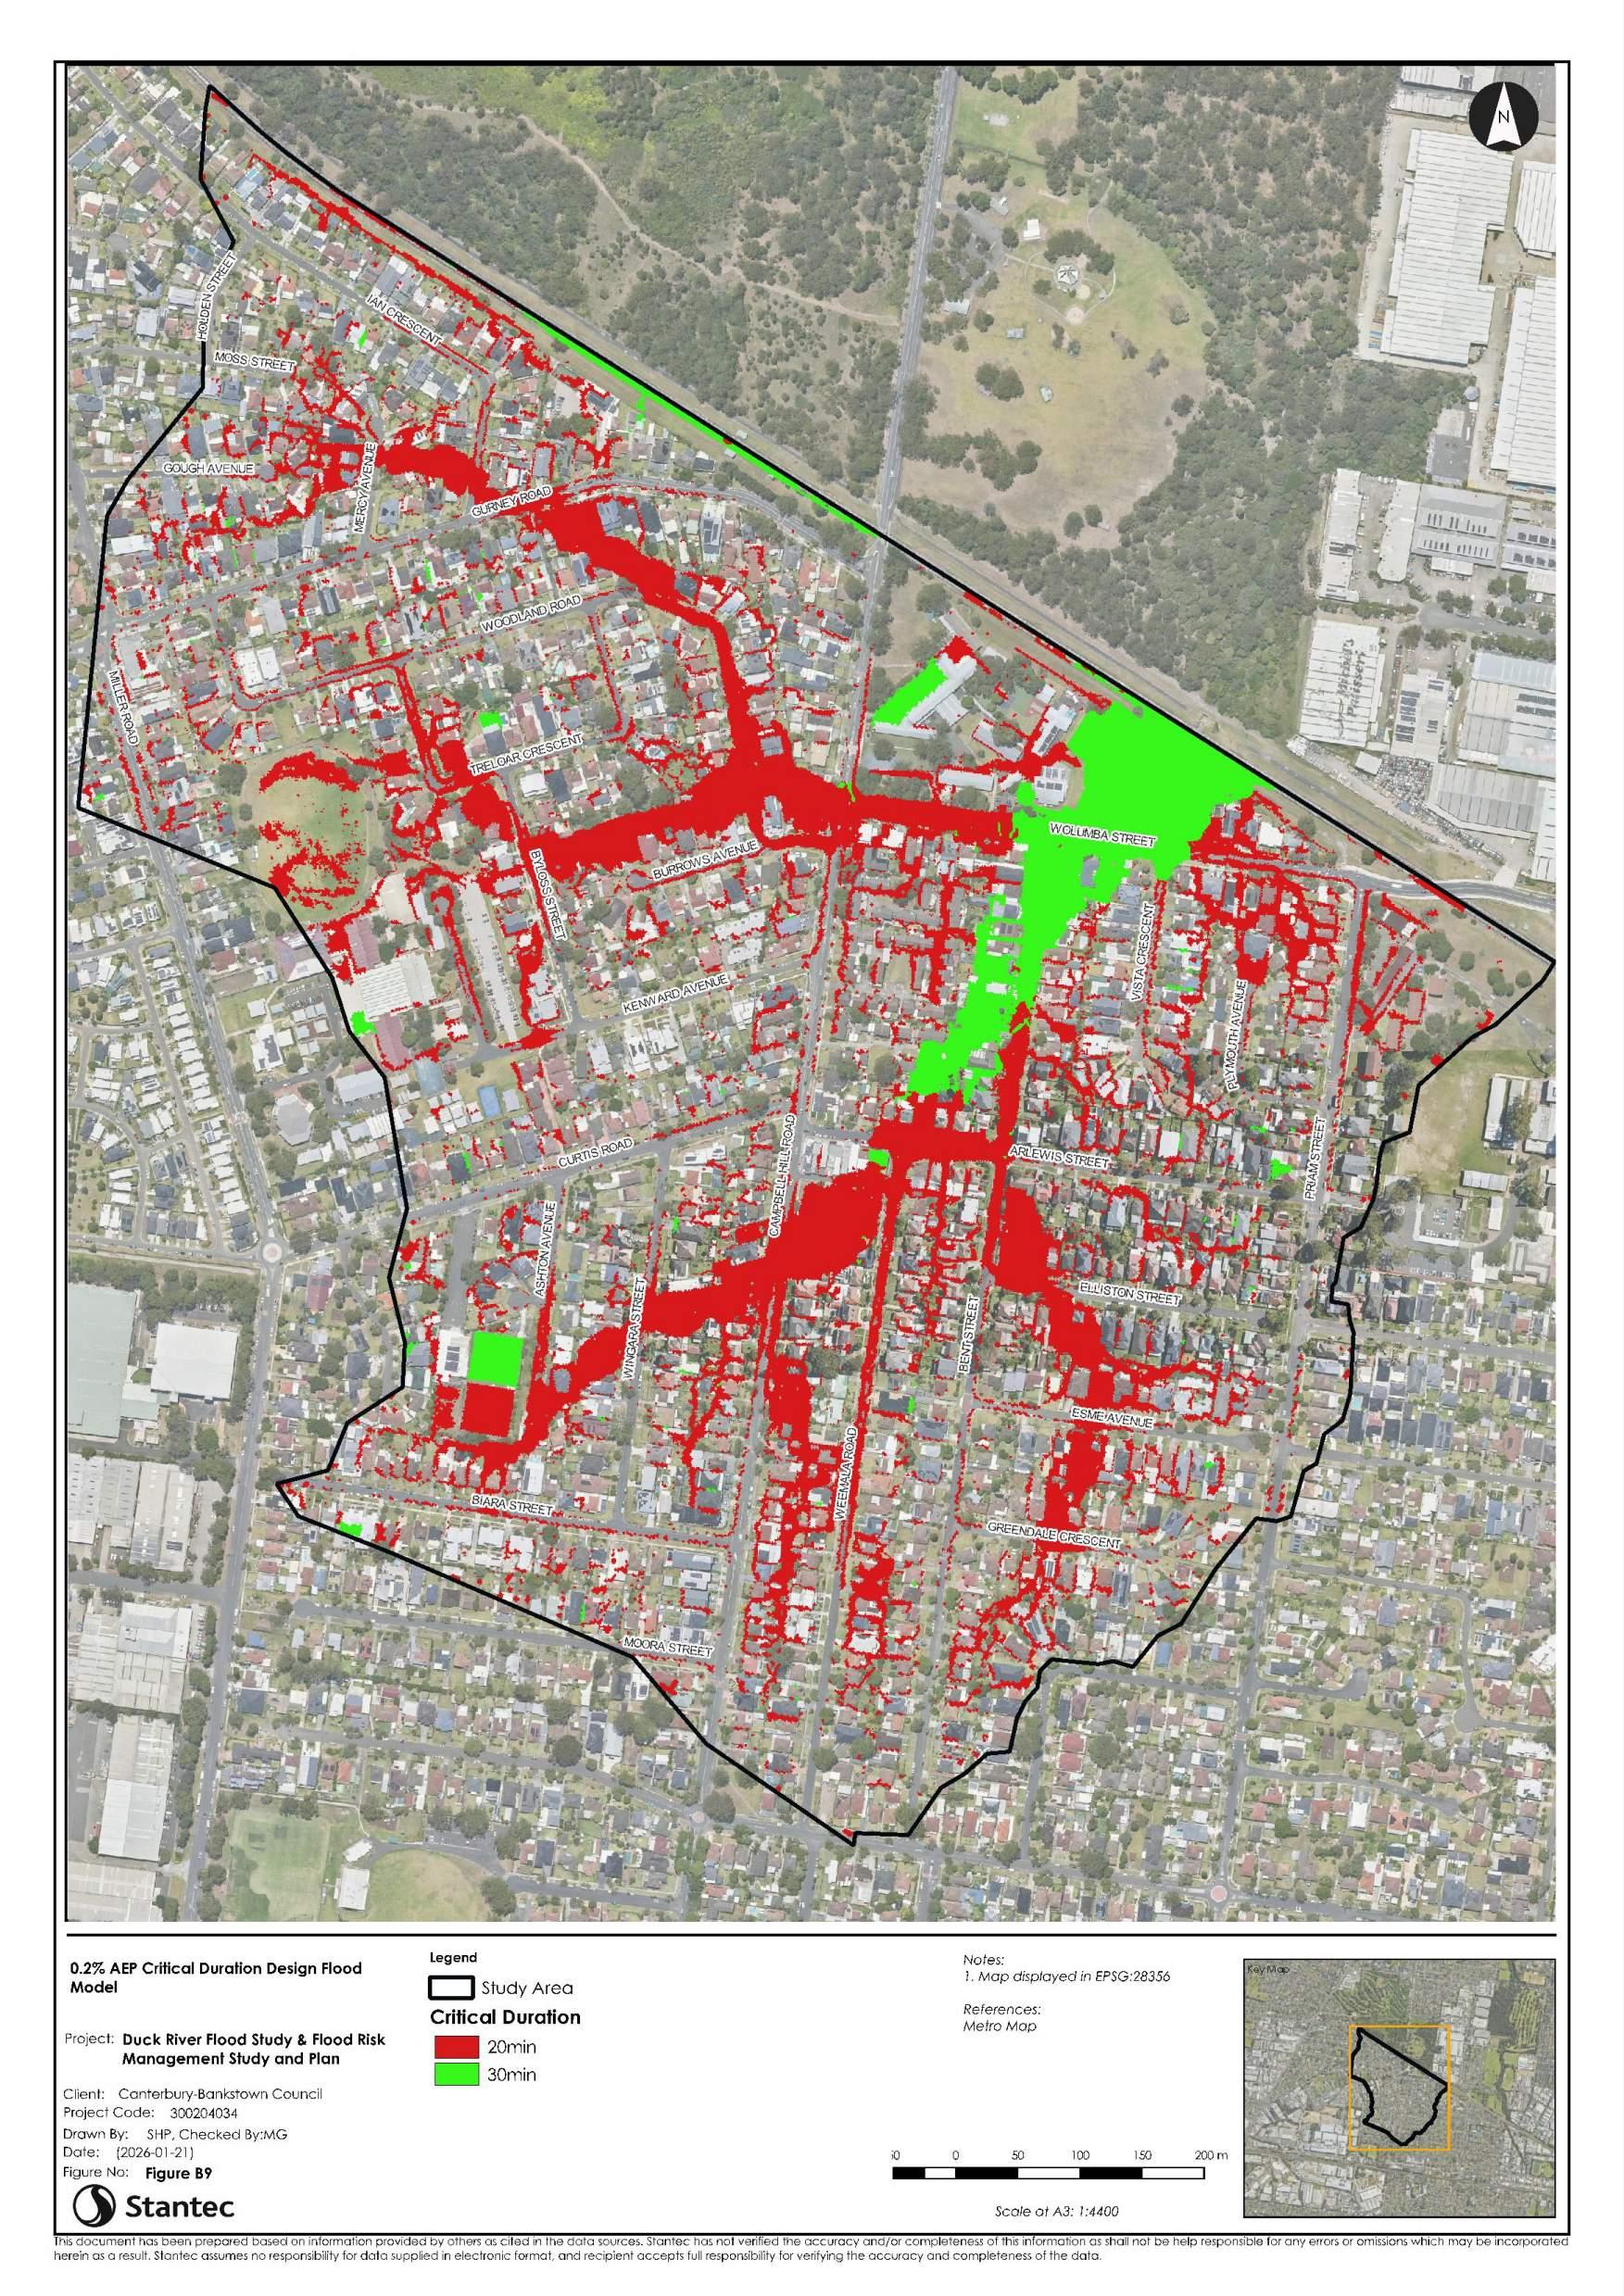
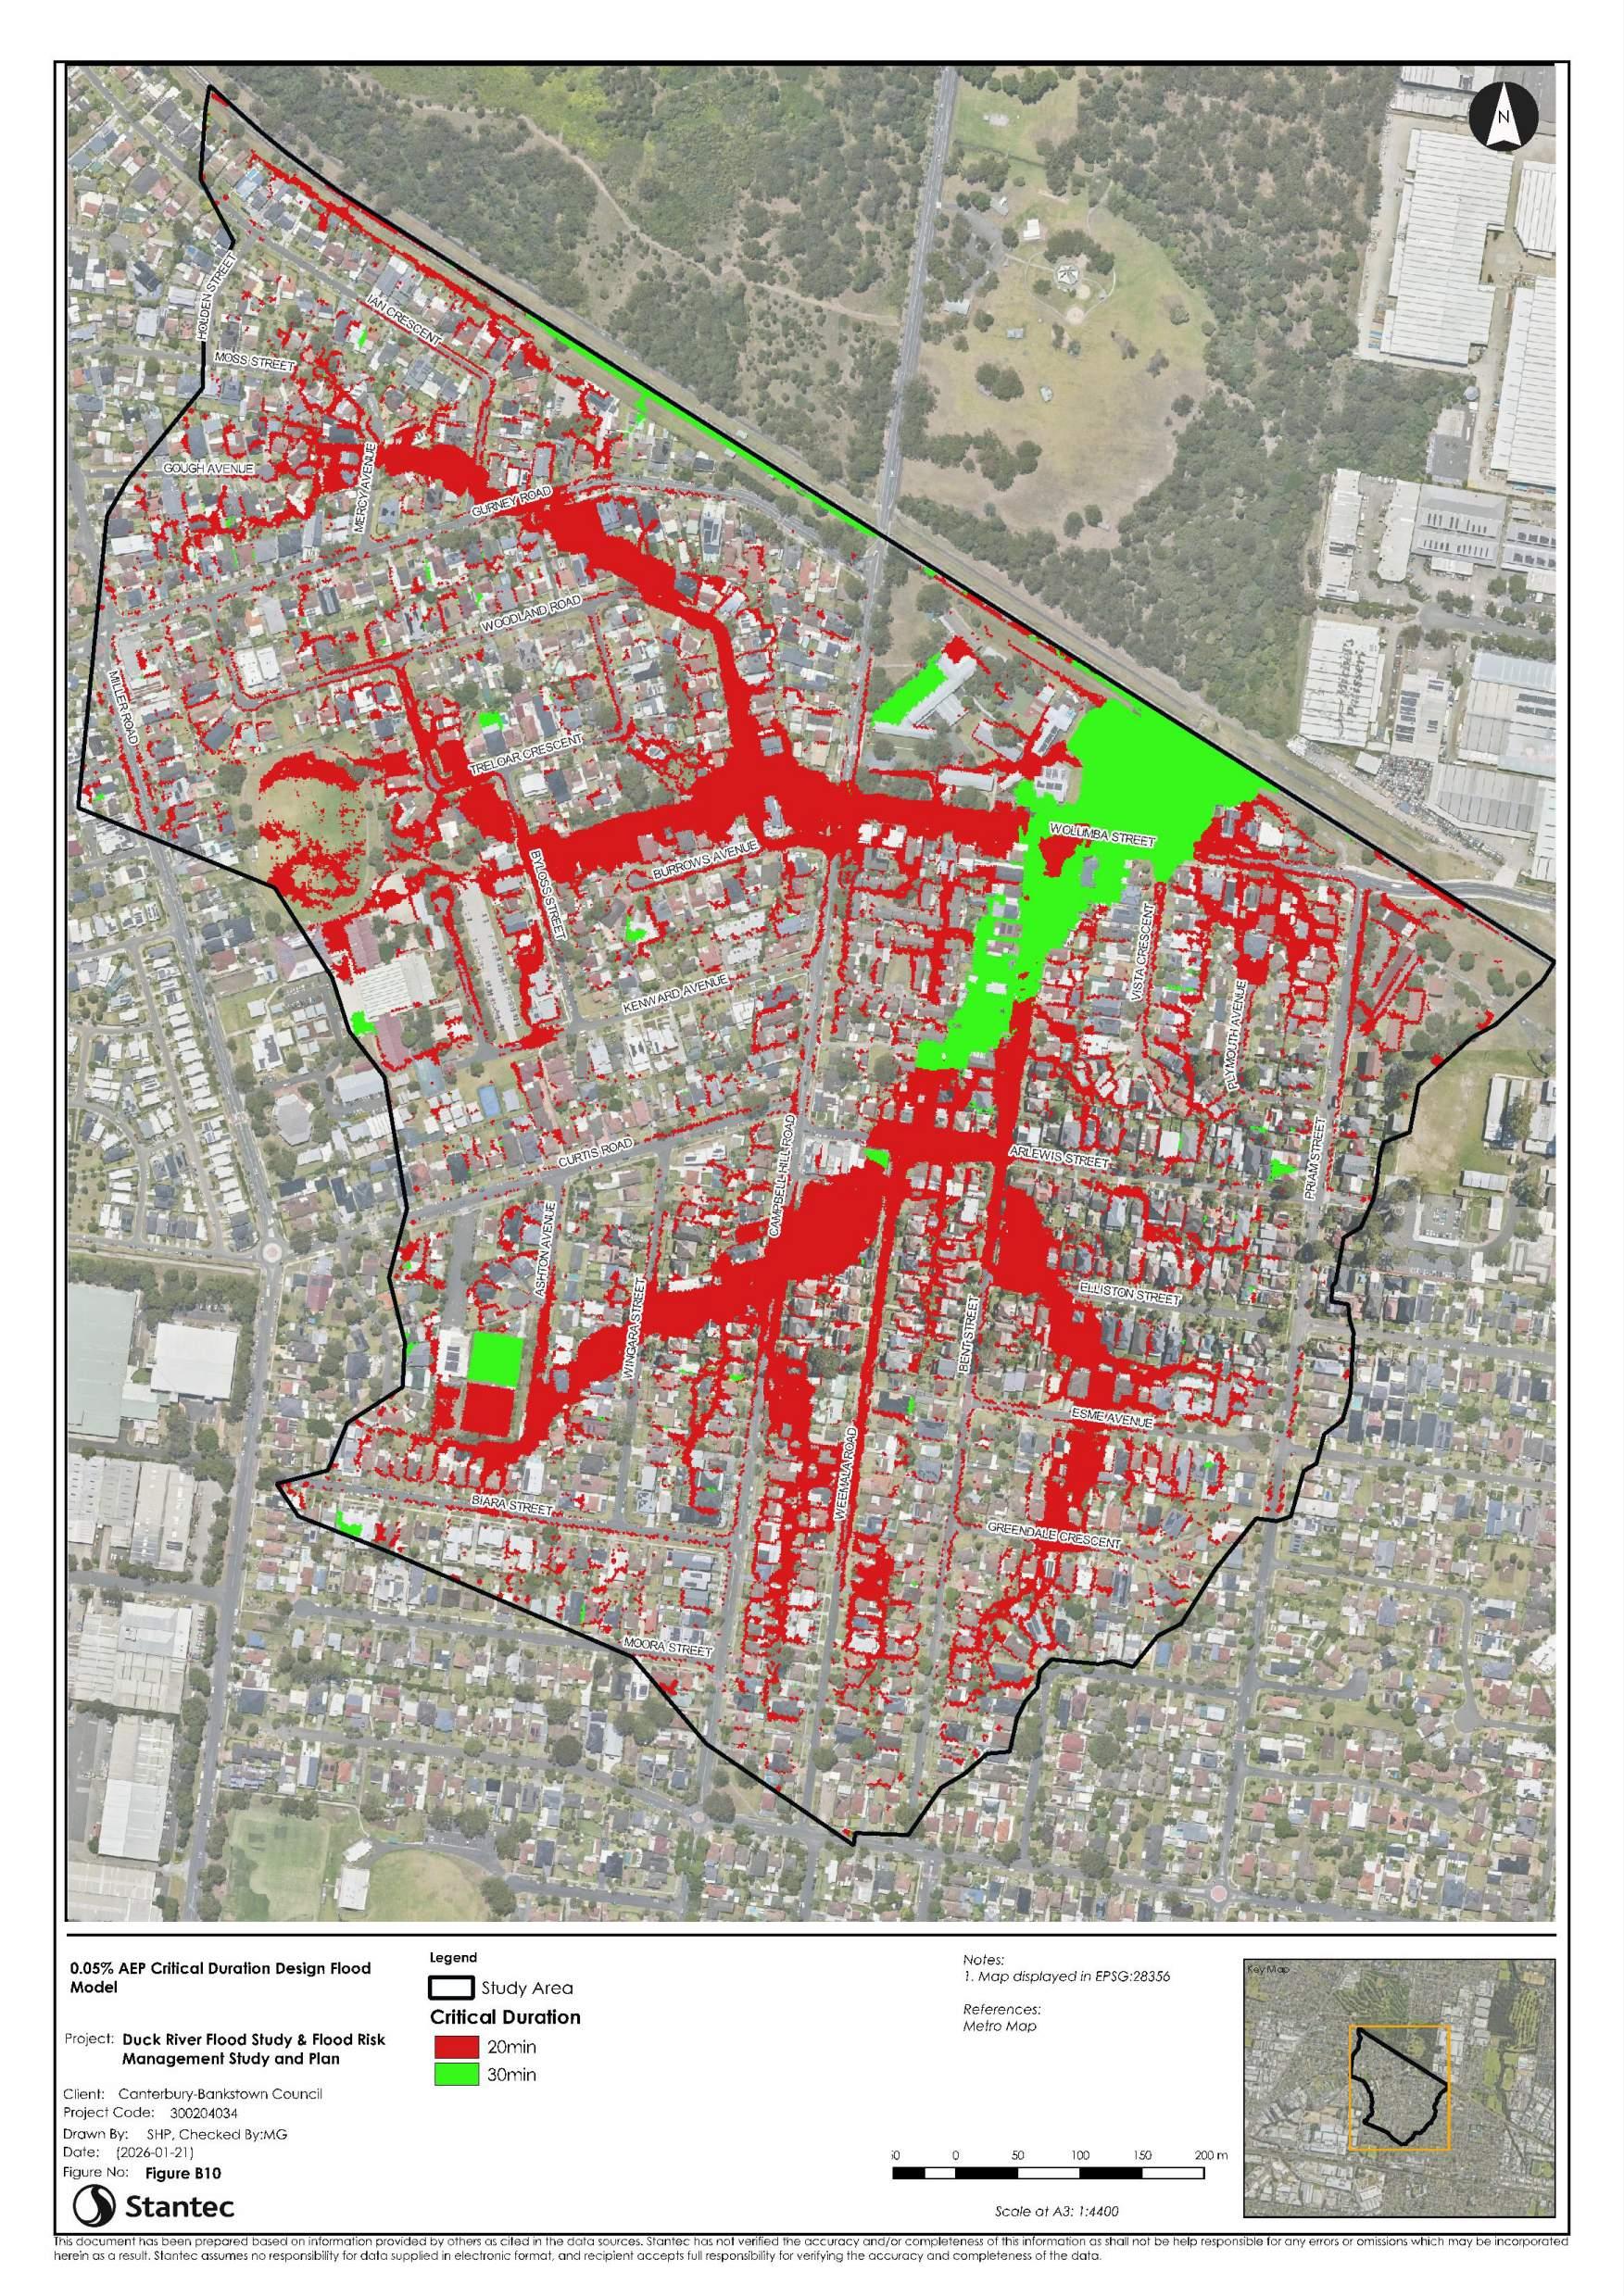
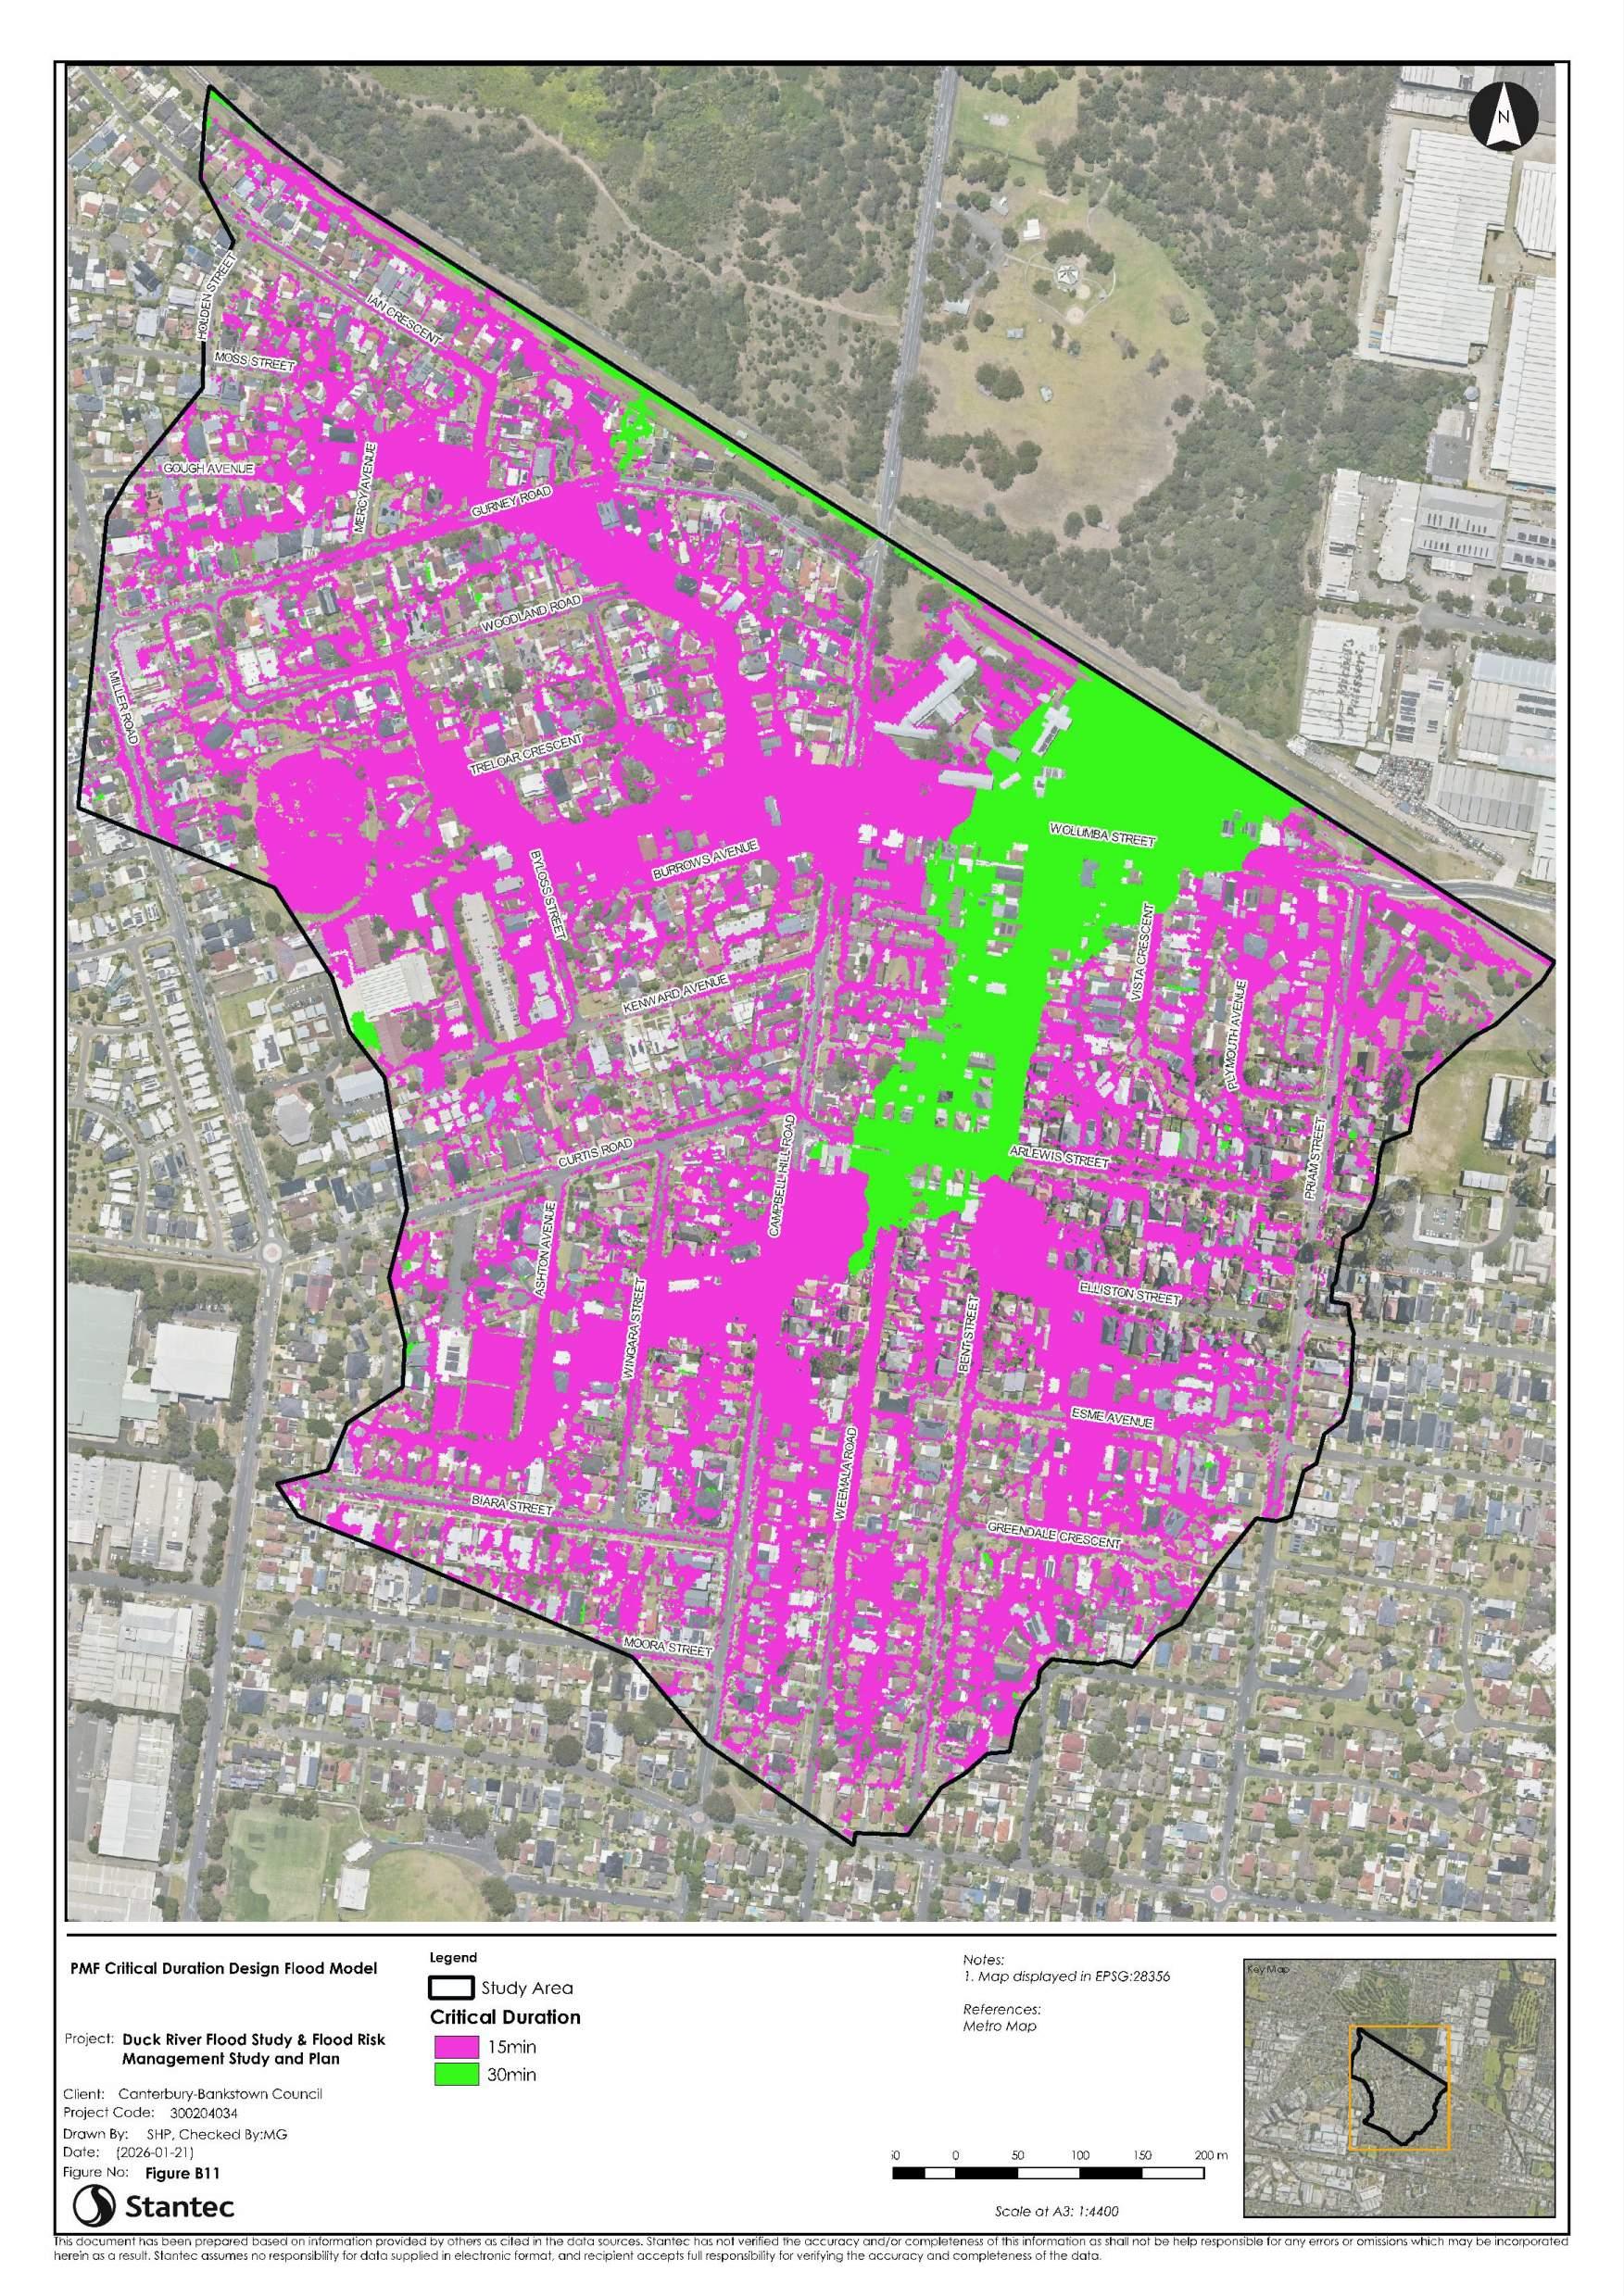
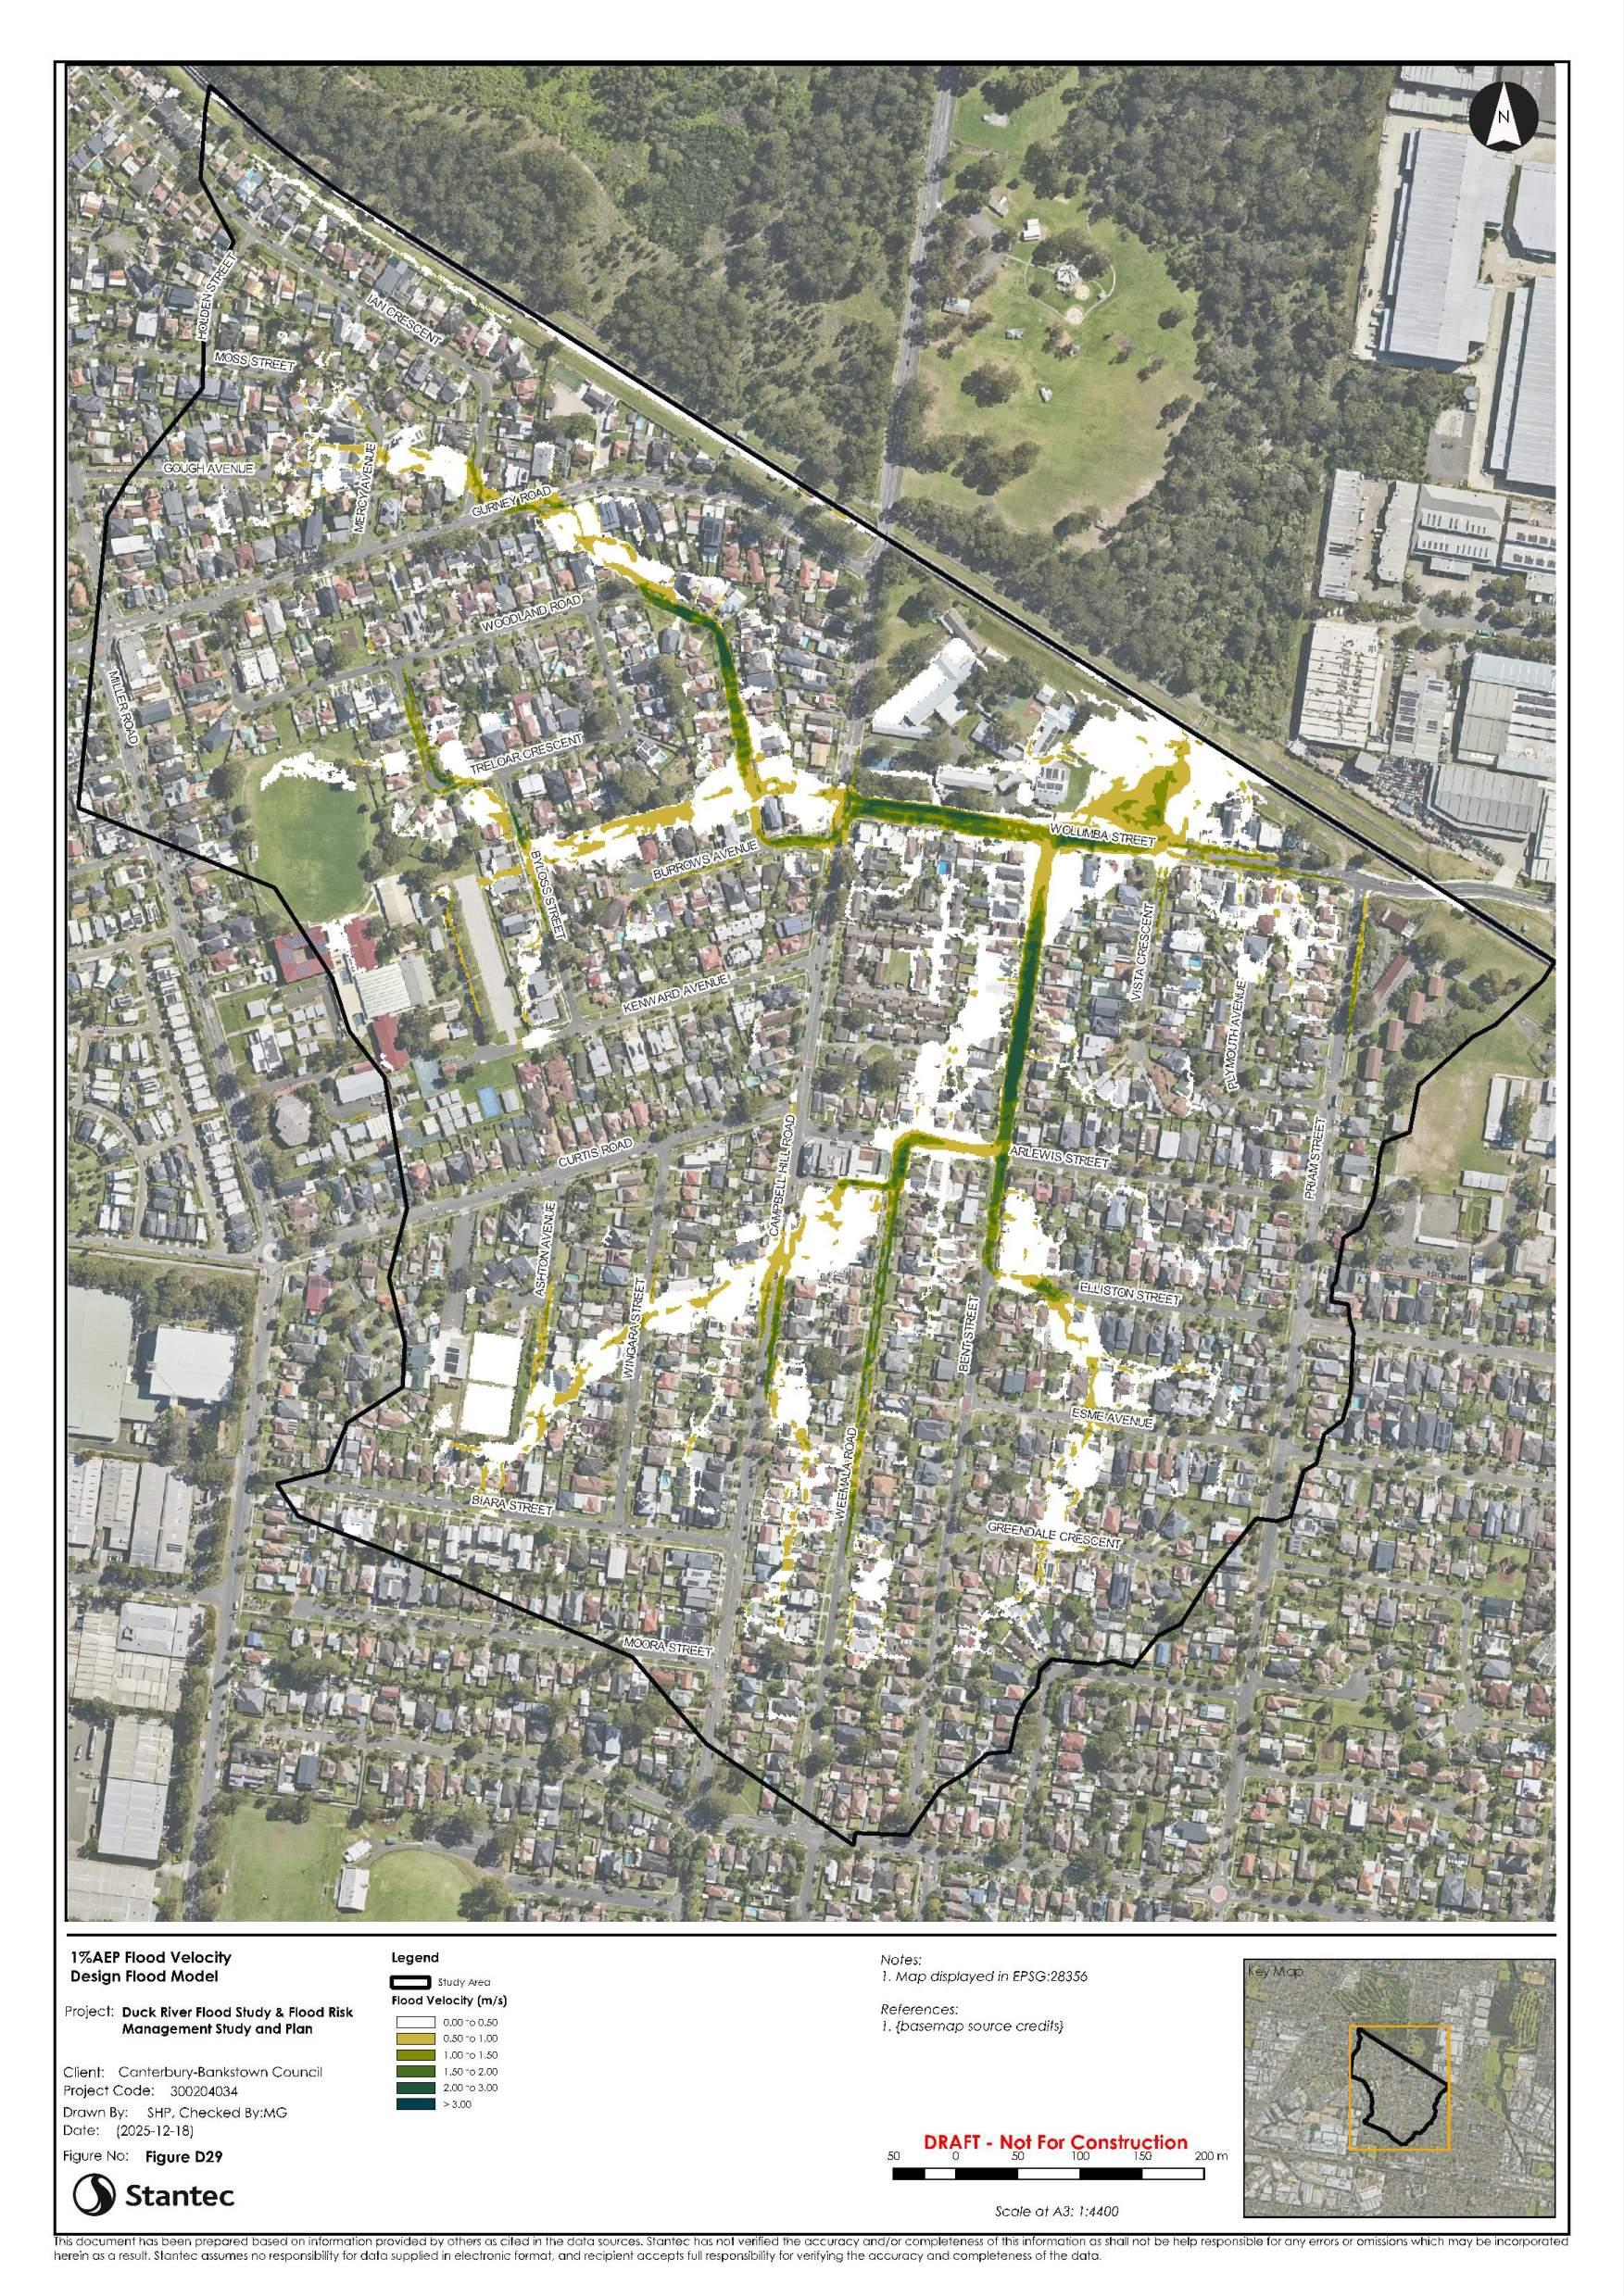
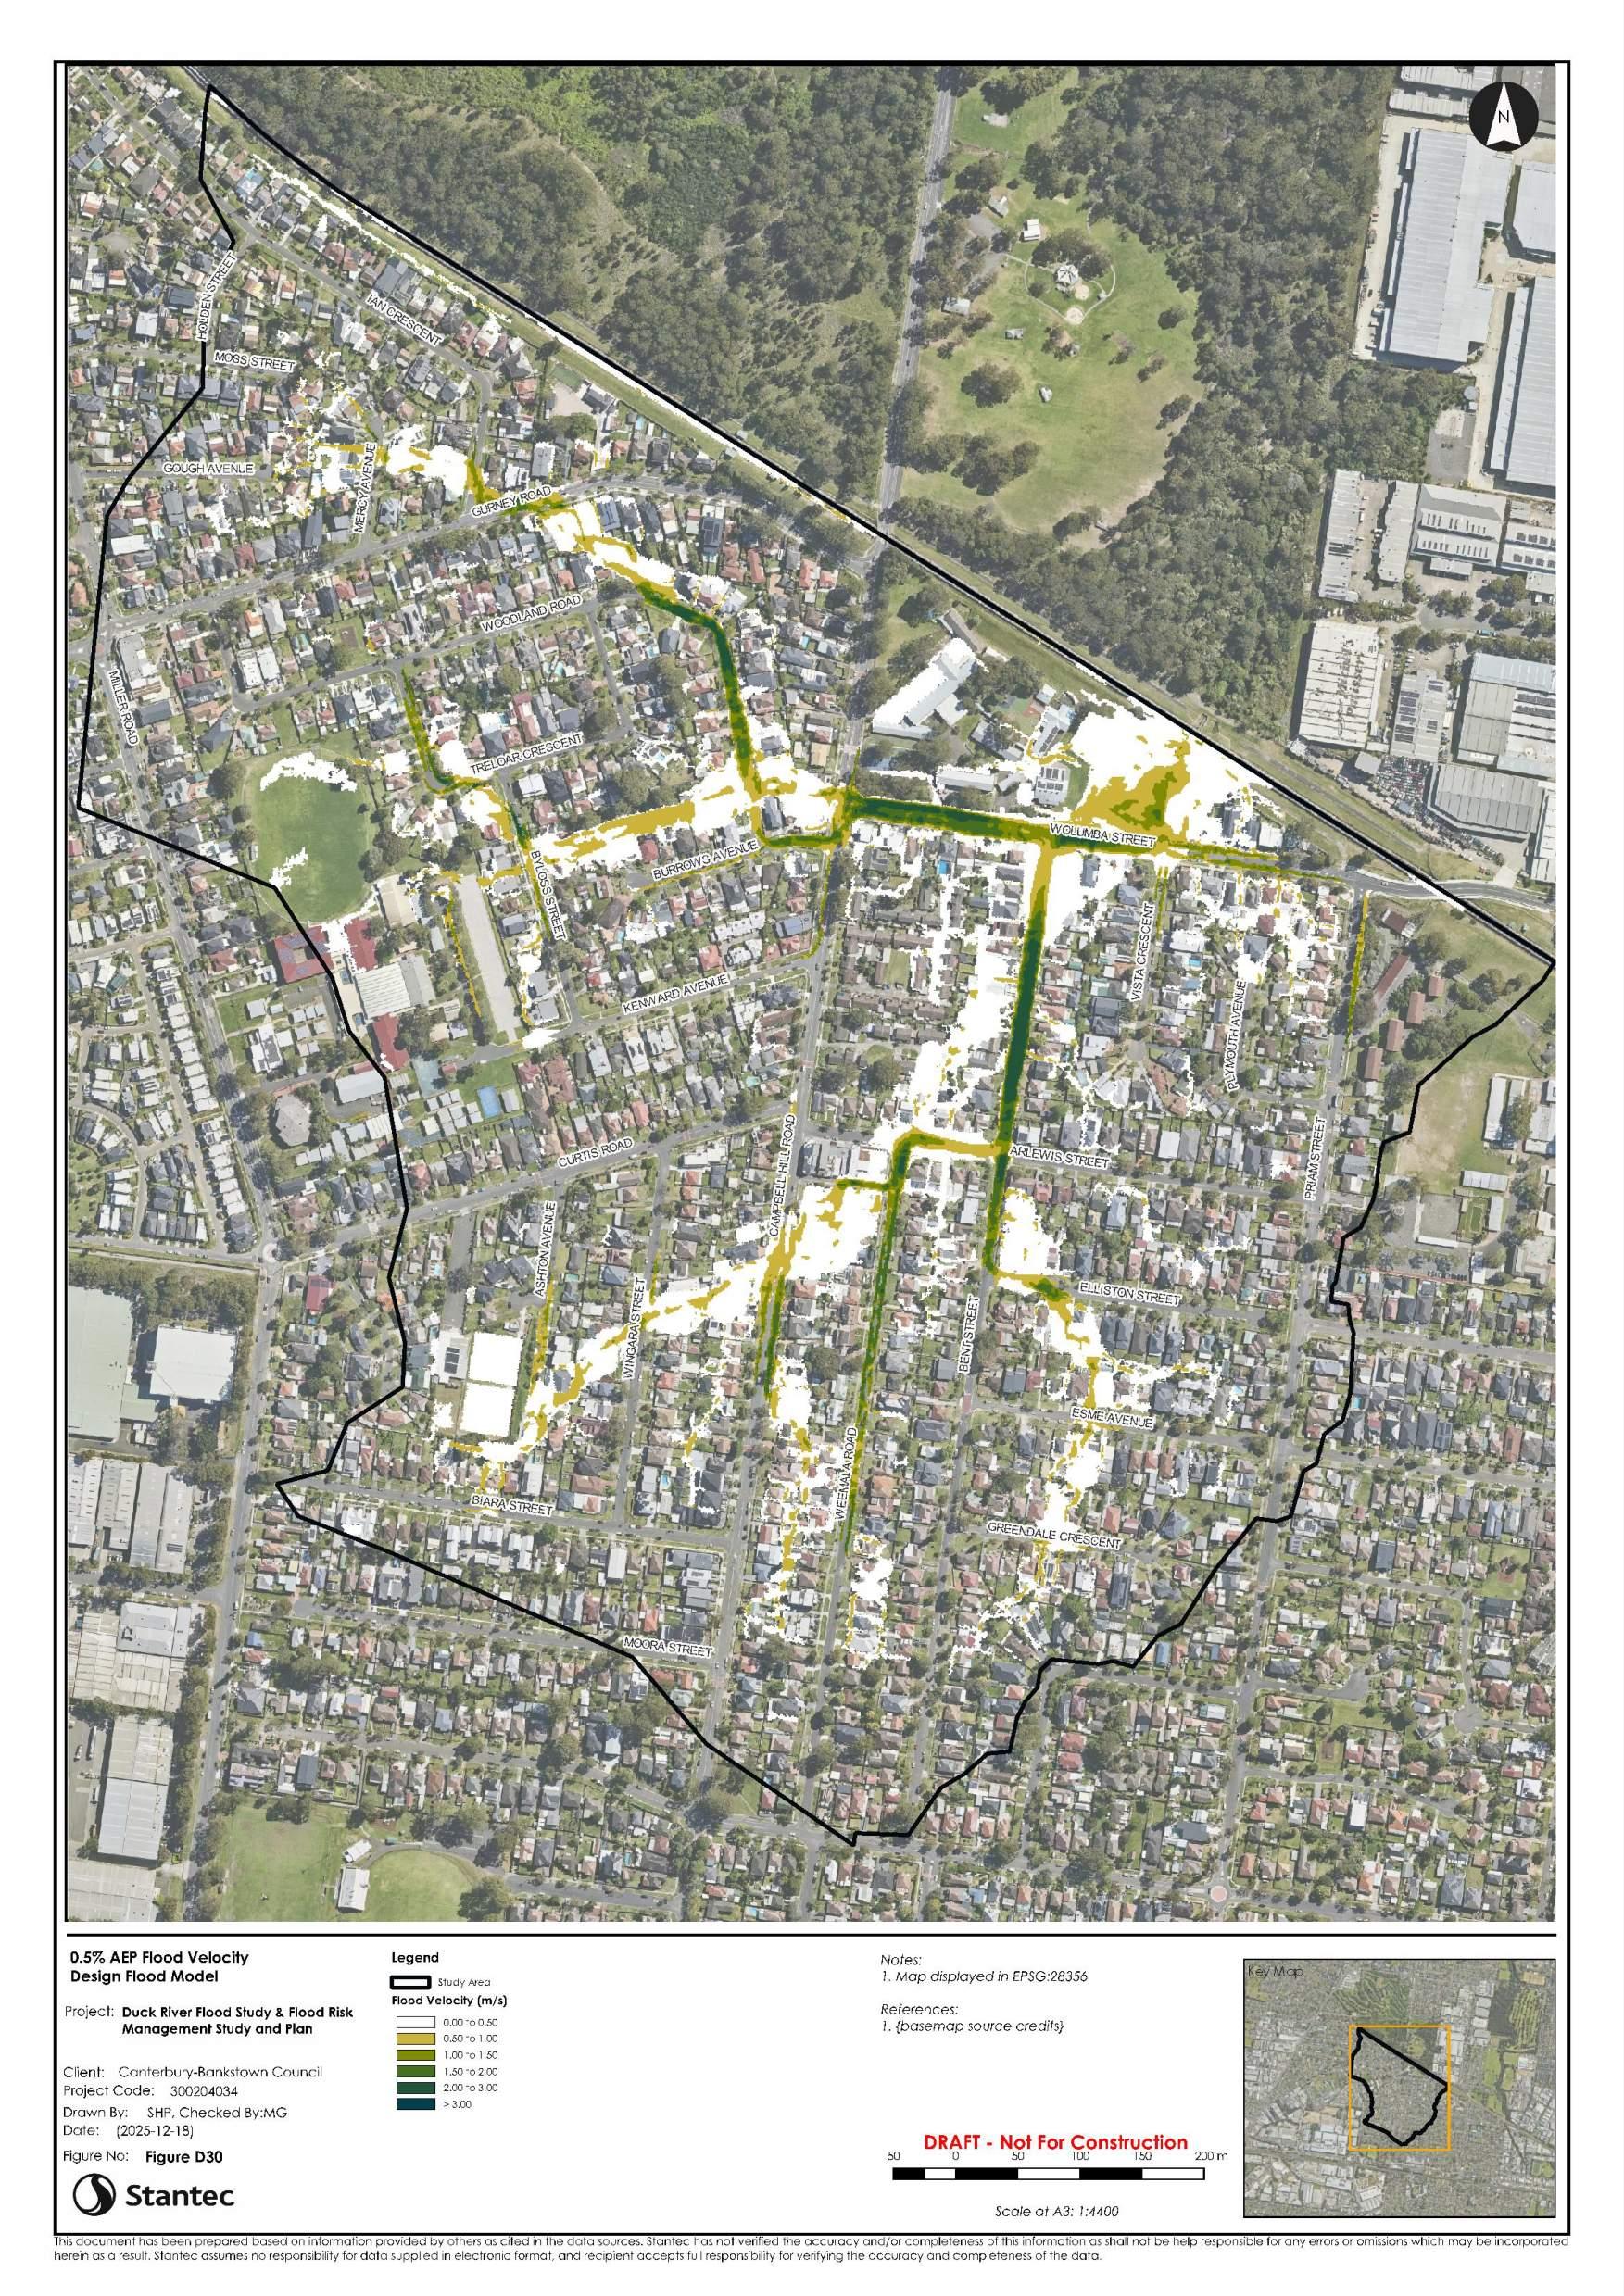
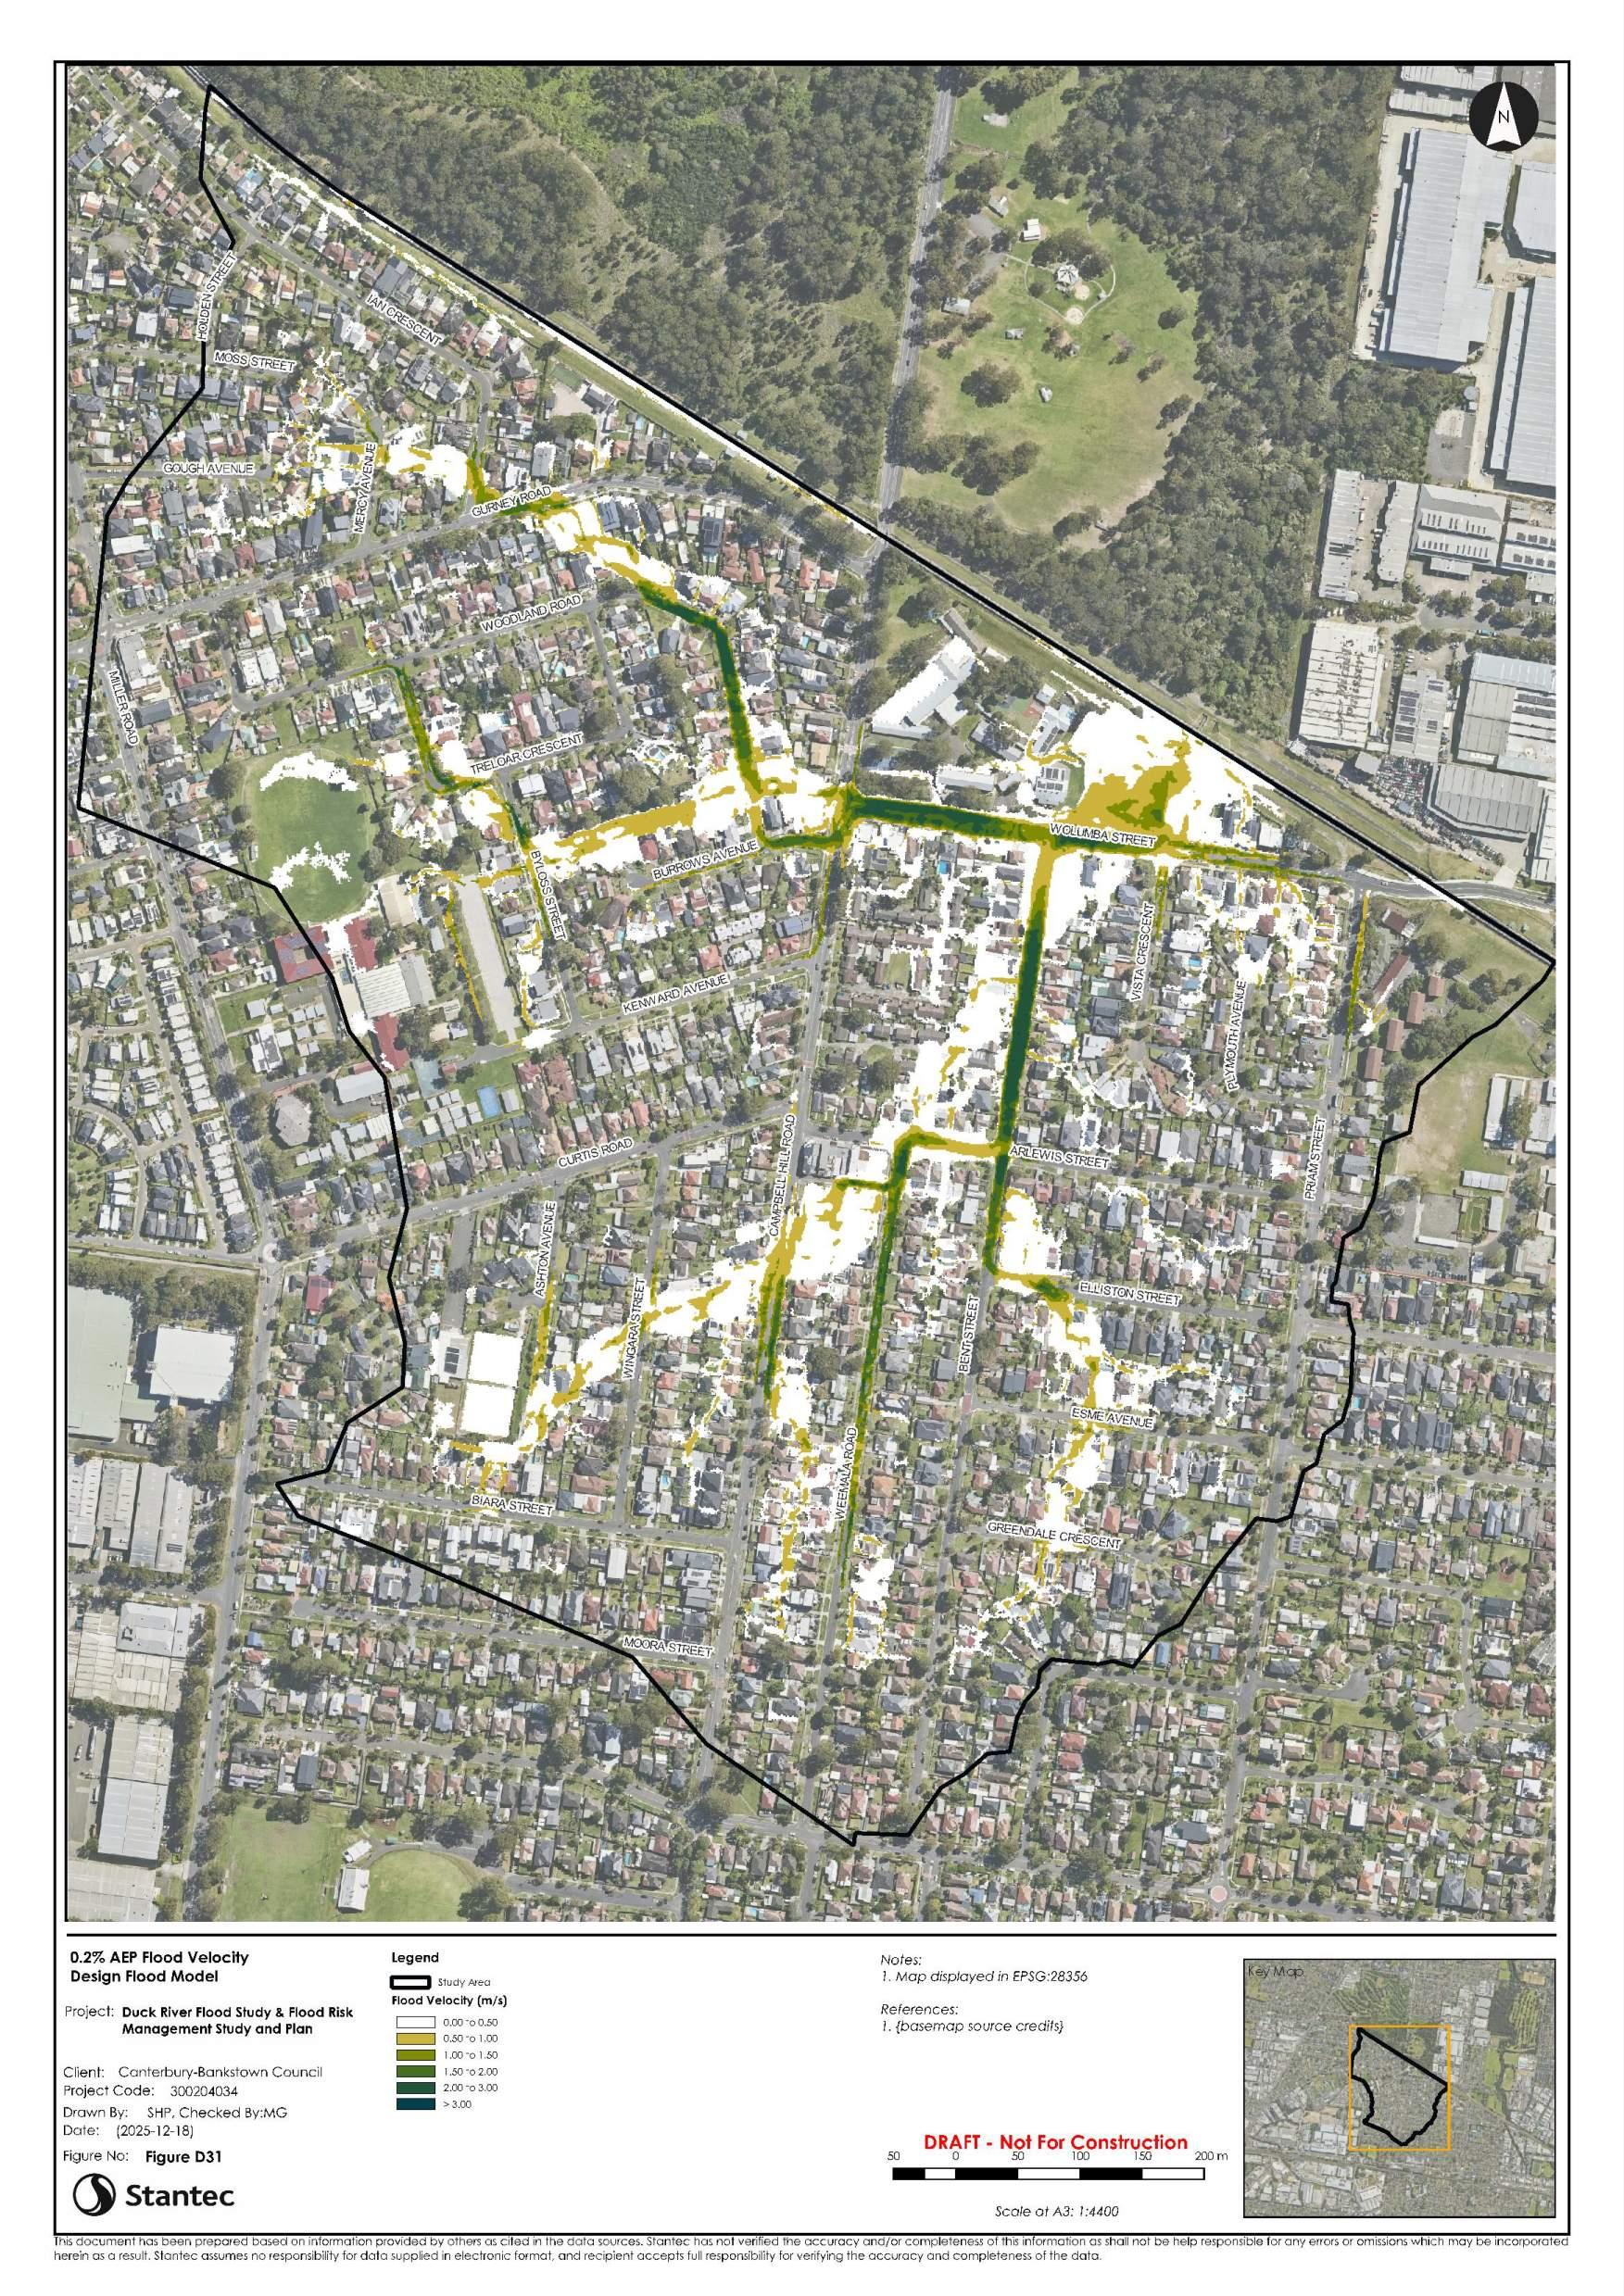
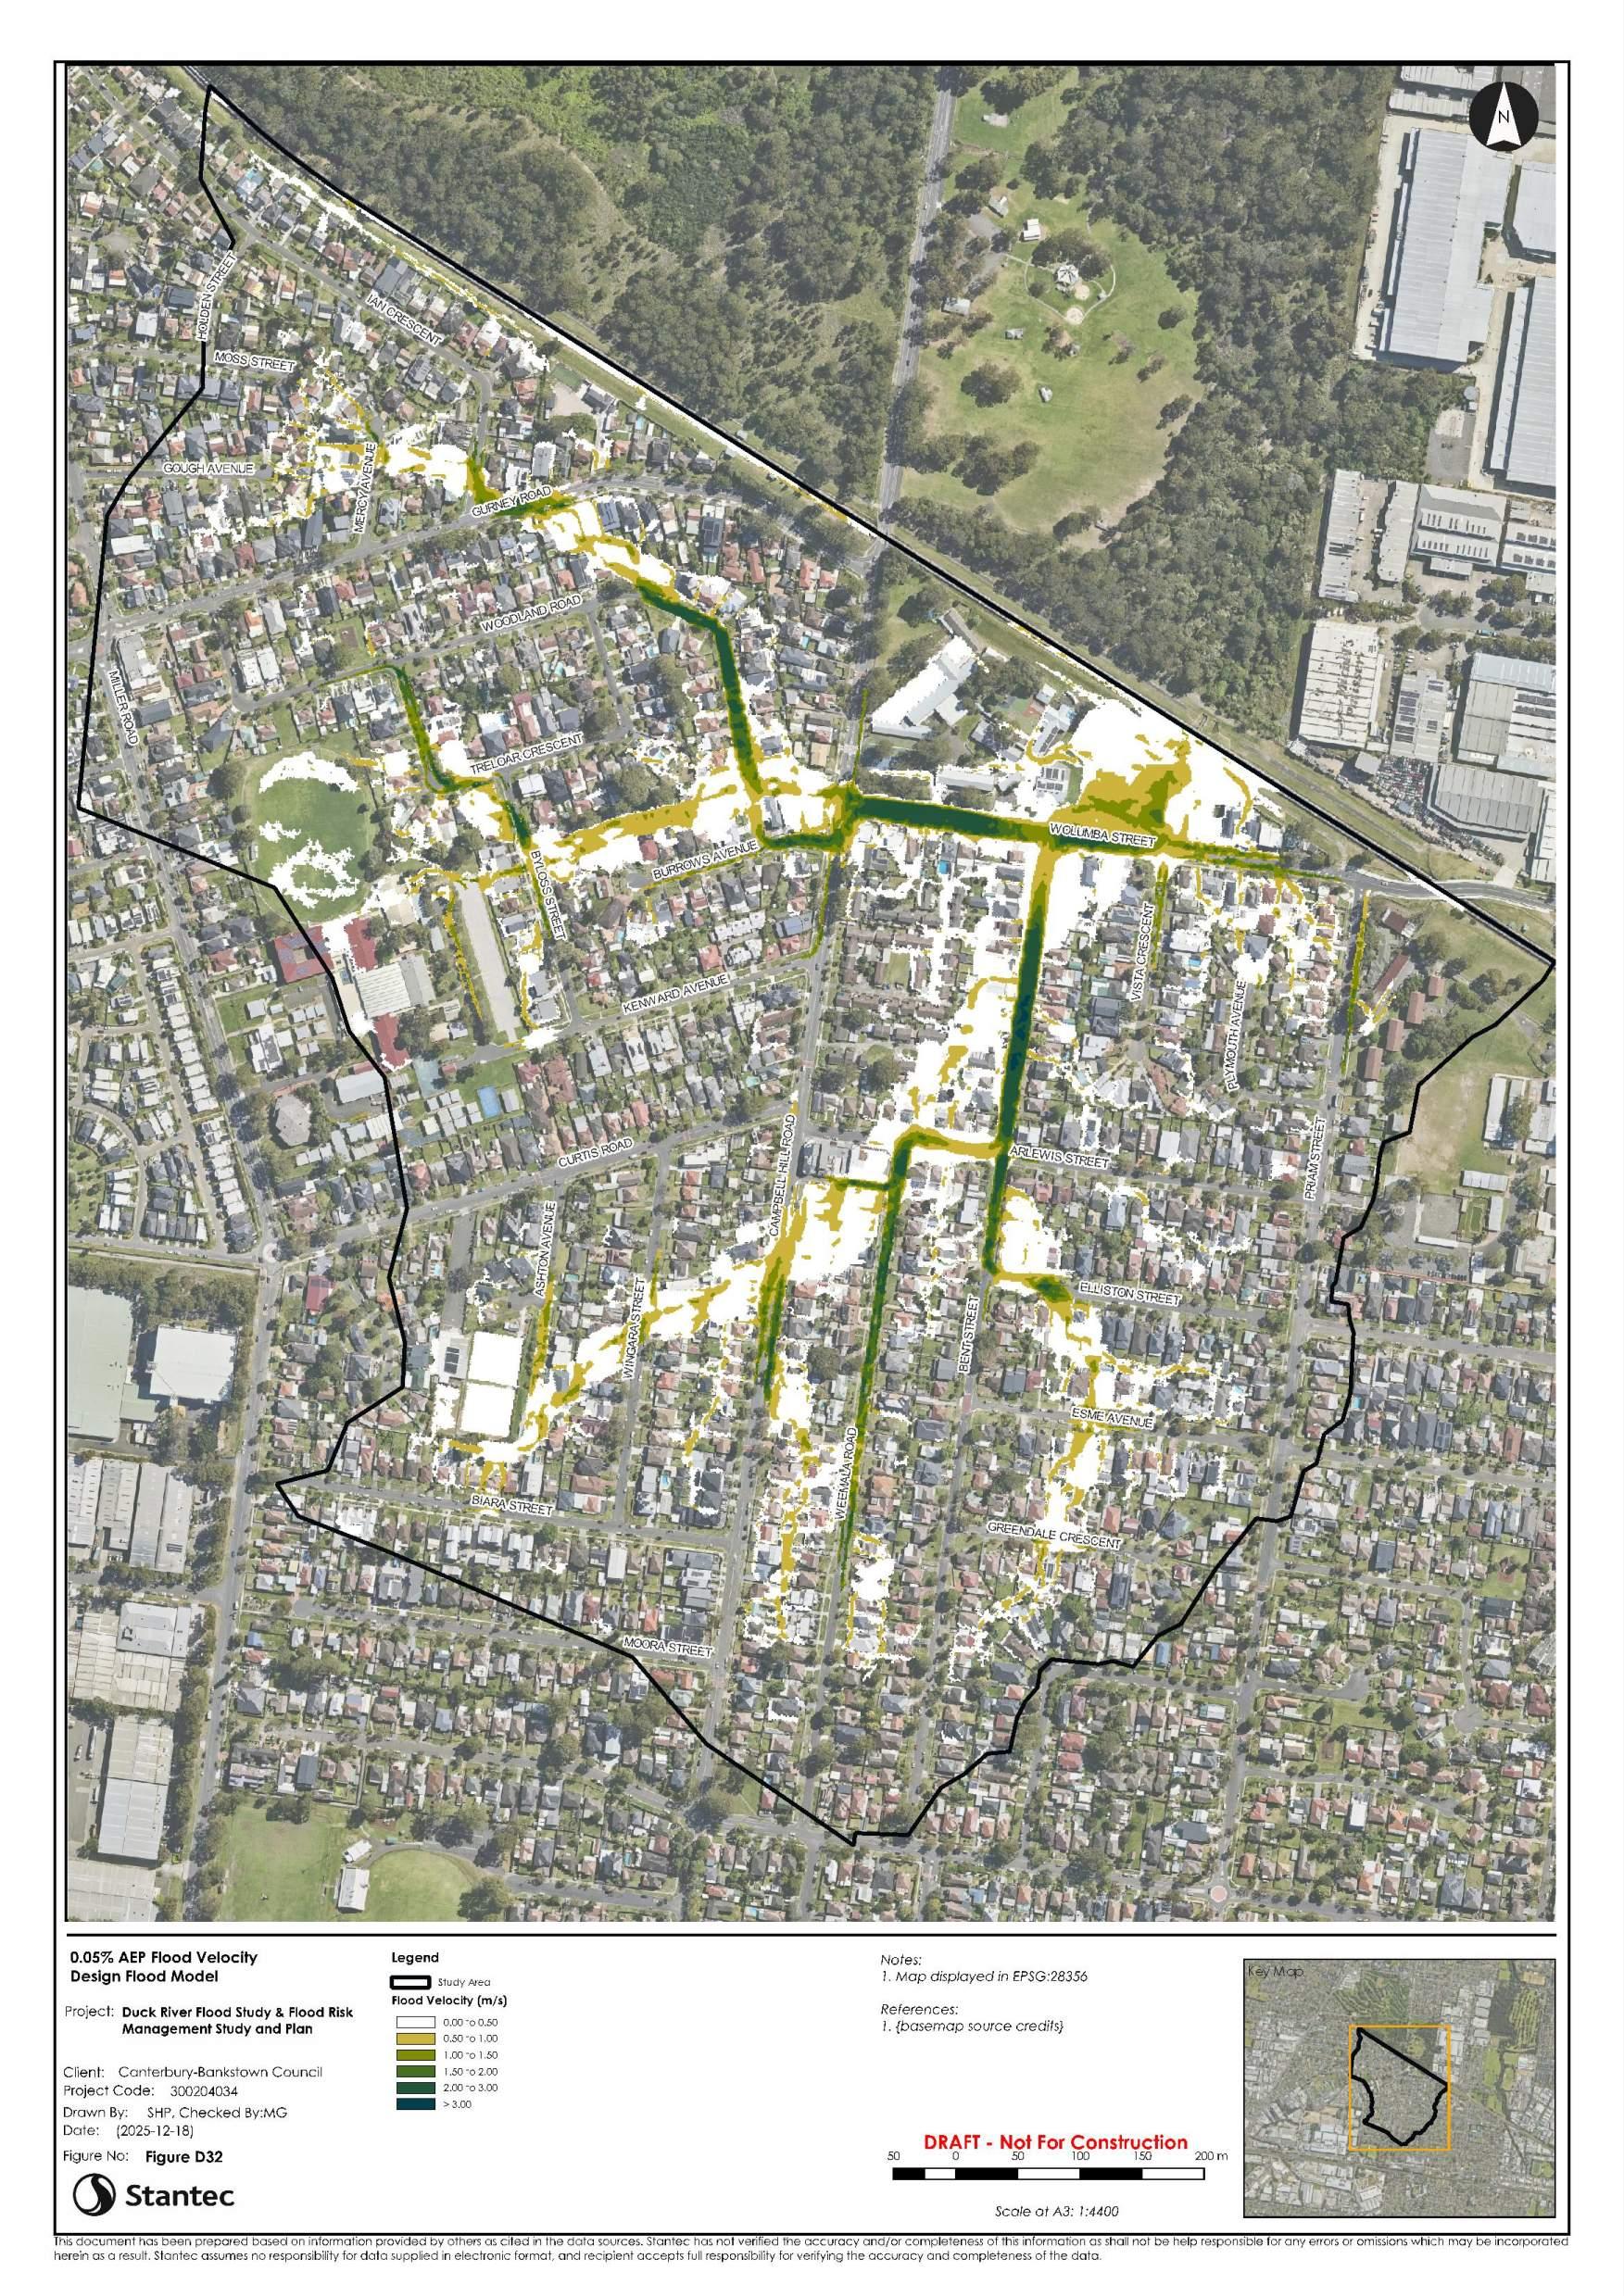
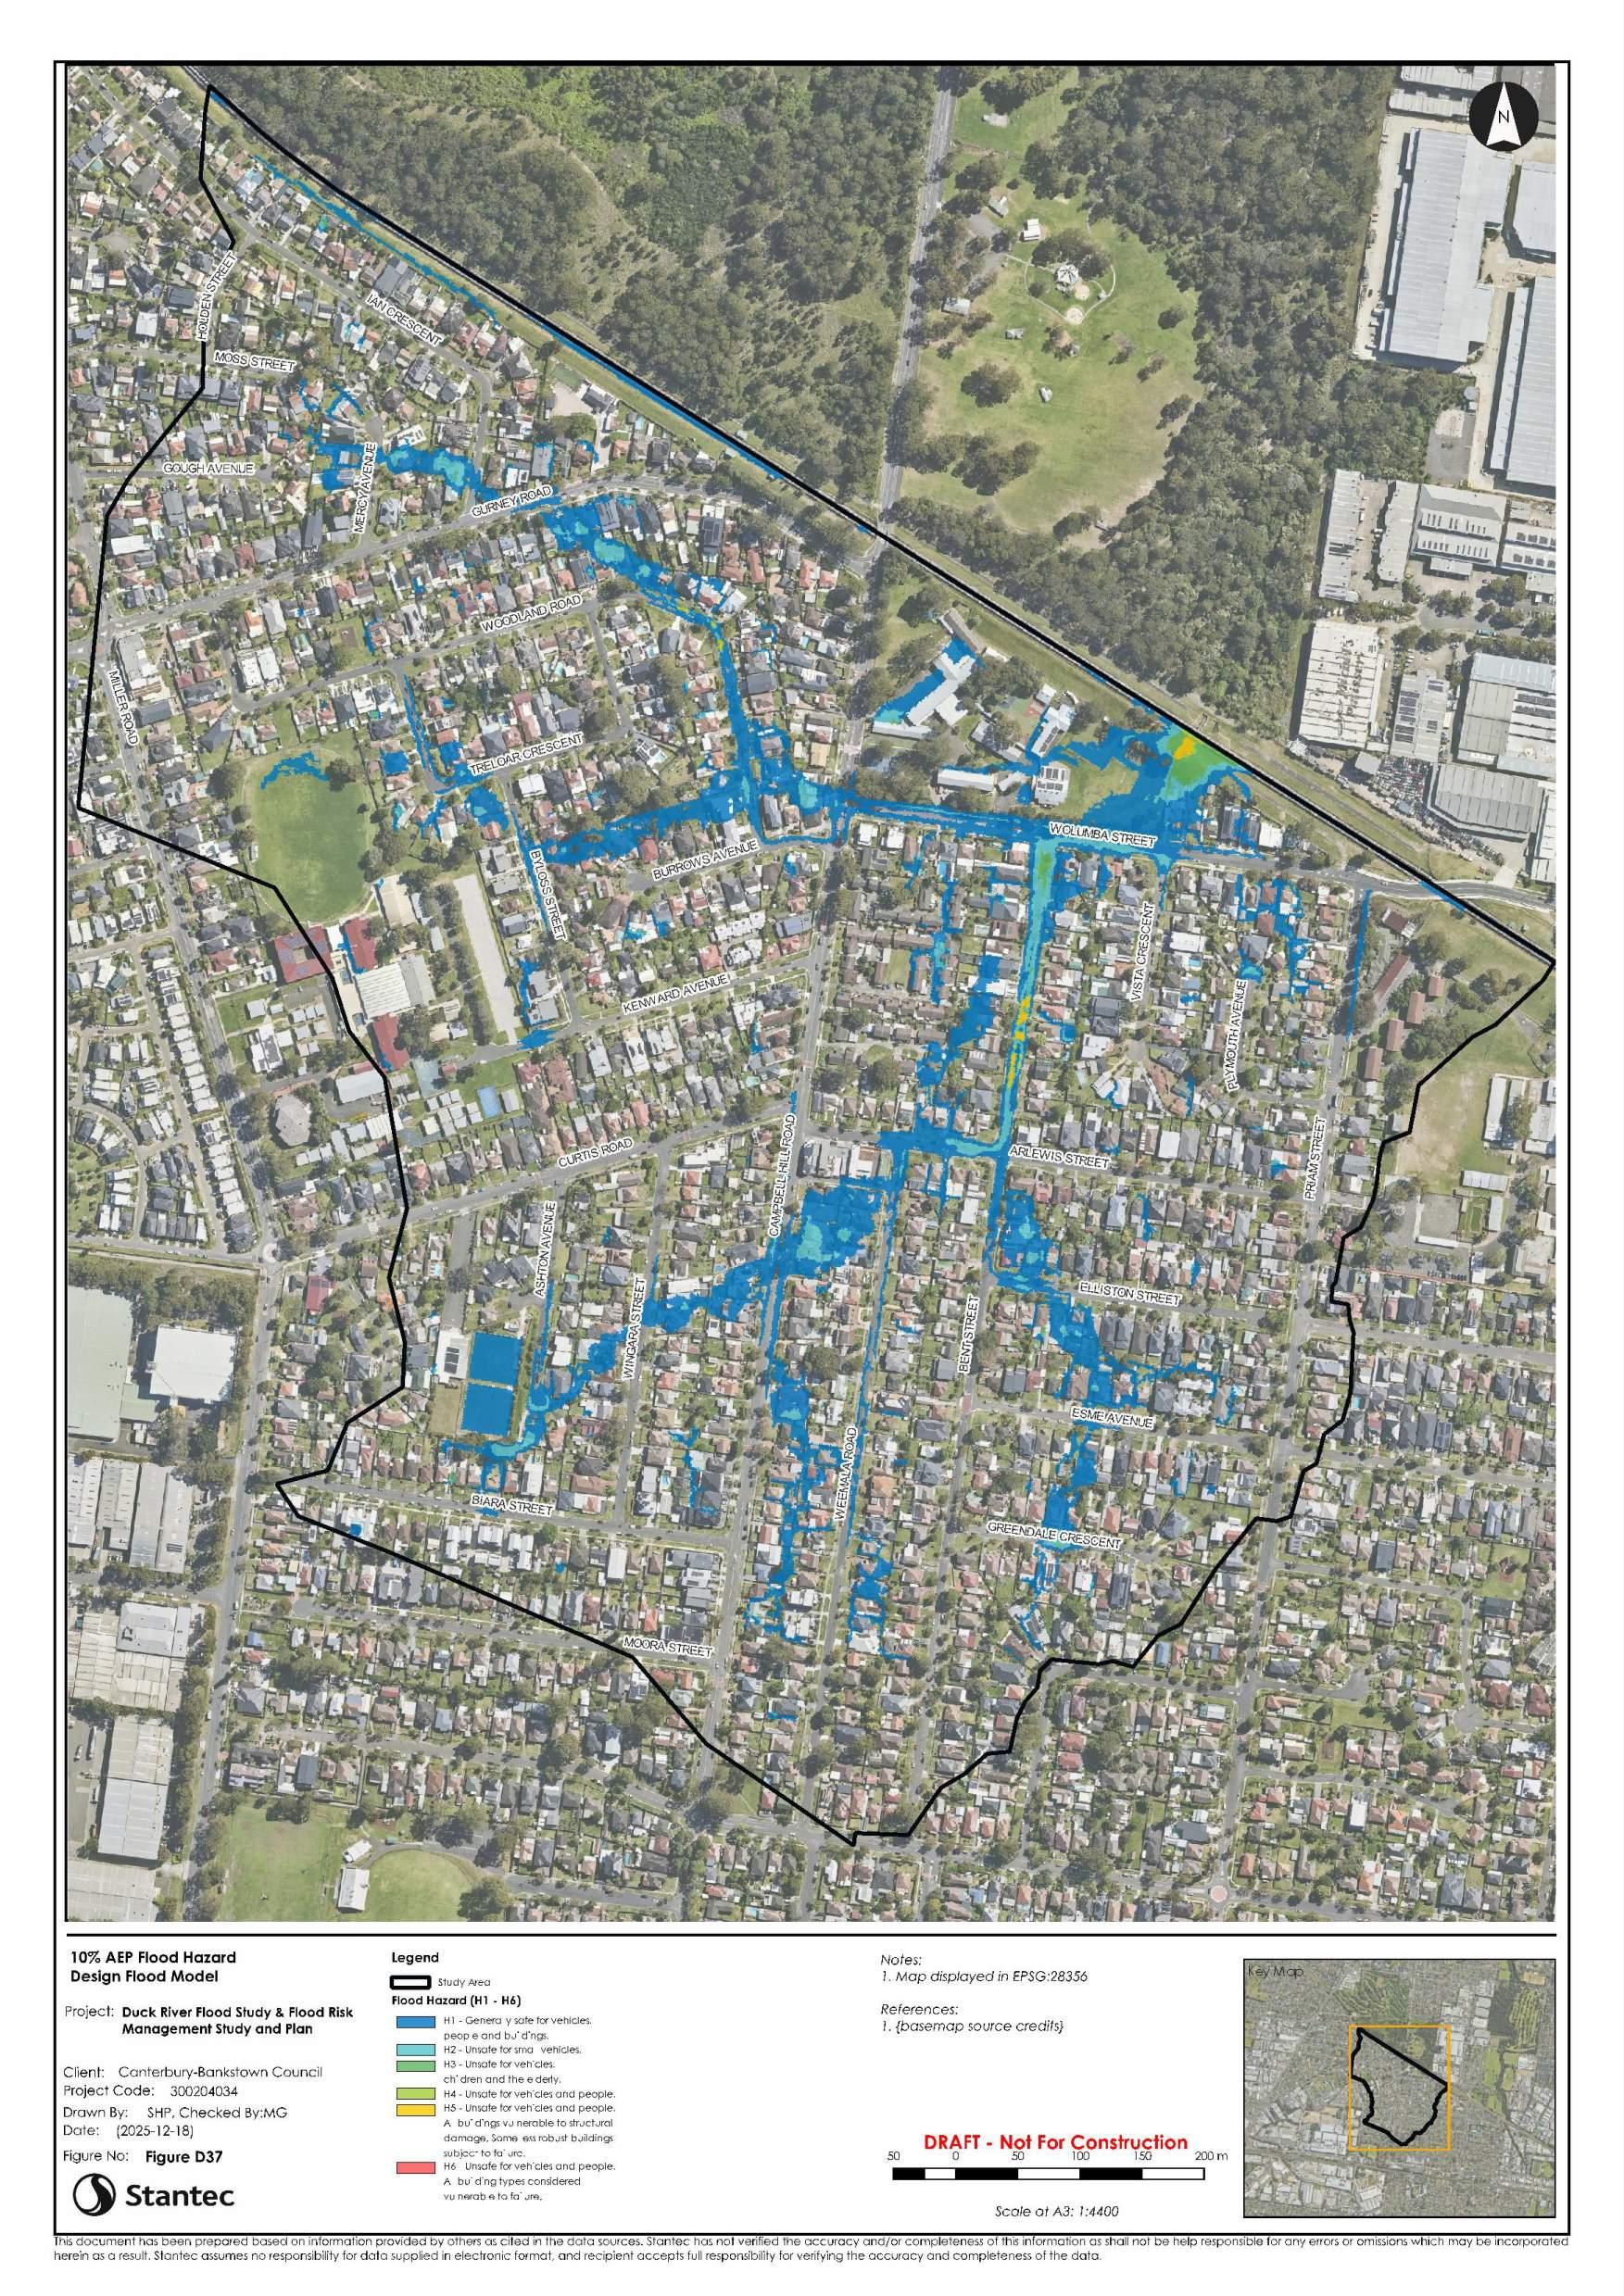
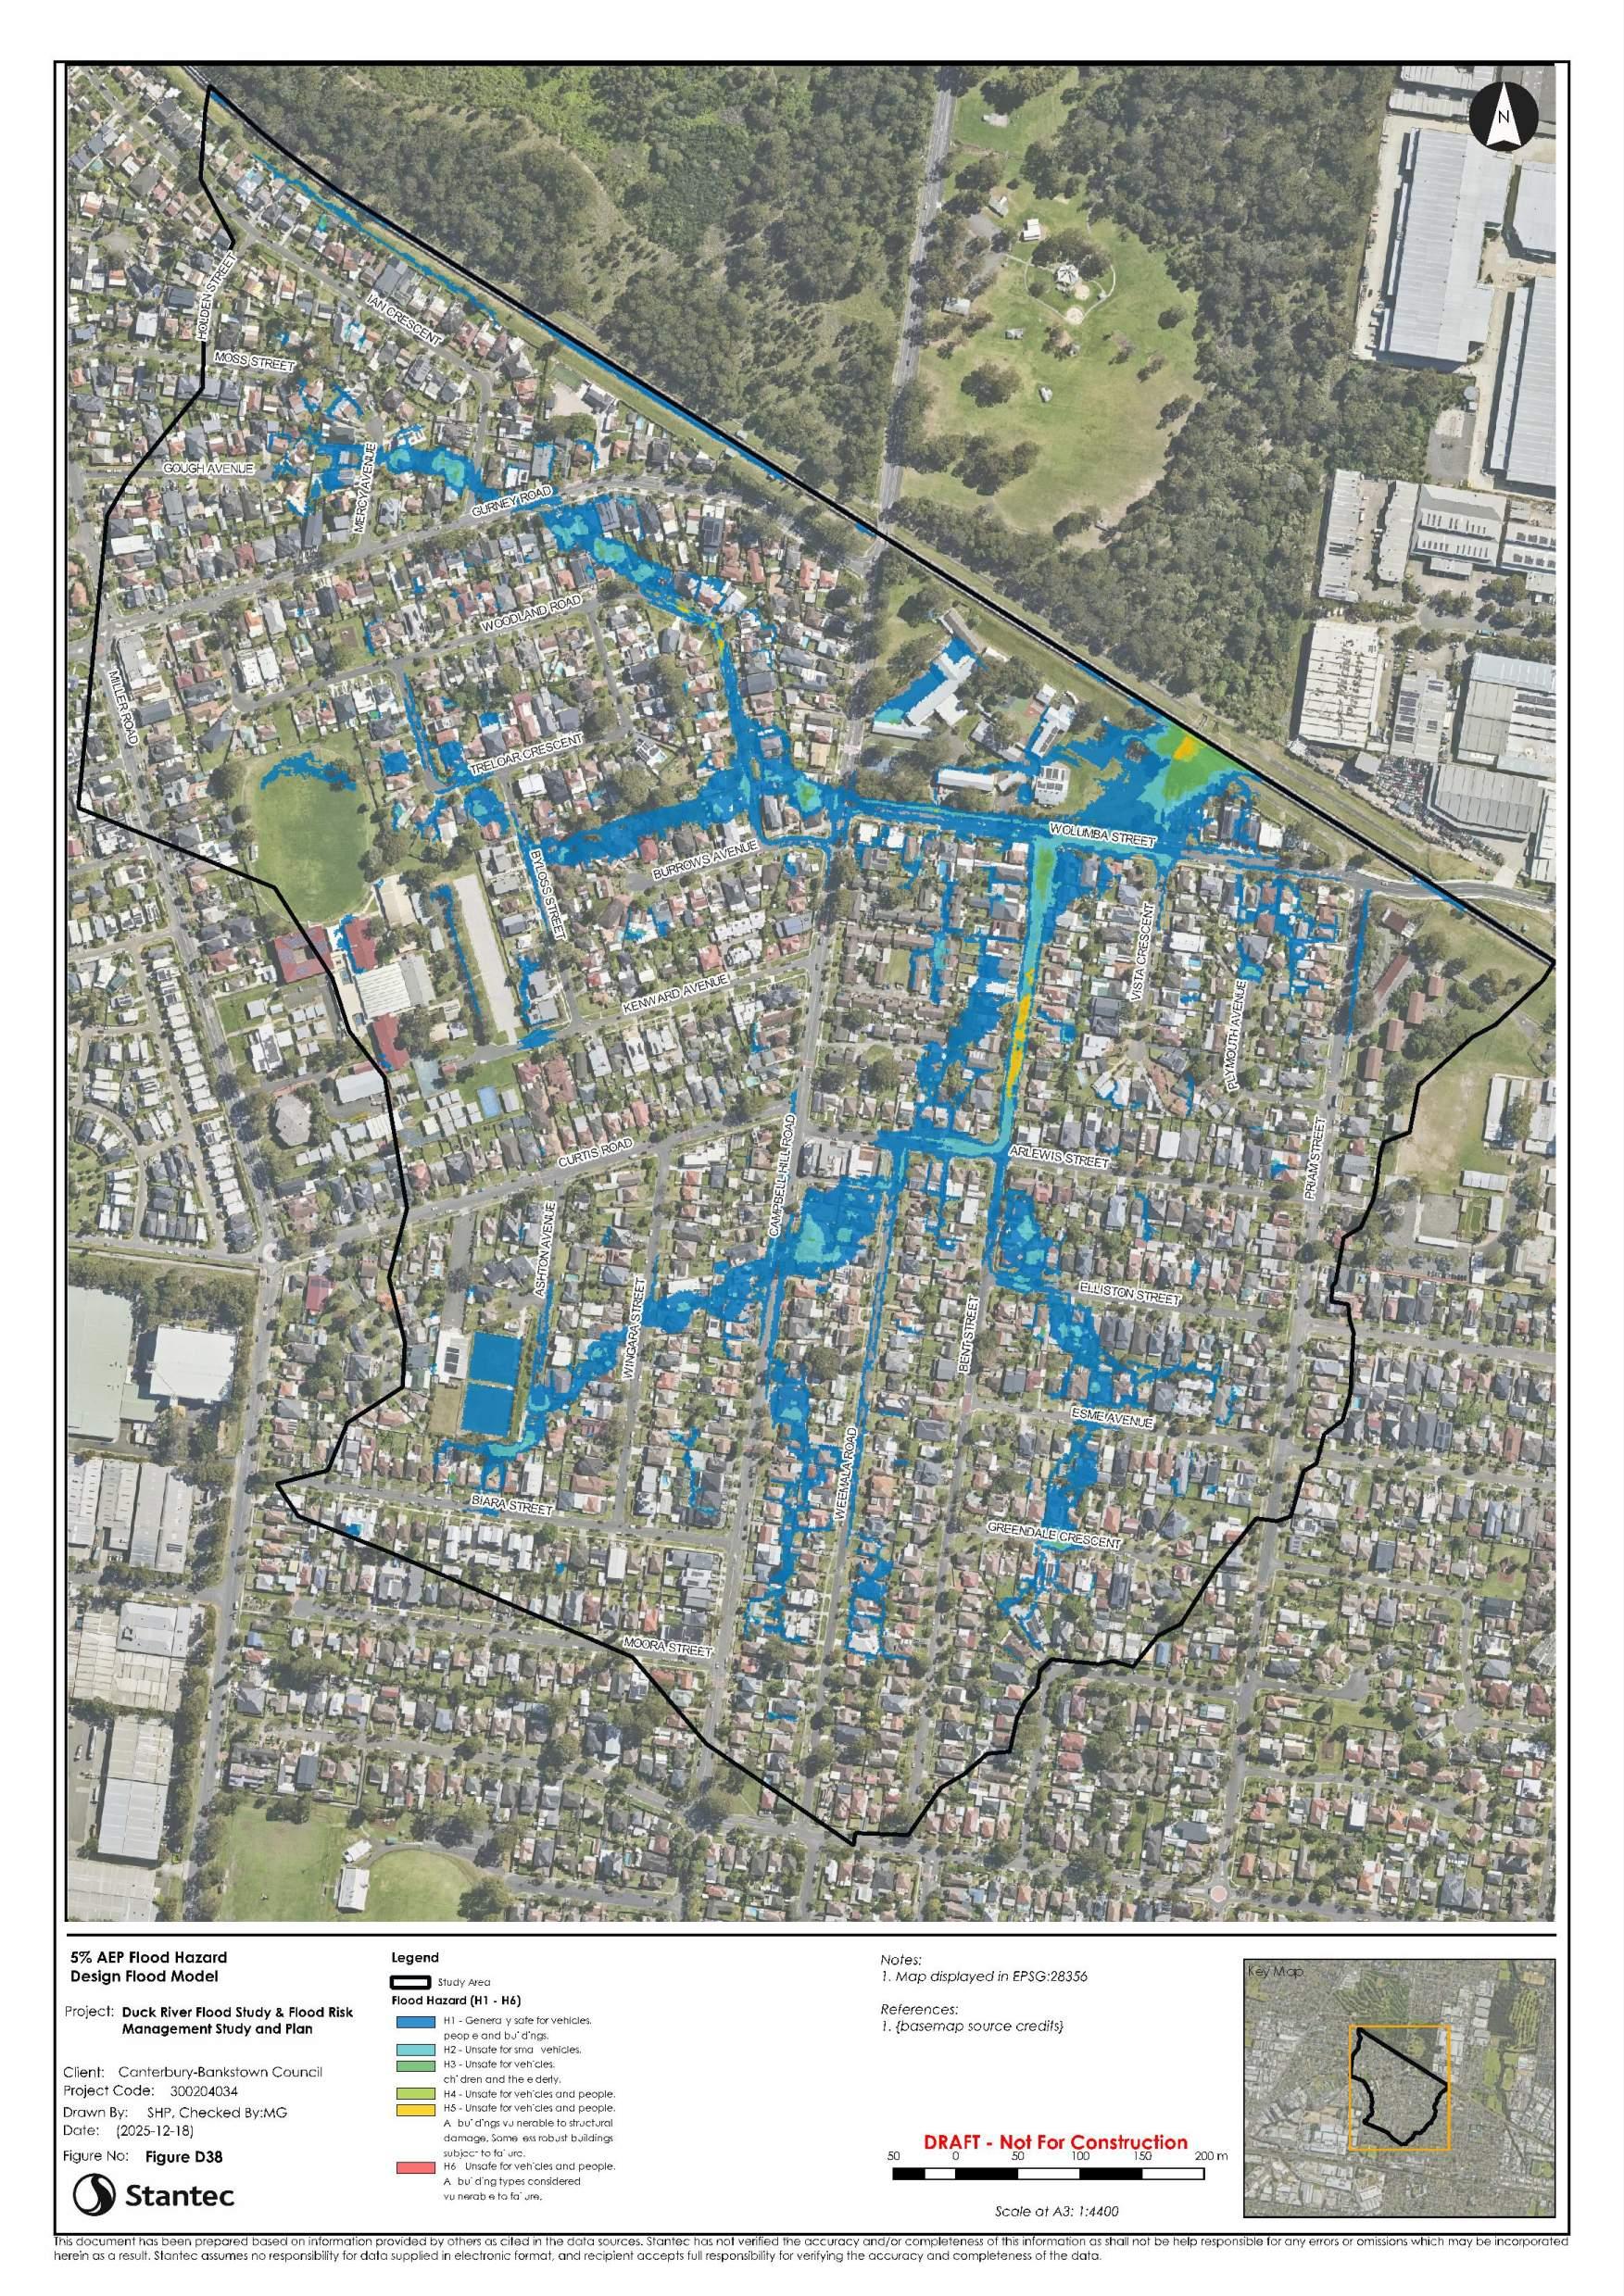
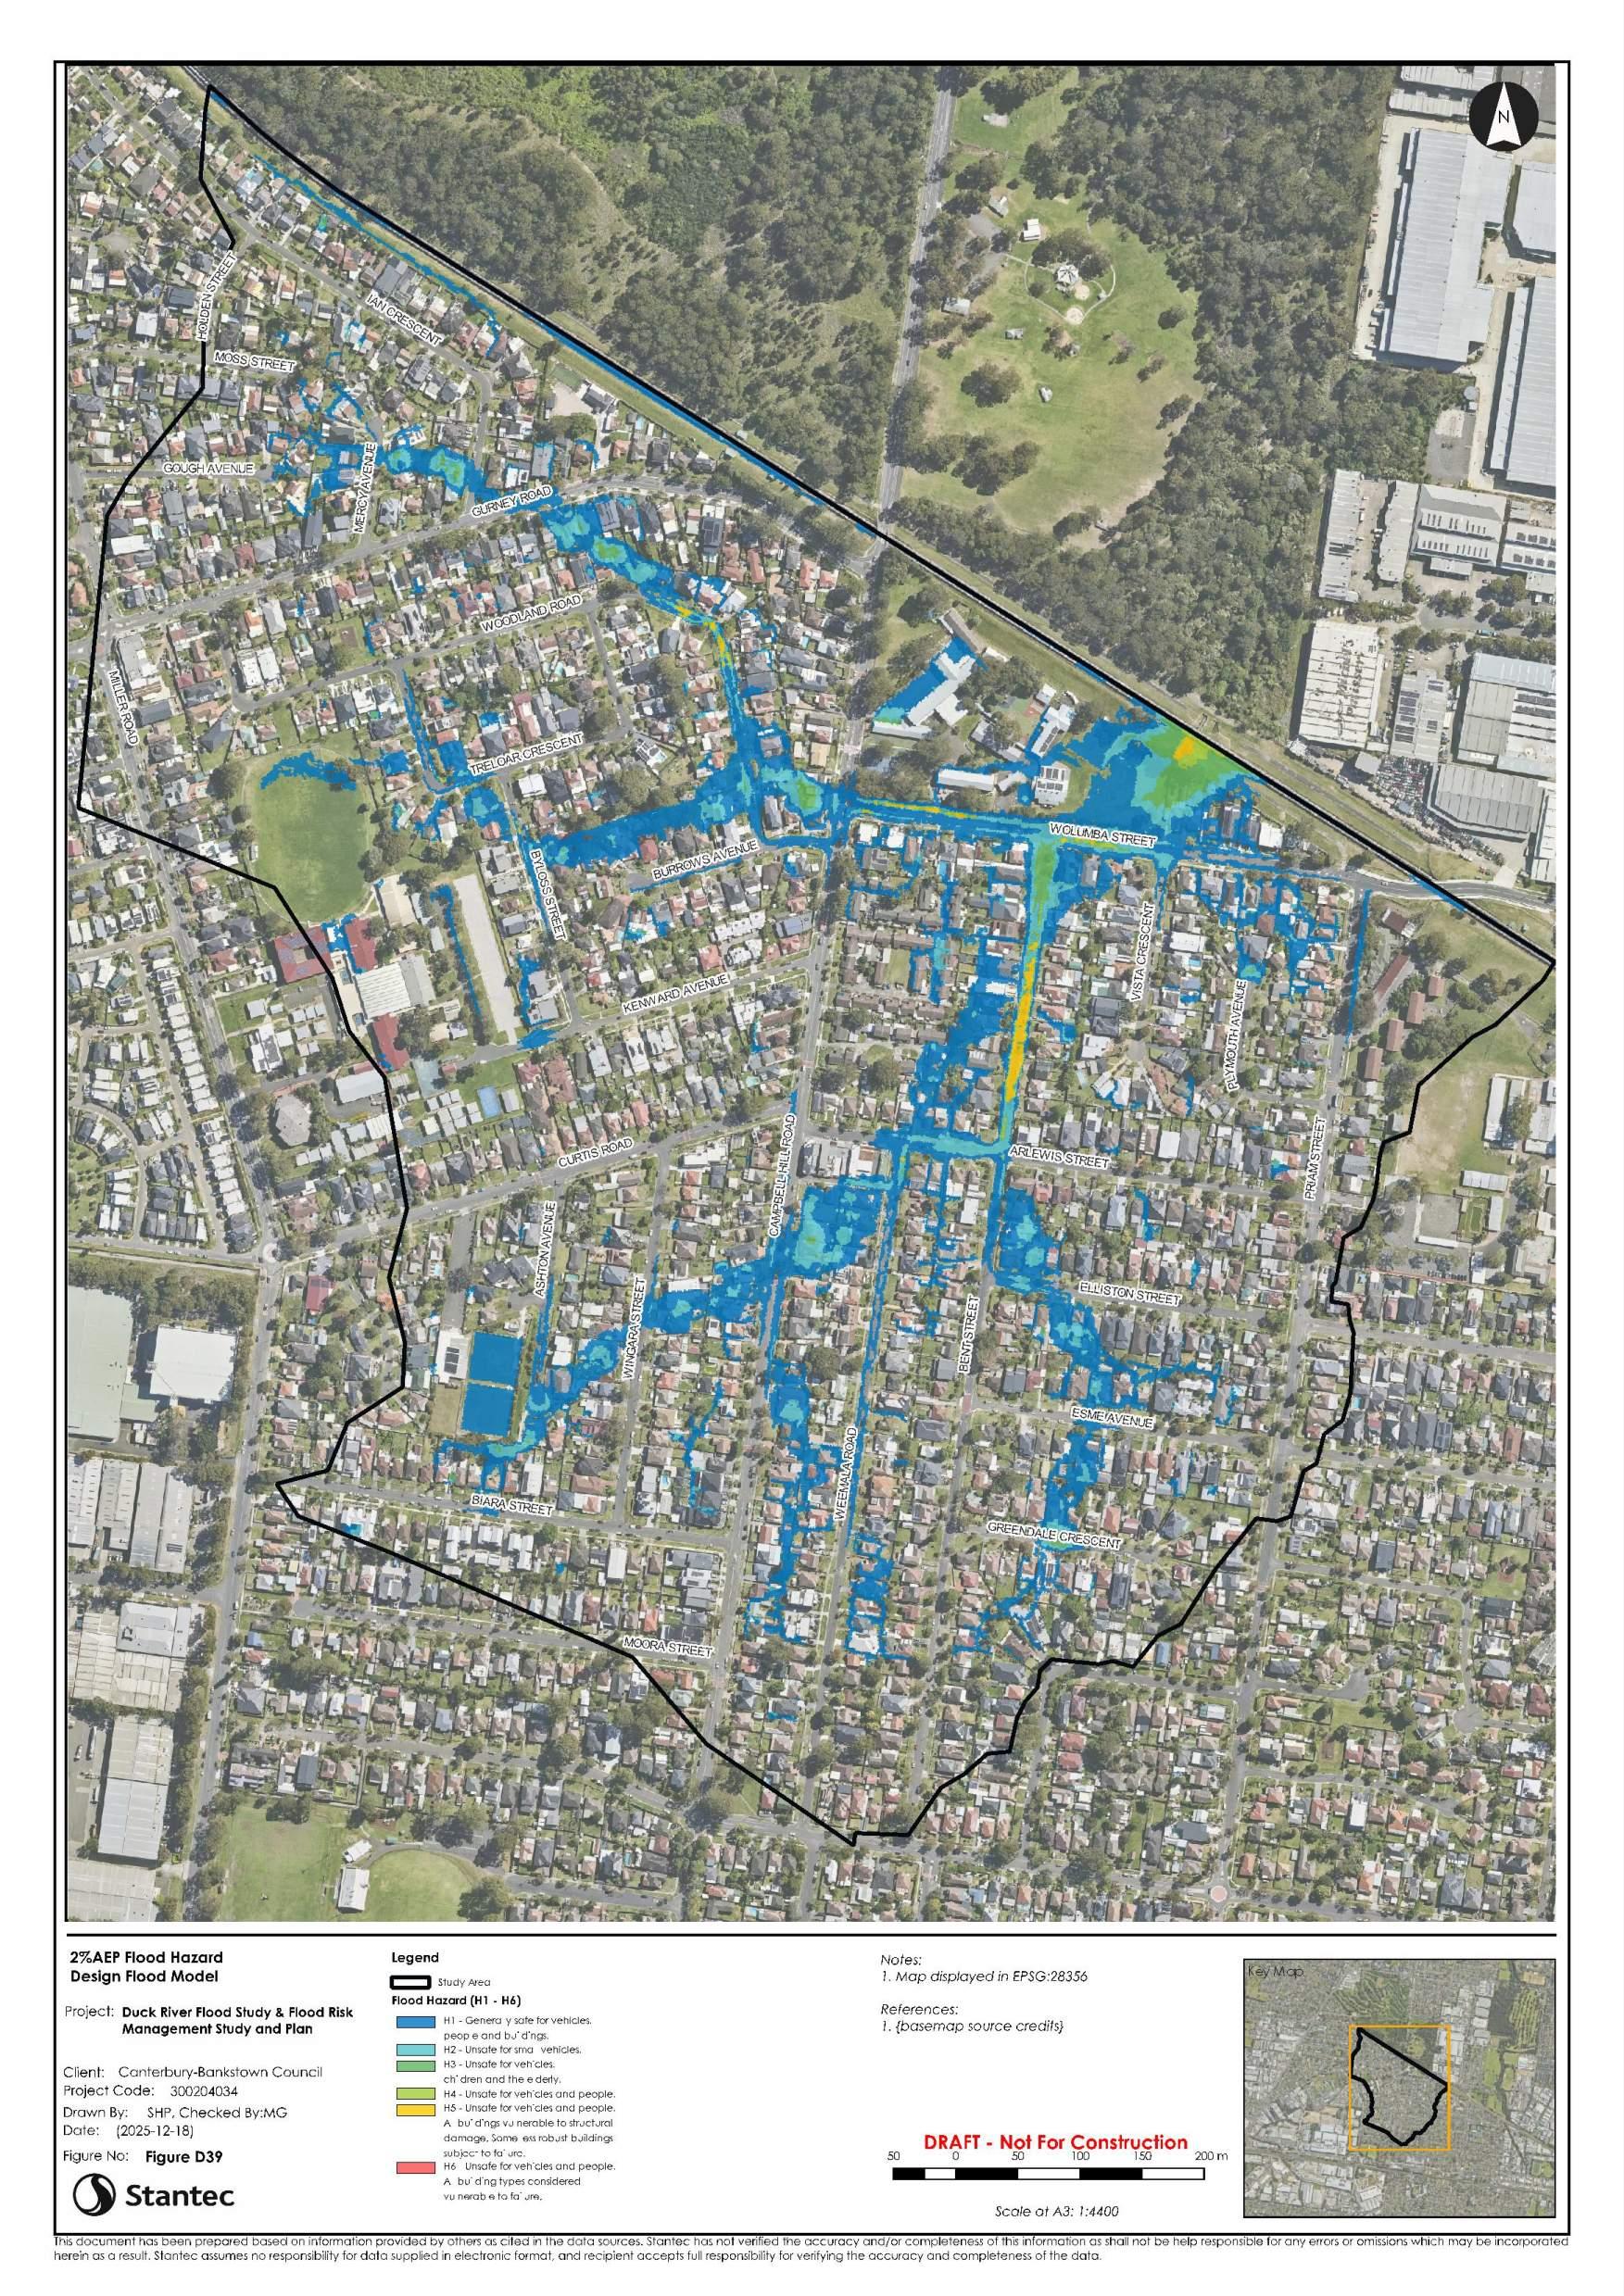
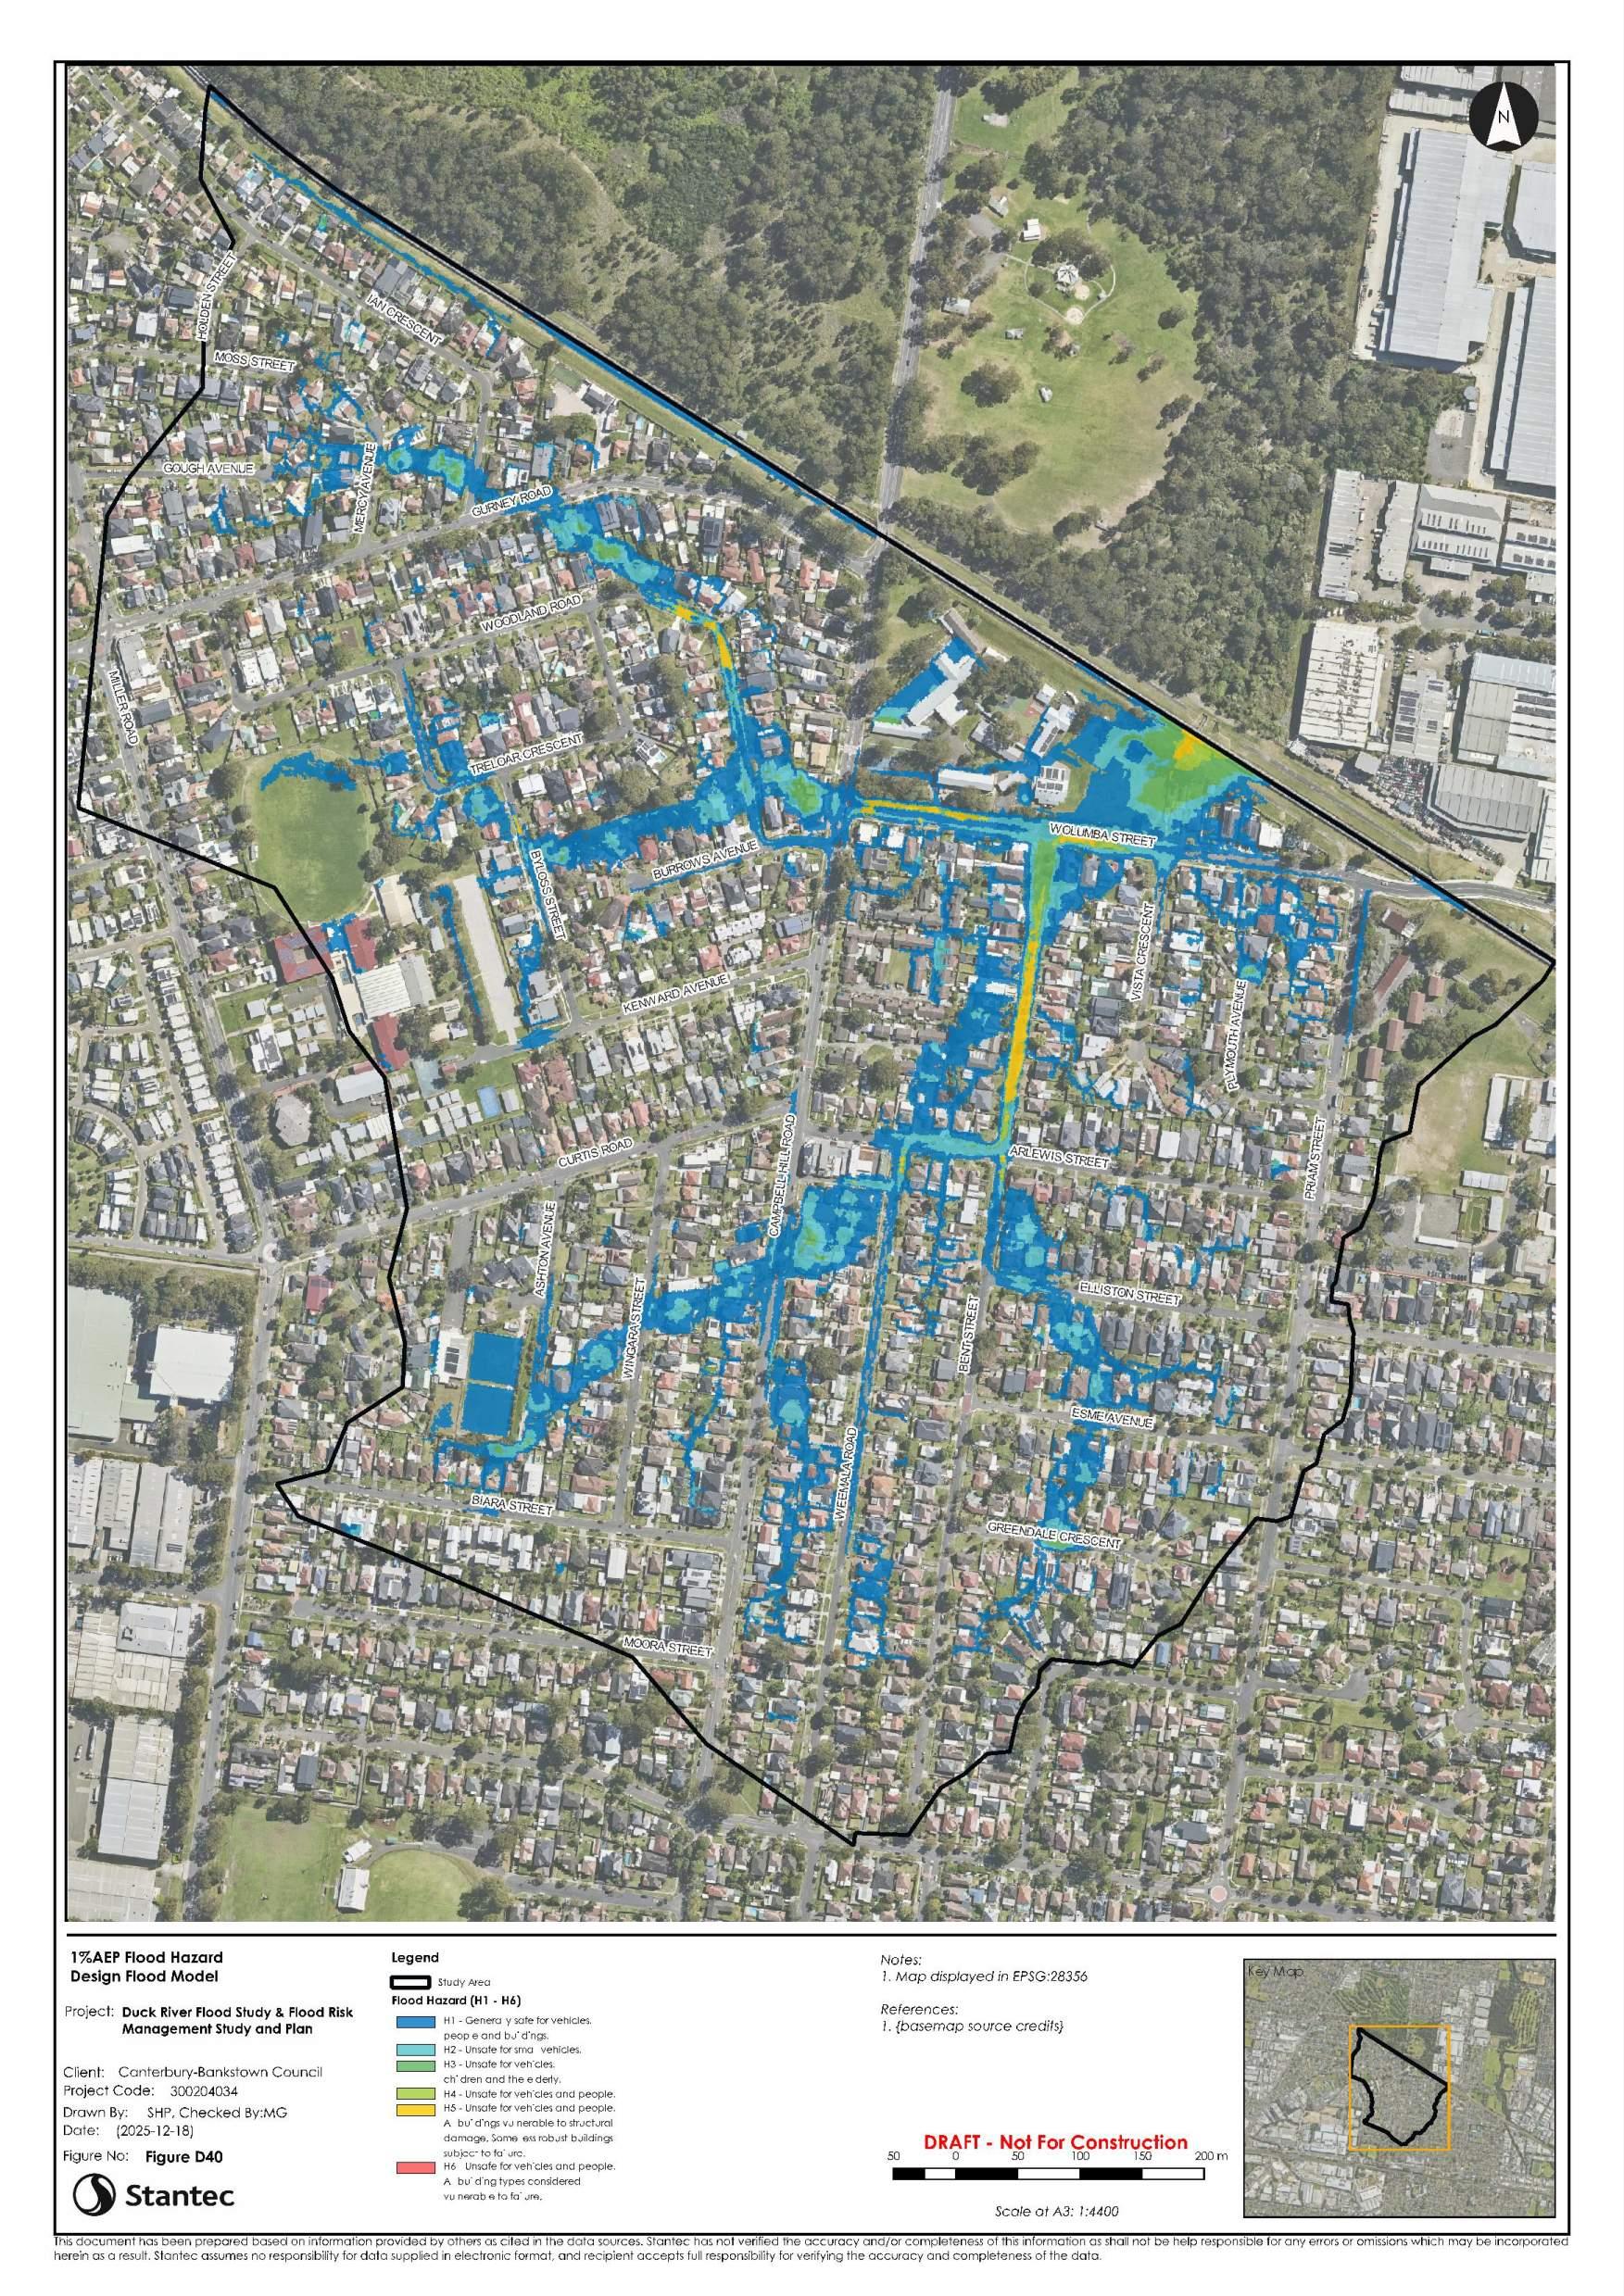
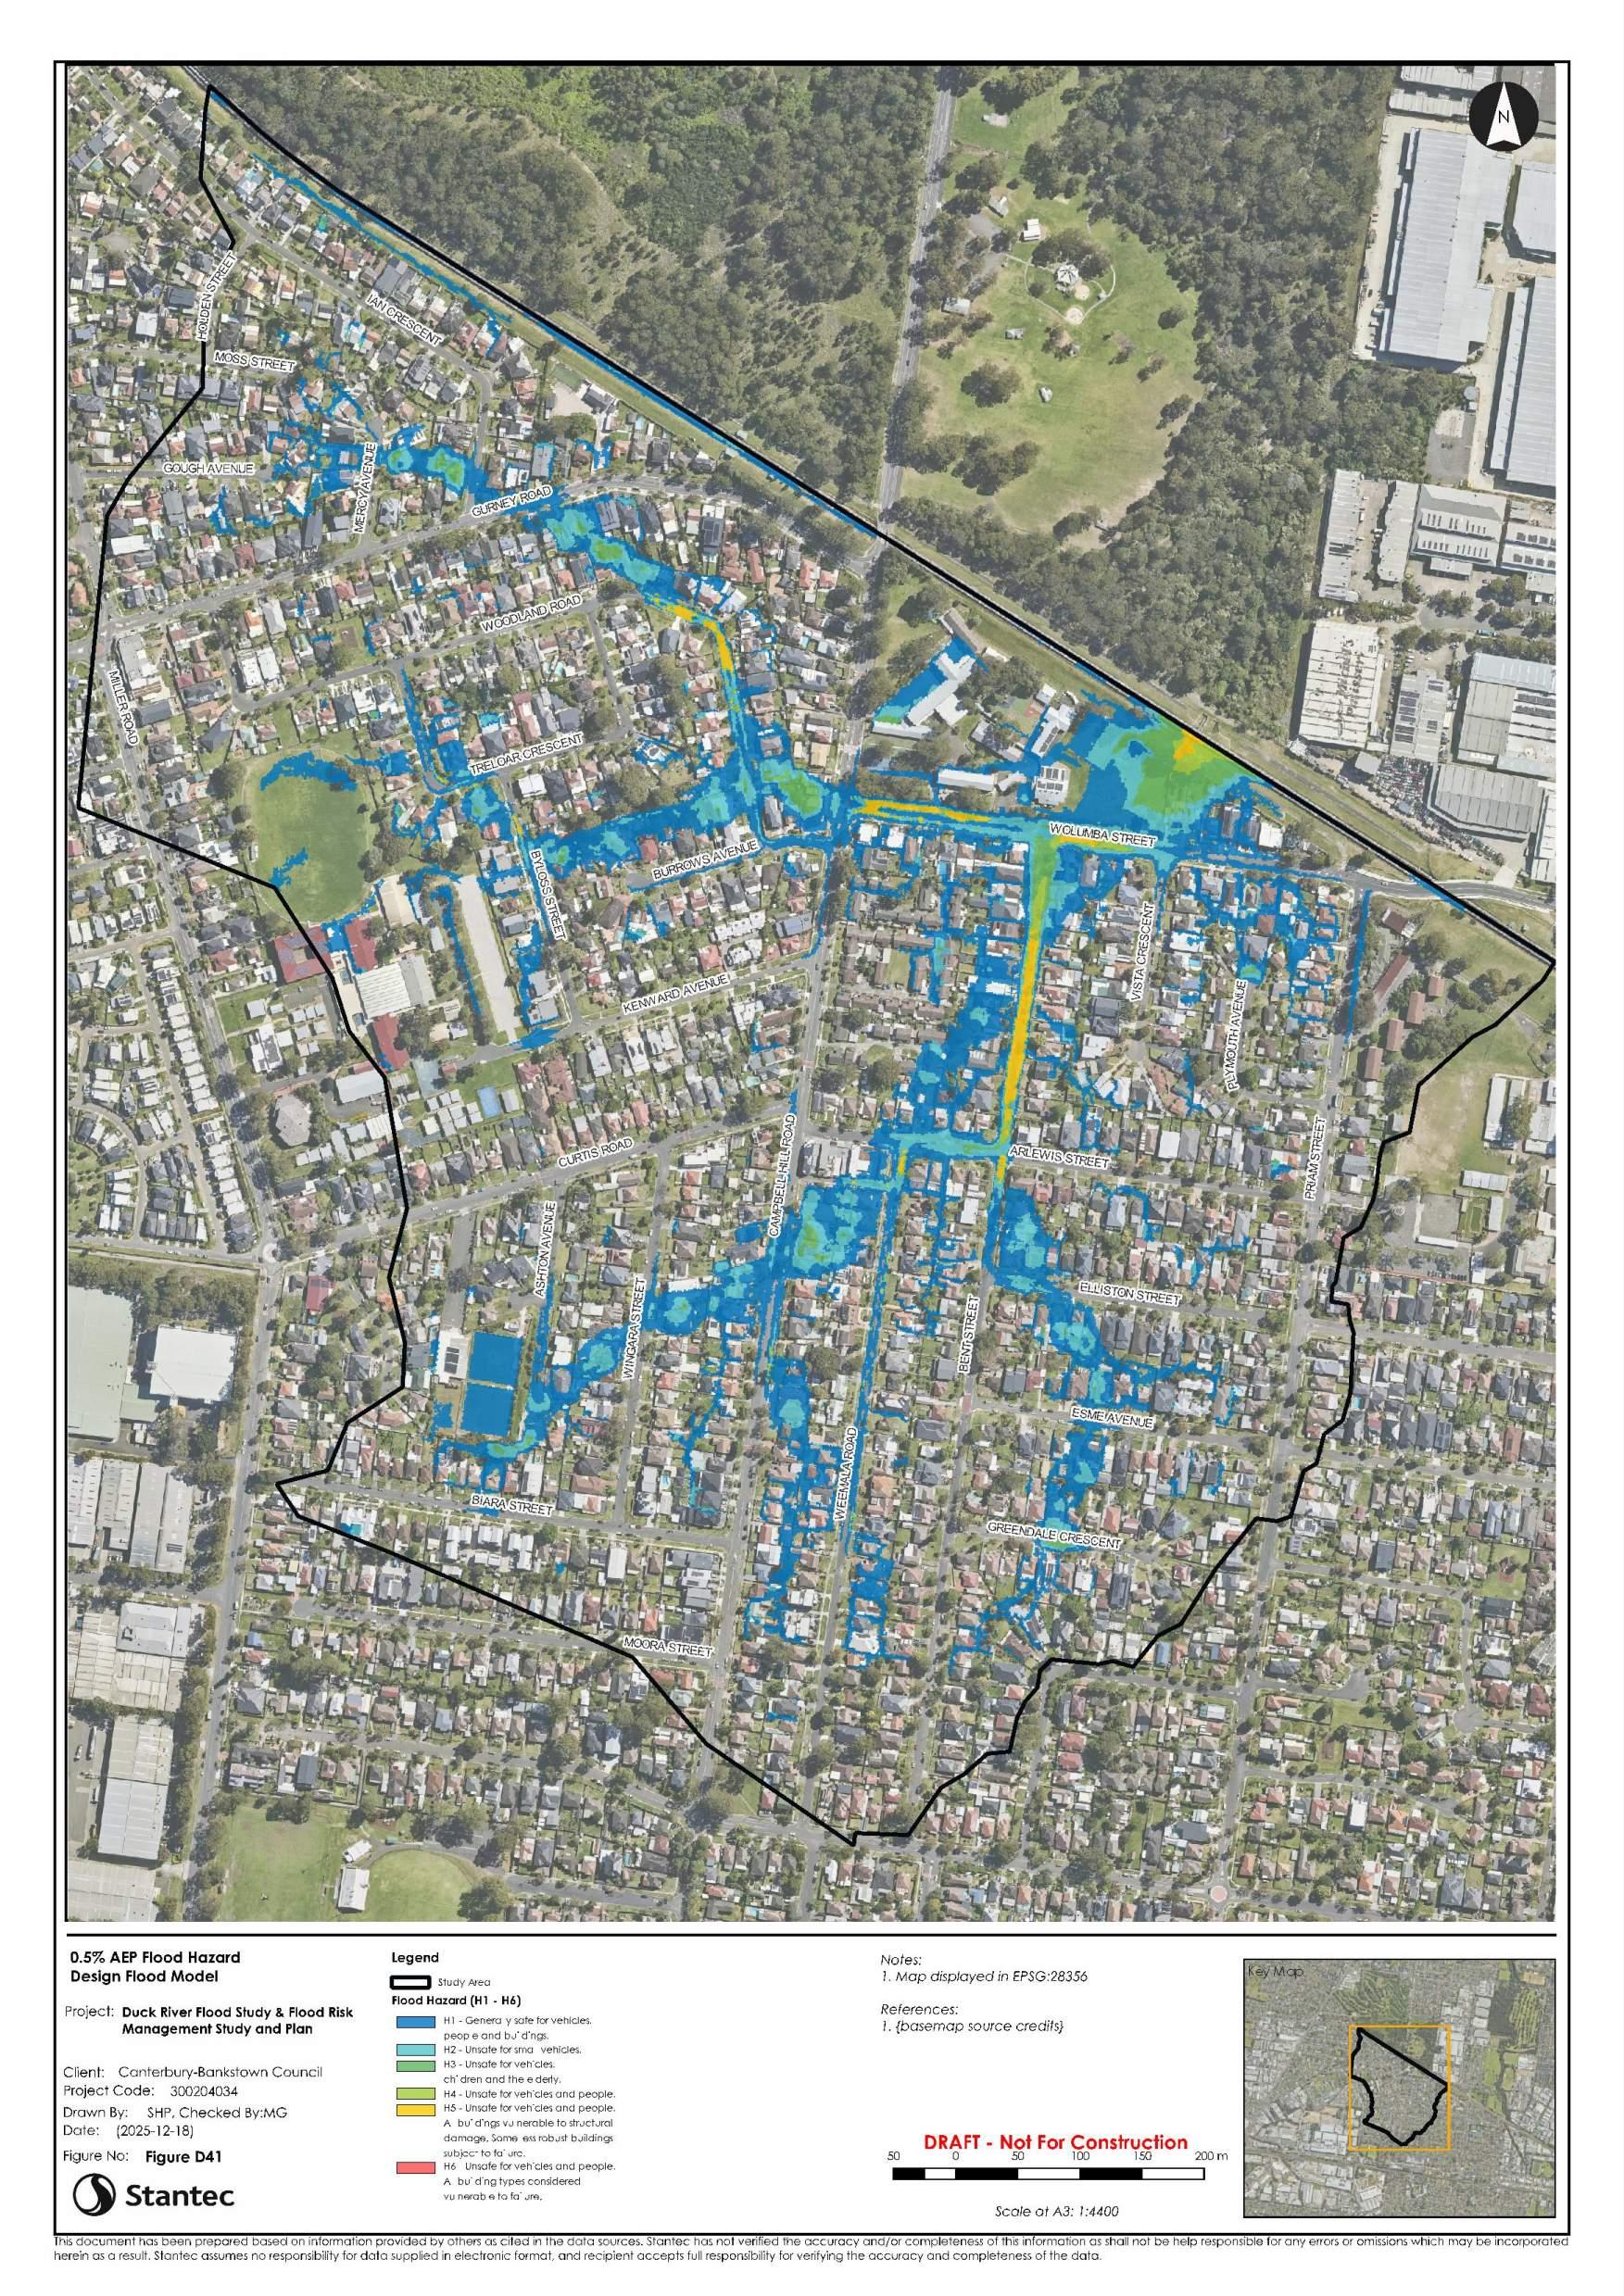
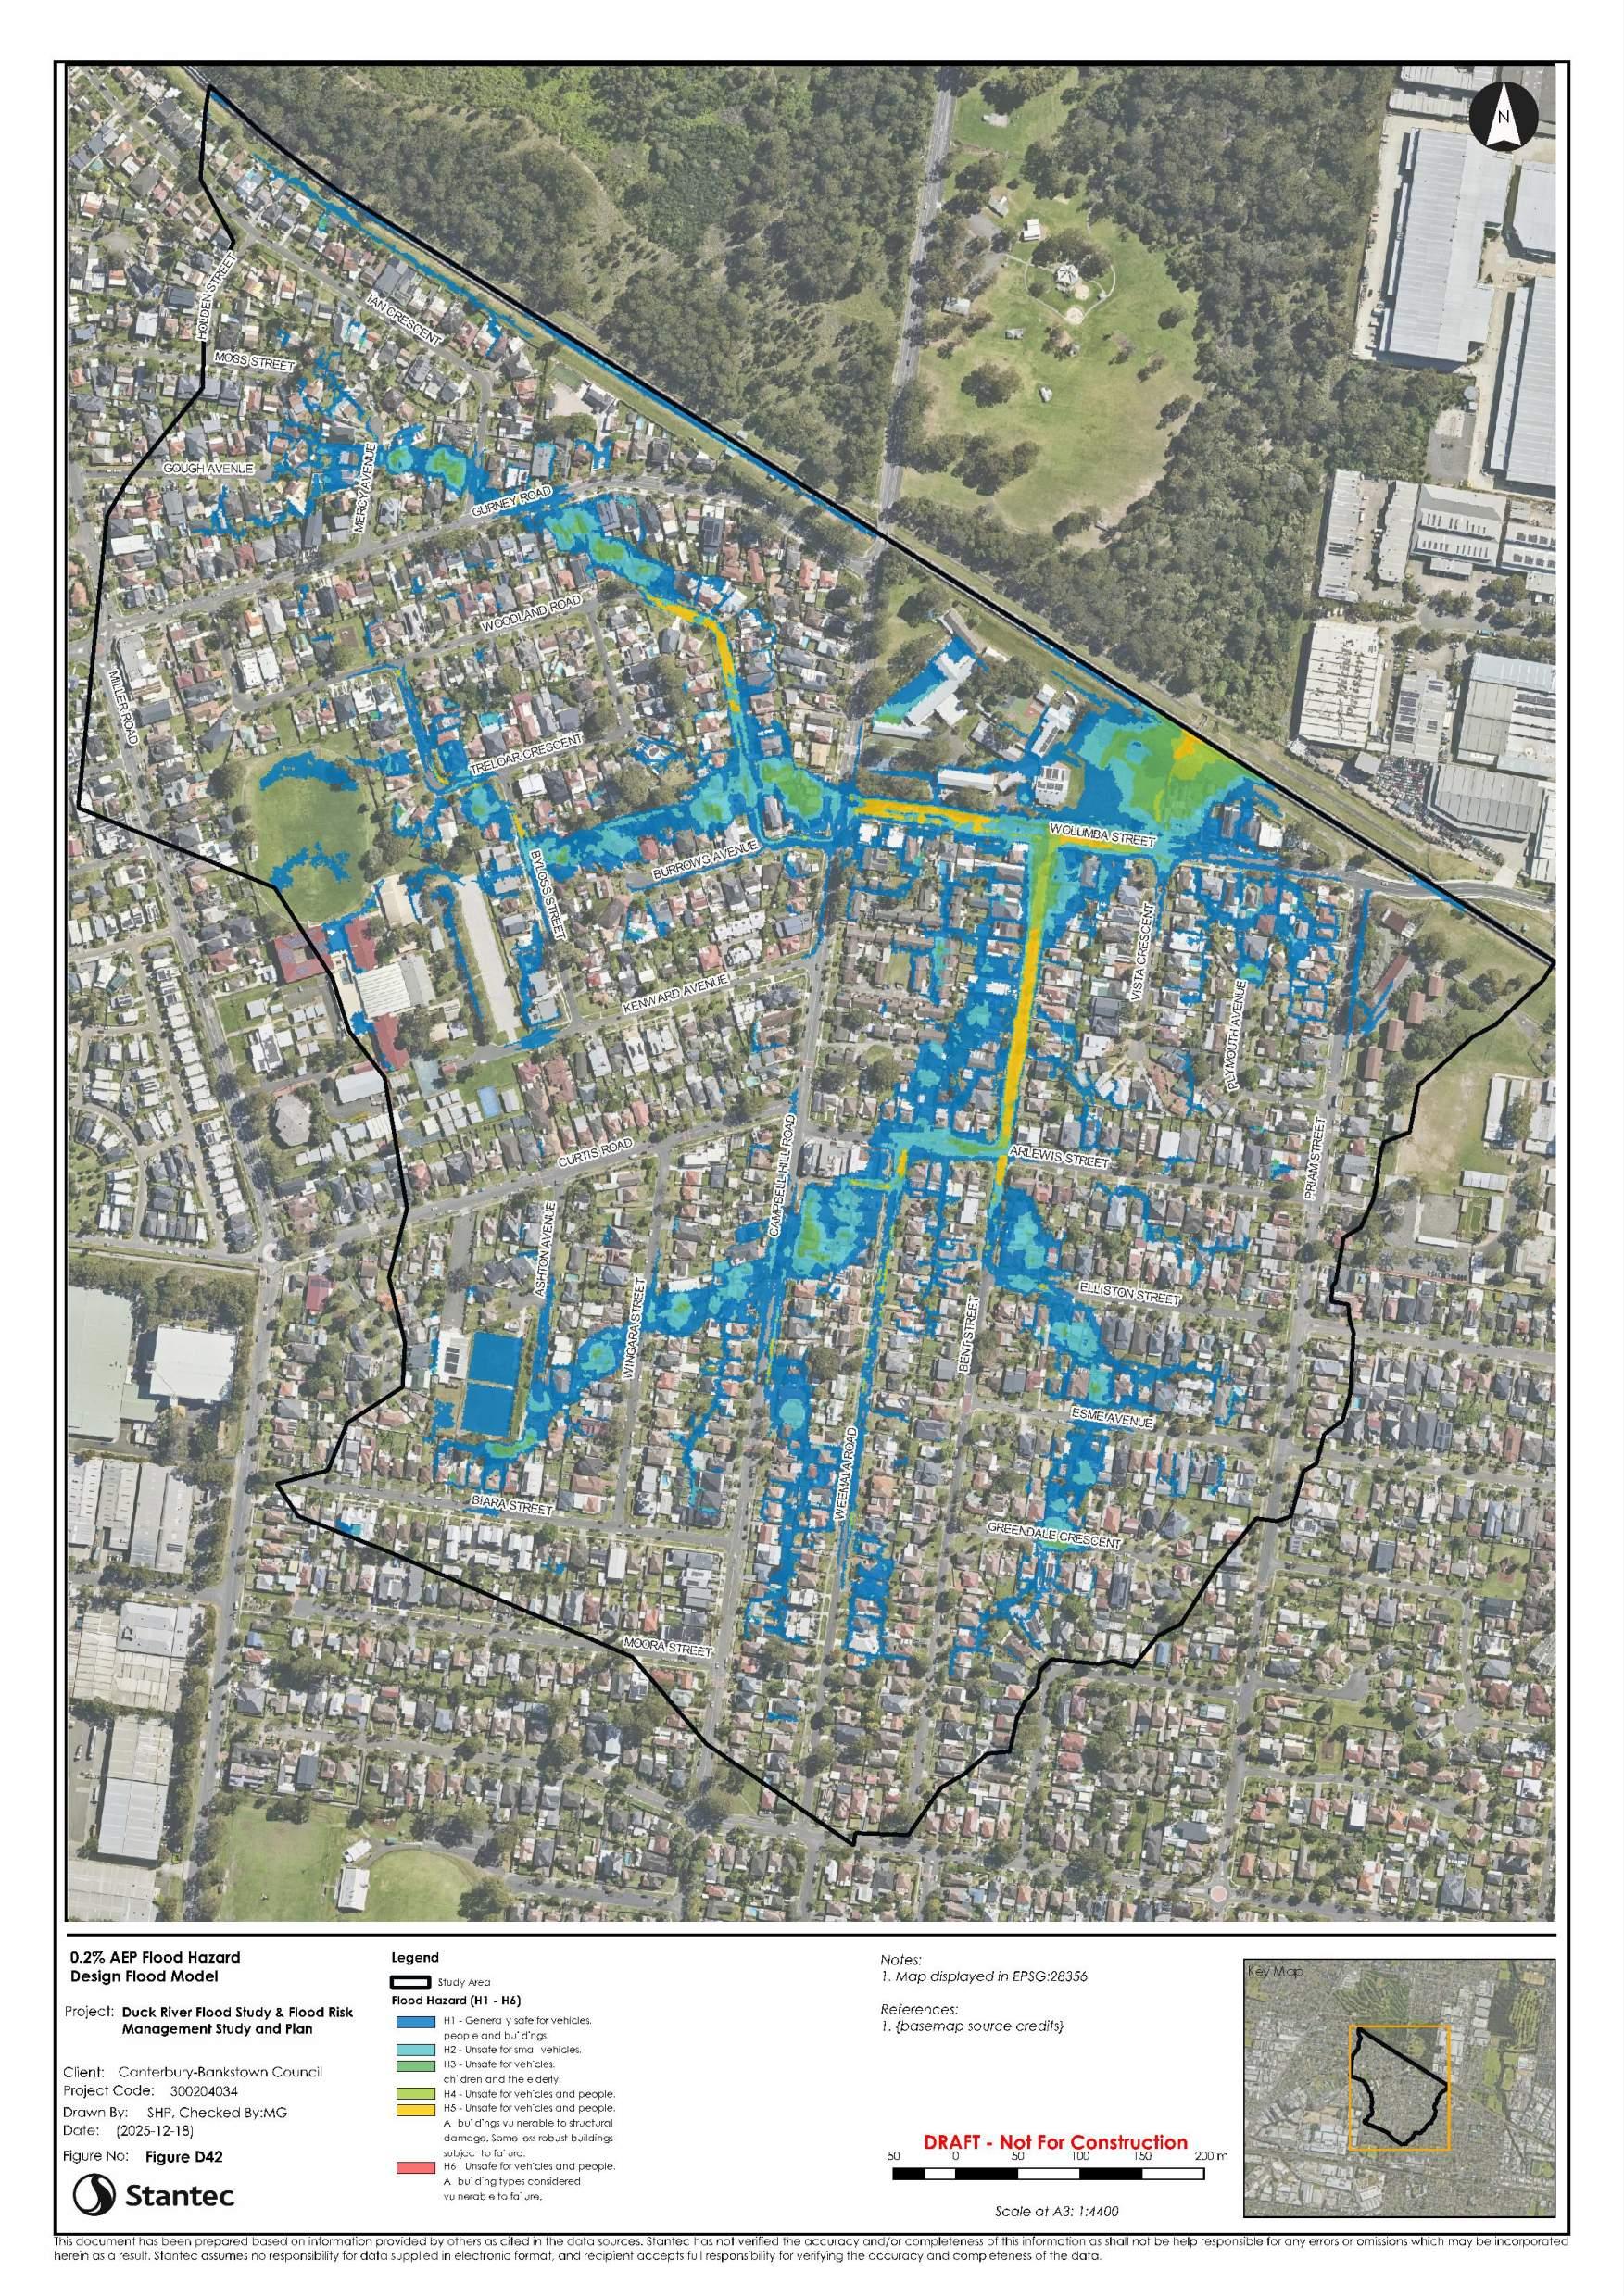
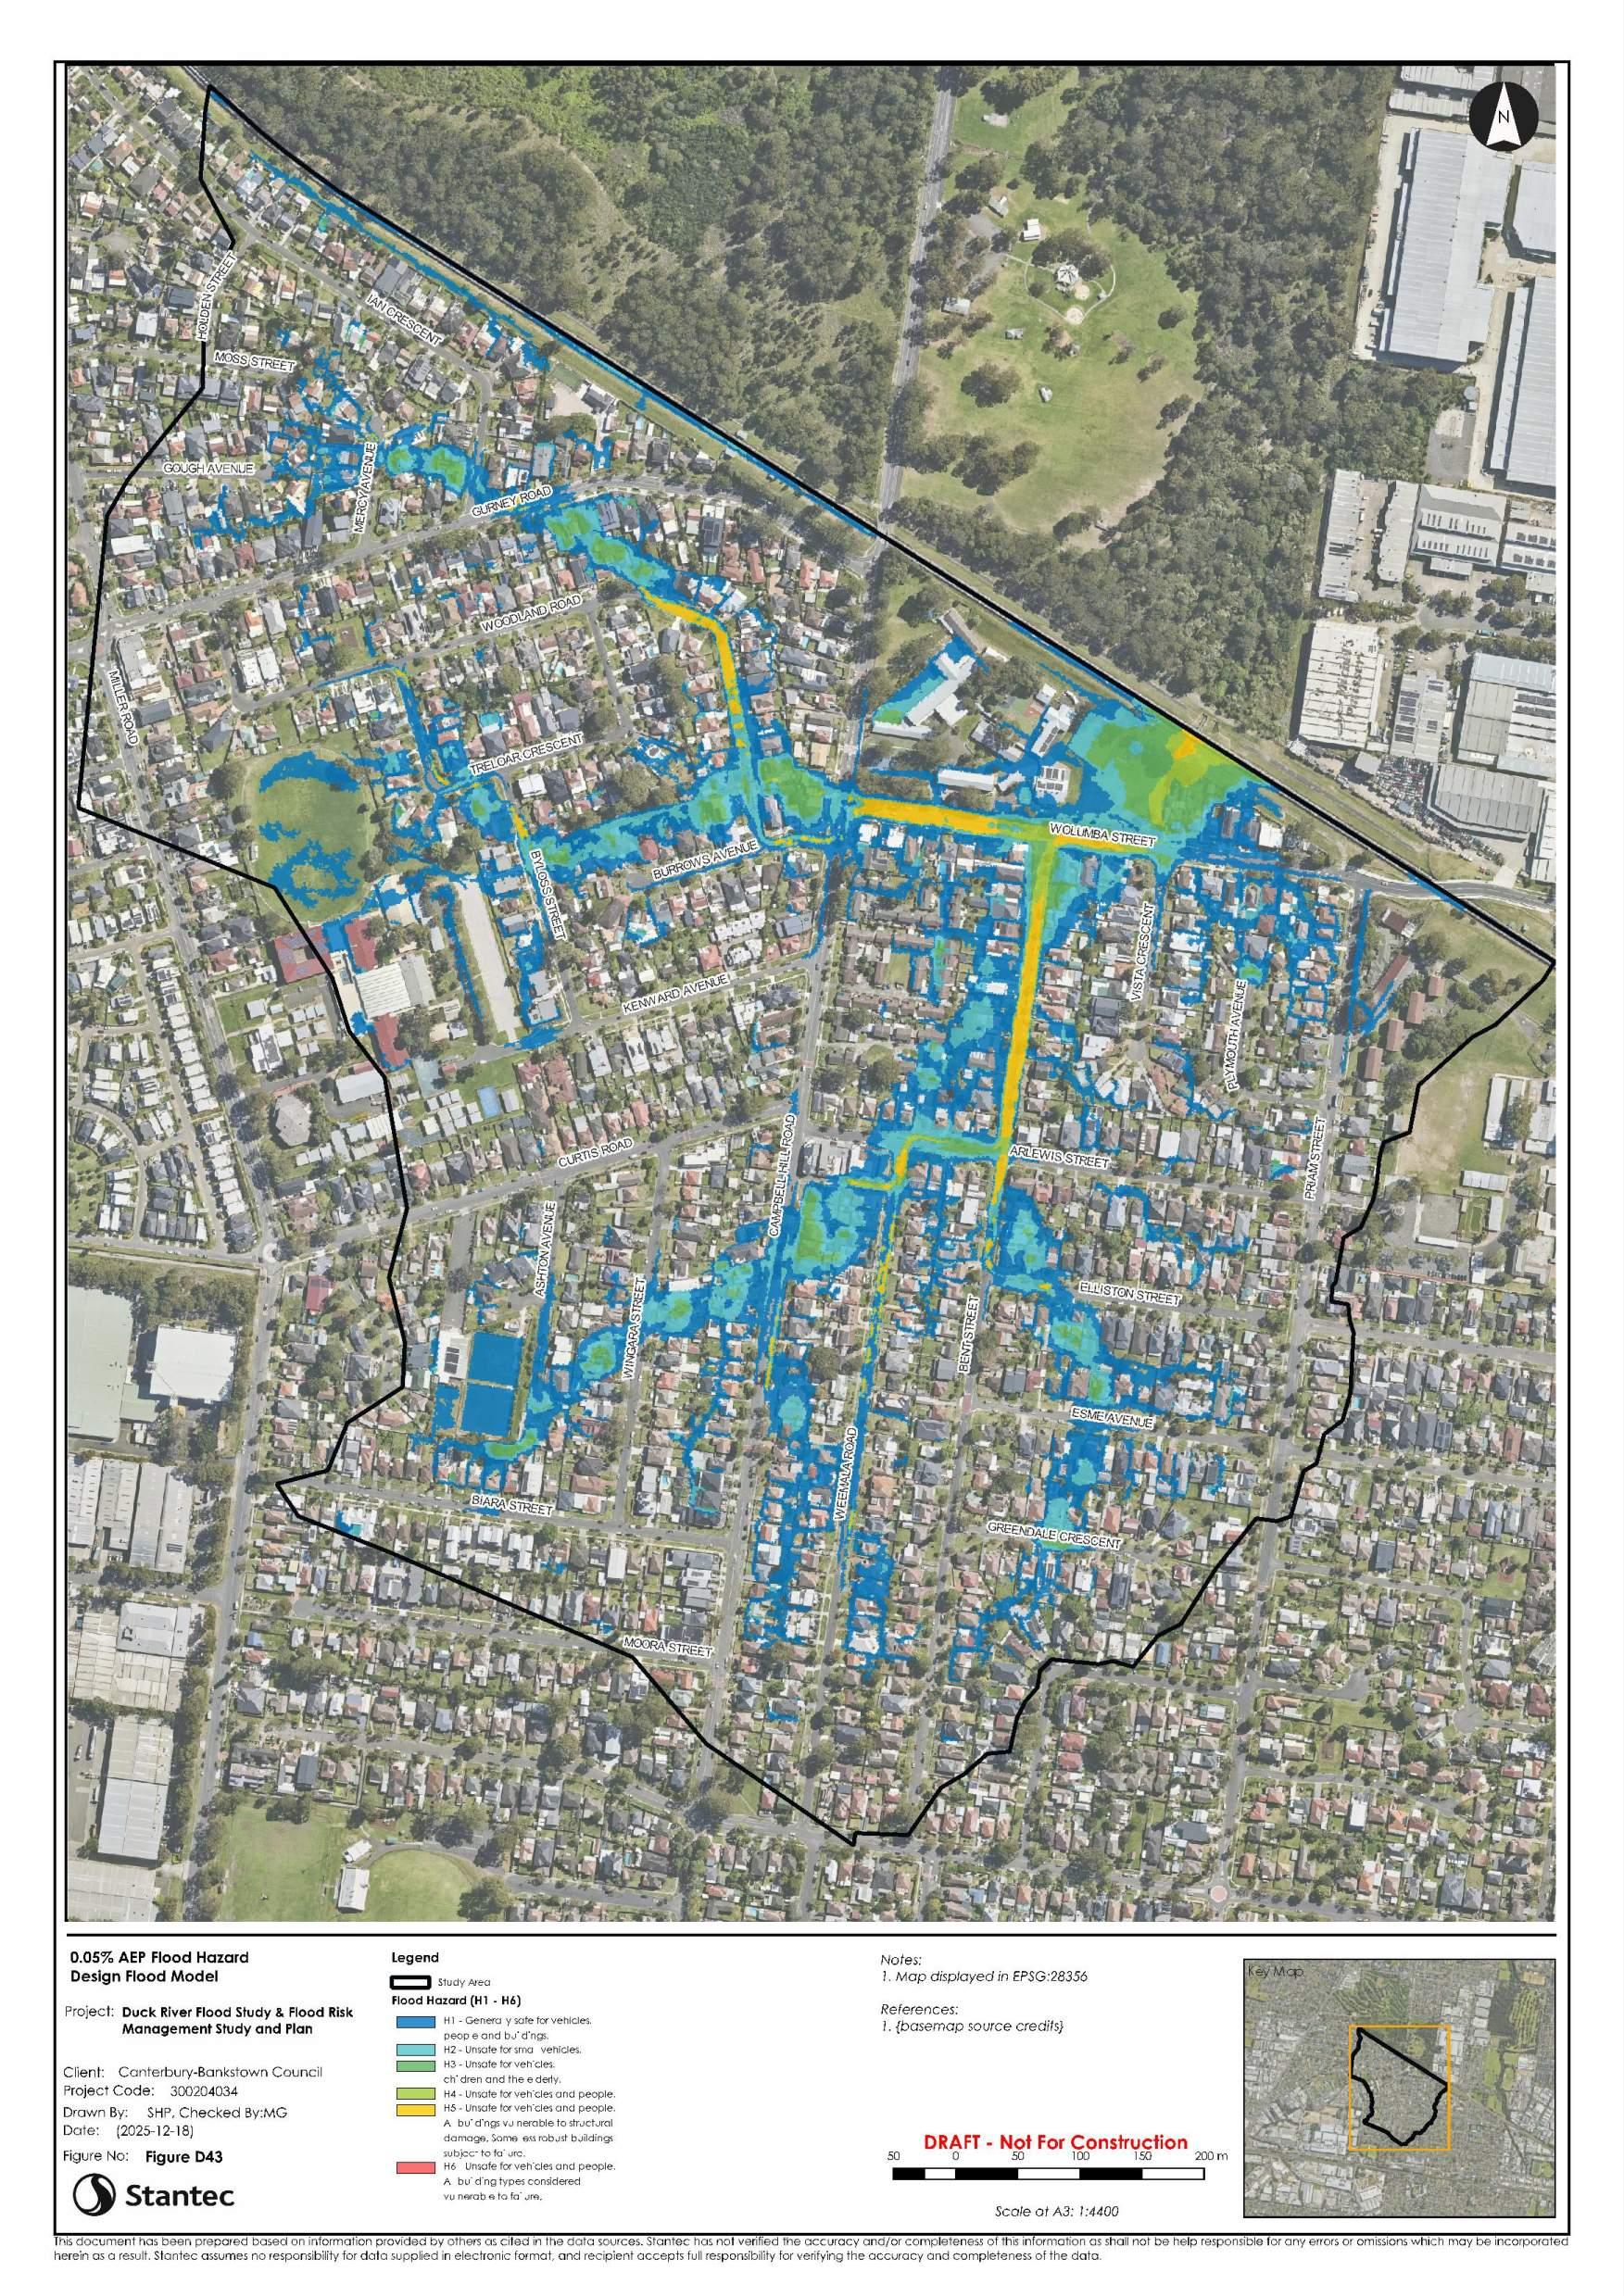
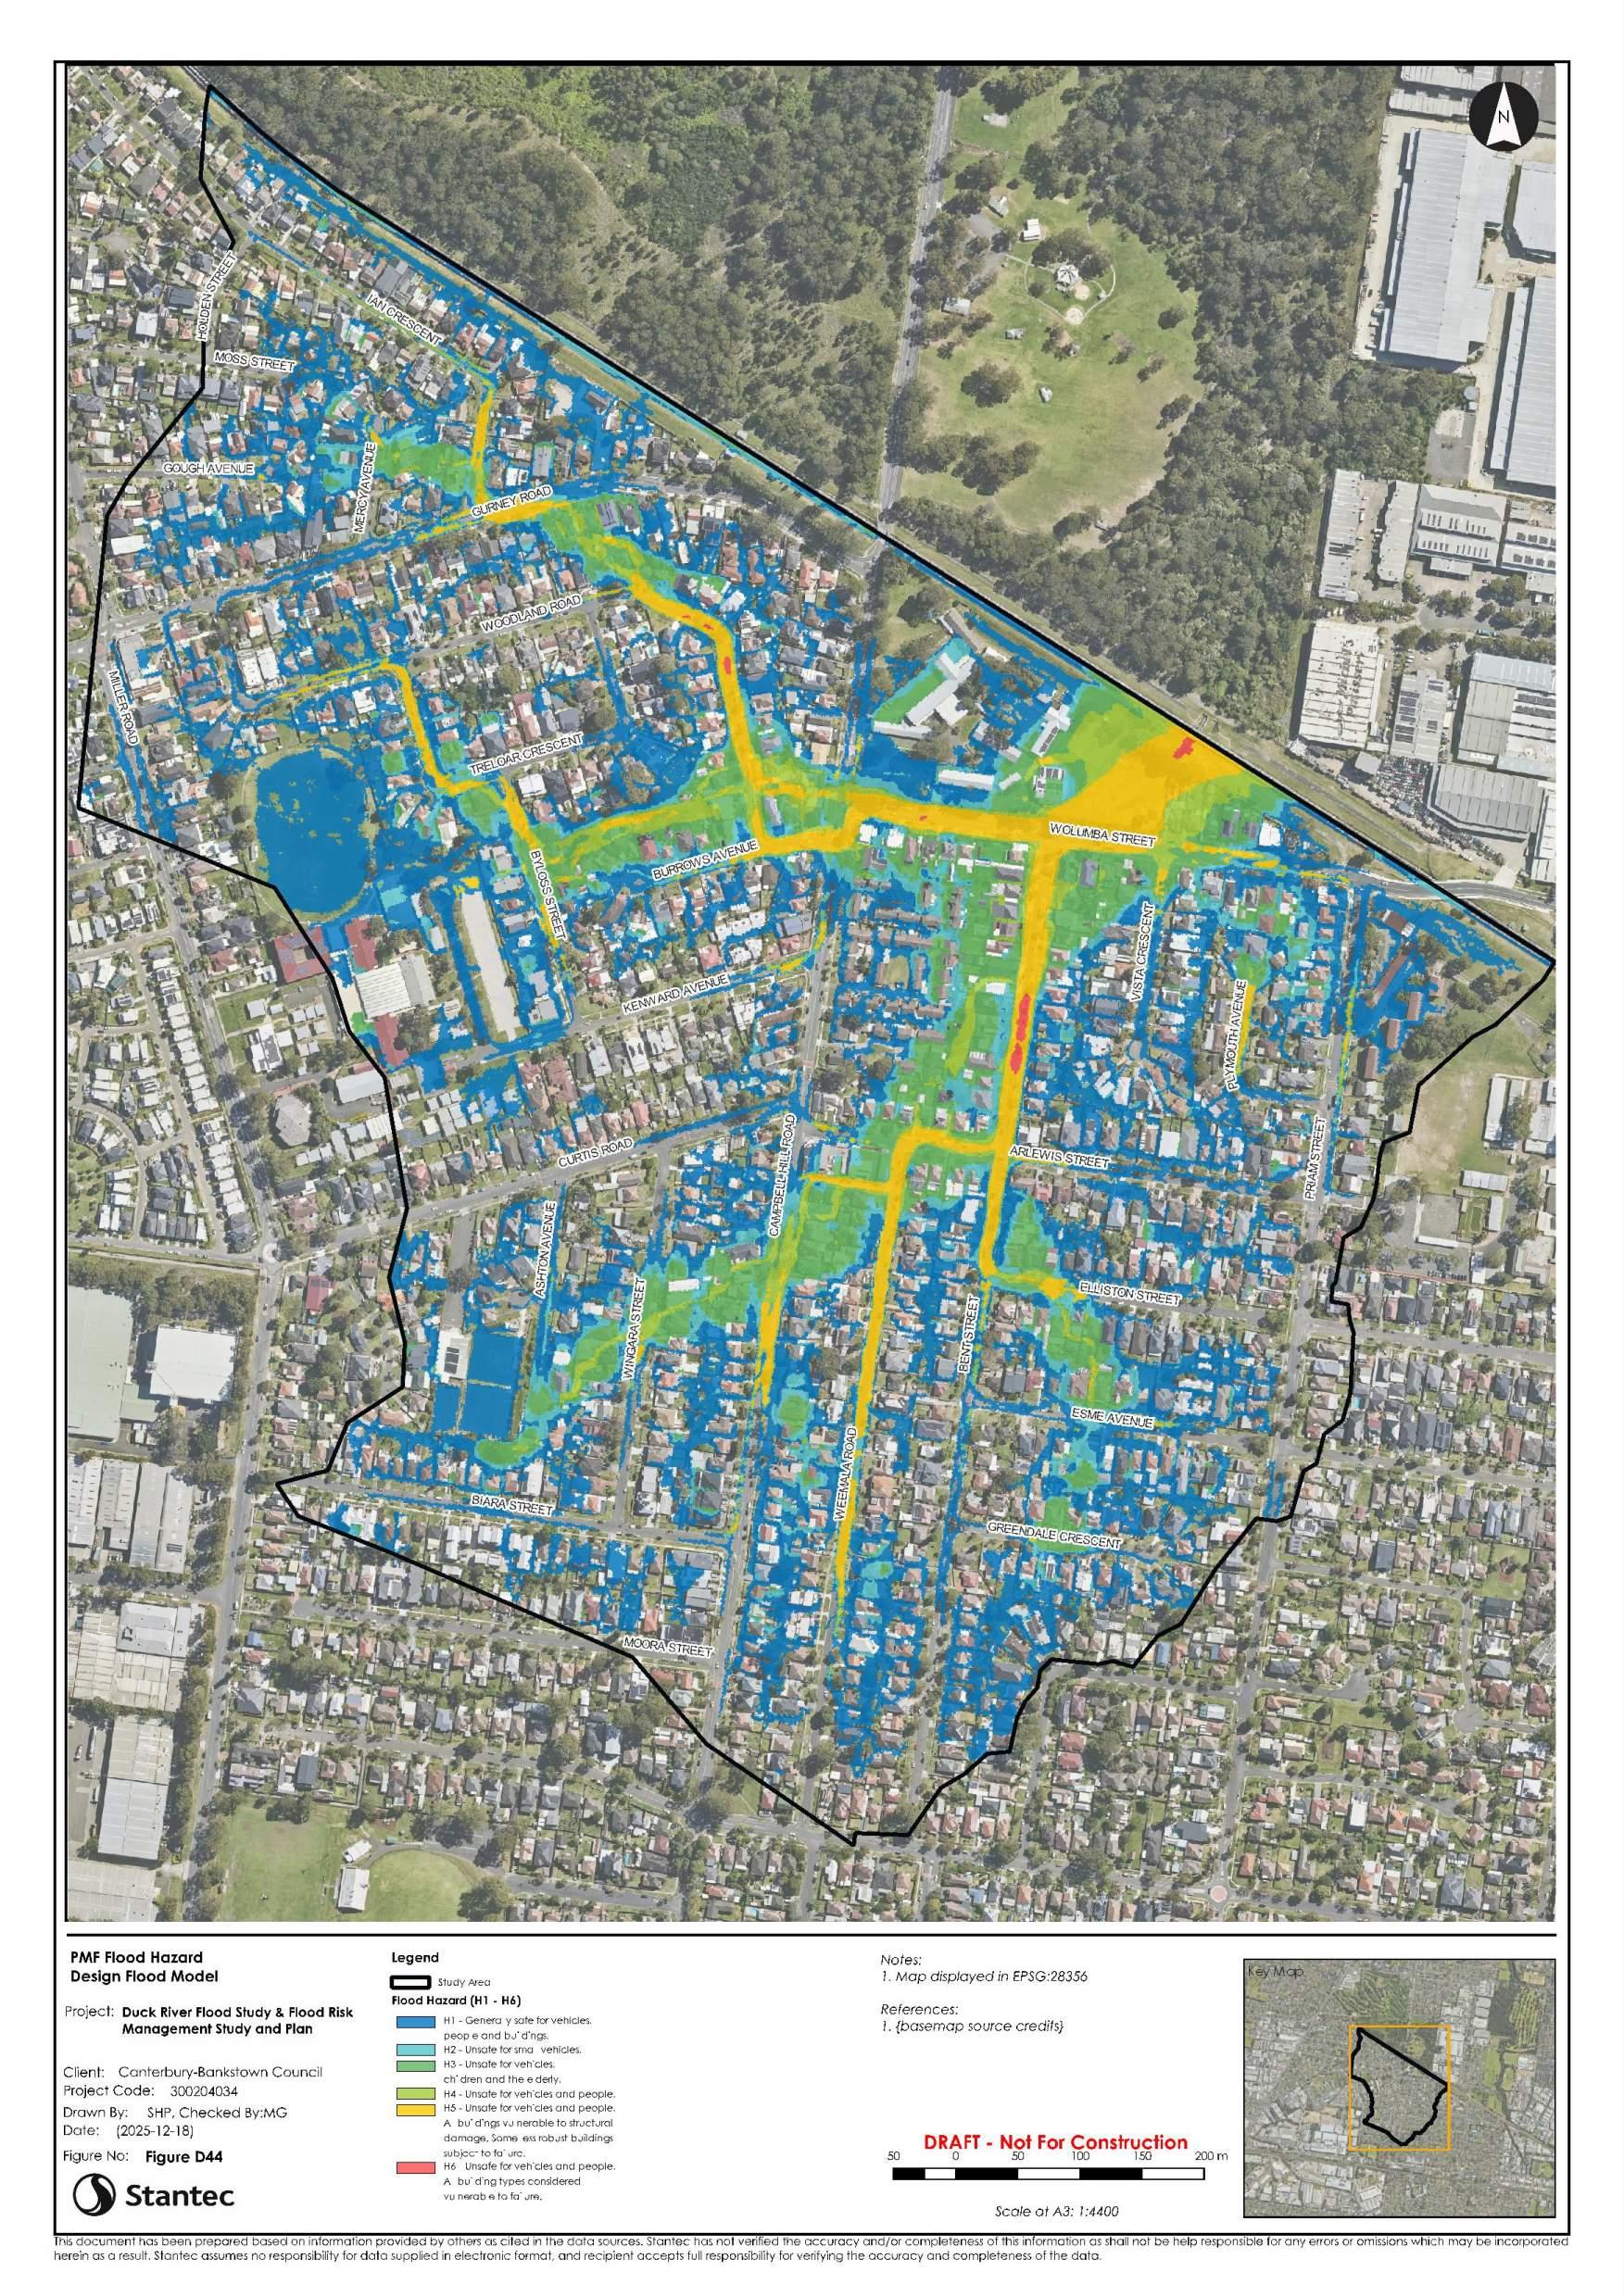
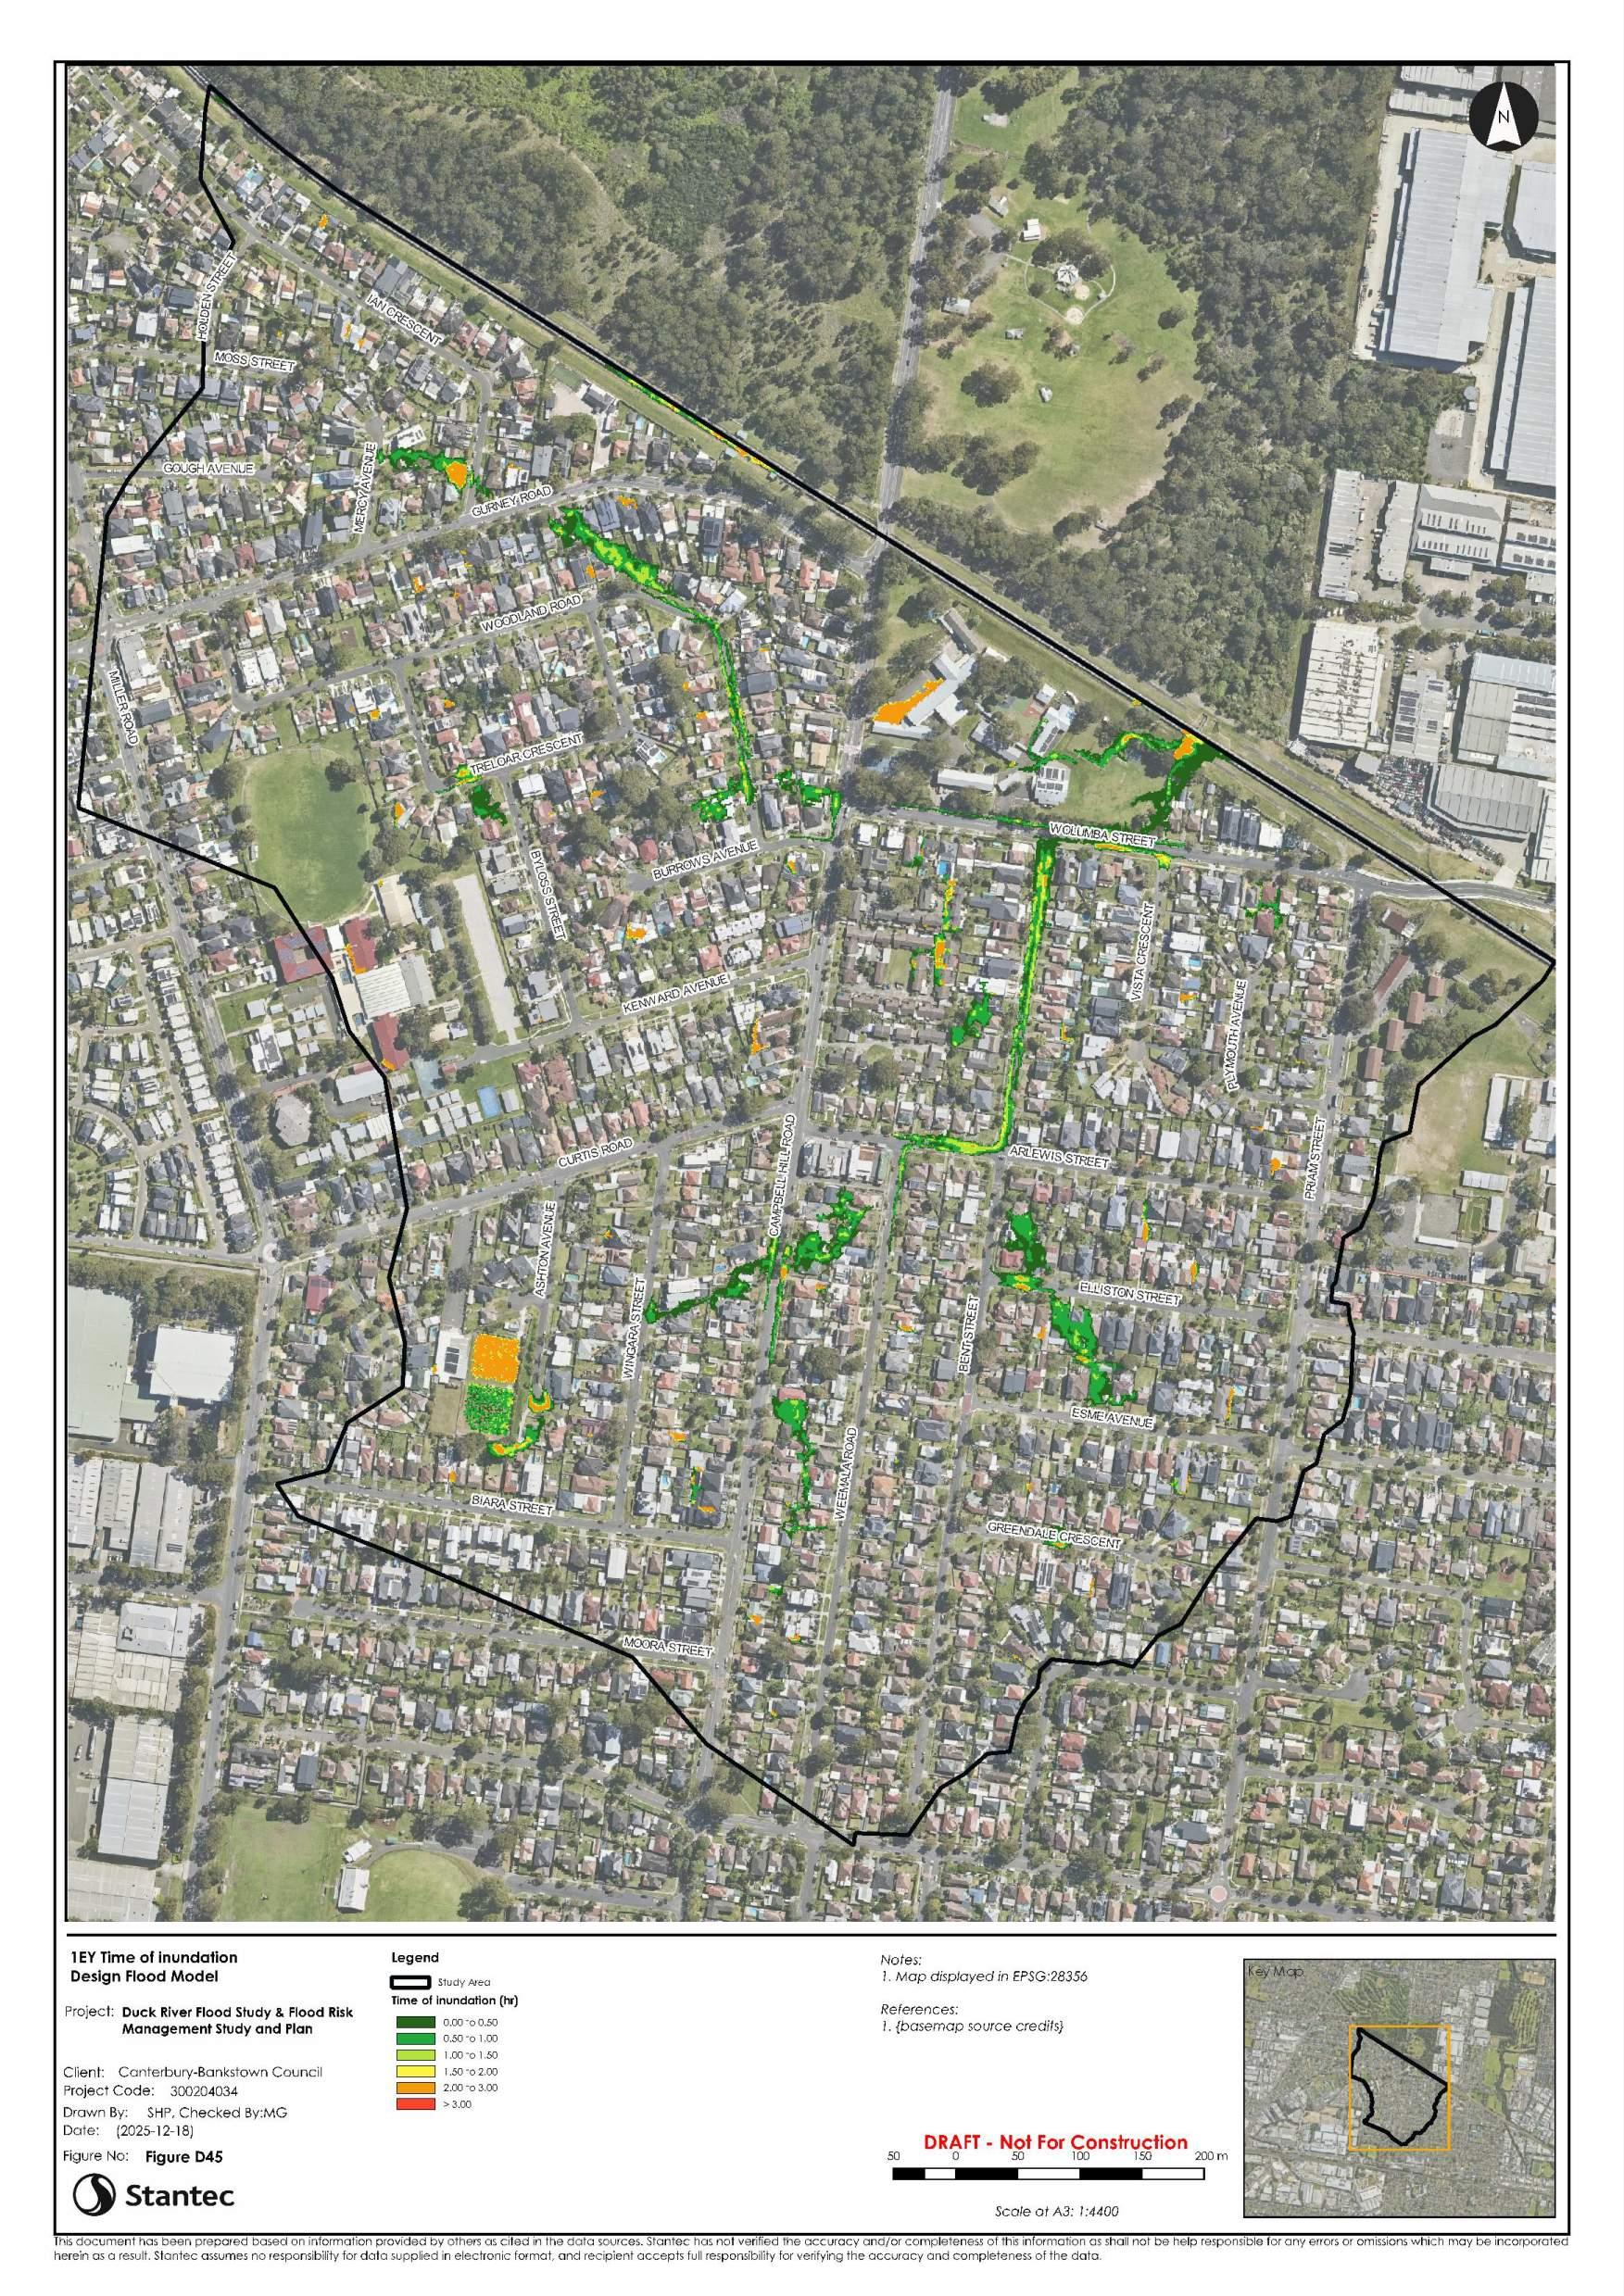
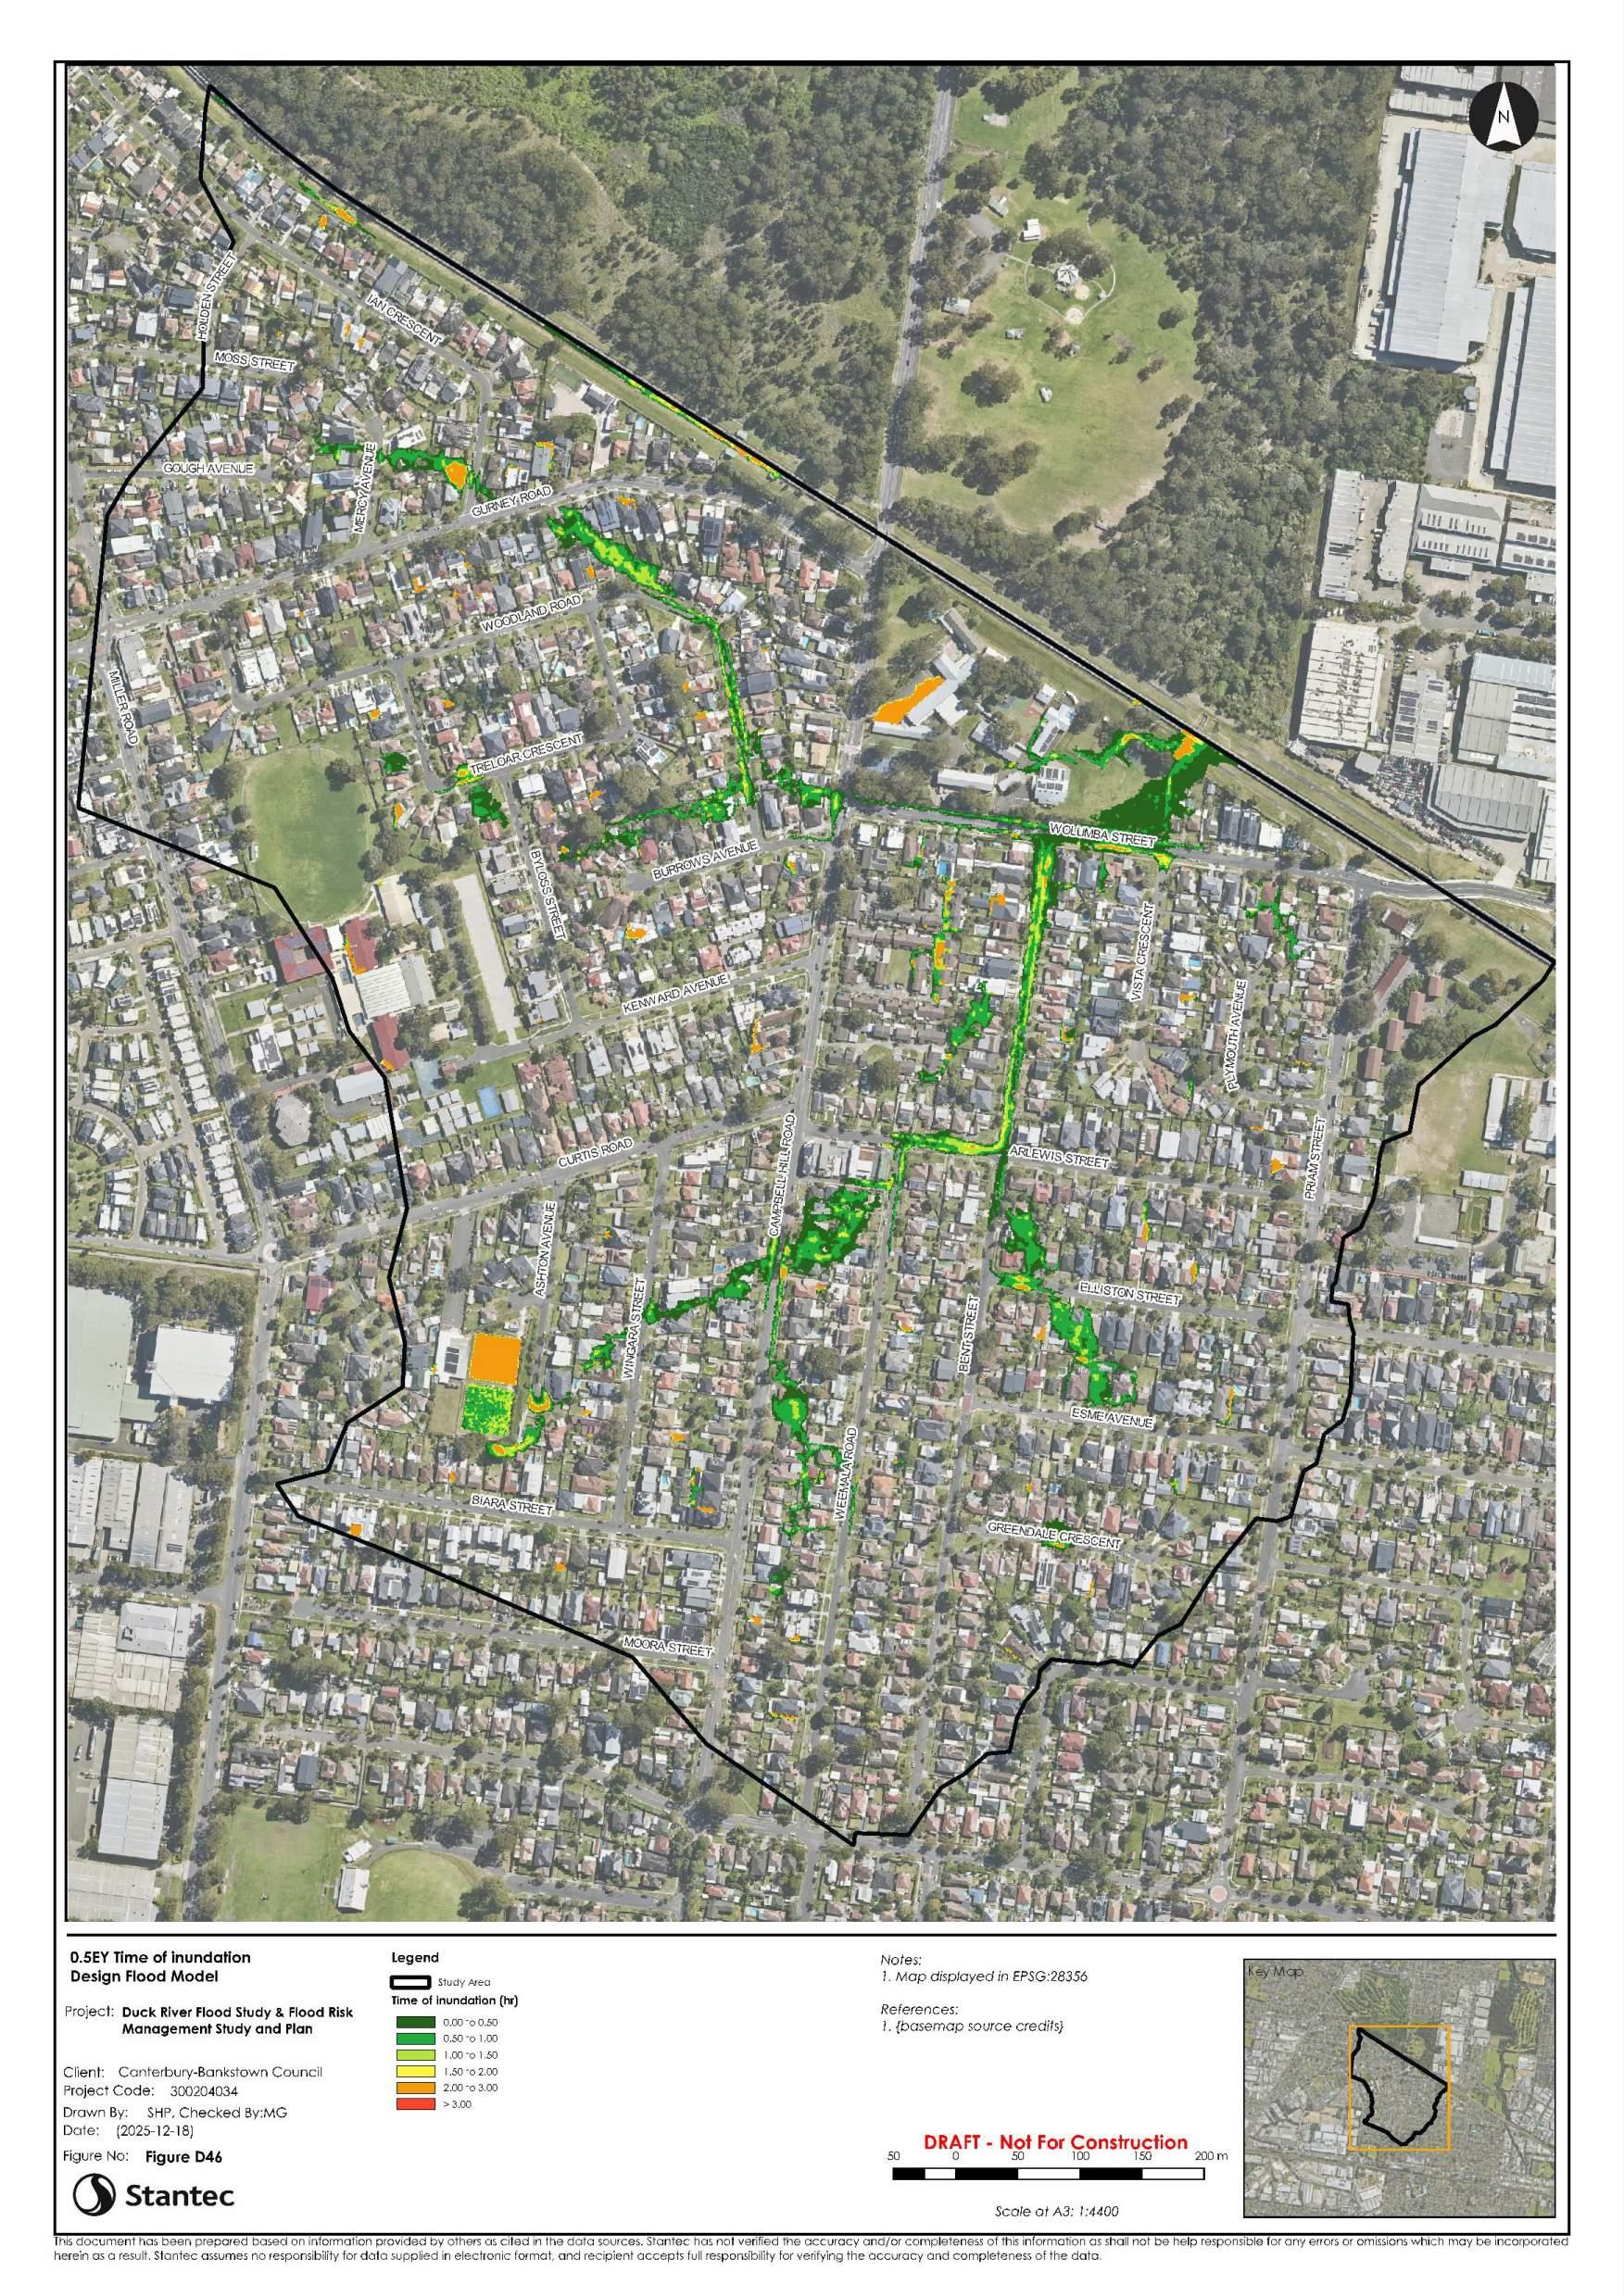
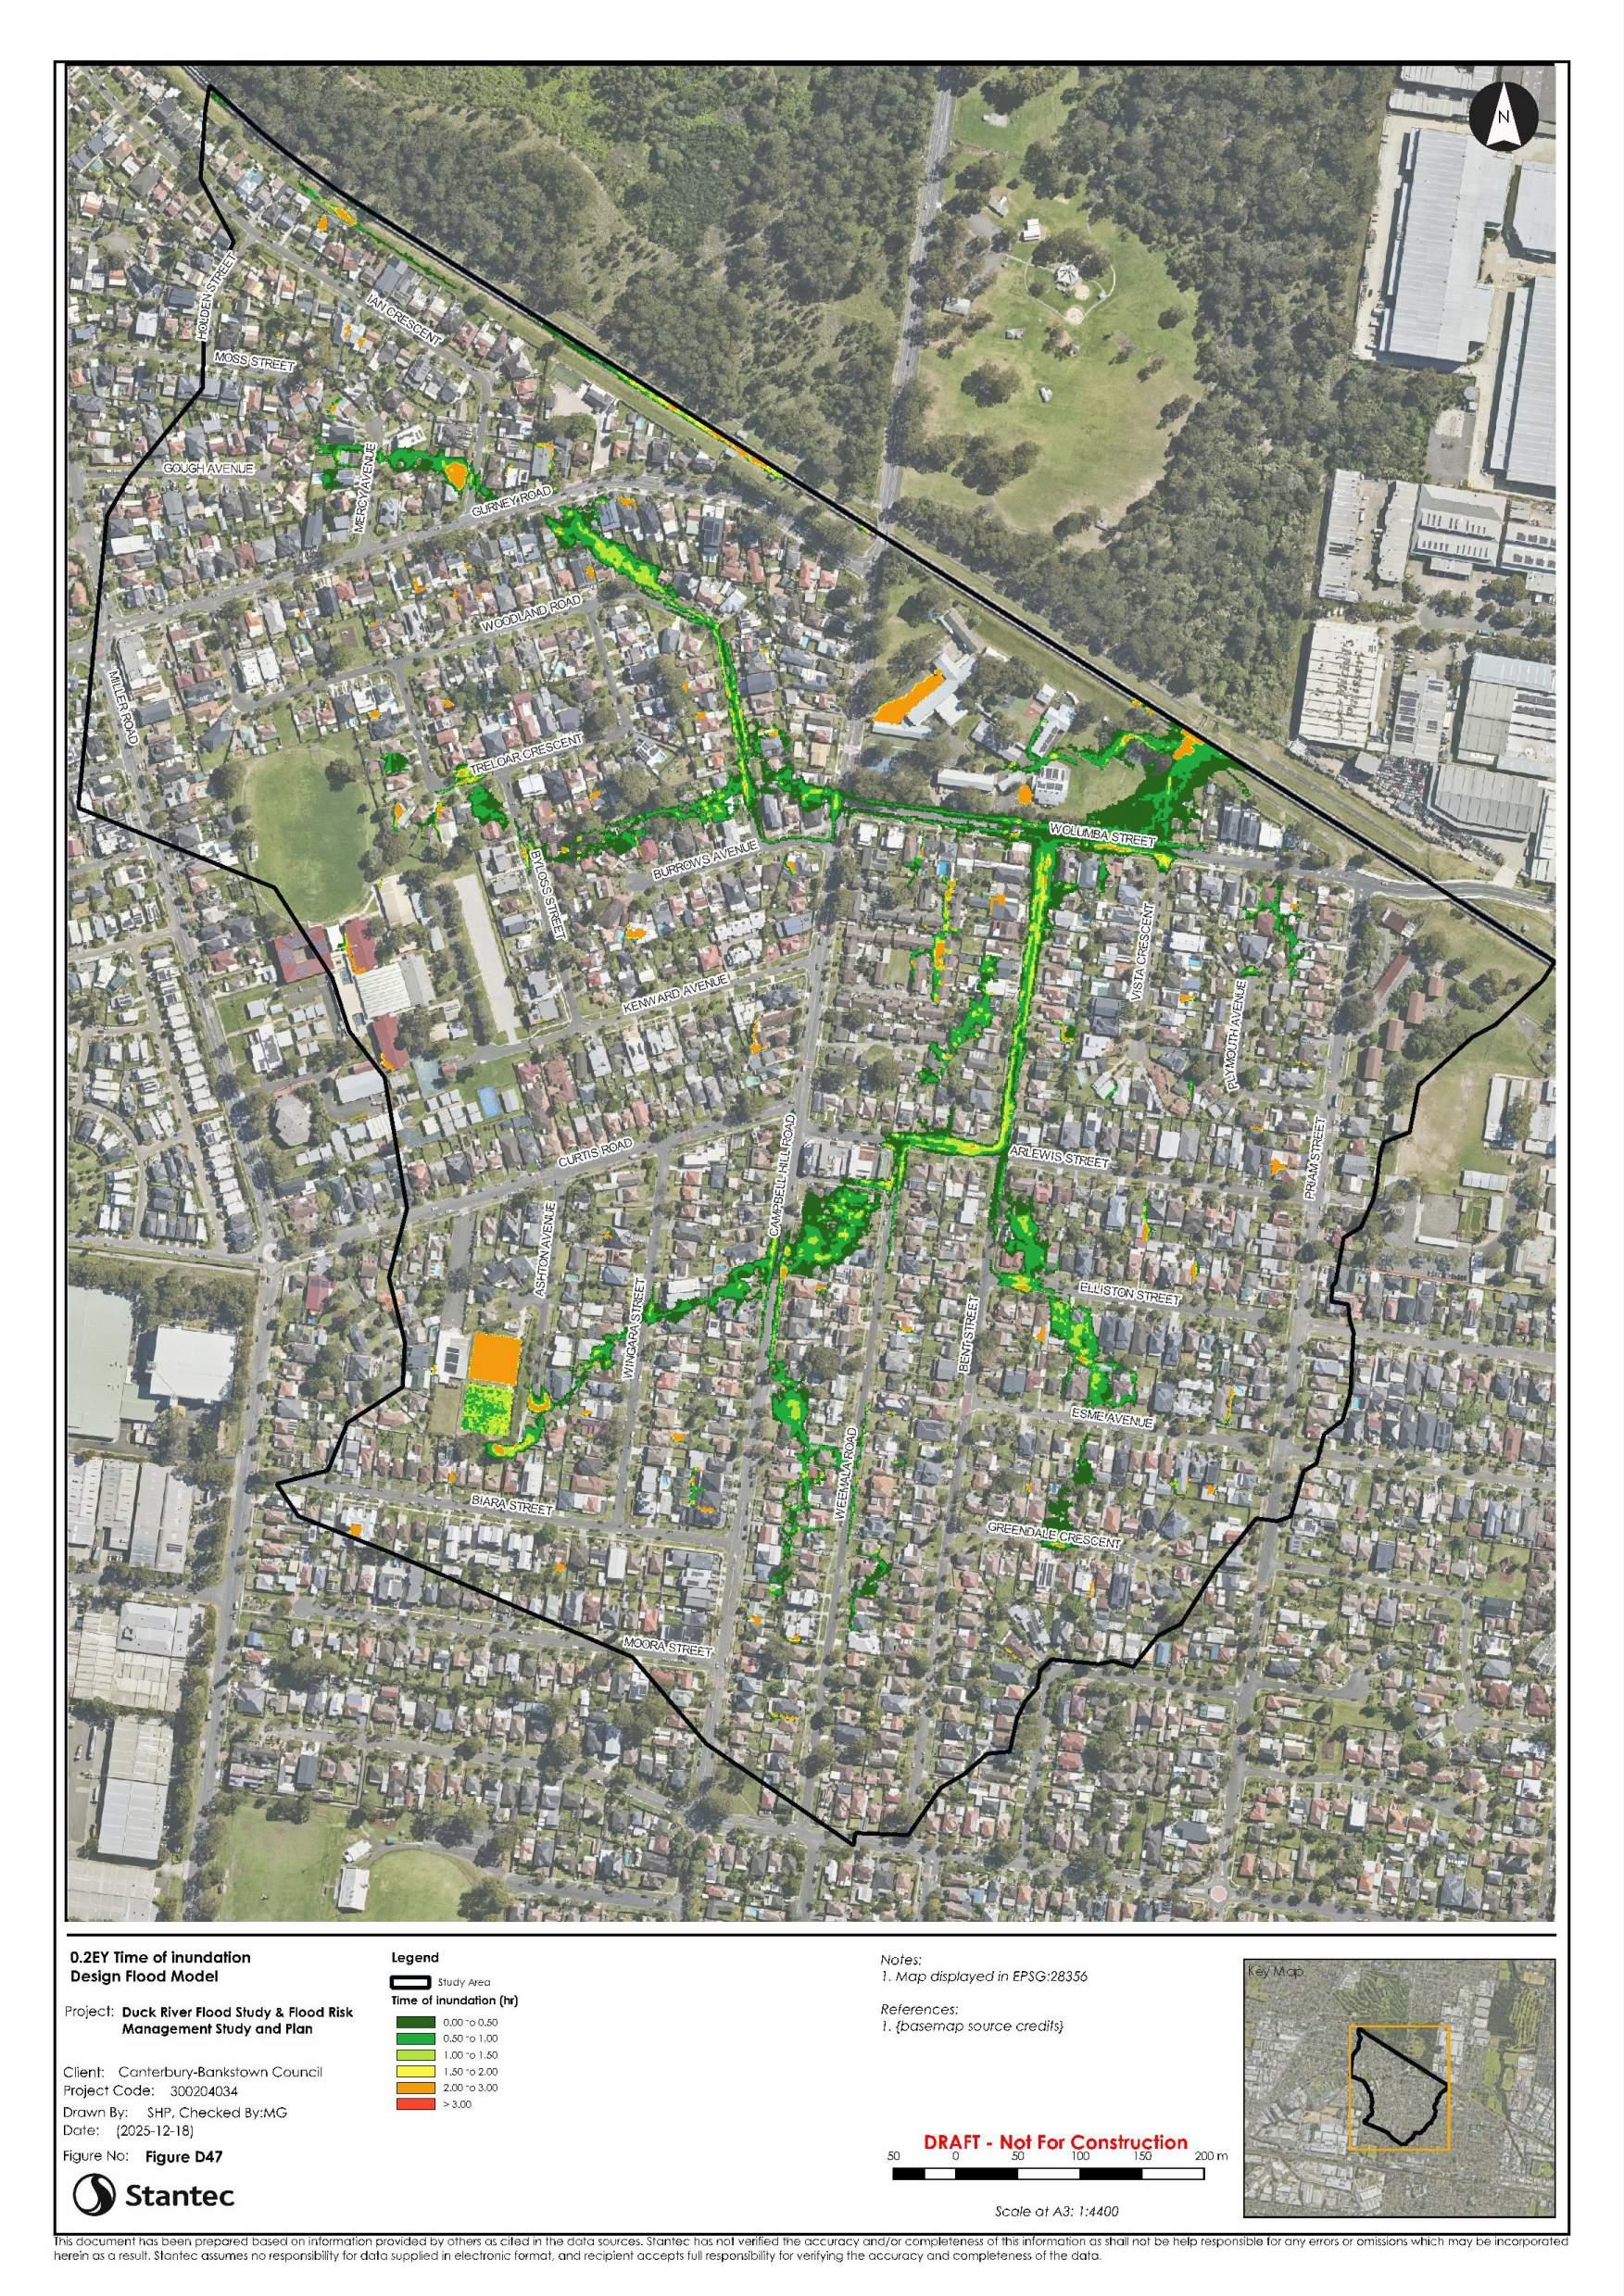
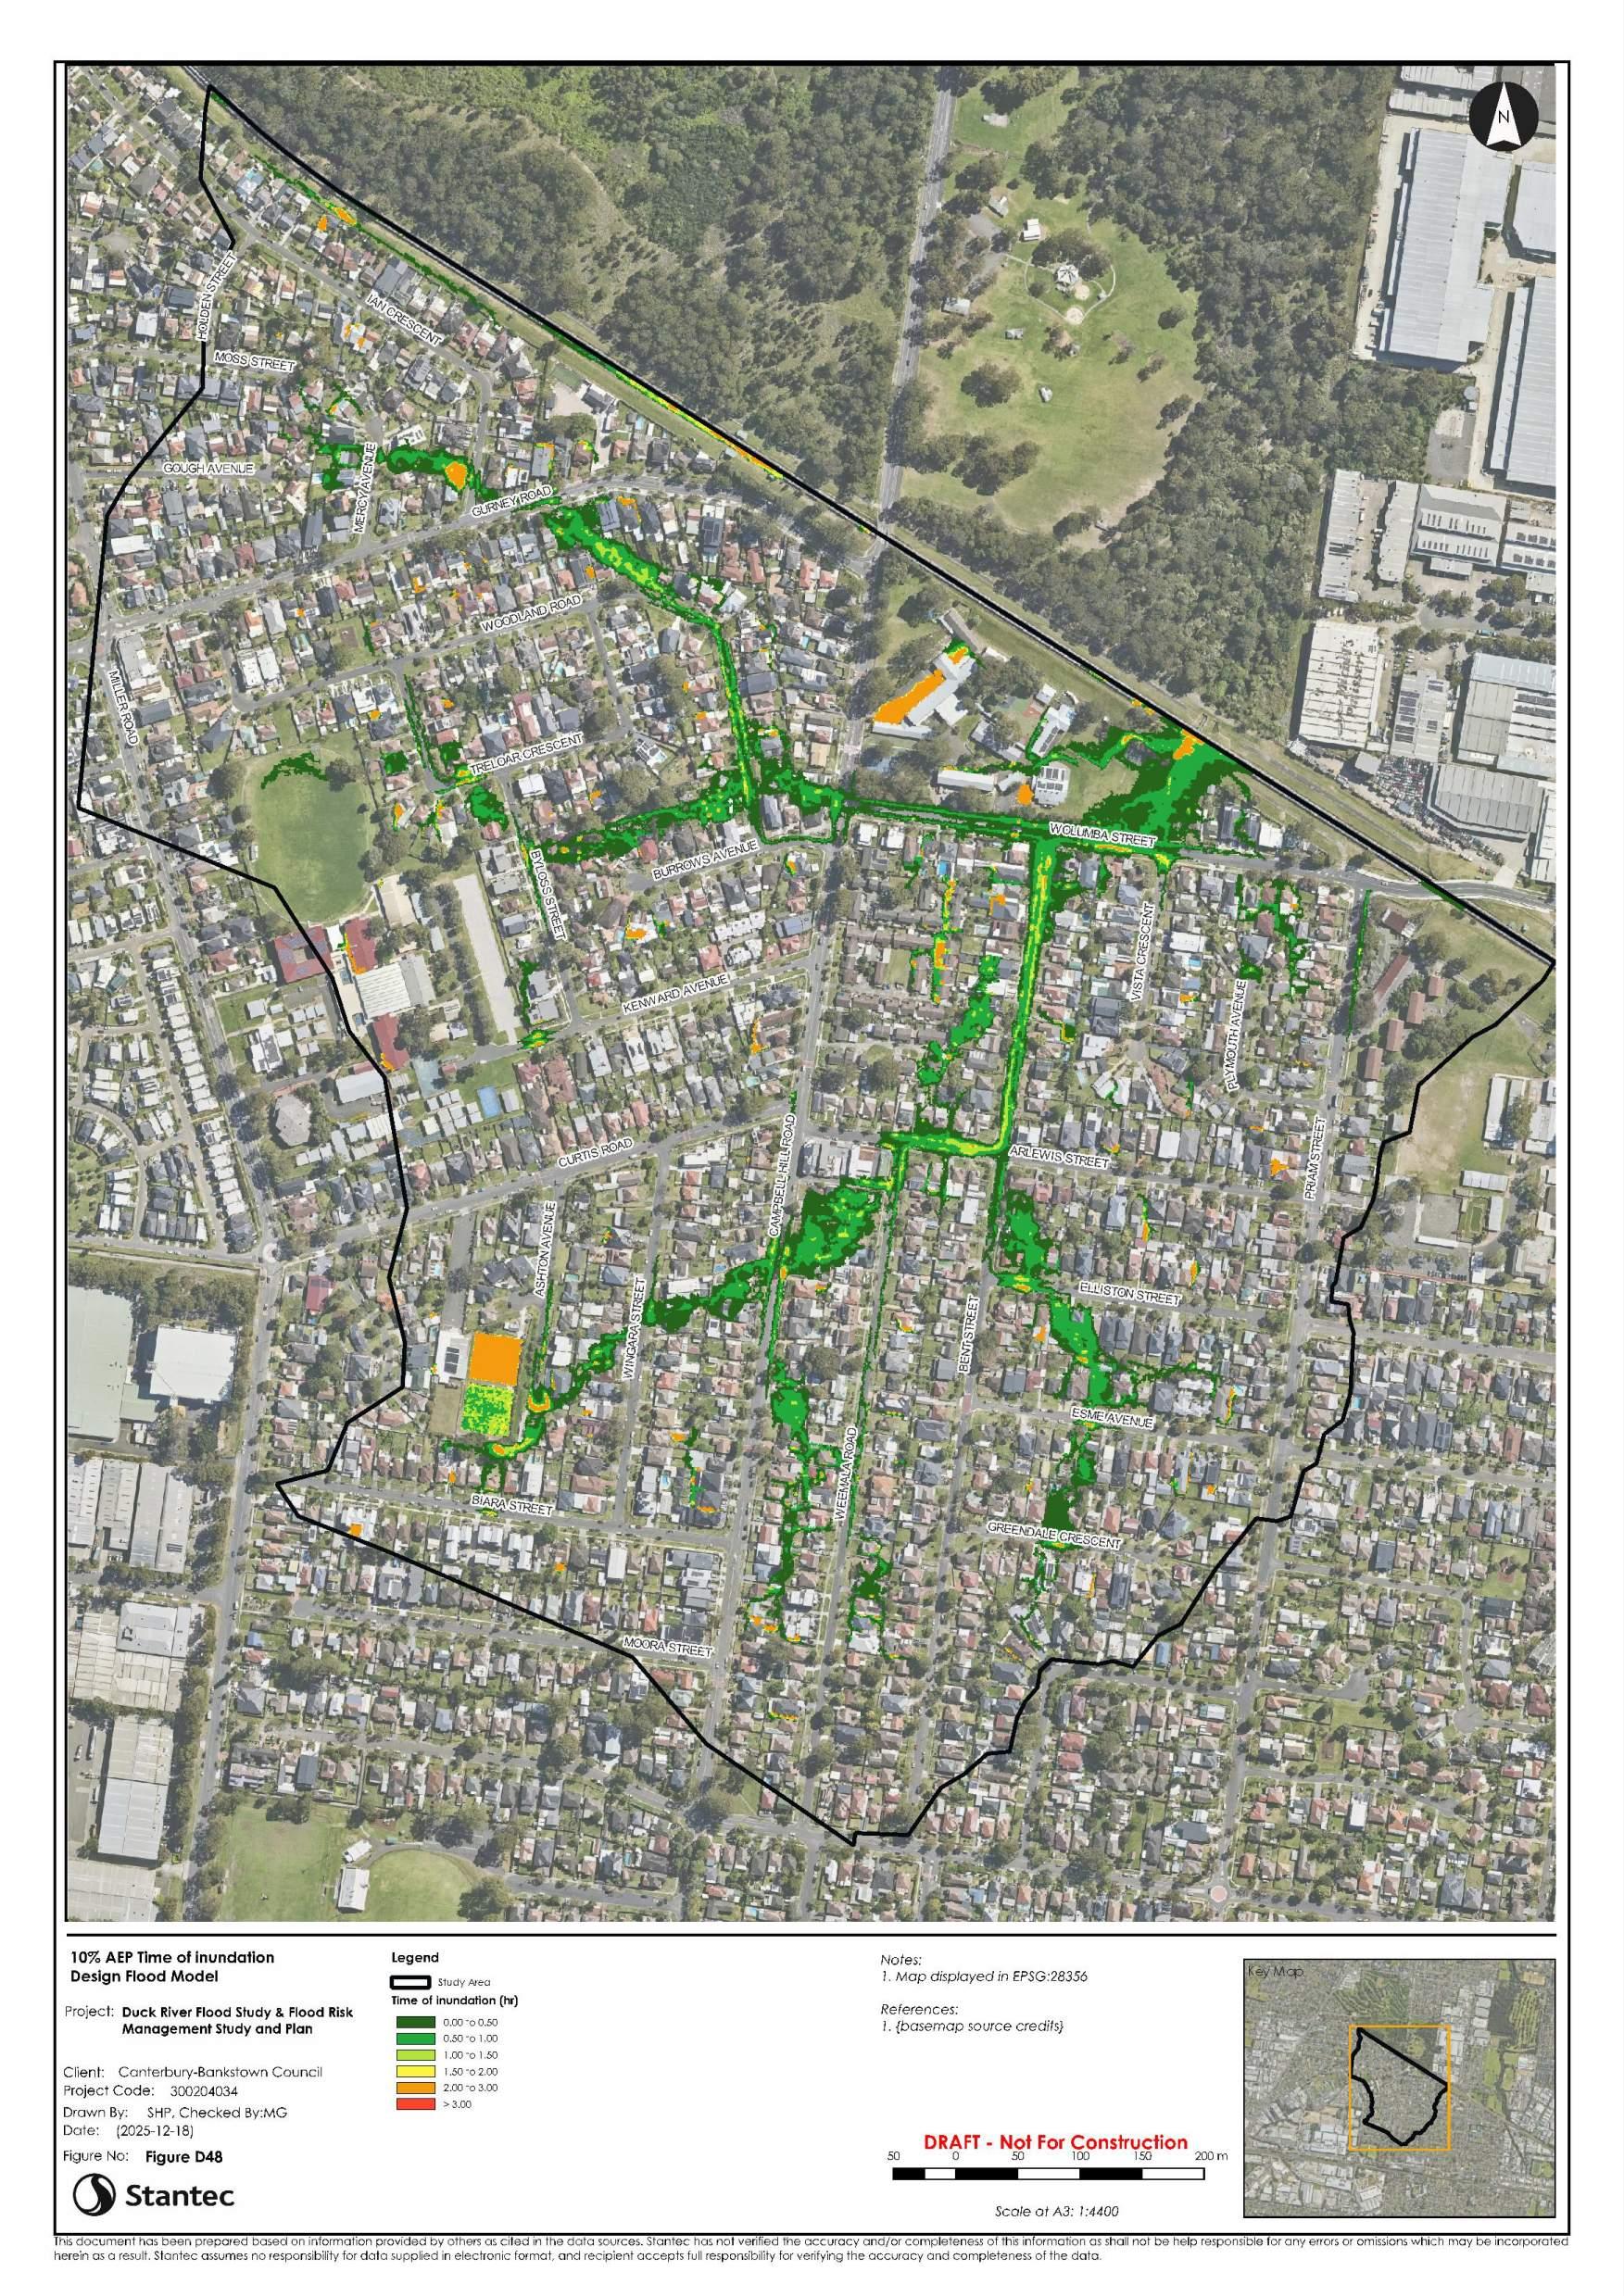
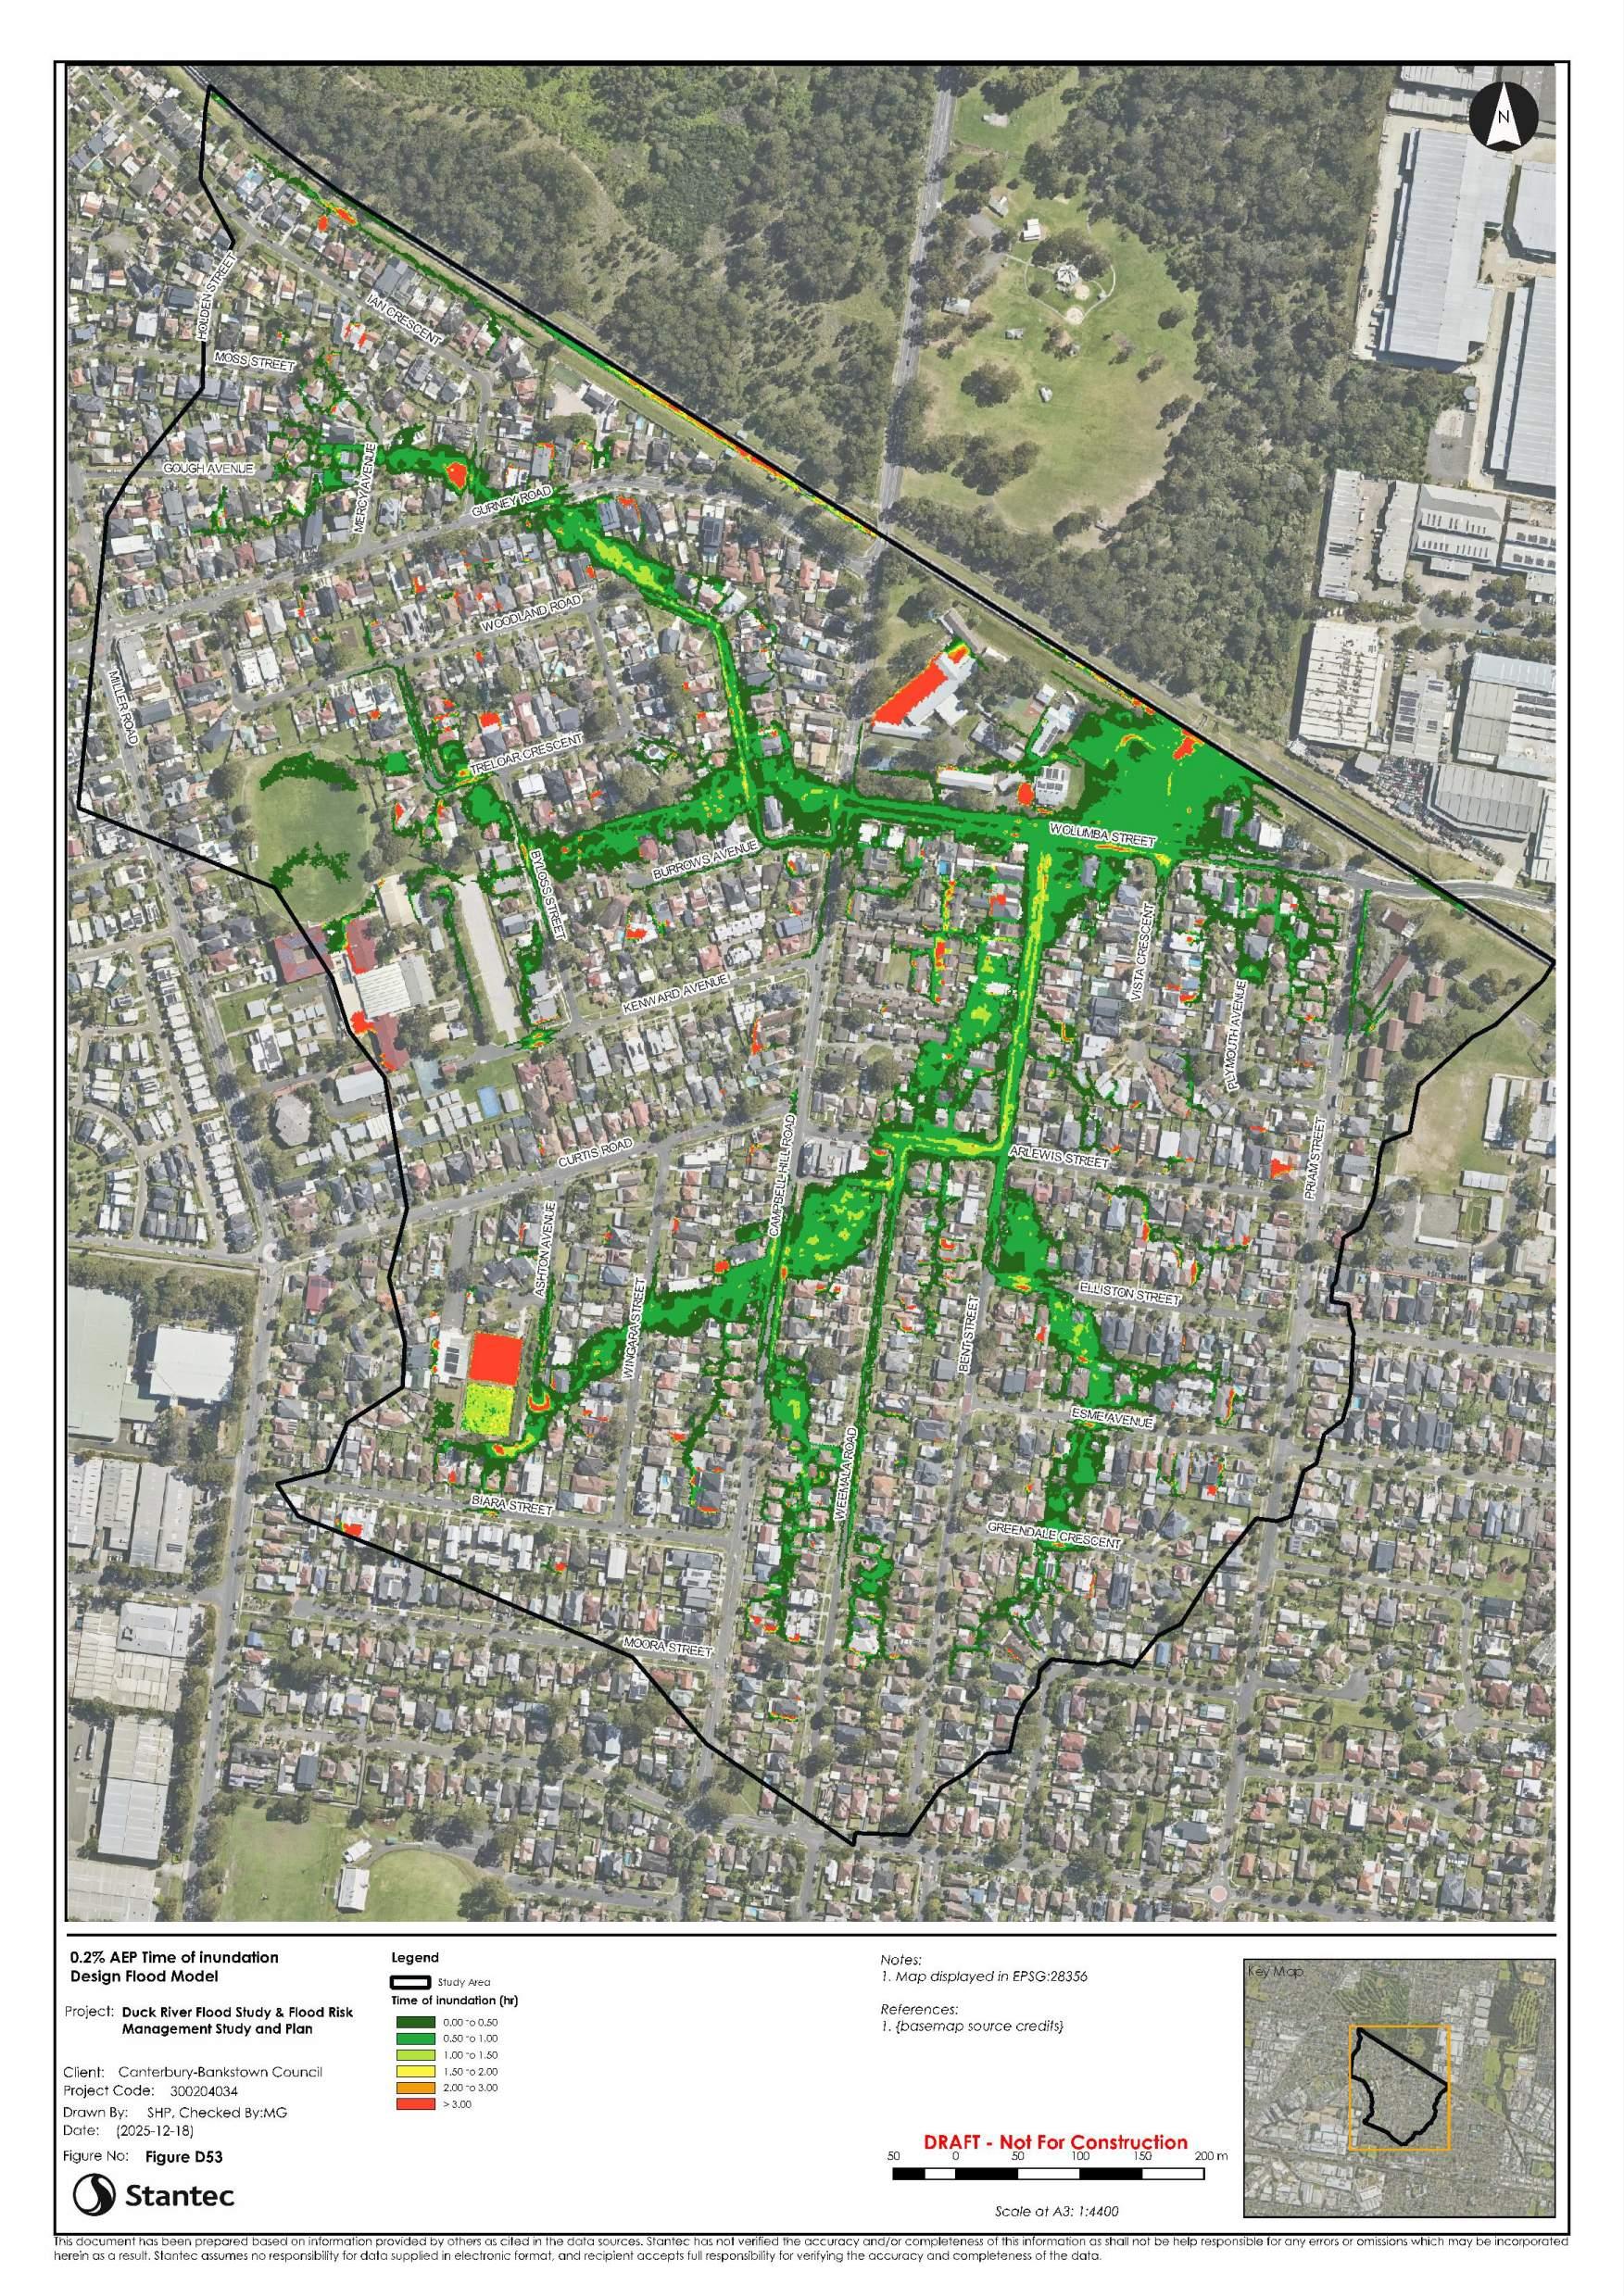
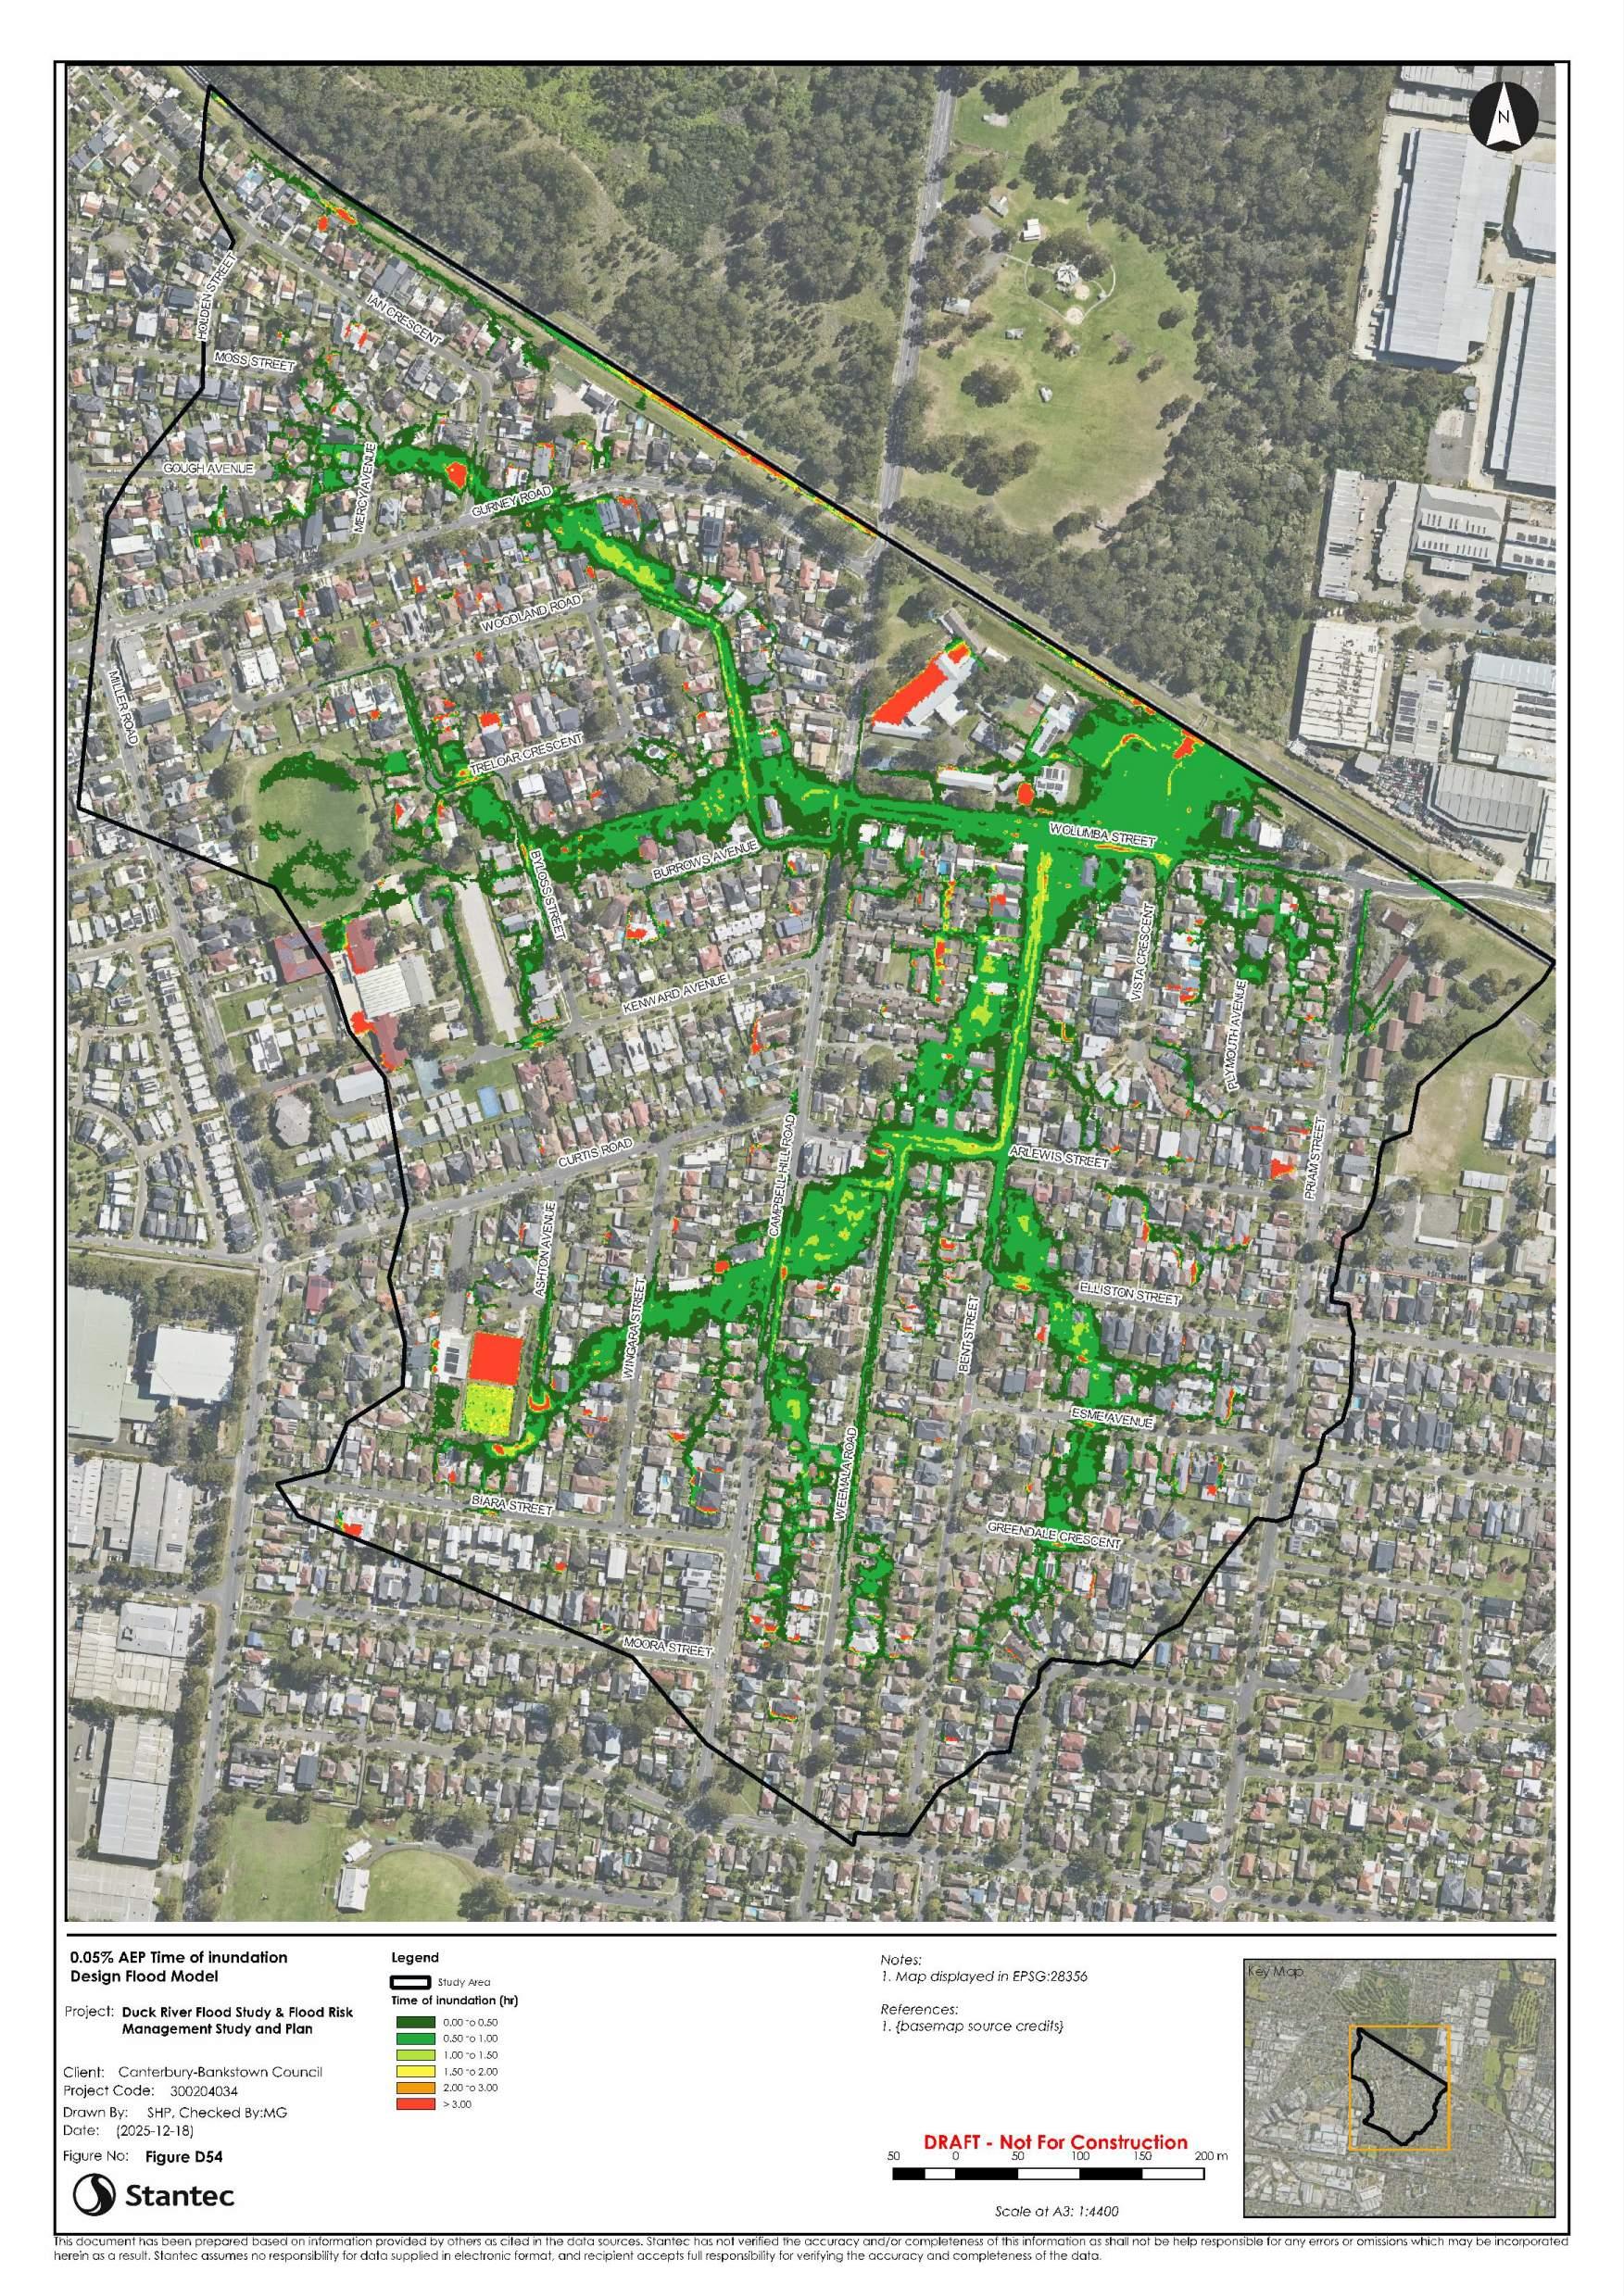
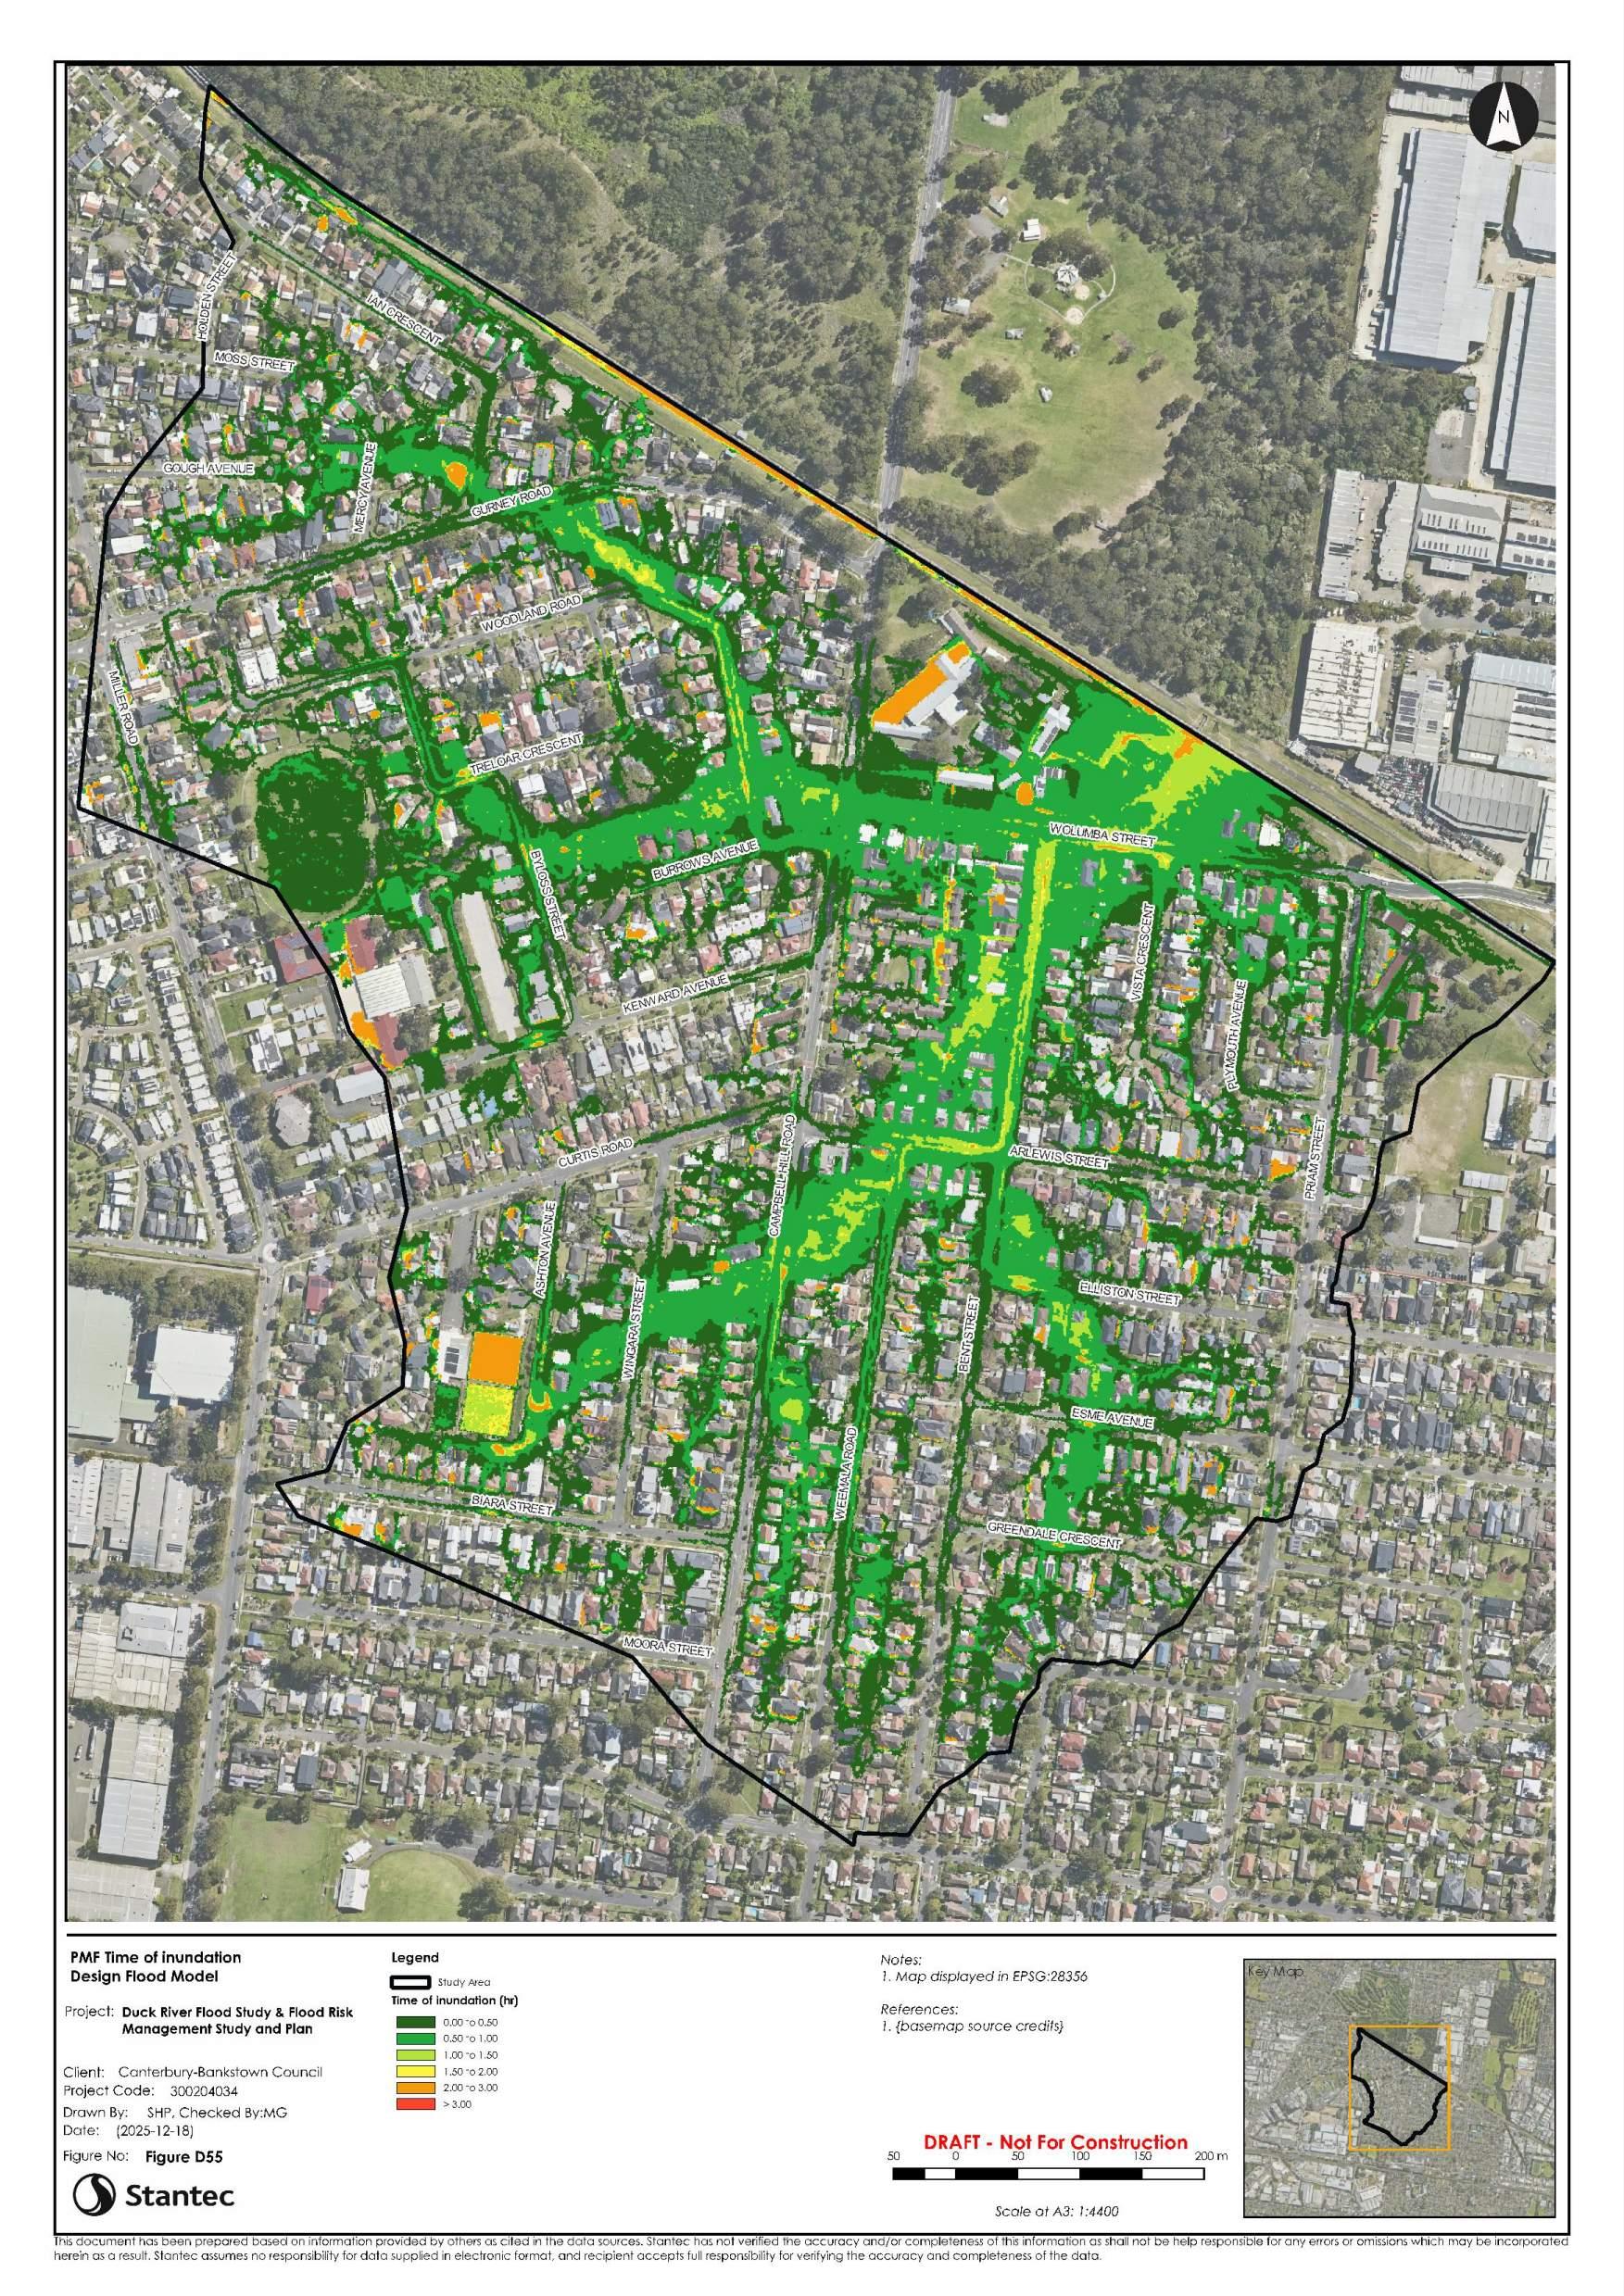
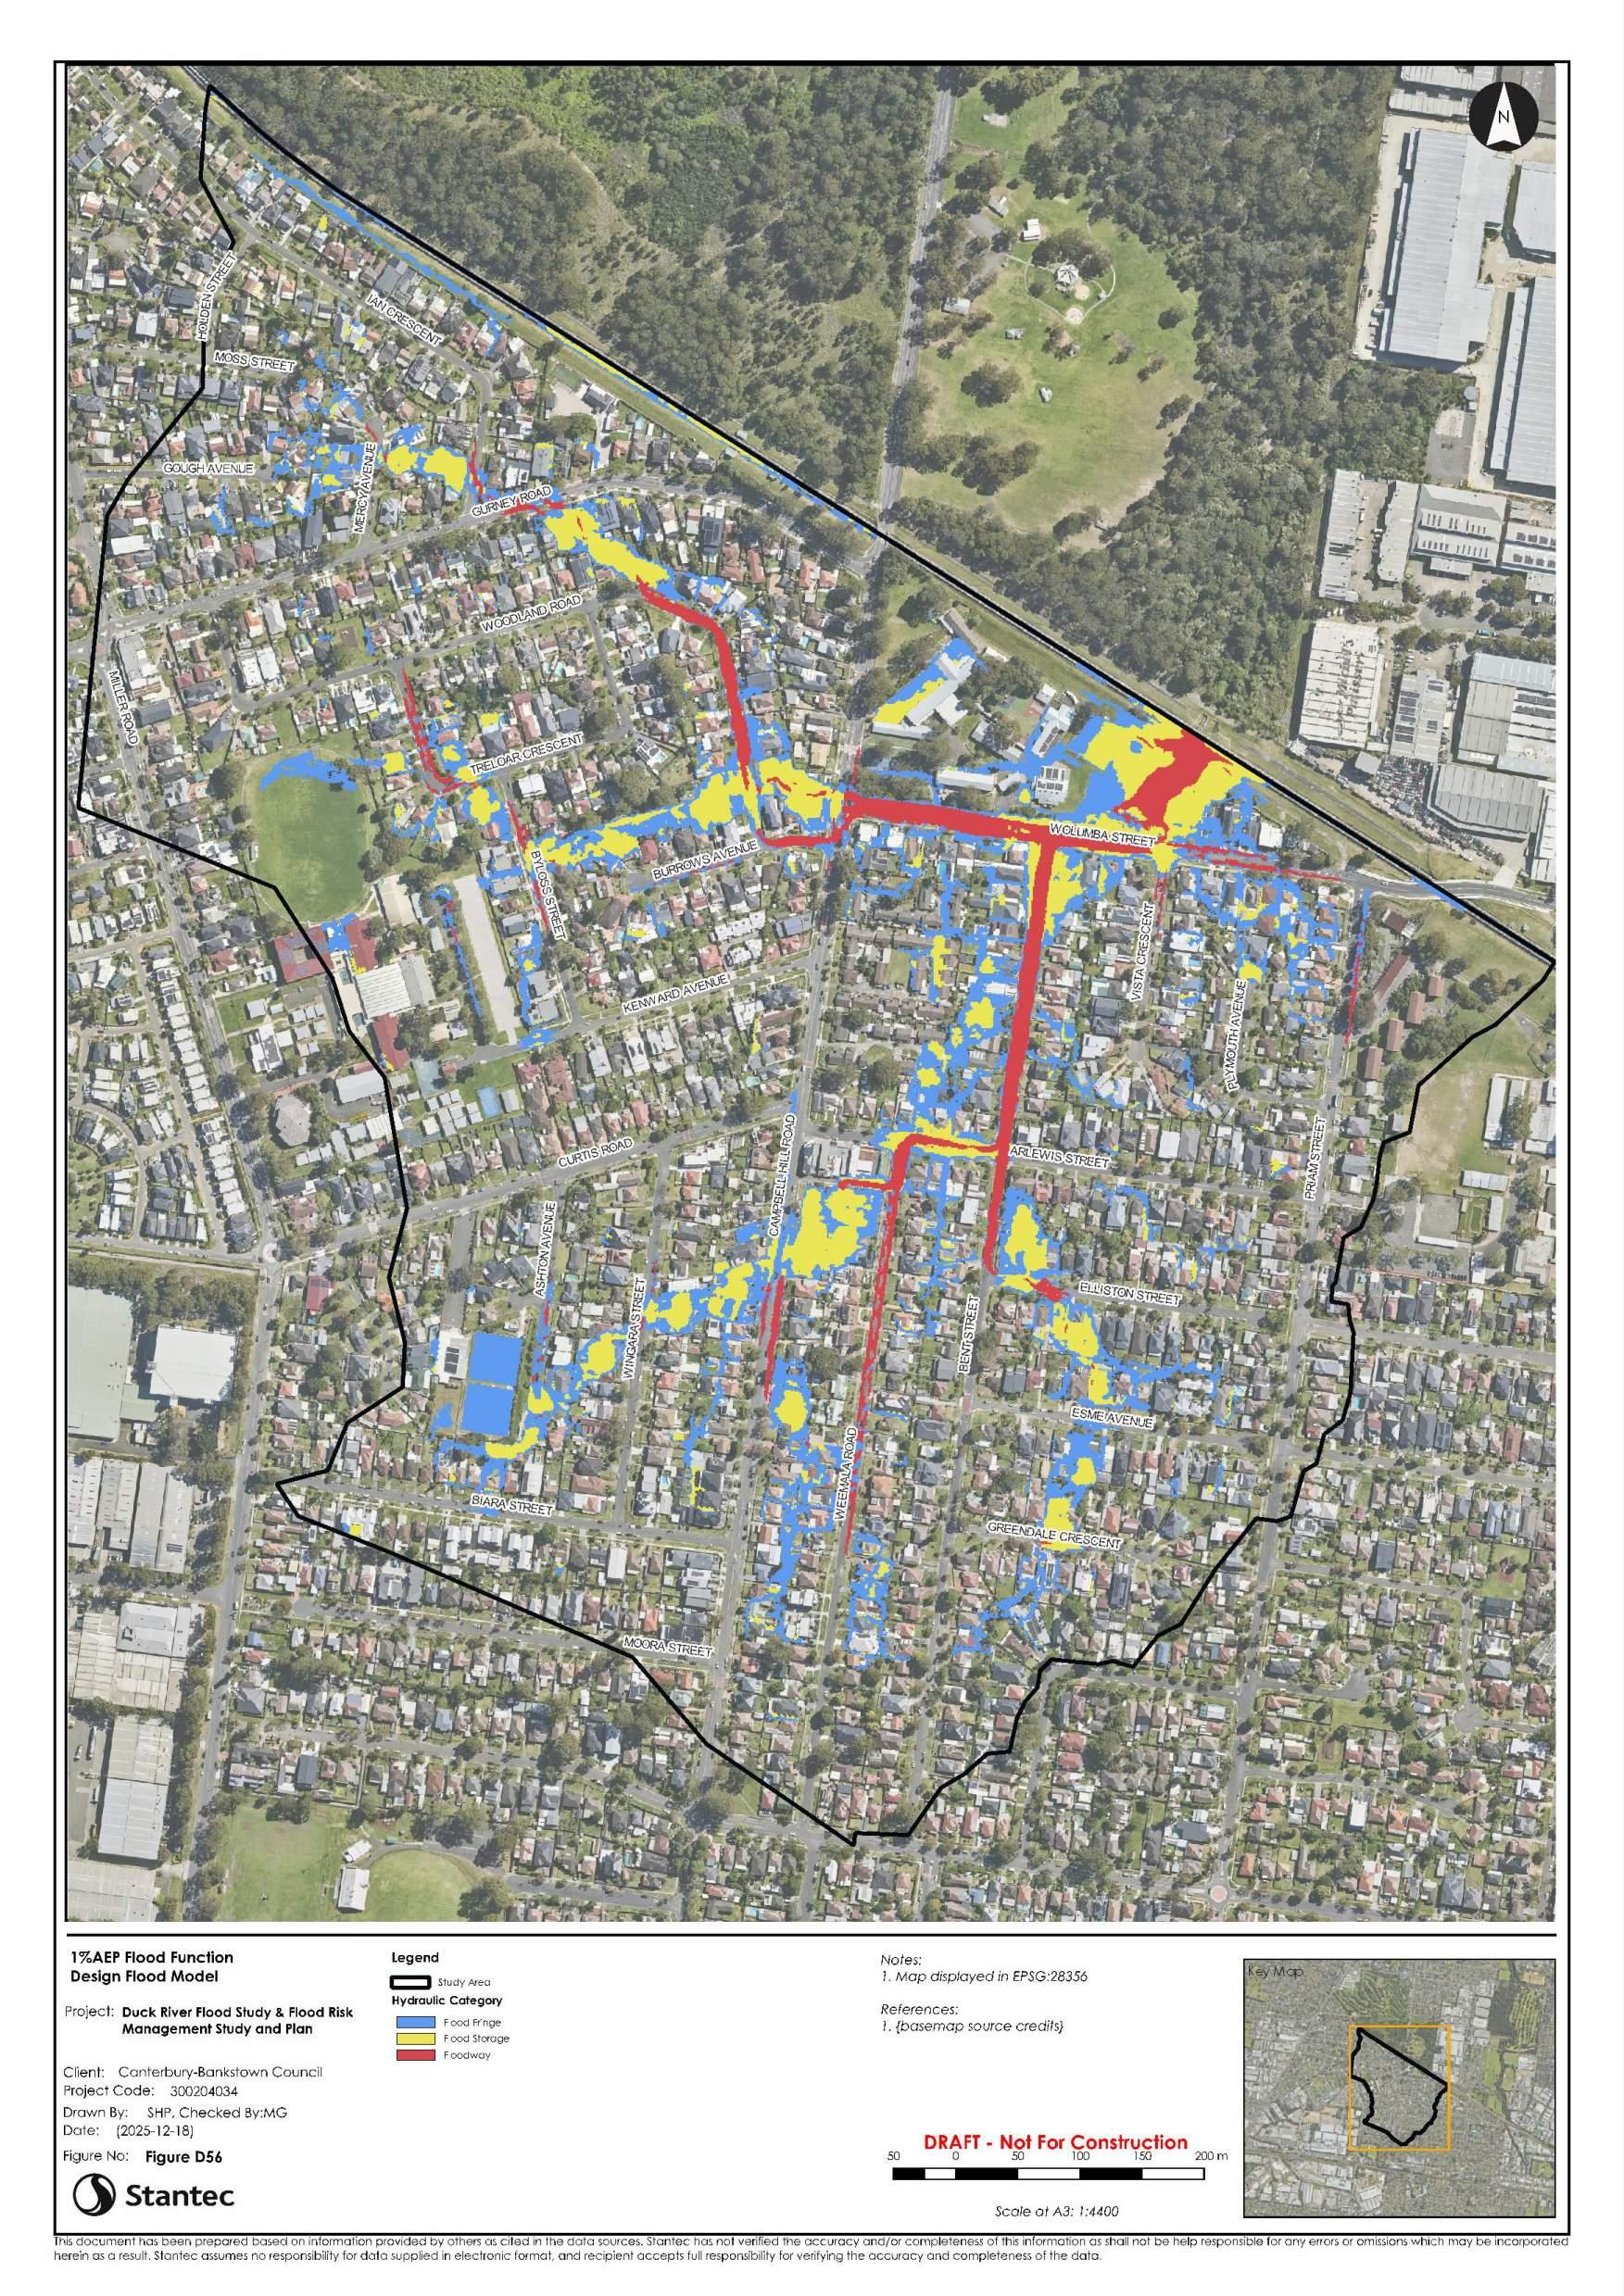
Flood maps in Appendix D include peak flood level contours and extents, peak flood depths, peak velocities, H1-H6 flood hazard categories, duration of inundation, pipe capacity and flood function mapping. In addition, critical duration mapping has been included in Appendix B, which identifies the critical storm durations for modelling throughout the study area
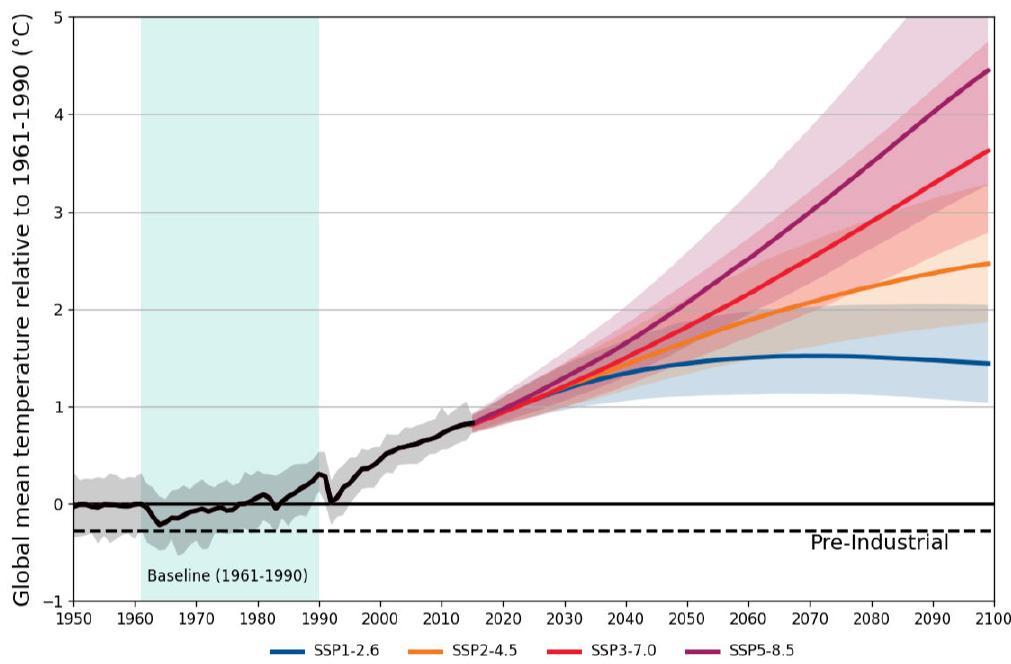
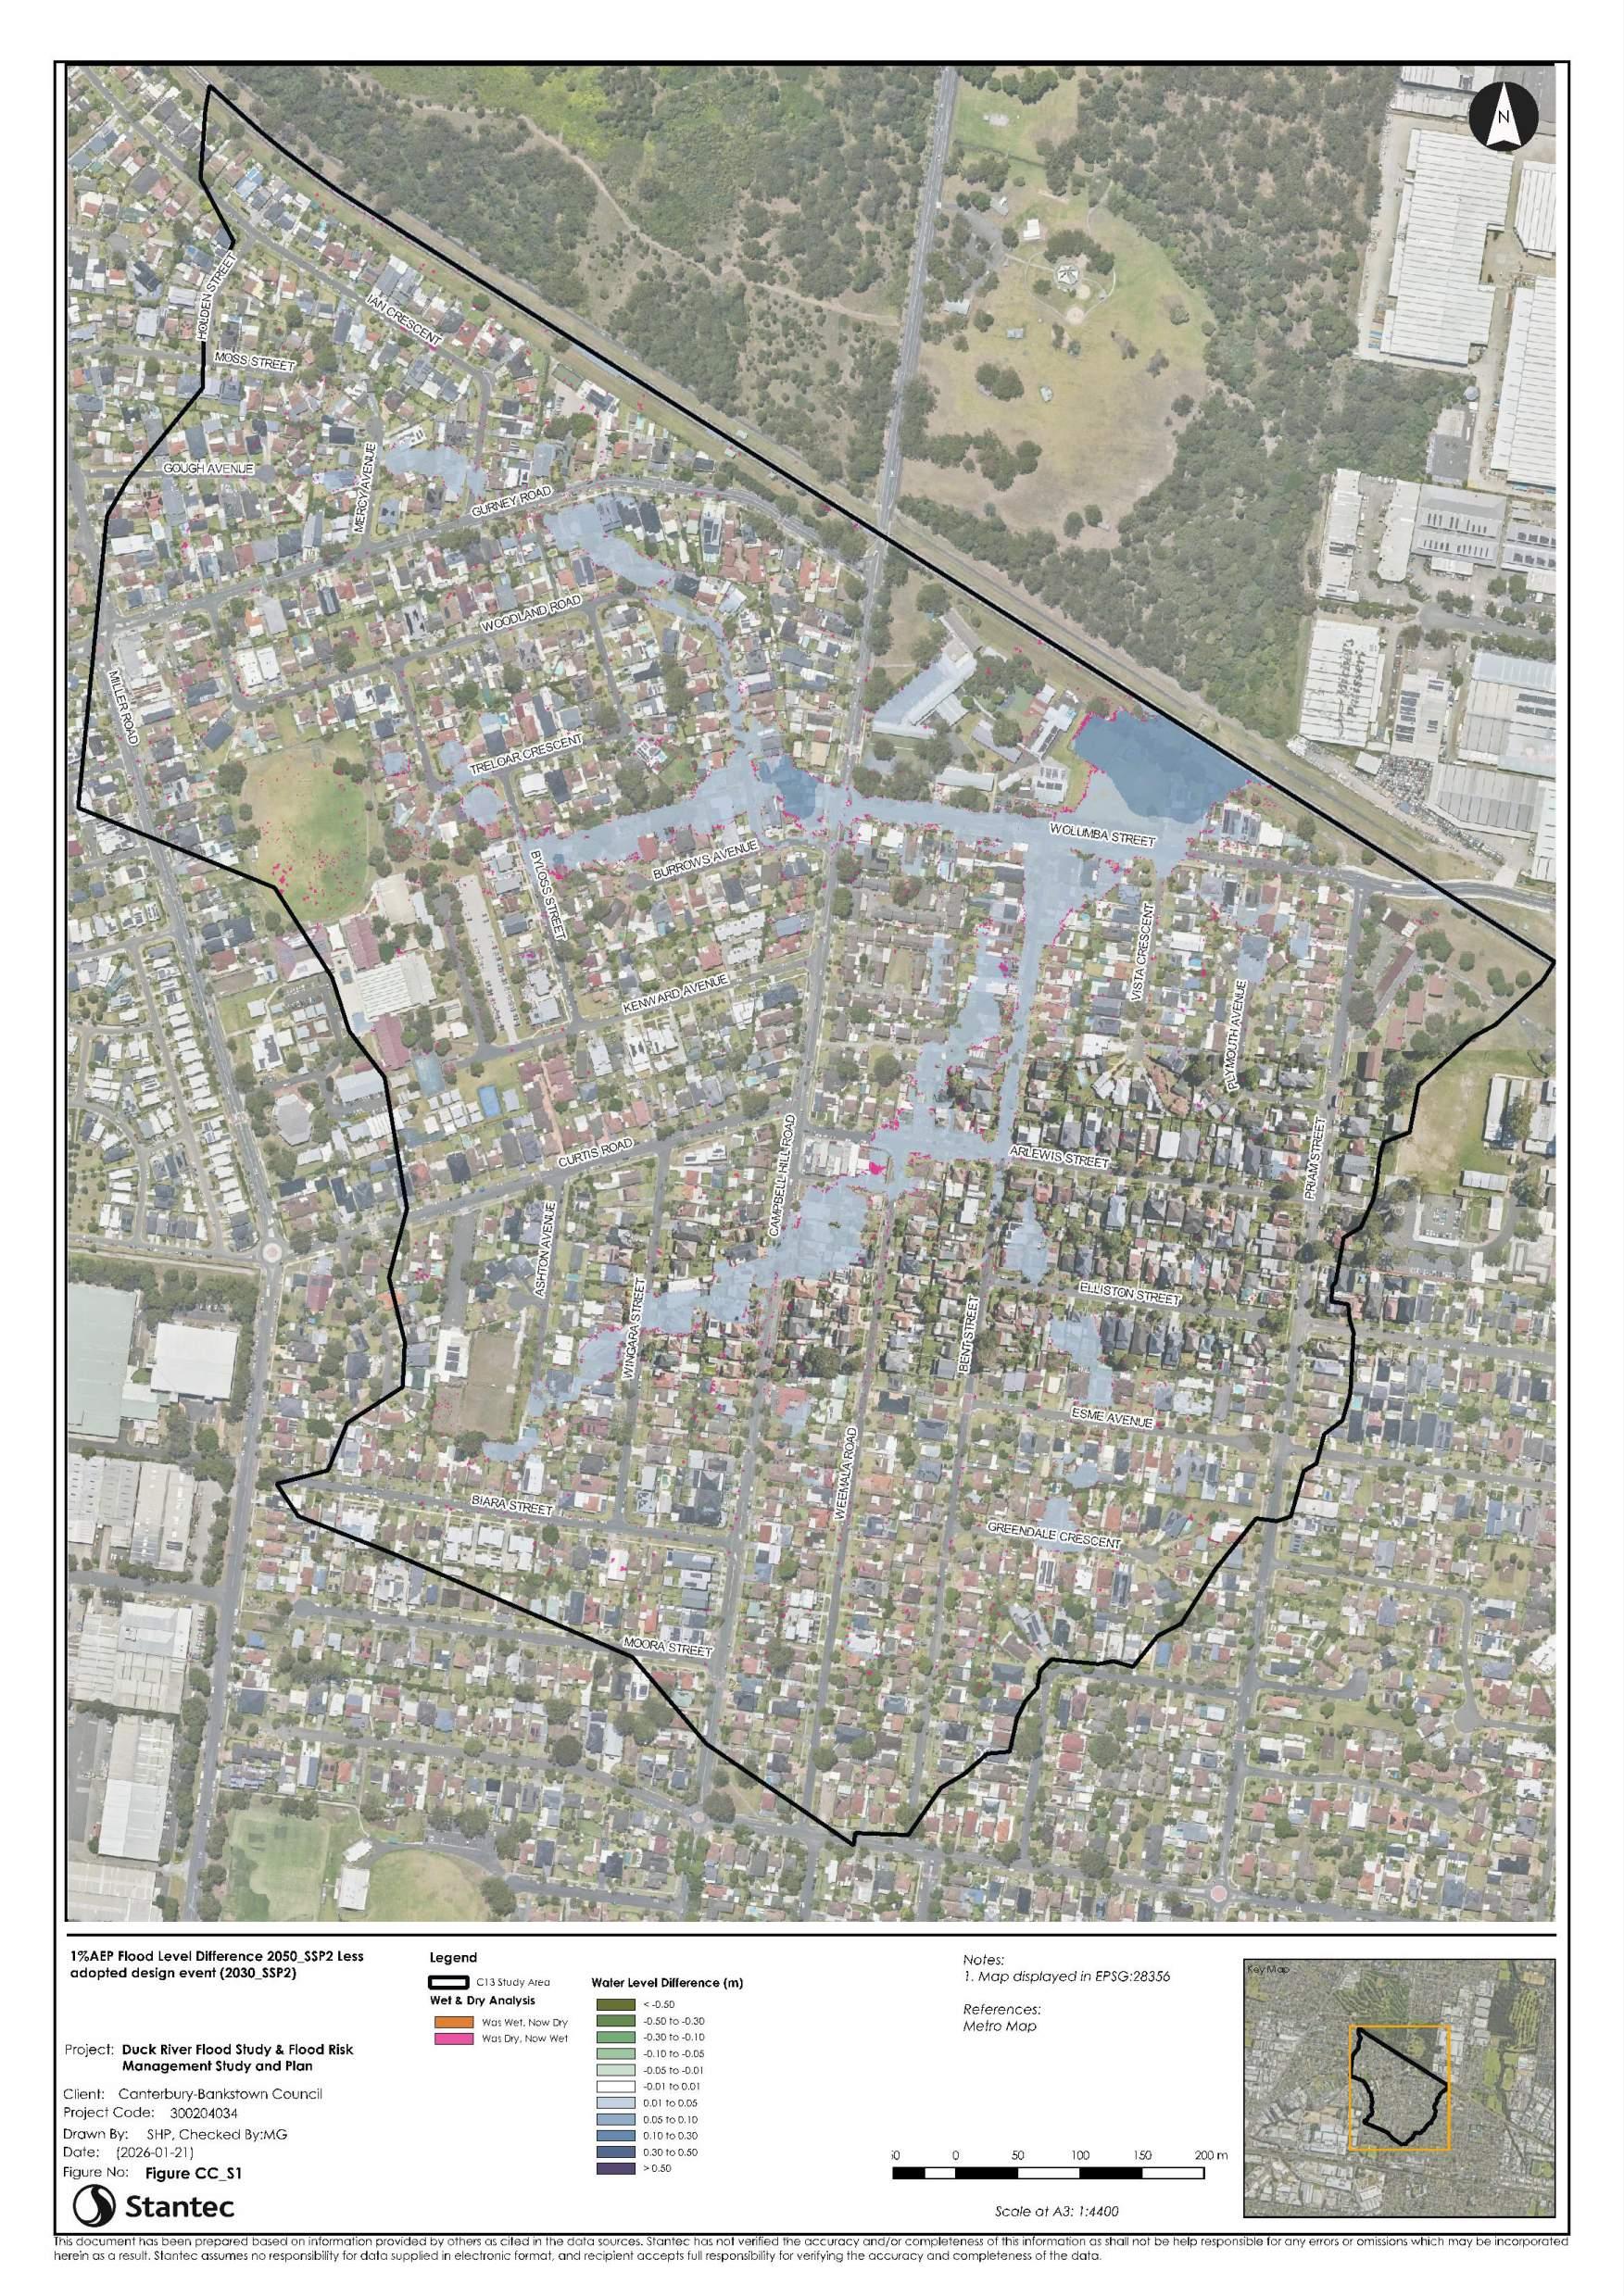
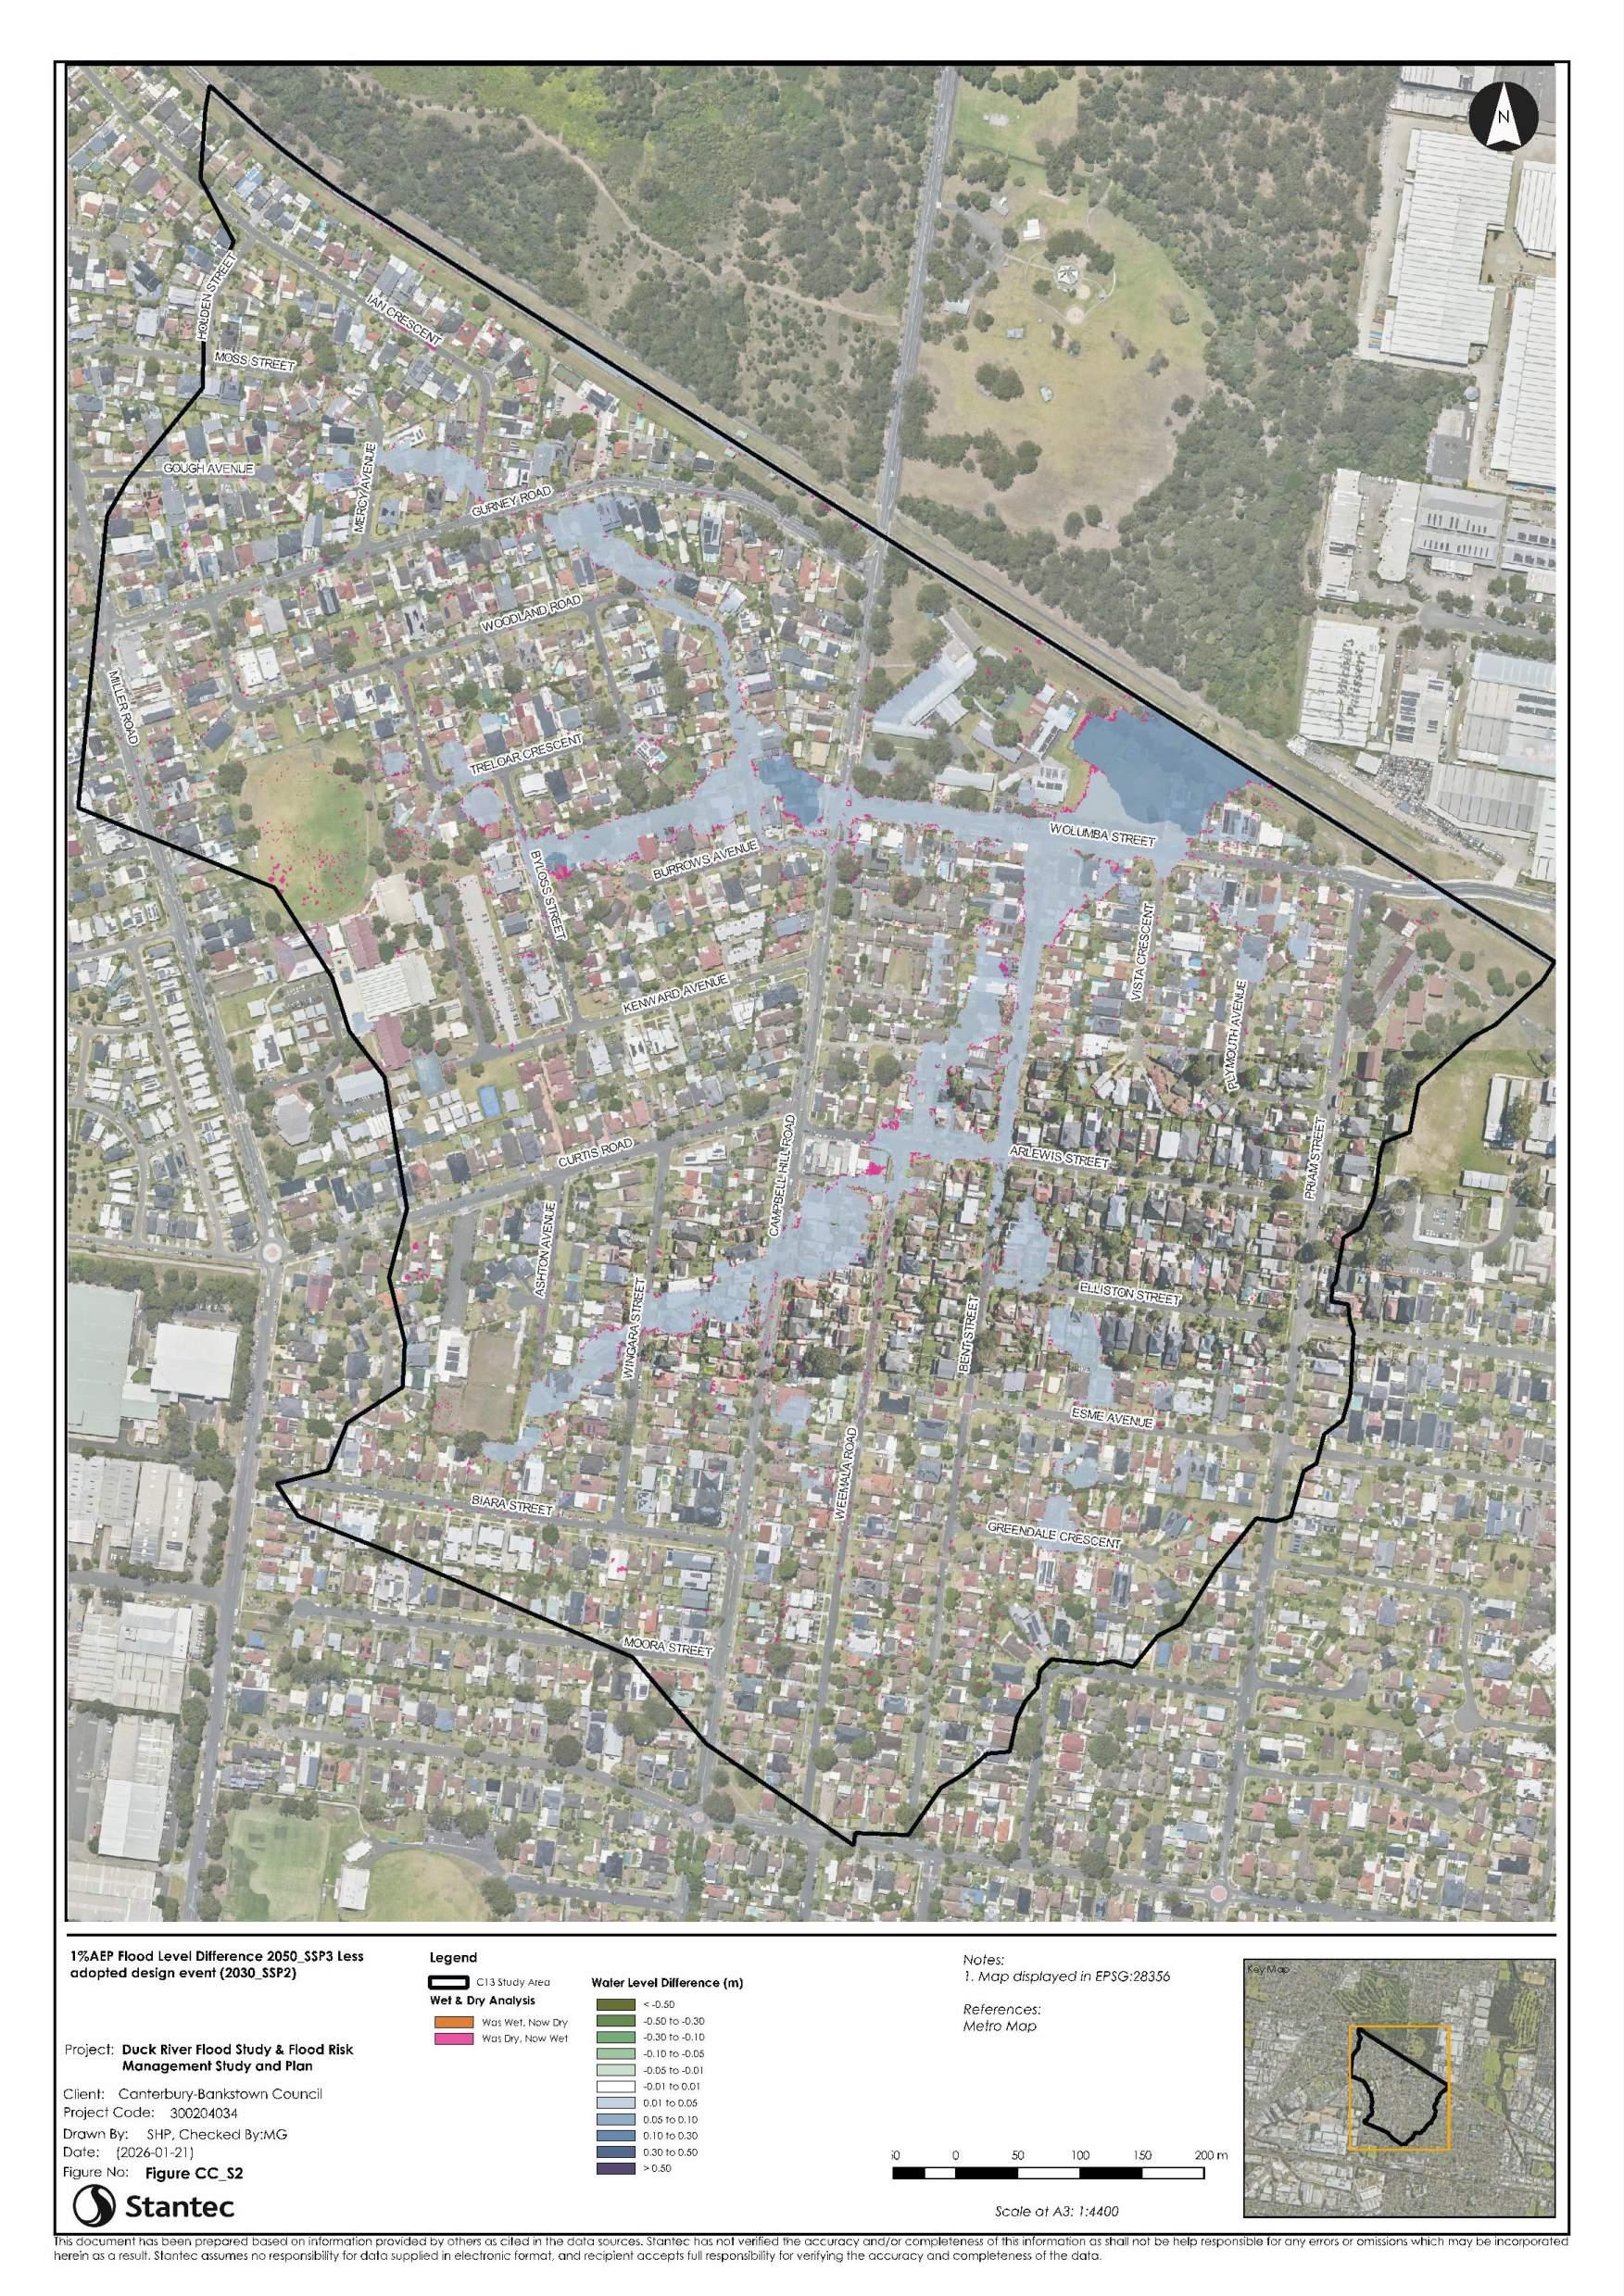
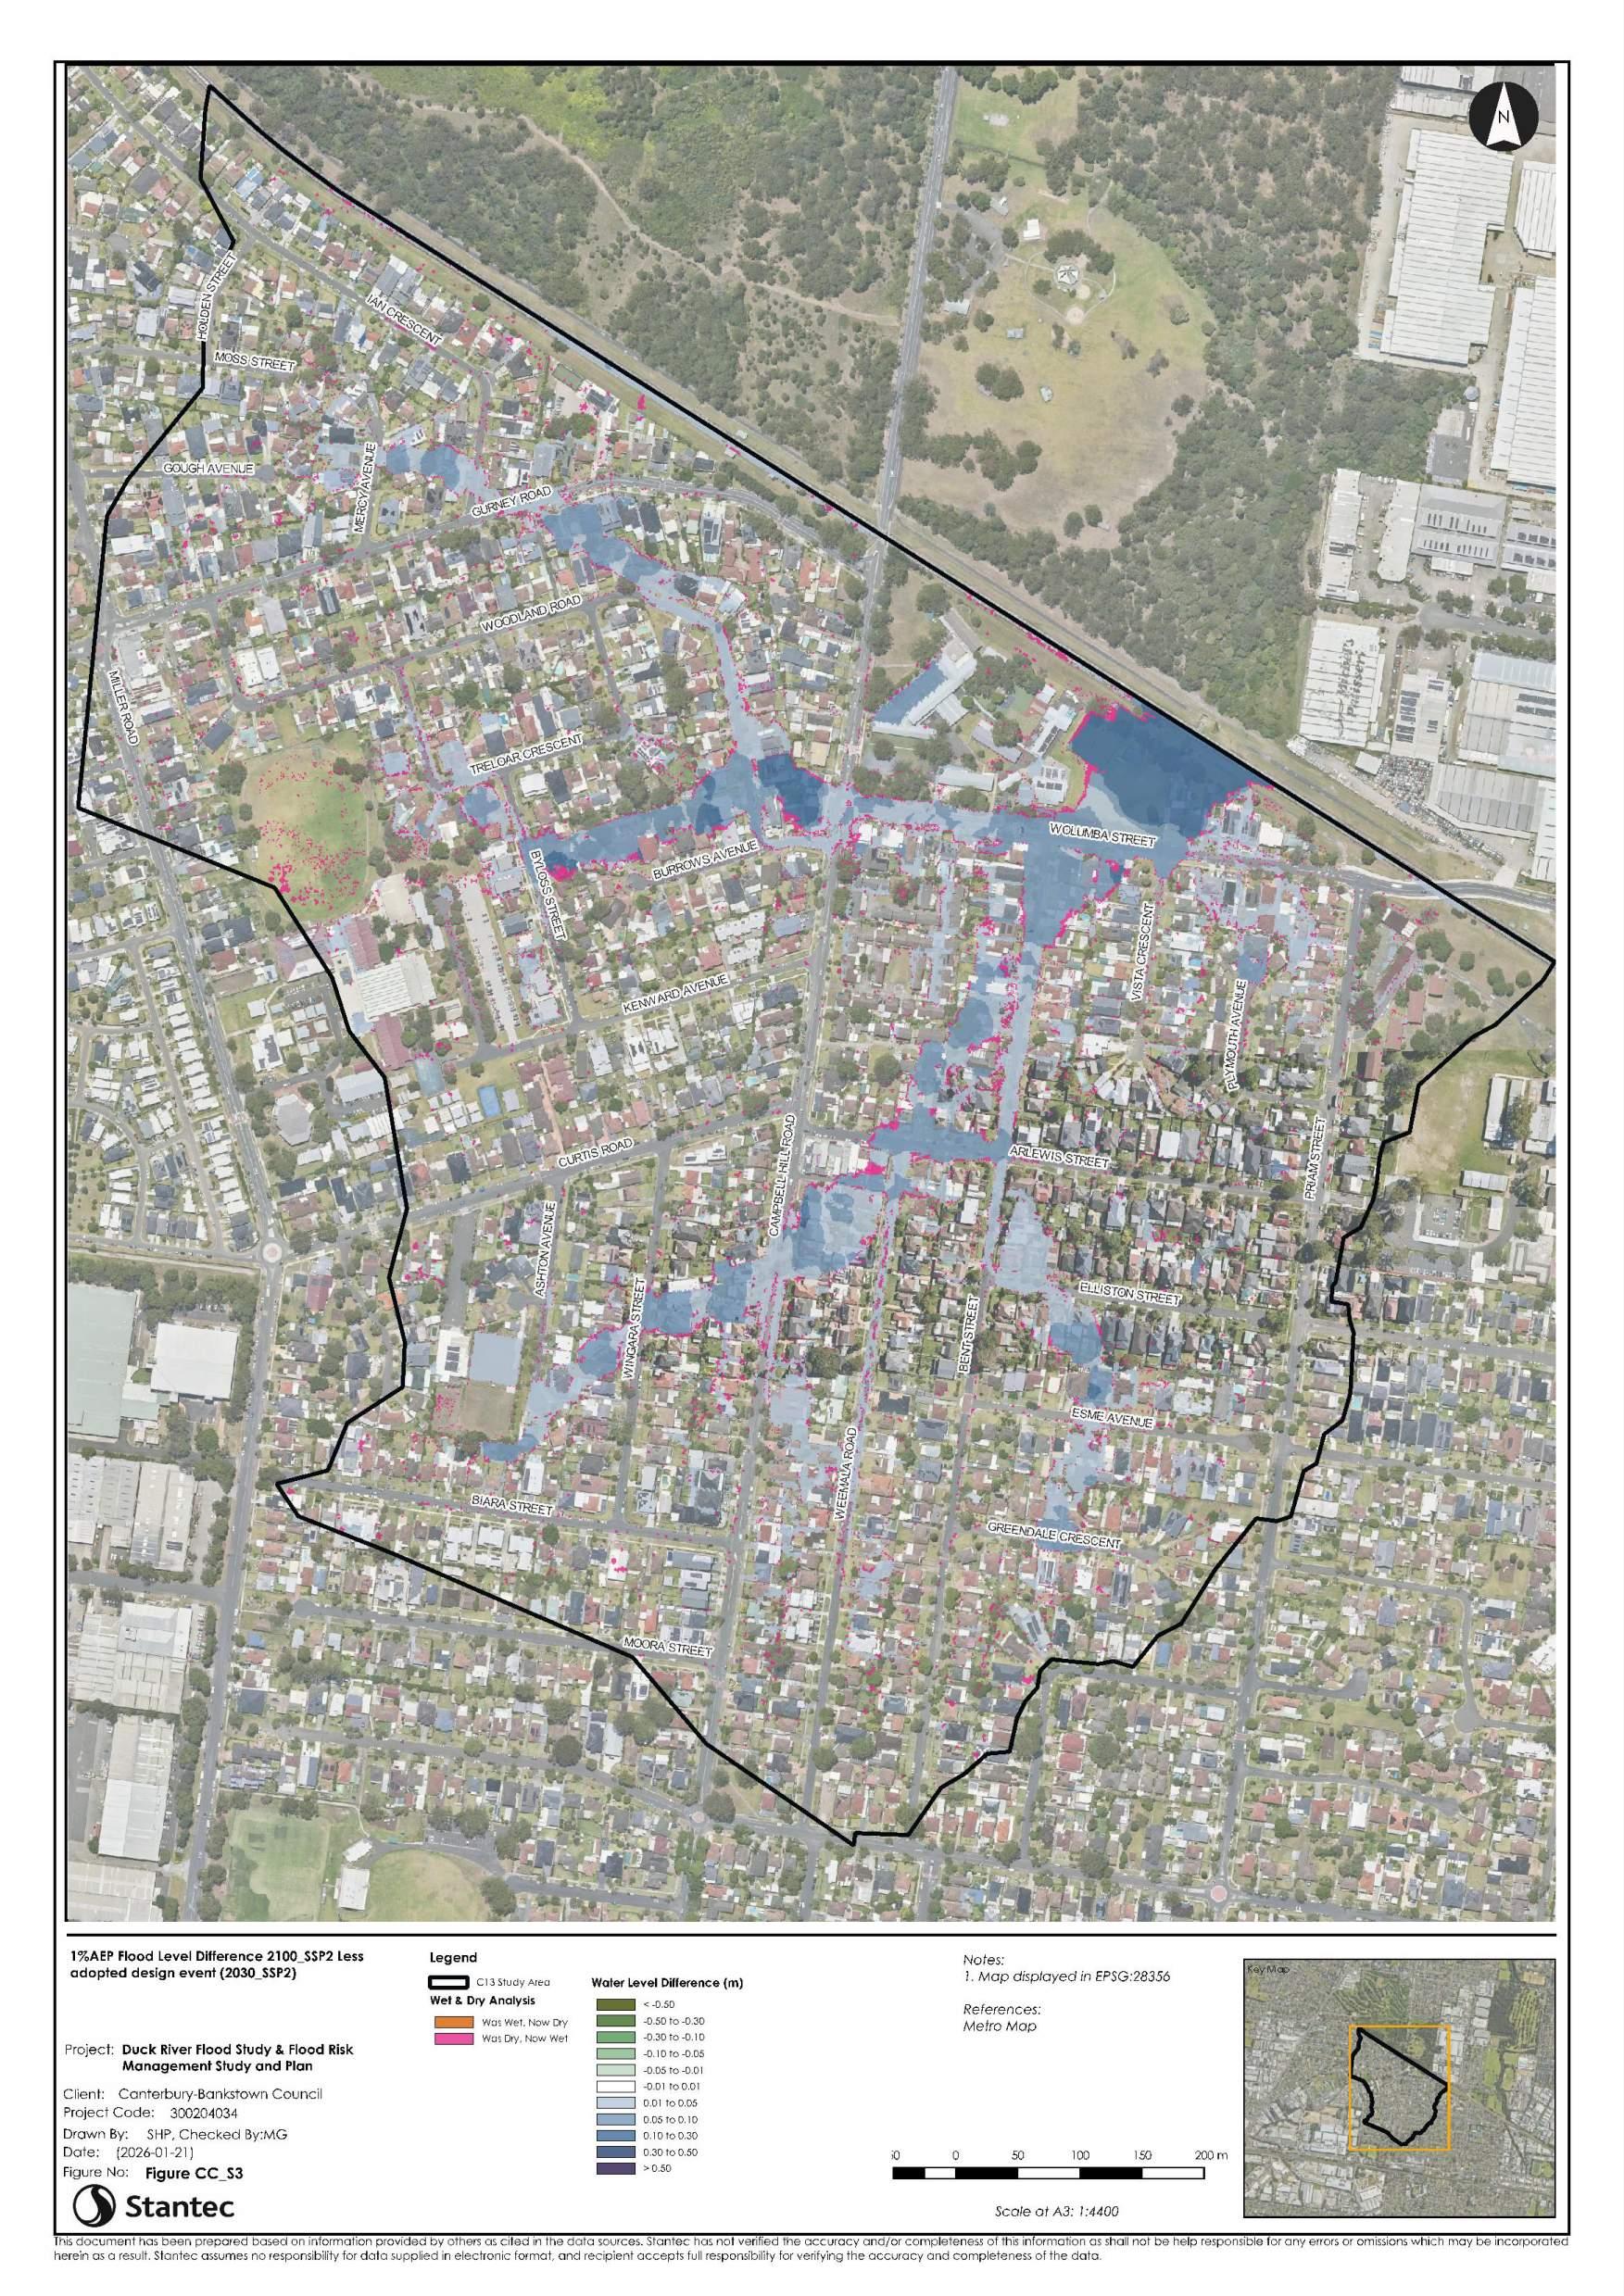
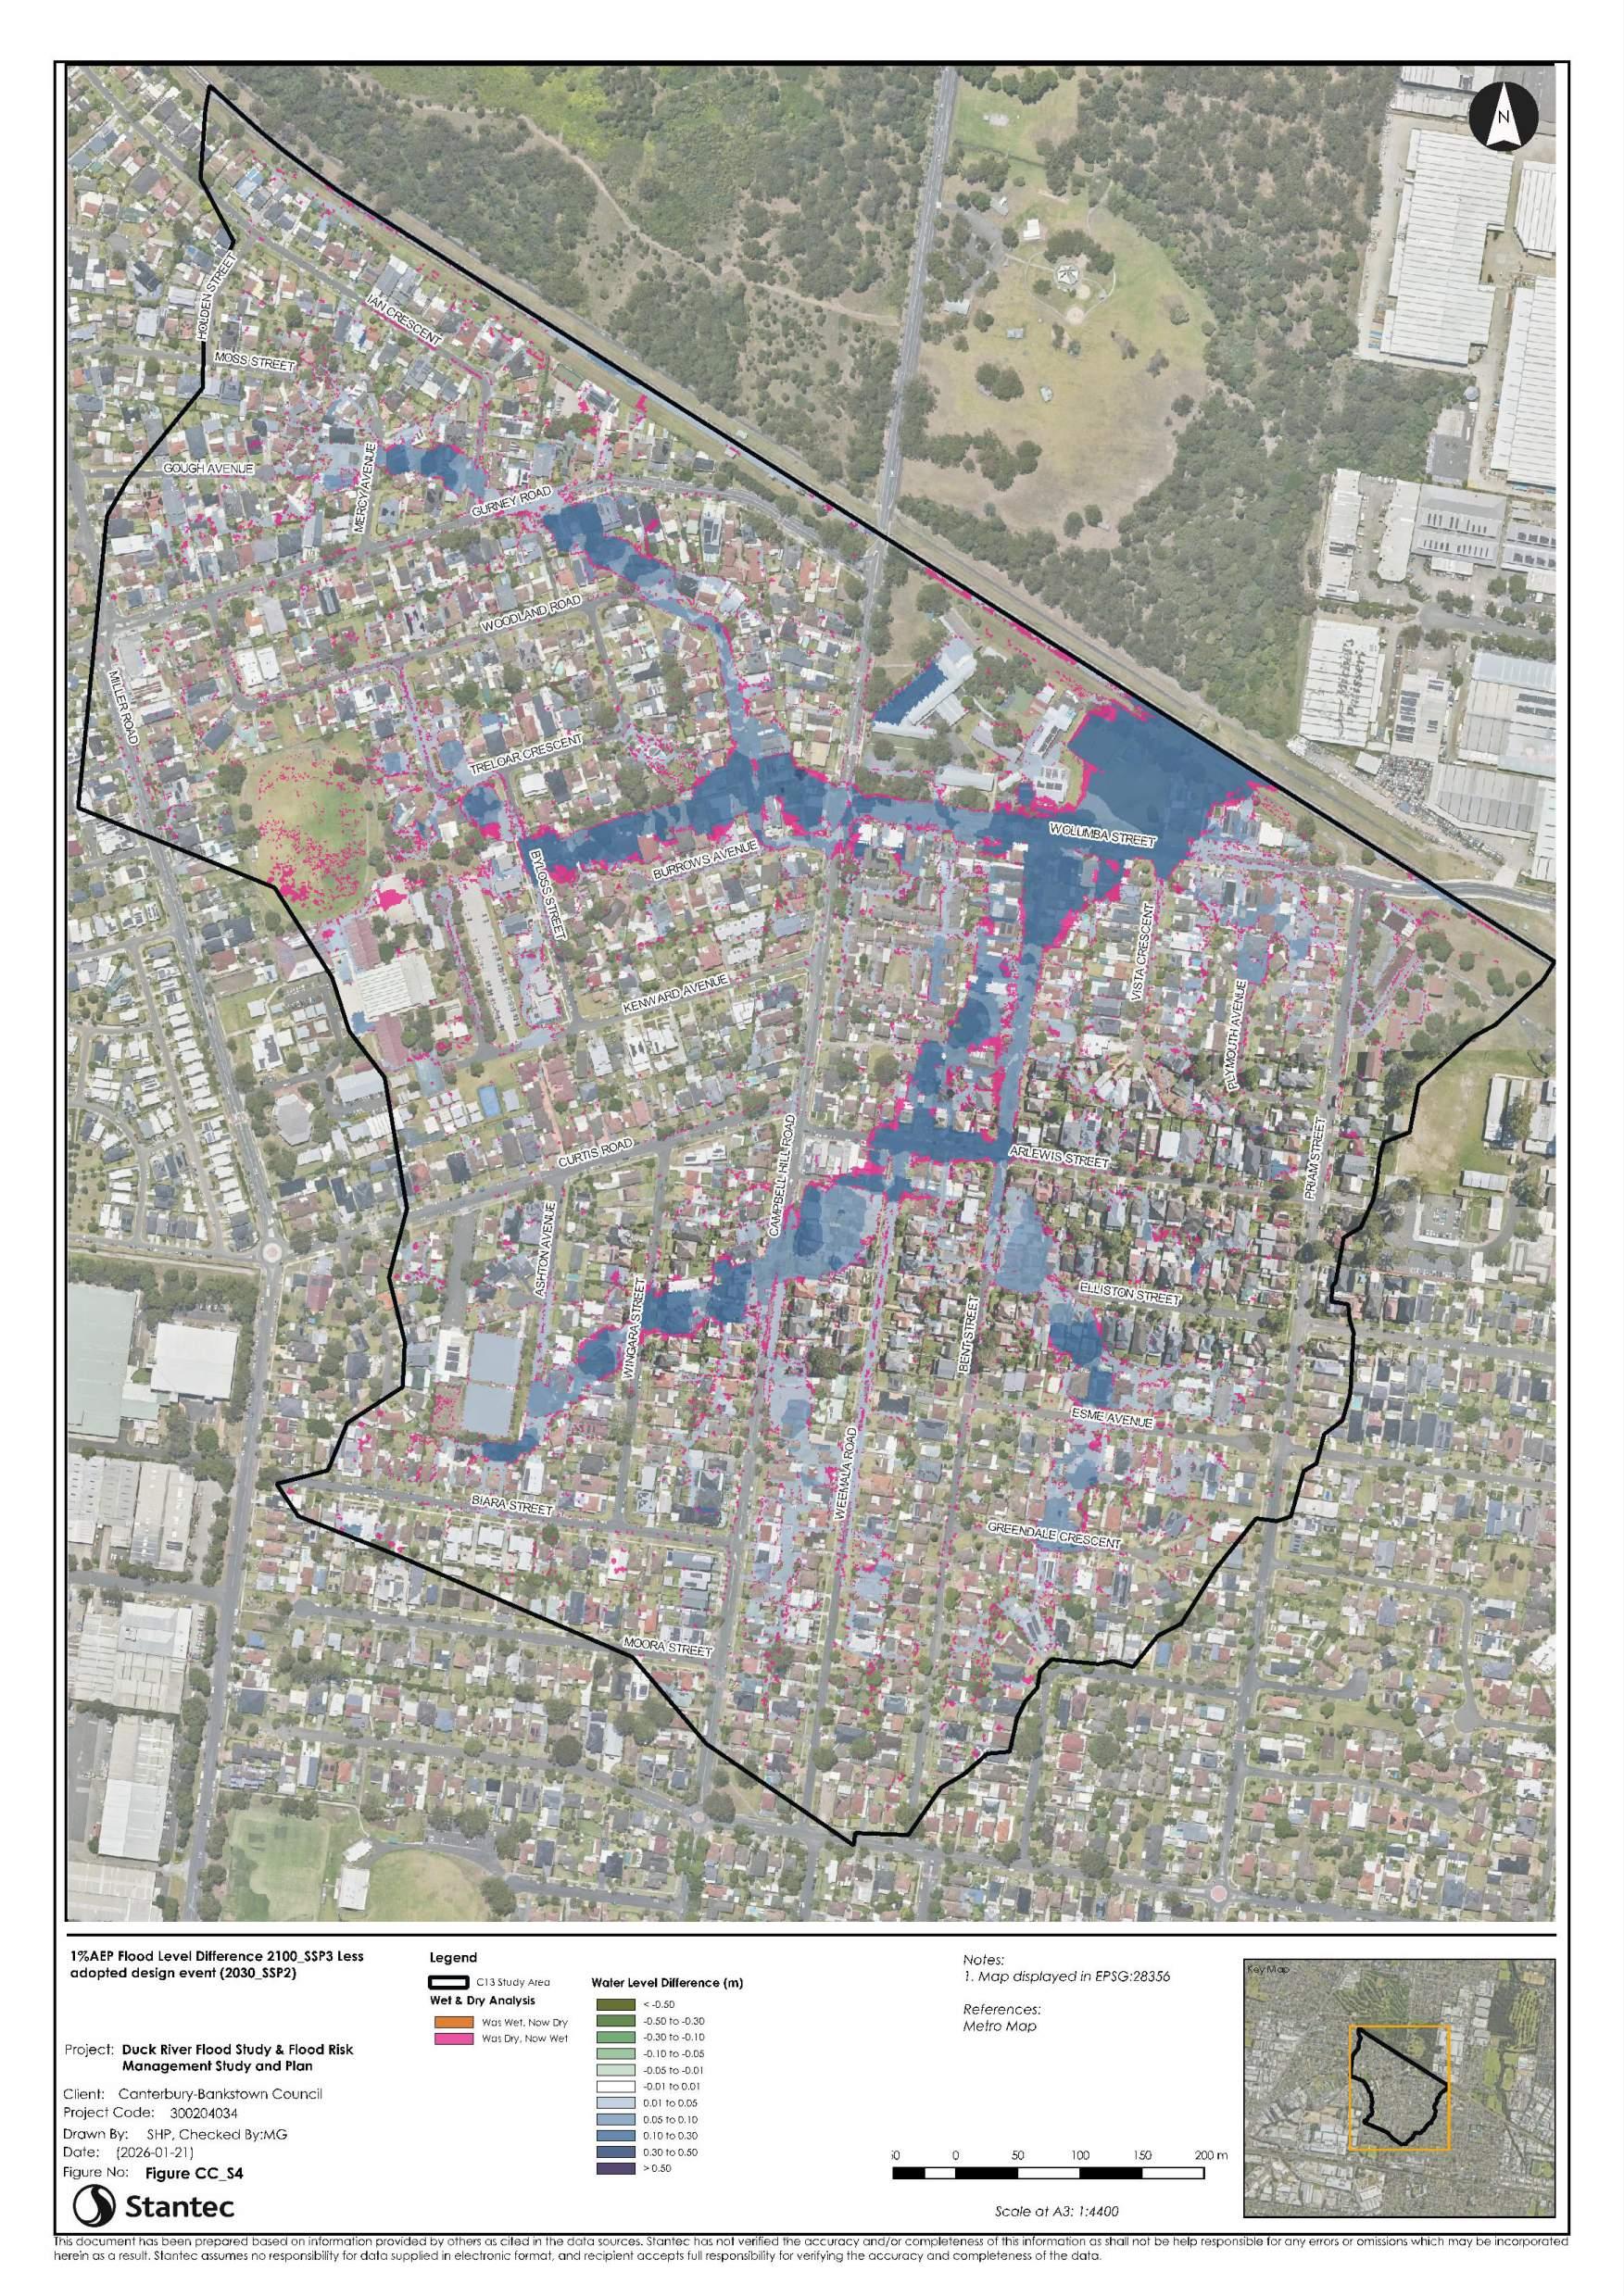
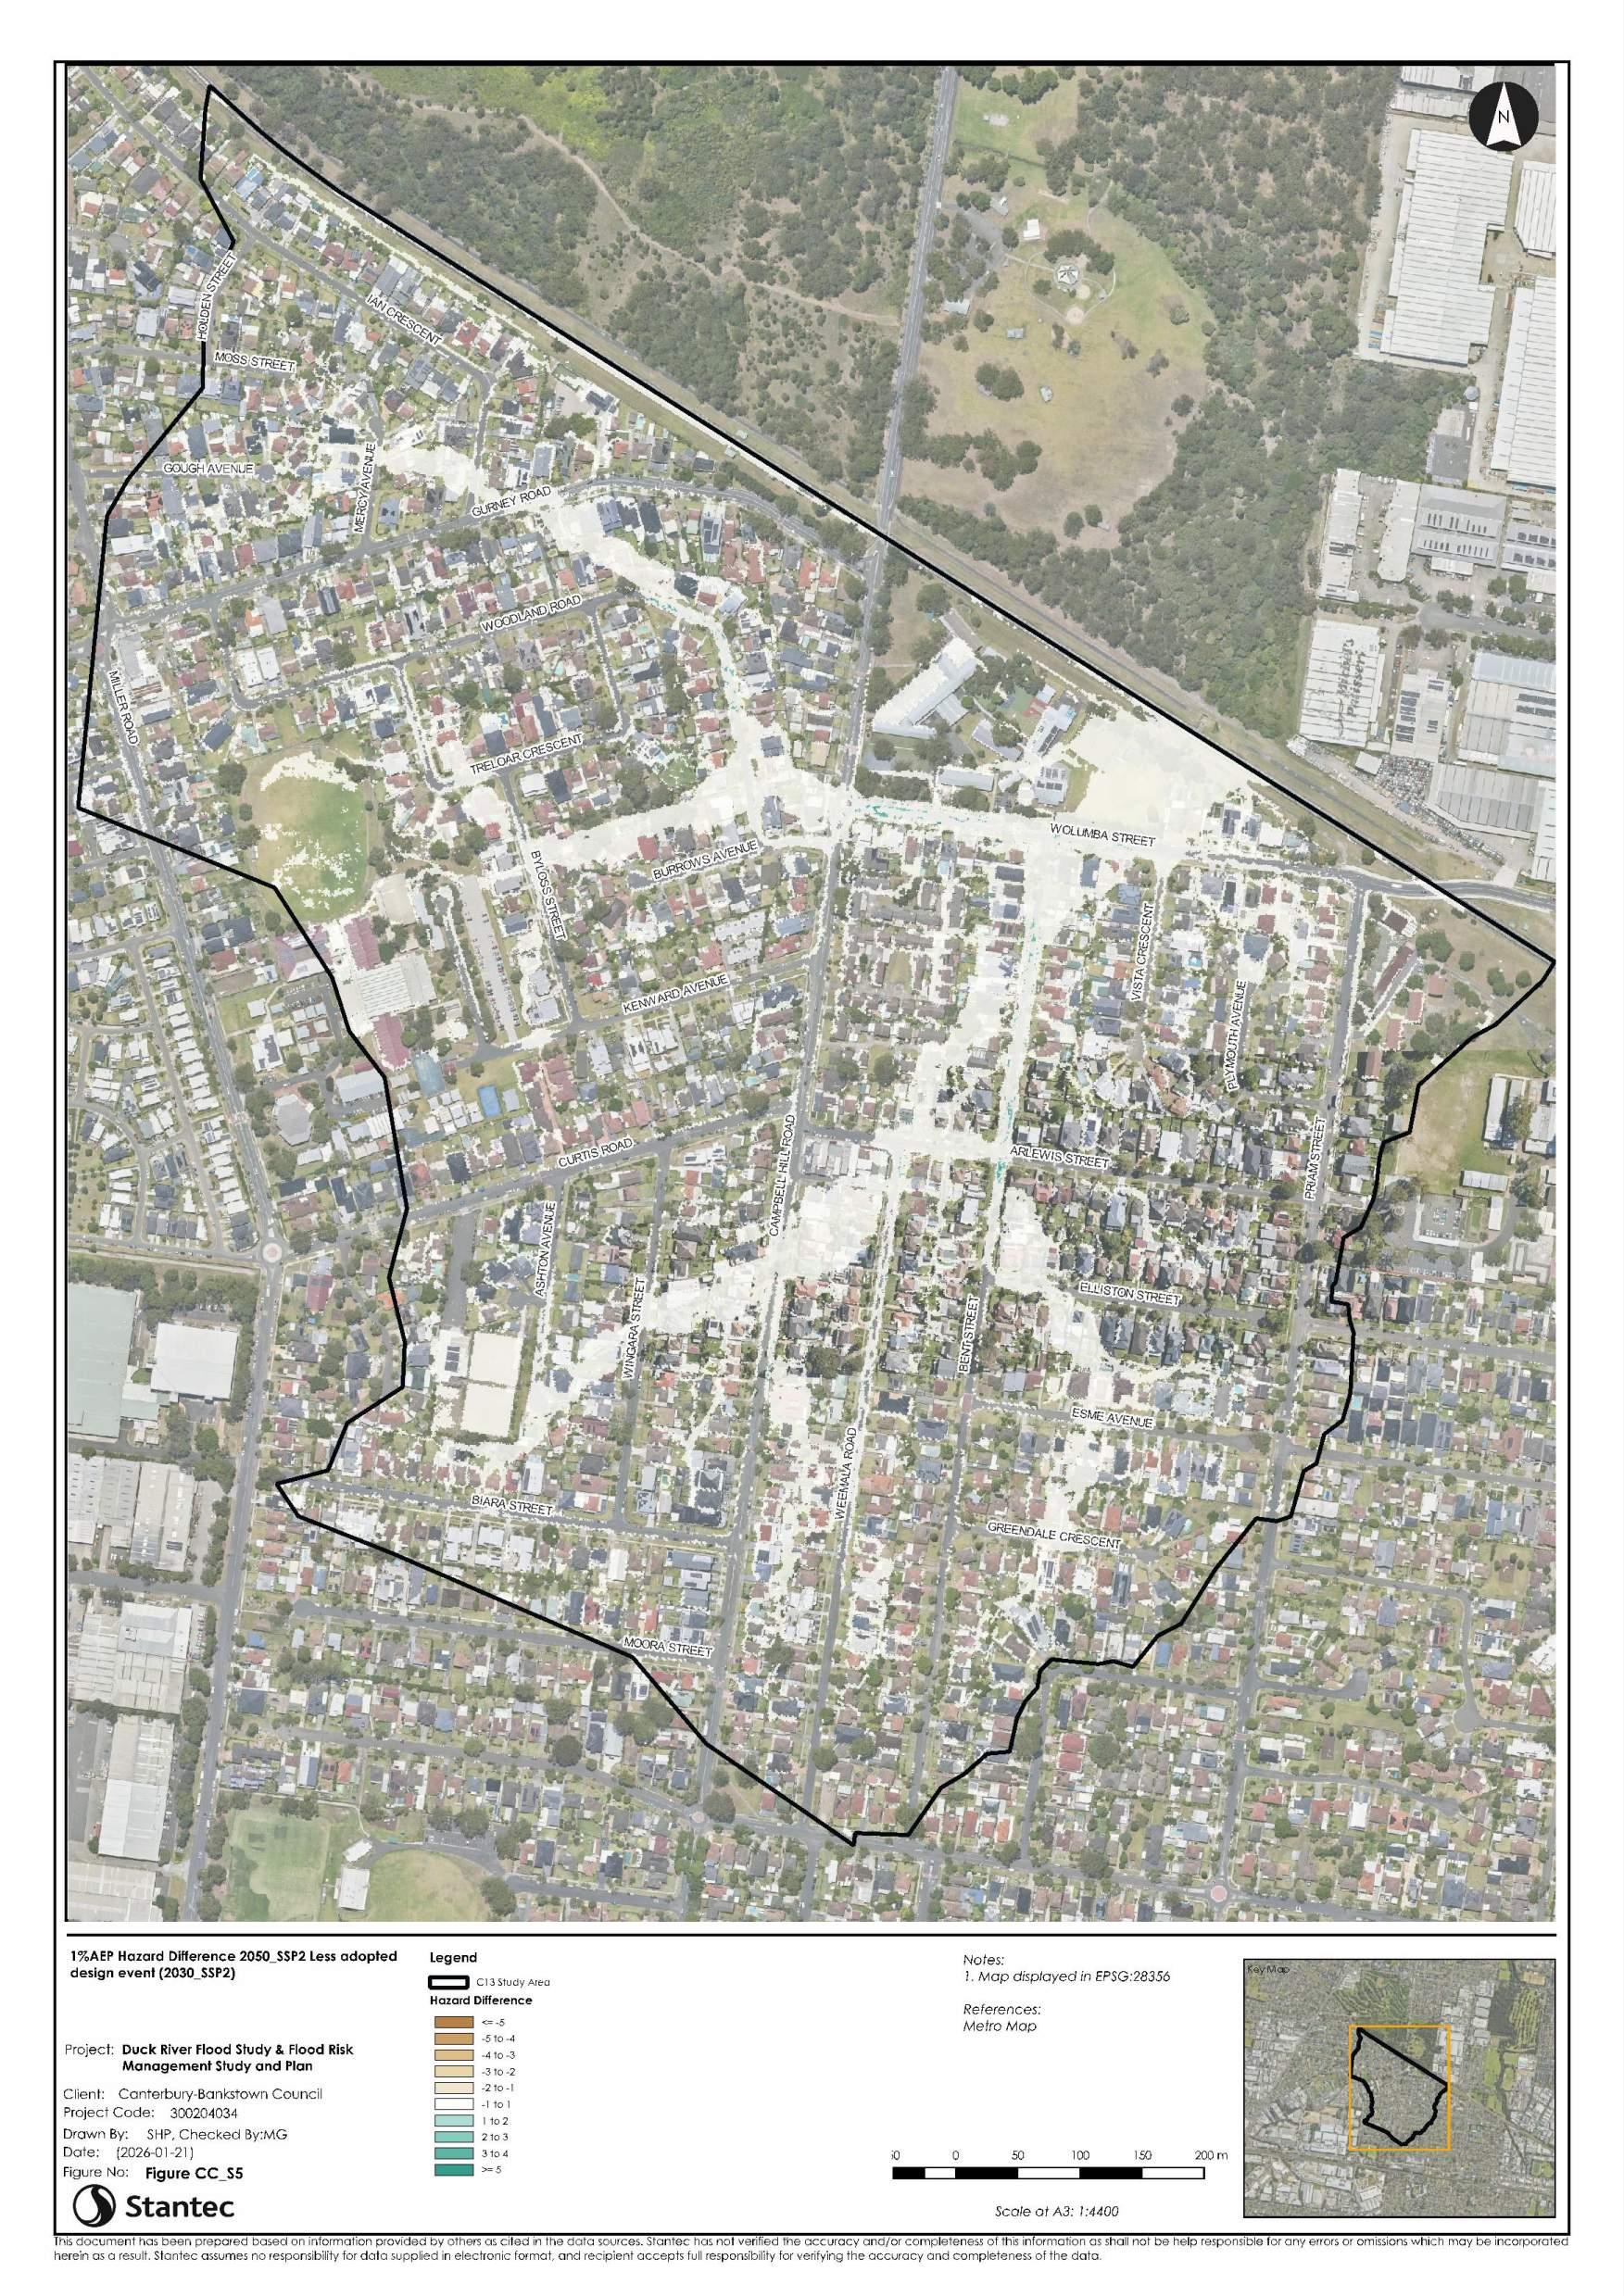
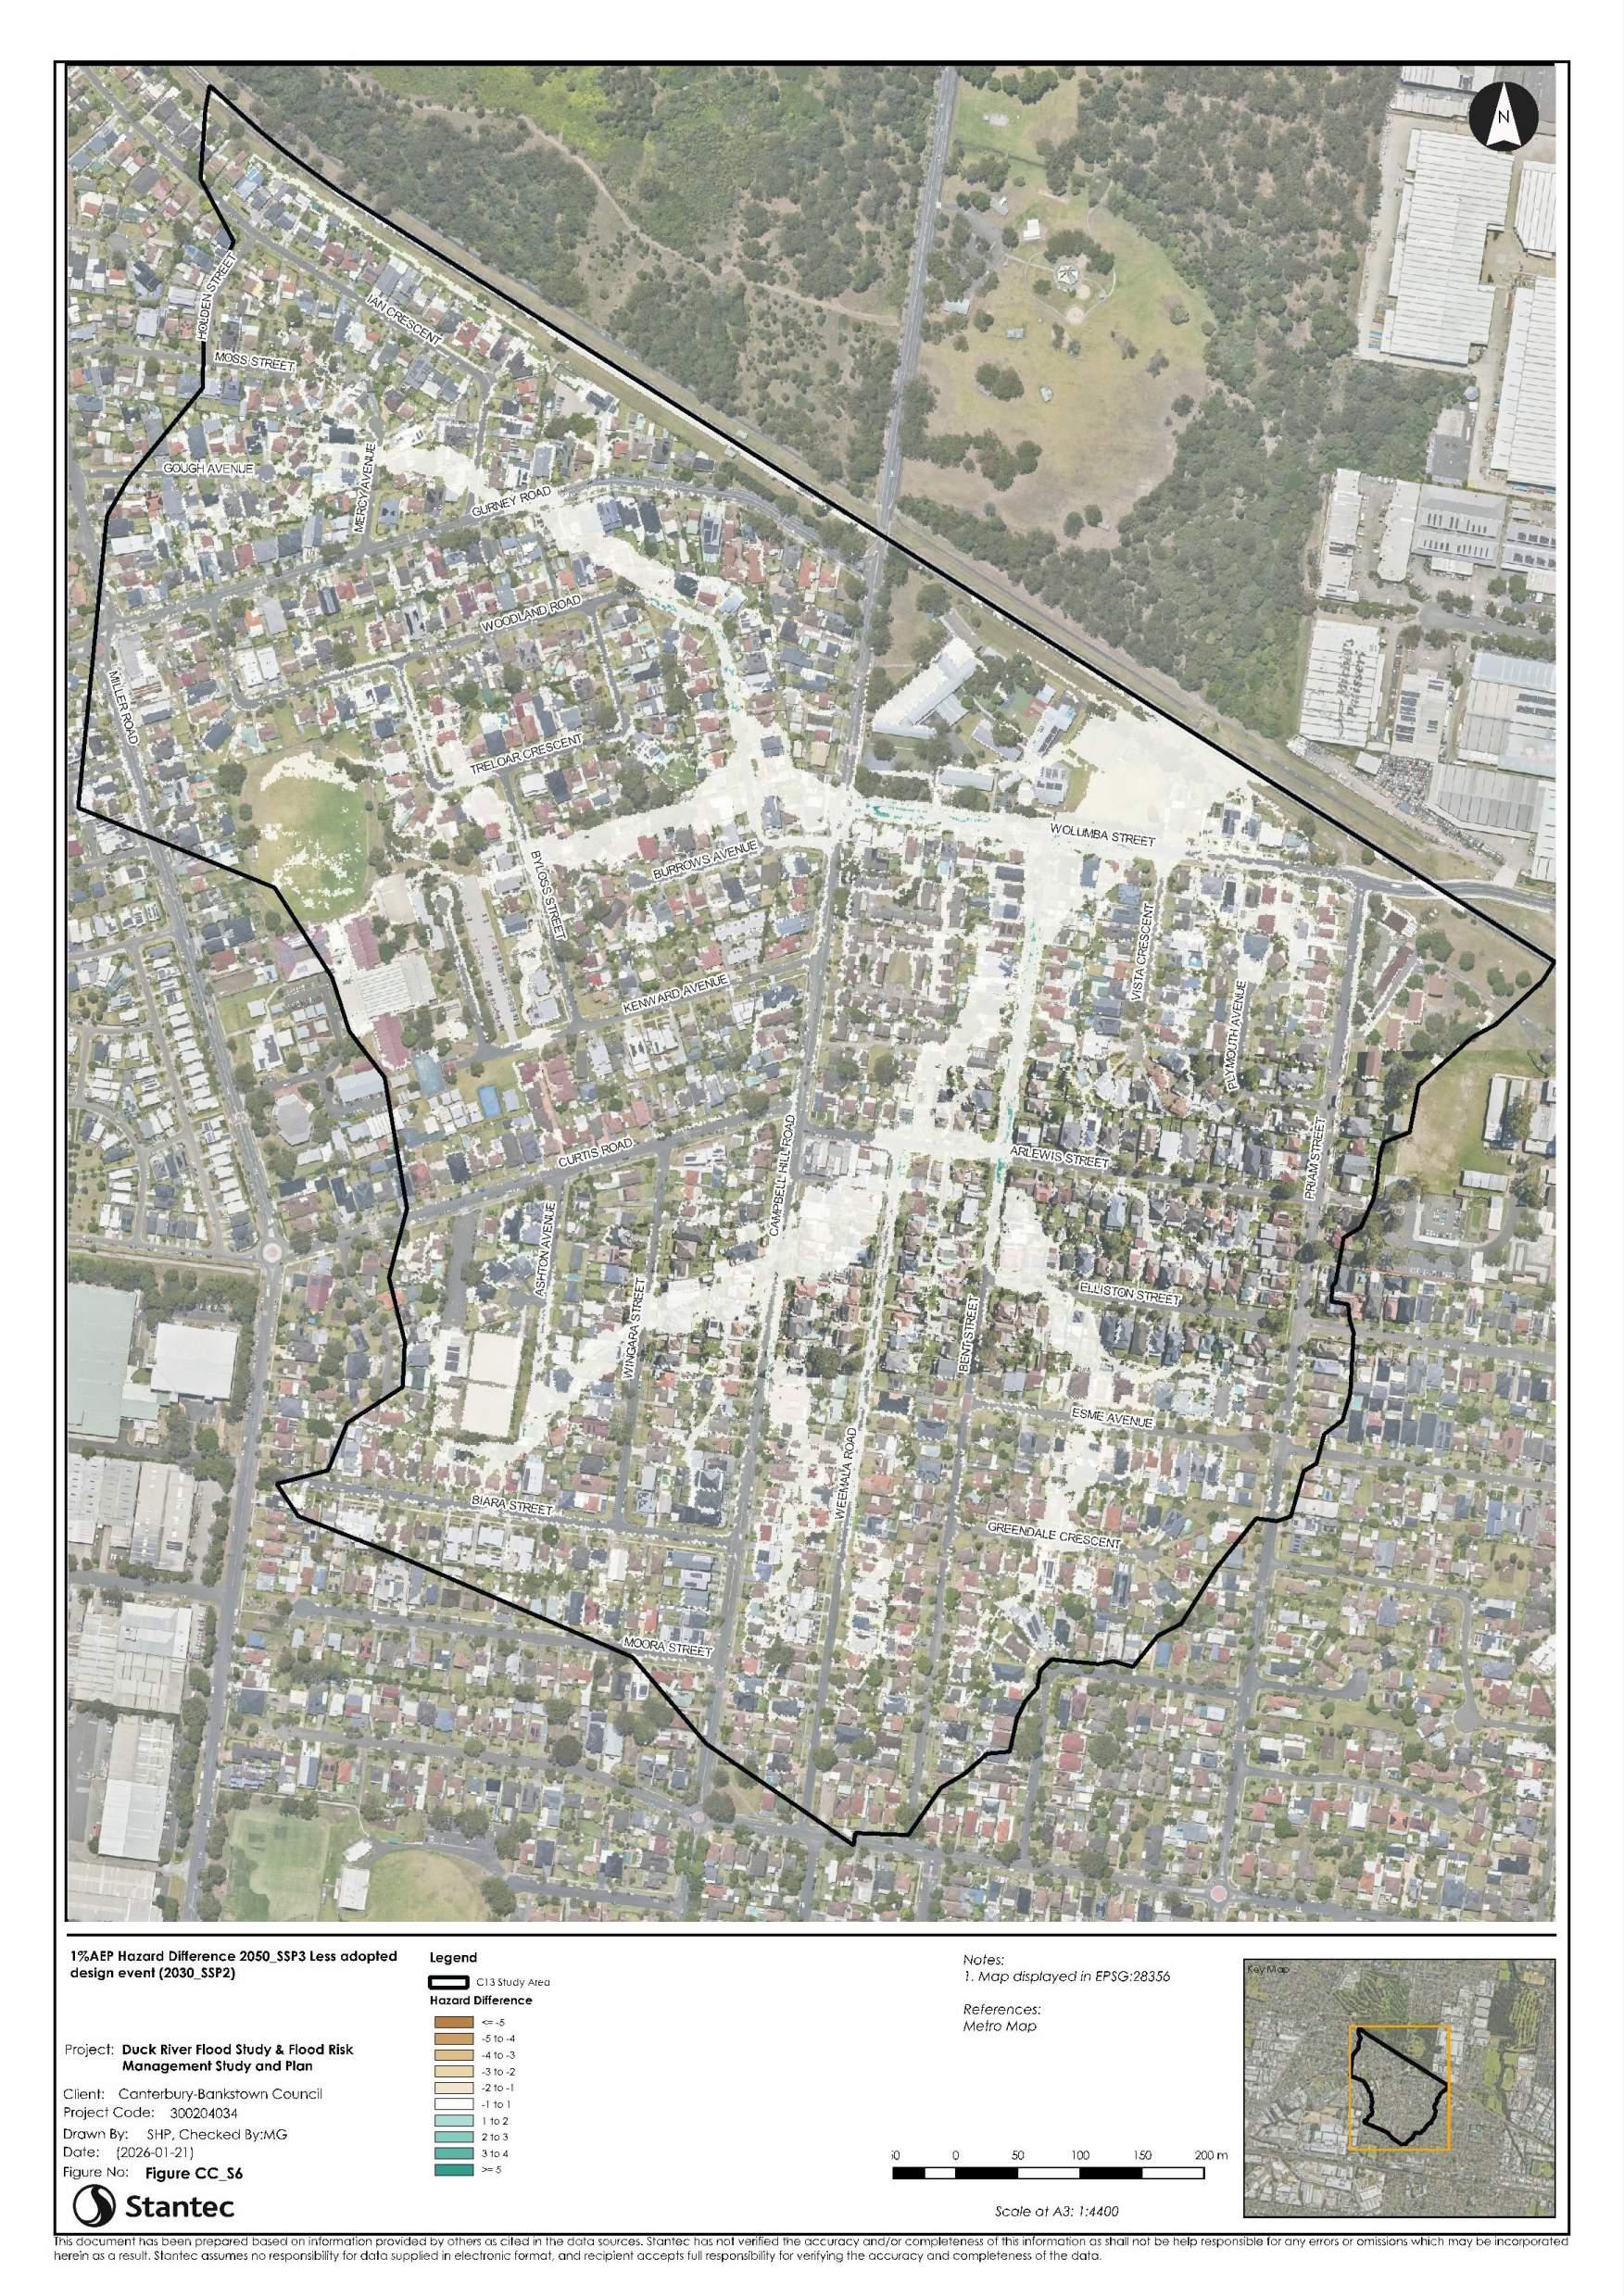
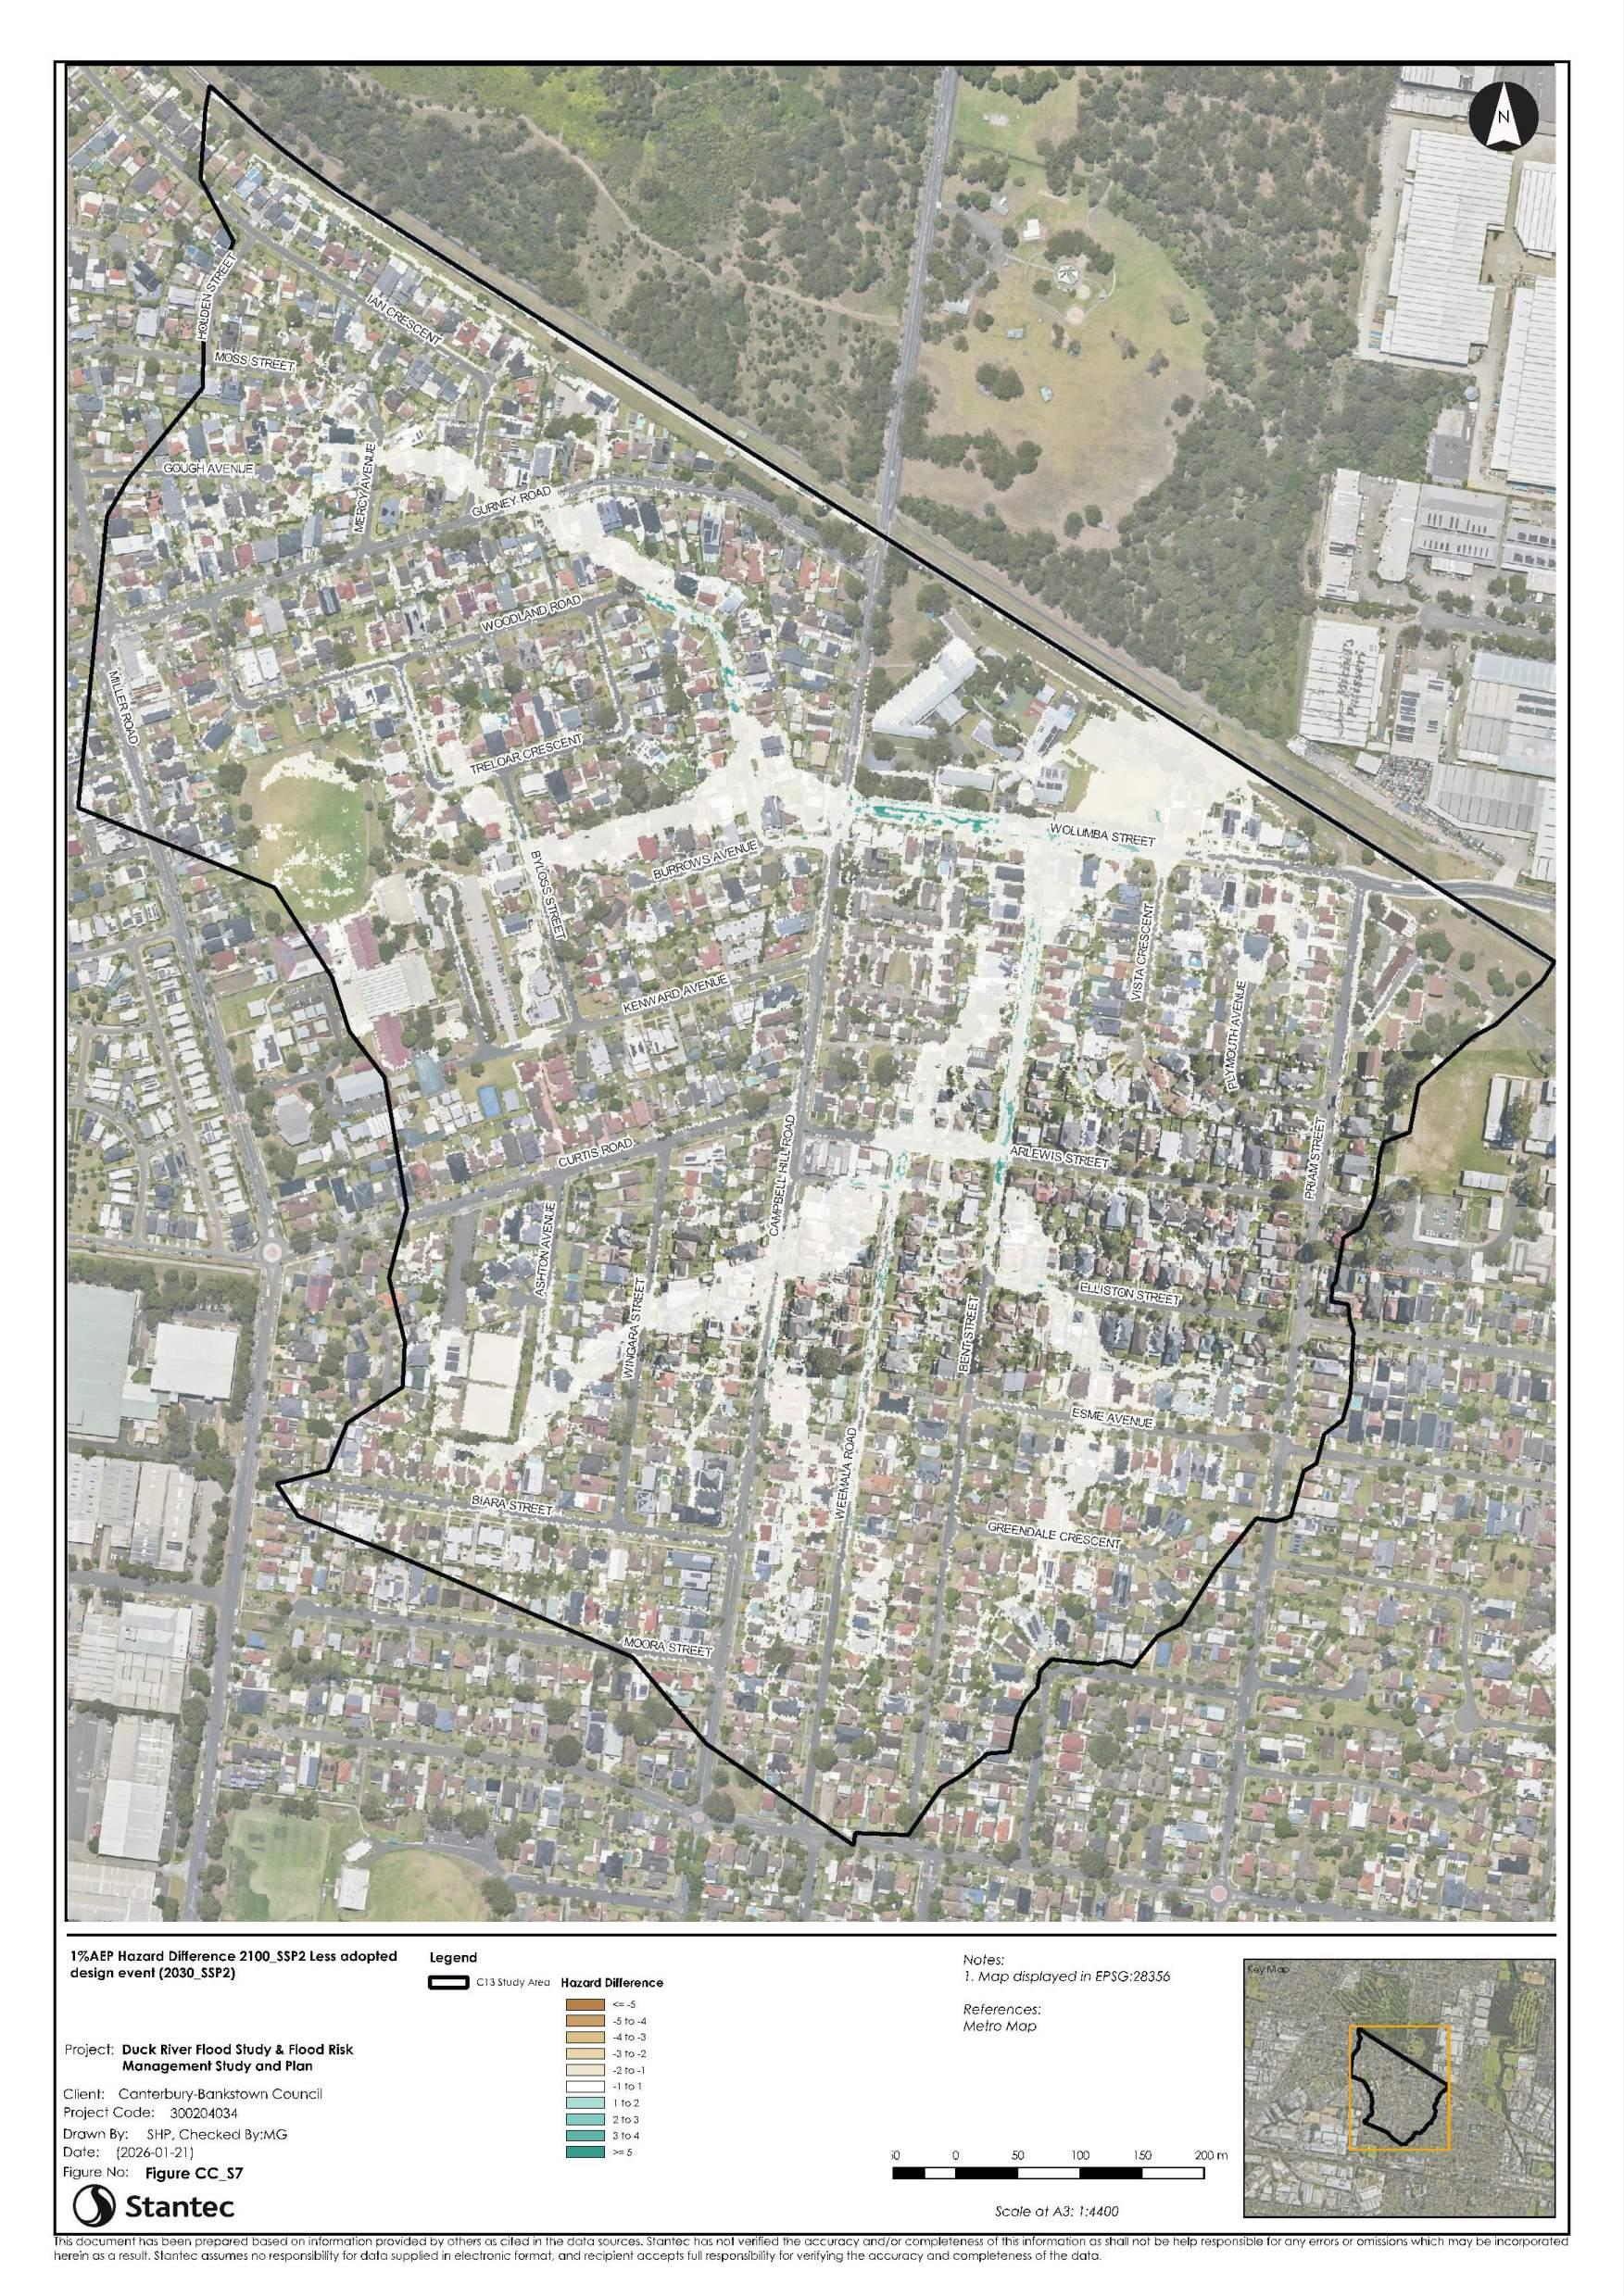
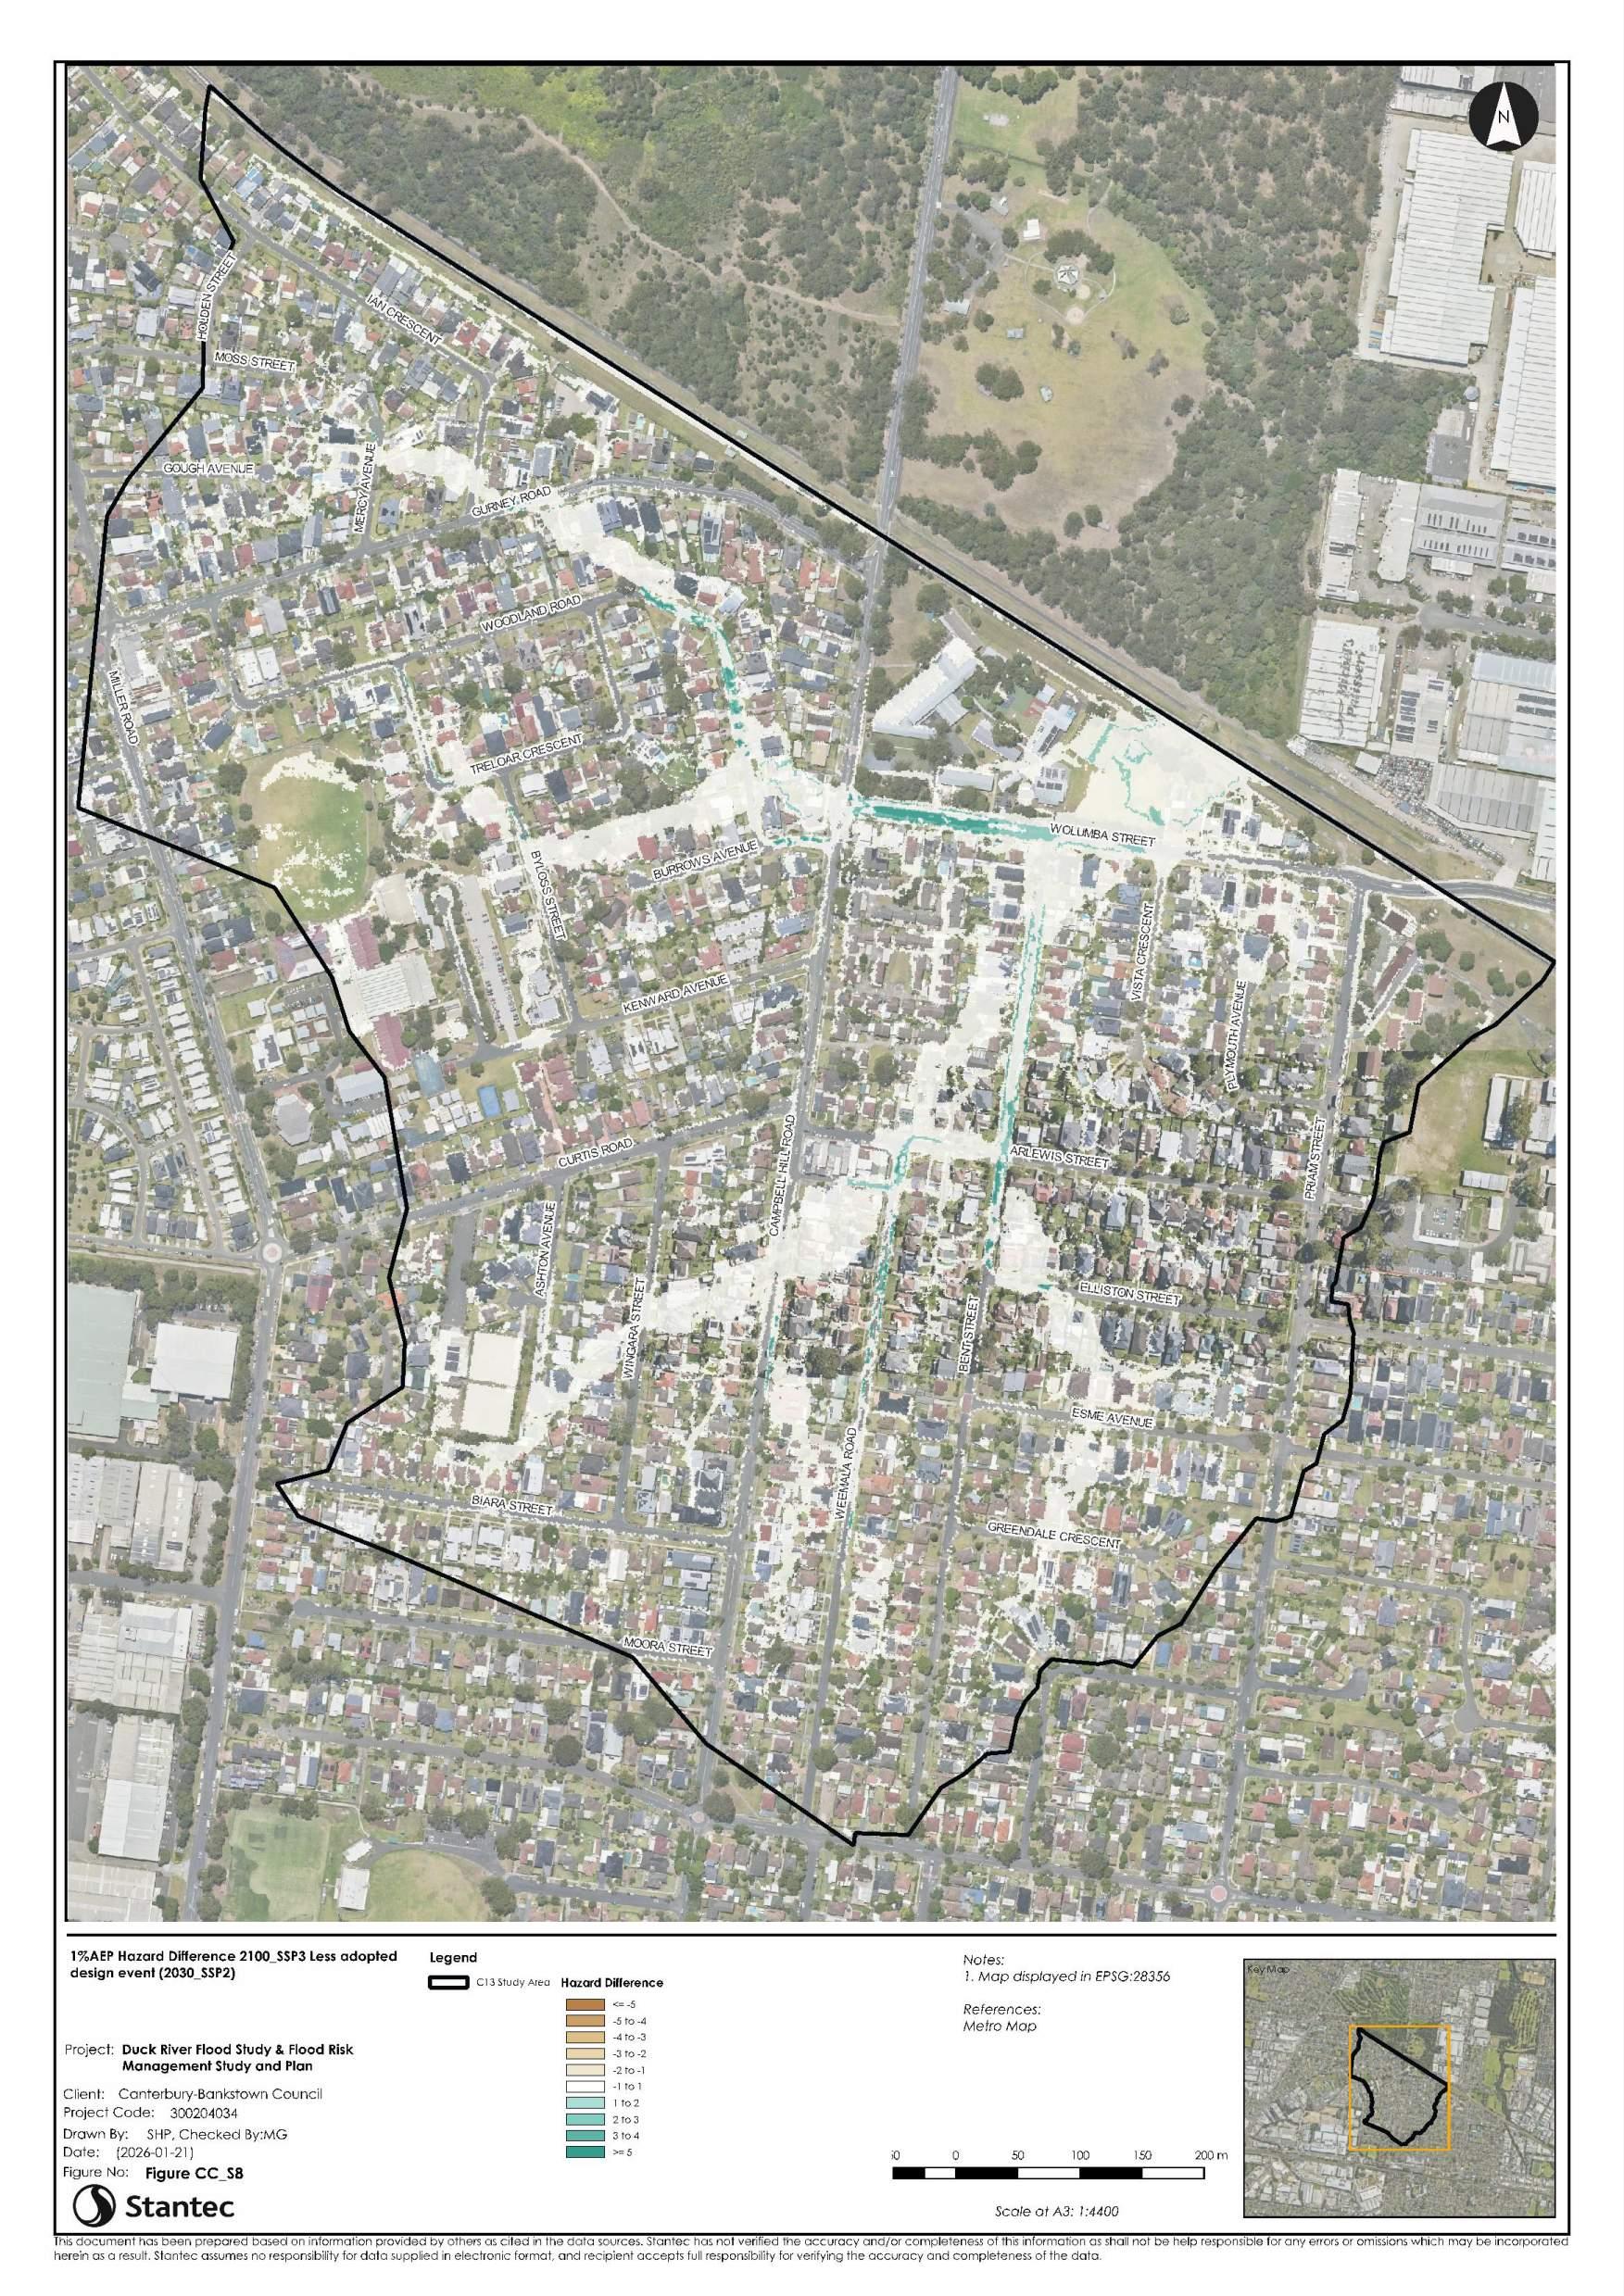
A climate change assessment has been conducted for four future climate scenarios for the 1% AEP, including the year 2050 and year 2100, both for the intermediate SSP2 and SSP3 pathways. The results show for the two 2050 scenarios (SSP2 and SSP3), the flood level impacts are quite similar and relatively minor at less than 0.1 metres. For the year 2100 SSP2, flood impacts are more pronounced with impacts along most flowpaths between 0.05 – 0.10 metres. For the year 2100 SSP3, flood impacts are significant with impacts along almost all flowpaths up to 0.1 - 0.2 metres. Throughout the study area across all four climate change scenarios assessed impacts do not exceed 0.3 metres.
List of Appendices
Appendix
A.1
Appendix
Appendix
Appendix
List of Tables
Table 4-1
Table 5-1
Table
Table
Table
Table 6-2
List of Figures
Figure 1-1 Location of Study Area (Blue Outline) for Duck River and Wolumba Sub-Catchments within Canterbury-Bankstown LGA (Black Outline) 13
Figure 2-1 Sub-catchment of Wolumba............................................................................................ 16
Figure 2-2 Topography of Wolumba Sub-Catchment 17
Figure 2-3 Stormwater Drainage Assets and Assumed Owners of the Wolumba Sub-Catchment 18
Figure 2-4 Identified Flowpaths within the Wolumba Sub-Catchment 20
Figure 2-5 Provisional Flood Risk Precinct Mapping from the 2010 Wolumba Flood Study (Source: BMT WBM, 2010) 22
Figure 3-1 Site Visit Locations 25
Figure 3-2 Photos of Sydney Water Pipeline Channel Crossing at Site 1 from South Looking North (Top) and North-West (Bottom) 26
Figure 3-3 Photo of Council-Owned Trunk Drainage Outlet to Sydney Water Corridor at Site 1 Looking South 27
Figure 3-4 Floor Level Survey and Building Footprints (Geoscape)
Figure 4-1
4-2
Figure 4-3
Figure 4-4
Figure 4-5 TUFLOW Hydraulic Model – Layout of 1D Channels, Culverts, Bridges and Pipes
Figure 4-6 TUFLOW Hydraulic Model – Layout of Modelled 1D Pits
Figure 5-1 Bins for temporal patterns versus AEP (source: ARR Figure 2.5.12)
Figure 5-2 Flow Chart for the ‘Ensemble in hydrology and hydraulics’ Approach (Source: NSW DCCEEW, 2019) 54
Figure 5-3 TUFLOW Model Validation – 1% AEP Flow Hydrograph Comparison to Previous Models for Wolumba Catchment Immediately Upstream and Downstream of SW Pipeline Corridor Crossing (PO_26 and PO_28) 57
Figure 5-4 TUFLOW Model Validation – 1% AEP Peak Water Level Differences – Current Model with ARR87 Hydrology less Original 2010 Flood Study
58
Figure 5-5 TUFLOW Model Validation – PMF Peak Water Level Differences – Current Model with ARR87 Hydrology less Original 2010 Flood Study 59
Figure 6-1 Design Flood Model Results – Flood Extents for Six Design Events for Upper FP1 and FP2
63
Figure 6-2 Study Area Inflow and Outflow Locations for Wolumba Sub-Catchment 65
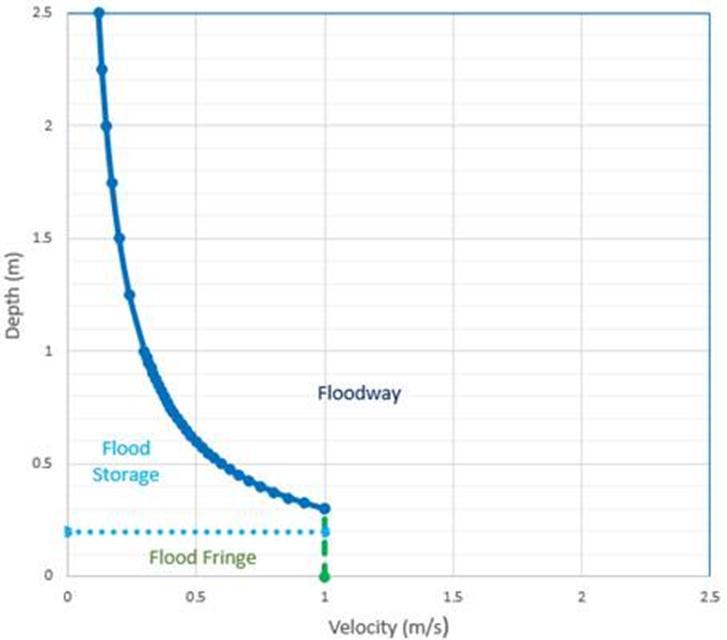
Figure 6-4 Flood Function Limits for Peak Flood Depth and Velocity Results (Source: CBC) 68
Figure 6-5 Projected global temperature increases above pre-1990 baseline associated with SSPs and Selected Future Climate Scenarios Adopted for this Study (Yellow Circles) (Source: ARR2019 Book 1 Chapter 6)
71
Acronyms / Abbreviations
Acronyms / Abbreviations
1D One-dimensional
2D Two-dimensional
ABS Australian Bureau of Statistics
AEP Annual Exceedance Probability
AHD Australian Height Datum
ARI Average Recurrence Interval
ARR Australian Rainfall and Runoff
BoM Australian Bureau of Meteorology
CBC Canterbury-Bankstown Council
CCC Cumberland City Council
DCP Development Control Plan
DCCEEW
NSW Department of Climate Change, Energy, the Environment and Water
EIS Environmental Impact Statement
ELVIS Elevation Information System
EM Emergency Response Modification (Option)
EPA NSW Environmental Protection Authority
FDM Floodplain Development Manual
FIRA Flood Impact and Risk Assessment
FM Flood Modification (Option)
FMC Floodplain Management Committee
FPCC Flood Planning Constraint Categories
FRM Flood Risk Management
FRMS&P Flood Risk Management Study and Plan
FRP Flood Risk Precincts
FPL Flood Planning Level
FPA Flood Planning Area
GIS Geographical Information Systems
IFD Intensity-Frequency-Duration
LEP Local Environment Plan
LGA Local Government Area
LiDAR Light Detection and Ranging
NSW New South Wales
PCC Parramatta City Council
PMF Probable Maximum Flood
SES NSW State Emergency Service
SW Sydney Water
TfNSW Transport for New South Wales
Glossary
Glossary
Term Definition
Afflux
Annual Exceedance
Probability (AEP)
Rise in water level in a waterway or flowpath caused by a structure, obstruction or impediment to flow.
The chance of a flood of a given or larger size occurring in any one year, usually expressed as a percentage
Australian Height Datum (AHD)
Australian Rainfall and Runoff (ARR)
Average Annual Damage (AAD)
Average Recurrence Interval (ARI)
Backwater flooding
Cadastre, cadastral base
Catchment
Catchment Flooding
Chance
Consent Authority
Consequence
Continuing Flood Risk
Defined Flood Event (DFE)
Design Flood
A common national surface level datum often used as a referenced level for ground, flood and flood levels
A national guideline document, data and software suite that can be used for the estimation of design flood characteristics in Australia.
The average damage per year due to flooding that would occur in a nominated scenario in an area over a very long period of time.
The long-term average number of years between the occurrence of a flood equal to or larger in size than the selected event
A mechanism by which upstream flooding is influenced by downstream conditions or controls.
Information in map or digital form showing the extent and usage of land, including streets, lot boundaries, water courses etc.
The area of land draining to a specific location
Flooding due to prolonged or intense rainfall (e.g. severe thunderstorms, monsoonal rains in the tropics, tropical cyclones)
The likelihood of something happening that will have adverse or beneficial consequences
The authority or agency with the legislative power to determine the outcome of development and building applications
The outcomes of an event or situation affecting objectives, expressed qualitatively or quantitatively
Risk to existing and future development that may be reduced by EM measures
The flood event selected as a general standard for the management of flooding to development
The flood selected as part of the FRM process that forms the basis for physical works to modify the impacts of flooding
Development
Development Control Plan (DCP)
Discharge
Emergency Management (EM)
Emergency Management Plan (EMPLAN)
Emergency Management Response Strategy (EM response strategy)
Exceedances per Year (EY)
May be treated differently depending on the following categorisation:
Infill development: the development of vacant blocks of land that are generally surrounded by developed properties and is permissible under current land zoning
New development: development of a completely different nature to that associated with the former land-use (e.g. the urban subdivision of a previously rural area)
Redevelopment: rebuilding in an area (e.g. as urban areas age, it may become necessary to demolish and reconstruct buildings on a relatively large scale)
See Environmental Planning and Assessment Act 1979
The rate of flow of water measured in terms of volume over time. It is to be distinguished from the speed or velocity of flow, which is a measure of how fast the water is moving rather than how much is moving.
A comprehensive approach to dealing with risks to the community arising from hazards. It is a systematic method for identifying, analysing, evaluating and managing these risks
The overarching EM arrangements for New South Wales, including the agreed roles and functions of various agencies. All NSW Government agencies with responsibilities and functions in disaster response and recovery contribute to this plan.
A strategy identified by the combat agency typically used to plan, prepare for and respond to a hazard.
Number of events per year.
Existing Flood Risk The risk an existing community is exposed to as a result of its location on the floodplain
Flash Flood Flood that is sudden and unexpected
Flood
Flood (hydrologic and hydraulic) modelling
A natural phenomenon that occurs when water covers land that is normally dry. It may result from coastal inundation (excluding tsunamis) or catchment flooding, or a combination of both
Hydrologic and hydraulic computer models to simulate catchment processes of rainfall, run-off, stream flow and distribution of flows across the floodplain or similar
Flood affected land Equivalent to flood prone land
Flood Awareness
An appreciation of the likely effects of flooding, and a knowledge of the relevant flood warning, response and evacuation procedures facilitating prompt and effective community response to a flood threat
Flood Constraints Key constraints that flooding place on land
Flood Classification (used in flood warnings)
Flood Damages
Flood Education
Flood Emergency Response Classification of Communities (FERCC)
Flood Evacuation
Flood Evacuation Capability
Flood Fringe Area
Minor flooding – Causes inconvenience. Low-lying areas next to watercourses are inundated. Minor roads may be closed and low-level bridges submerged. Flooding is usually below the floor level of dwellings and may require removal of stock and equipment from low-lying areas. Moderate flooding – In addition to the above, the area of inundation is more substantial. Main traffic routes may be affected. Some buildings may be affected above the floor level. Evacuation may be required.
Major flooding – In addition to the above, extensive rural areas and/or urban areas are inundated. Many buildings may be affected above the floor level. Properties and towns are likely to be isolated and major rail and traffic routes closed. Evacuation of flood affected areas may be required. Utility services may be impacted
The tangible (direct and indirect) and intangible costs (financial, opportunity costs, clean-up) of flooding
Seeks to provide information to raise community awareness of flooding so as to enable individuals to understand how to manage themselves and their property in response to flood warnings
Classification of the floodplain in consideration of the EM constraints and consequences.
The movement of people from a place of danger to a place of relative safety, and their eventual return
The ability to safely evacuate to an area of relative safety within the effective warning time, having regard to the suitability and capacity of the route and the possible prevailing environmental conditions.
That part of the flood extents for the event remaining after the flood function areas of floodway and flood storage areas have been defined
Flood Function
Flood Hazard
Flood Hazard
Categorisation
Flood Impact and Risk Assessment (FIRA)
The flood related functions of floodways, flood storage and flood fringe within the floodplain
A flood that has the potential to cause harm or conditions with the potential to result in loss of life, injury and economic loss
Categorisation of flood affected areas based on the degree of hazard that the flood conditions may present to people, vehicles and structures.
A study to assess flood behaviour, constraints and risk, understand offsite flood impacts on property and the community resulting from the development, and flood risk to the development and its users
Flood Liable Land Equivalent to flood prone land
Flood mitigation standard
The design flood selected as part of the FRM process that forms the basis for physical works to modify the impacts of flooding.
Flood Prone Land Land susceptible to flooding by the PMF event
Flood Plan (local or state) Local (LFP)
Flood planning constraint categories (FPCCs)
A sub-plan of an EM plan that deals specifically with flooding; they can exist at state, zone and local levels
Categorisation of the floodplain into areas of different degrees and types of flood related constraints.
Floodplain Equivalent to flood prone land
Flood Planning Area (FPA)
Flood Planning Level (FPL)
Flood Proofing
Flood Risk
Flood Risk Management
Flood Storage Area
Flood Study
Floodways
Flood Watches
Flow
Freeboard
Frequency
FRM Measures
FRM Options
FRM Plan
FRM Study
Future Flood Risk
The area of land below the FPL
The combination of the flood level from the DFE and freeboard selected for FRM purposes
Measures incorporated in the design, construction or alteration of individual buildings or structures that are subject to flooding, to reduce structural damage and potentially, in some cases, reduce contents damage.
Risk is based on the consideration of the consequences of the full range of flood behaviour on communities and their social settings, and the natural and built environment
The management of flood risk to communities
Areas of the floodplain that are outside floodways which generally provide for temporary storage of floodwaters during the passage of a flood and where flood behaviour is sensitive to changes that impact on temporary storage of water during a flood
A comprehensive technical investigation of flood behaviour undertaken in accordance with the principles in FRM manual and consistent with associated guidelines
A flood study defines the nature of flood behaviour and hazard across the floodplain by providing information on the extent, level and velocity of floodwaters, and on the distribution of flood flows considering the full range of flood events up to and including extreme events, such as the PMF
Areas of the floodplain which generally convey a significant discharge of water during floods and are sensitive to changes that impact flow conveyance. They often align with naturally defined channels or form elsewhere in the floodplain
Provide the community with early advice of a developing situation that may lead to flooding.
The rate of flow of water measured in volume per unit time, for example, cubic metres per second (m3/s)
A factor of safety typically used in relation to the setting of minimum floor levels or levee crest levels
The measure of likelihood expressed as the number of occurrences of a specified event in a given time
Measures that can reduce flood risk
The FRM measures that might be feasible for the management of a particular area of the floodplain
A management plan developed in accordance with the principles in this manual and its supporting guidelines
A management study developed in accordance with the principles in this manual and its supporting guidelines
The risk future development and its users are exposed to as a result of its location on the floodplain
Glossary
Geographical Information Systems (GIS)
Gauge Height
Habitable Room
Hazard
High hazard
Hydraulics
Hydrograph
Hydrology
Integrated Planning and Reporting Framework (IP&R framework)
Lifecycle Costing
Likelihood
Likelihood of Occurrence
Local Environmental Plan (LEP)
Local Government Area (LGA)
Local Overland Flooding (LOF)
Local Strategic Planning Statement (LSPS)
A system of software and procedures designed to support the management, manipulation, analysis and display of spatially referenced data.
The height of a flood level at a particular water level gauge site related to a specified datum
In a residential development – a room used for normal domestic activities that: includes a bedroom, living room, lounge room, music room, television room, kitchen, dining room, sewing room, study, playroom, family room, home theatre and sunroom excludes a bathroom, laundry, water closet, pantry, walk-in wardrobe, corridor, hallway, lobby, photographic darkroom, clothes-drying room, vehicle parking area, storage area and other spaces of a specialised nature occupied neither frequently nor for extended periods. In an industrial or commercial situation – an area used for offices or to store valuable possessions susceptible to flood damage in the event of a flood.
A source of potential harm or conditions that may result in loss of life, injury and economic loss due to flooding
Flood conditions that pose a possible danger to personal safety; evacuation by trucks difficult; able-bodied adults would have difficulty wading to safety; potential for significant structural damage to buildings.
The study of water flow in waterways and flowpaths; in particular, the evaluation of flow parameters such as water level and velocity
A graph that shows how the discharge or stage/flood level at any location varies with time during a flood.
The study of the rainfall and run-off process; in particular, the evaluation of peak flows, flow volumes and the derivation of hydrographs for a range of floods
The IP&R framework includes a suite of integrated plans that set out a vision and goals and strategic actions to achieve them. It involves a reporting structure to communicate progress to council and the community as well as a structured timeline for review to ensure the goals and actions are still relevant
All of the costs associated with the project. This usually includes investigation, design, construction, operation, monitoring, maintenance, asset and performance management and, in some cases, renewal, upgrade, decommissioning and disposal of a management measure.
A qualitative description of probability and frequency
The likelihood that a specified event will occur
See Environmental Planning and Assessment Act 1979
The area serviced by the local government council
Inundation by local run-off on its way to a waterway, rather than overbank flow from a waterway
Local strategic planning statements assist councils to implement the priorities set out in their community strategic plan and actions in regional and district plans
Loss Any negative consequence or adverse effect, financial or otherwise
Mainstream flooding Inundation resulting from overbank flow from a waterway rather than by local run-off.
Merit-based approach
NSW Floodplain Management Program
Overland Flow
Peak Flow
Prevention, preparedness, response and recovery (PRRR)
Weighs social, economic, ecological and cultural impacts of land-use options for different flood prone areas together with flood damage, hazard and behaviour implications, and environmental protection and wellbeing of the state’s rivers and floodplains
The NSW Government’s program of technical support and financial assistance to local councils to enable them to understand and manage their flood risk
The local runoff, travelling through properties and /or roads, before it discharges into a stream, river, estuary, lake or dam.
The maximum flow occurring during a flood of a given annual exceedance probability.
Involves: prevention: to eliminate or reduce the level of the risk or severity of emergencies preparedness: enhances the capacity of agencies and communities to cope with the consequences of emergencies response: to ensure the immediate consequences of emergencies to communities are minimised
recovery: measures that support individuals and communities affected by emergencies in the reconstruction of physical infrastructure and restoration of physical, emotional, environmental and economic wellbeing
Glossary
Probable maximum flood (PMF)
Probable maximum precipitation (PMP)
Probability
Rainfall intensity
Residual flood risk
The largest flood that could conceivably occur at a particular location, usually estimated from probable maximum precipitation (PMP), and where applicable, snow melt, coupled with the worst flood-producing catchment conditions
The greatest depth of precipitation for a given duration meteorologically possible over a given size storm area at a particular location at a particular time of the year, with no allowance made for long-term climatic trends (World Meteorological Organization 1986)
A statistical measure of the expected chance of a flood
The rate at which rain falls, typically measured in millimetres per hour (mm/h)
The risk to the existing and future community that remains with FRM, EM and land-use planning measures in place to address flood risk
Risk ‘The effect of uncertainty on objectives’ (ISO 2018)
Risk analysis
Runoff
Scenario
Severe thunderstorm warnings
Severe weather warnings
The systematic use of available information to determine how often specified (flood) events occur and the magnitude of their likely consequences
The amount of rainfall that ends up as streamflow, also known as rainfall excess
A scenario may relate to current, historical or assumed future floodplain, catchment and climate conditions
Warnings provided to communities of the threat of dangerous thunderstorms. They are issued when a severe thunderstorm is occurring or likely to occur.
Warnings provided for potentially hazardous or dangerous weather that is not solely related to severe thunderstorms, tropical cyclones or bushfires. They are issued whenever severe weather is occurring in an area or is expected to develop or move into an area.
Stage Equivalent to water level; measured with reference to a specified datum
Stage hydrograph
State environmental planning policy (SEPP)
Stormwater flooding
Survey plan
Temporal pattern
Tidal anomaly
Total warning system (TWS)
Total warning system for flood (TWSF)
Topography
Velocity
Vulnerability
Water Surface Profile
Wave set-up
Wind Fetch
Wind set-up
A graph that shows how the water levels at a particular location change with time during a flood. It must be referenced to a particular datum.
See Environmental Planning and Assessment Act 1979
Inundation by local runoff. Stormwater flooding can be caused by local runoff exceeding the capacity of an urban stormwater drainage system or by the backwater effects of mainstream flooding causing the urban stormwater drainage system to overflow.
A plan prepared by a registered surveyor.
The variation of rainfall intensity with time during a rainfall event.
The difference between recorded storm surge levels and predicted astronomical tide level.
A total warning system describes a means of collecting information about an impending emergency, understanding the nature of the threat, communicating that information to those likely to be affected by it, and facilitating protective action and timely response.
An integrated system defining the level of flooding at which a warning will be initiated, the physical means by which it will be relayed, and the persons to whom it will be given. The system includes all necessary hardware such as water level actuators, and radio transmitting and receiving equipment.
A surface which defines the ground level of a chosen area.
The speed of floodwaters, measured in metres per second (m/s)
The degree of susceptibility and resilience of a community, its social setting, and the built environment to flooding
A graph showing the flood stage at any given location along a watercourse at a particular time.
The increase in water levels in coastal waters (within the breaker zone) caused by waves transporting water shoreward. The zone of wave set-up against the shore is balanced by a zone of wave ‘set-down’ (i.e. reduced water levels) seawards of the breaker zone.
The horizontal distance in the direction of wind over which wind waves are generated.
The increase in water levels in coastal and inland waterways caused by the wind driving the water shoreward and ‘piling it up’ against the shore.
1 Introduction
Stantec Australia Pty Ltd was commissioned by Canterbury-Bankstown Council (CBC) to undertake a Flood Study Update and Flood Risk Management Study and Plan (FRMS&P) for the sub-catchments of Duck River in accordance with the NSW Government's Flood Policy, as detailed in the Floodplain Risk Management (FRM) Manual
The project has been split into two main phases: Phase A - Flood Study Update, Phase B - Flood Risk Management Study and Plan. Duck River is one ofthe major tributaries ofParramatta River, discharging water from two sub-catchments of the Canterbury-Bankstown Local Government Area (LGA):
• Wolumba; and
• Duck River
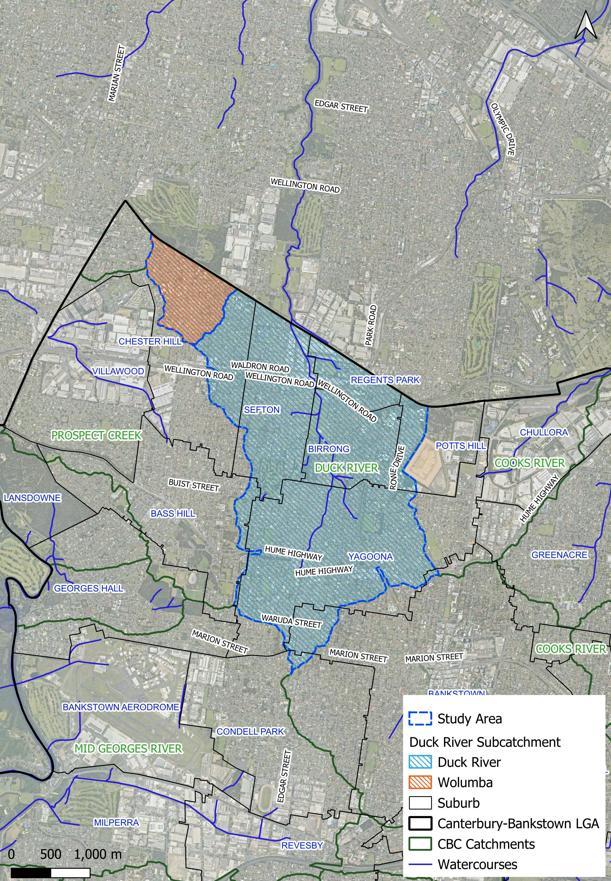
The location of the two study areas is shown in Figure 1-1
This report summarises the outcomes of the Flood Study Update phase for the Wolumba catchment
1.1 Study Context
As outlined within the FRM Manual 2023, like all Council’s in NSW, CBC is responsible for local land use planning including management of both mainstream and overland flooding within the LGA. In response to the objectives of the New South Wales (NSW) Government’s Flood Prone Land Package 2021, CBC has an ongoing commitment to reduce the impact of flooding and flood liability on individual owners and occupiers of flood prone property, and to reduce public losses resulting from floods, utilising ecologically positive methods wherever possible.
Through the NSW Department of Climate Change, Energy, the Environment and Water (NSW DCCEEW) and the State Emergency Service (SES), theNSWGovernment provides specialist technical assistance to local government on all flooding and land use planning matters. The FRM Manual 2023 guides councils in the strategic management of flood risk across their LGAs through the FRM framework. This supports councils in meeting their responsibilities for a range of FRM activities and their strategic consideration of flooding.
The FRM process is a key element of the FRM framework. Studies and plans under the process support the understanding of flooding, the examination of measures to manage flood risk and informed decisions on how to manage flood risk into the future. They also support the consideration of flooding in broader activities under the FRM framework. The FRM process progresses through four (4) stages in an iterative process:
1. Data Collection
2. Flood Study
3. Flood Risk Management Study
4. Flood Risk Management Plan
Phase A of this project (Flood Study Update) addresses point two (2) of the process to define the flood behaviour in the Study Area. Phase B of this project (FRMS&P) addresses points three (3) and four (4) of the process.
Both components of this project will be superseding the following existing studies previously adopted by CBC for this sub-catchment:
• Wolumba Catchment Flood Study (BMT WBM, 2010) prepared on behalf of CBC (formerly City of Bankstown). This is the previously adopted Flood Study for the study area.
• Duck River Catchment Floodplain Risk Management Study and Plan (Molino Stewart, 2012) prepared on behalf of Councils of Parramatta City (PCC), Cumberland City (formerly Auburn Council) and Canterbury-Bankstown (formerly City of Bankstown Council). This is the previously adopted FRMS&P for the study area.
As per NSW DCCEEW guidance it is recommended that these studies be updated periodically by CBC to ensure that the present-day catchment is modelled accurately using the latest available guidance and modelling techniques. By commissioning this study to review and update the previous study, CBC is adhering to this recommendation.
1.2 Study Objectives
The overall objective of the study is to review existing flood models, develop new flood models and develop a FRMS&P forthe study area that addresses the existing, future and continuing flood problems.
In accordance with the FRM Manual 2023, the objectives of Phase A Flood Study Update are:
• To obtain fit-for-purpose TUFLOW flood models suitable for use in the assessment and management of flooding in the Wolumba catchment within the Canterbury-Bankstown LGA;
• To deliver improved estimates of flooding characteristics including but not limited to flood extents, levels, hazards, depths and velocities;
• To incorporate the best available information to reflect the current catchment conditions;
• To adopt techniques and modelling approaches in accordance with current industry best practice guidelines and standards;
• To provide a technical basis for flood risk management study and plan in the study area;
• To assist Council to make informed decisions for capital investments within the floodplain.
1.3 Flood Risk Management Principles
Beyond the specific objectives of this study listed above, the FRM Manual 2023 outlines ten (10) principles for flood risk management in NSW:
1. Establish sustainable governance arrangements, 2. Think and plan strategically, 3. Be consultative,
4. Make flood information available,
5. Understand flood behaviour and constraints, 6. Understand flood risk and how it may change,
7. Consider variability and uncertainty,
8. Maintain natural flood functions,
9. Manage flood risk effectively, and, 10. Continually improve the management of flood risk.
The objectives of this study align with these principles, and through the proposed study methodology attempts to account for all of these principles, either directly or indirectly.
1.4 Project Summary
The Wolumba sub-catchment FS and FRMS&P project progress is through two main phases:
• Phase A – Flood Study Update: Including five stages of the project:
» Stage 1: Data Collection, Review and Analysis of Data,
» Stage 2: Site Visit,
» Stage 3: Flood Model Development,
» Stage 4: Flood Maps and Results,
» Stage 5: Flood Study Report
• Phase B – Flood Risk Management Study and Plan (FRMS&P): Including five stages of the project:
» Stage 6: Risk Assessment and Emergency Management,
» Stage 7: Assessment of Preferred Options,
» Stage 8: Draft Flood Risk Management Study and Plan Report and Public Exhibition
» Stage 9: Final Flood Risk Management Study and Plan Report,
» Stage 10: Handover of Study Materials and Completion of Contracts.
This Flood Study Update report for the Wolumba sub-catchment summarises Stages 1 – 5 as outlined above. Stages 6 – 10 for this sub-catchment are summarised in a separate FRMS&P report.
1.4.1 Structure of Report
This Flood Study Update report includes the following structure:
• Study Area description including catchment, topography and drainage assets (Chapter 2).
• Summary of available data for the study area including previous flood-related studies, site visit, survey, and GIS information (Chapter 3).
• General model development, model validation and sensitivity analyses for both hydrology and hydraulic components of the modelling (Chapter 4);
• Design flood event set-up (Chapter 5);
• Summary of design flood results and outcomes of modelling (Chapter 6)
Figure 1-1 Location of Study Area (Blue Outline) for Duck River and Wolumba Sub-Catchments within Canterbury-Bankstown LGA (Black Outline)
2 Study Area Description
The study area for this overall project includes two sub-catchments within the CBC LGA that drain to the Duck River; referred to as Duck River and Wolumba (both shown in Figure 1-1) Both subcatchments discharge to the Cumberland Council LGA to the north and subsequently to the Parramatta River
This Flood Study Update report relates only to the Wolumba sub-catchment.
2.1 Catchment Background
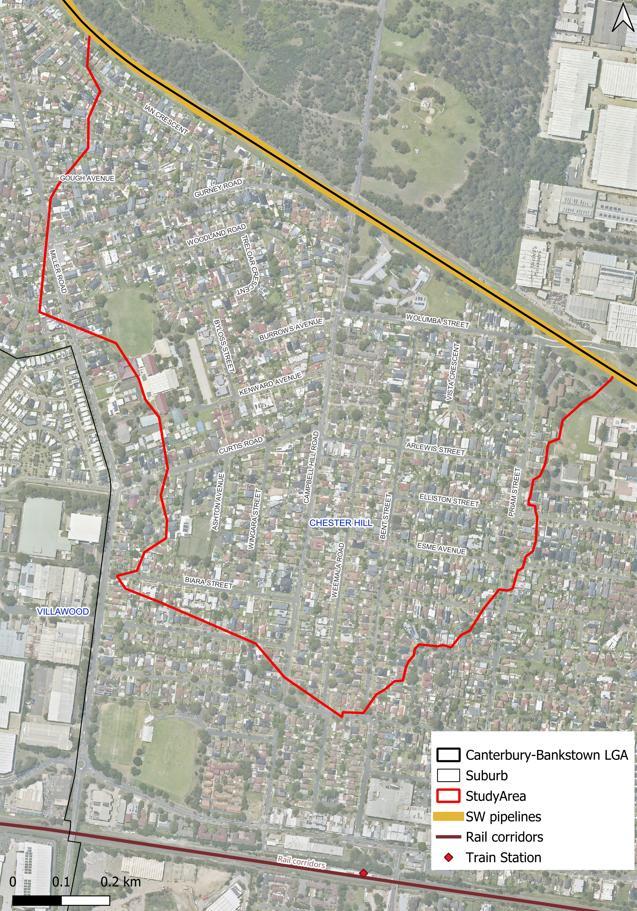
The Wolumba study area is an 87 ha (0.87 km2) sub-catchment of Duck River located in the northern part of the CBC LGA to the west of the upper Duck River sub-catchment. The study area covers the northern part of the suburb of Chester Hill, from Miller Road to the west, to Priam Street to the east, and Virgil Avenue to the south.
It is an urban catchment that drains through a stormwater pipe network in a north-easterly direction. There have been no significant changes to the sub-catchment since the previous Flood Study was completed in 2010.
There are no major public open spaces within the sub-catchment. There are two schools in the subcatchment; Chester Hill North Public School and Chester Hill High School.
The downstream limit of the study area is the Sydney Water (SW) supply pipeline corridor at Sefton with a stormwater culvert and open channel underpass of the pipeline near Chester Hill North Public School.
Wolumba sub-catchment discharges to a heavily vegetated floodplain of Campbell Hill Pioneer Reserve in Guildford within Cumberland LGA, discharging into a SW trunk drainage culvert that conveys flows east through South Granville industrial precinct, eventually discharging into the main Duck River channel and joining flows from the upper Duck River sub-catchment.
2.1.1 Topography
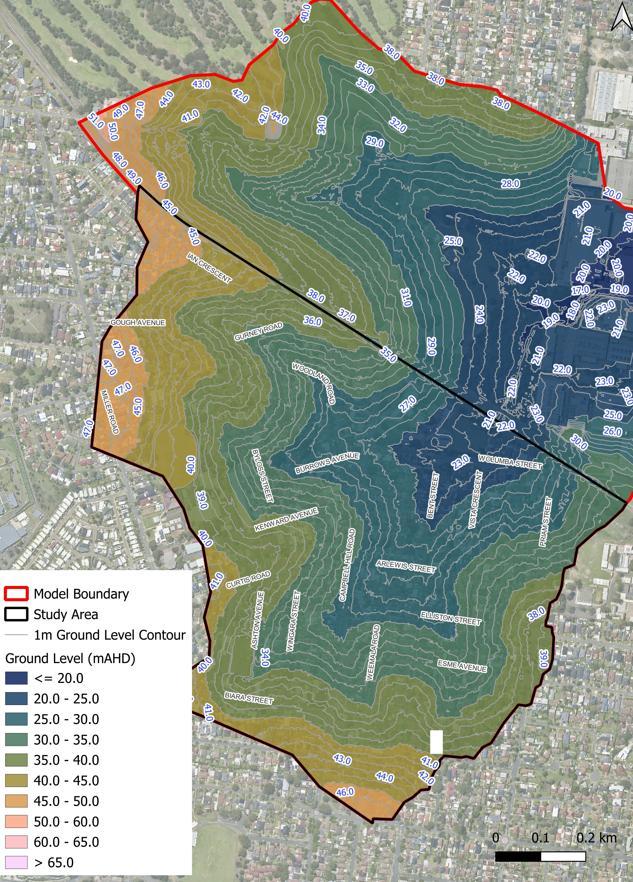
The topography of the Wolumba catchment is shown in Figure 2-2 The highest elevations in the study area, around 70m Australian Height Datum (m AHD), are along the eastern ridgeline in Yagoona. This ridgeline delineates the catchment boundary and separates it from the Cook River catchments in the east. There is also another ridgeline along the southern boundary that separates the boundary from Salt Pan Creek and Mid Georges River in south. To the west the Duck River catchment is separated from Prospect Creek sub-catchments Villawood and Miller Road to the west.
The Wolumba sub-catchment generally grades in a north-east direction with a minimum elevation of approximately 21m AHD at the culvert crossing of the SW pipeline with all flowpaths directed to this outlet.
The Duck River and Wolumba sub-catchments are delineated from each other by a minor ridgeline that runs north-east between Bent Street and Priam Street north of Chester Hill town centre.
2.1.2 Flooding Context
Significant floods have occurred in the Wolumba catchment within the Canterbury- Bankstown LGA including the recent March 2022 and July 2022 floods. The catchment is affected primarily by overland flooding, which can occur frequently and typically lasts for shorter periods
2.1.3 Stormwater Network
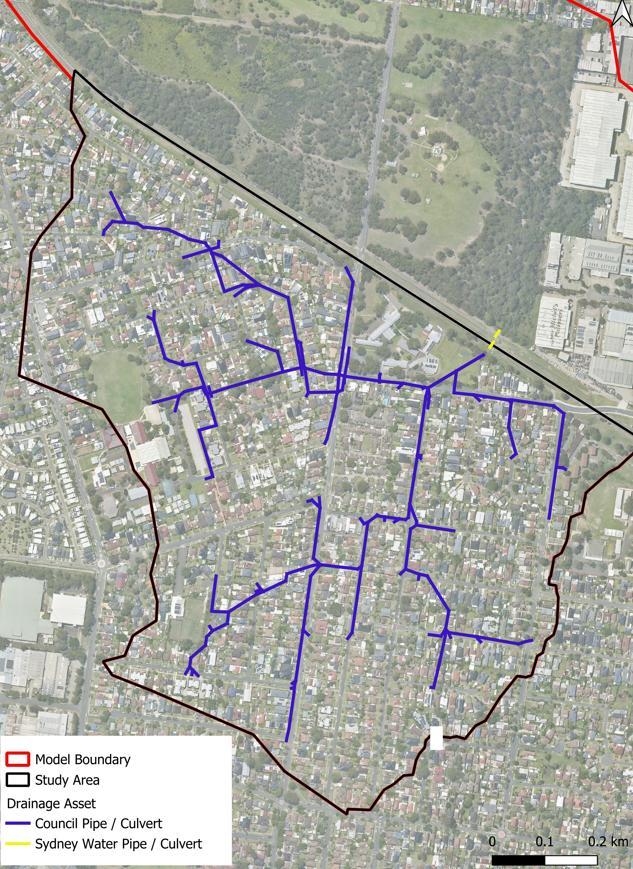
The majority of stormwater drainage infrastructure in the study area is pipes / culverts owned and managed by CBC, with the exception of the outlet culverts within the SW Pipeline corridor that are owned and managed by Sydney Water.
The stormwater drainage assets of the study area with assumed owners are included in Figure 2-1
Figure 2-1 Sub-catchment of Wolumba
Figure 2-2 Topography of Wolumba Sub-Catchment
Figure 2-3 Stormwater Drainage Assets and Assumed Owners of the Wolumba Sub-Catchment
2.2 Flowpaths of Wolumba Sub-Catchment
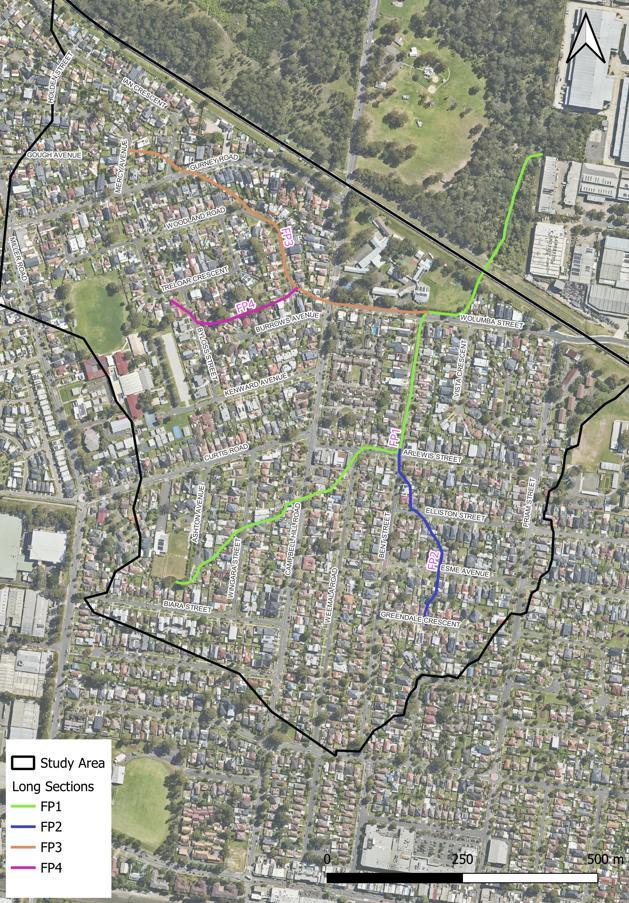
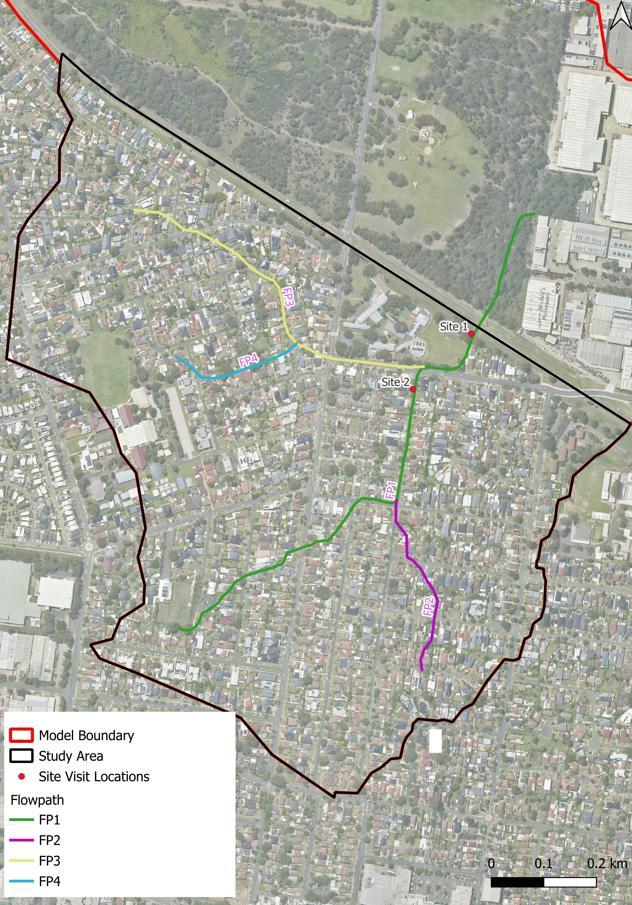
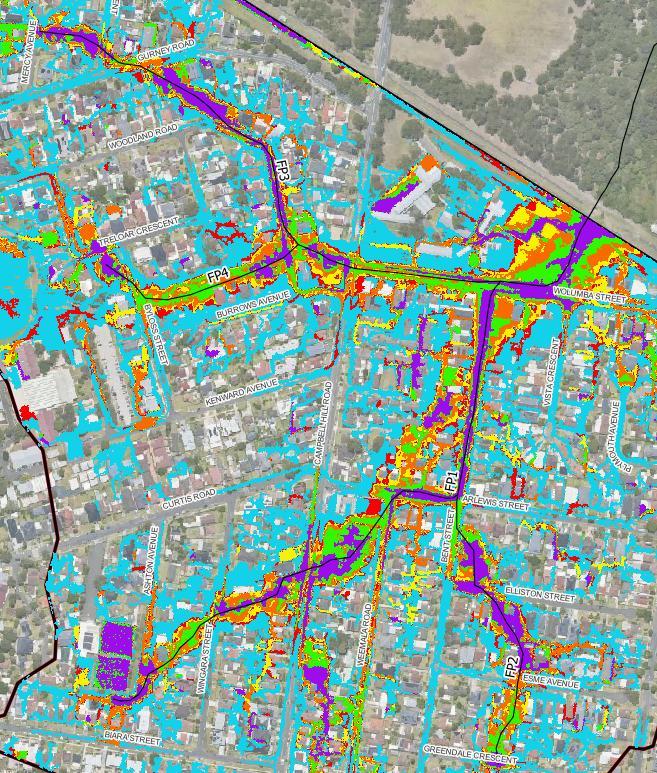
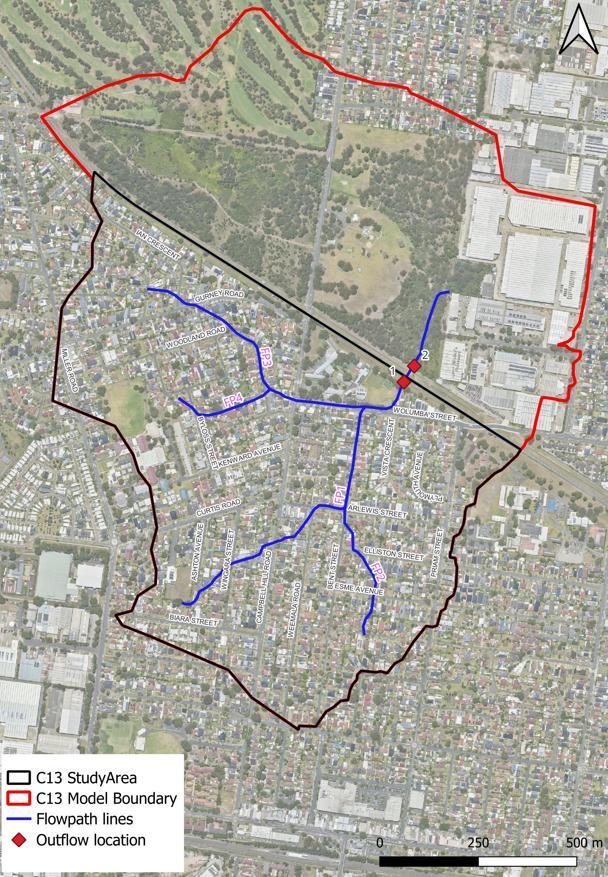
There are four flowpaths (FPs) in the Wolumba sub-catchment as shown in Figure 2-4 The four flowpaths predominantly flow through residential properties and are not confined to roadways. A brief description of each flowpath (listed in order from upstream to downstream) is included below:
• FP1: Starting from near Ashton Avenue to the south-west, an overland flowpath and CBC stormwater network conveys flows north-east through residential areas crossing Wingara Street and Campbell Hill Road The flowpath continues east along Arlewis Street before converging with FP2 near Bent Street, with FP1 continuing north along Bent Street. At the low point on Wolumba Street the flowpath passes through sports fields in Chester Hill North Public School before flowing into the SW supply pipeline corridor. The trunk drainage pipes for FP1 discharge into a concrete-lined open channel with Gross Pollutant Trap (GPT) and low weir structure, which is conveyed under the pipeline via a shallow bridge opening. Downstream of the pipeline, the channel flows in four (4) 1.2m diameter pipes passing under an elevated detention berm on the north side of the SW corridor. Within the Cumberland LGA these pipes discharge into a heavily vegetated channel within Campbell Hill Pioneer Reserve in Guildford and converging with FP4. FP1 then discharges into a SW trunk drainage culvert that conveys flows east through South Granville industrial precinct, eventually discharging into the main Duck River channel and joining flows from the Duck River sub-catchment.
• FP2: A minor overland flowpath originating from the south near Greenville Crescent FP2 flows north through residential areas as either overland flow or within the CBC stormwater network, before converging with FP1 at Arlewis Street.
• FP3: begins near Mercy Avenue on the north-west side of the sub-catchment. The flowpath crosses Gurney Road before flowing along Woodland Road as overland flow and within CBC stormwater network. FP3 diverts east along Wolumba Street before converging with FP1 at the low point.
• FP4: A minor flowpath starting near Treloar Crescent to the west of the sub-catchment, it crosses Bylos Street through residential properties before converging with FP3 near Burrows Avenue
Figure 2-4 Identified Flowpaths within the Wolumba Sub-Catchment
2.3 Previous Flood Studies
A detailed data review has been conducted of the previous Flood Study prepared for the Wolumba sub-catchment.
2.3.1 Wolumba Catchment Flood Study, 2010
The Wolumba Catchment Flood Study was prepared by BMT WBM on behalf of CBC (formerly Bankstown City Council) in 2010. The study provided flood results for a range of design floods, including the 1 EY, 0.5 EY, 0.2 EY, 10%, 5%, 2%, 1%, 0.5%, 0.2% and 0.1% AEP and the PMF. Design storms were derived from rainfall intensities and temporal patterns recommended in ARR87 The TUFLOW model adopted a rainfall-on-grid or direct rainfall approach.
The TUFLOW model included LiDAR, buildings footprints, drainage network, stormwater channels and culverts Due to the absence of historical flood data it was not possible for formal calibration of the flood model. Some of the key model set-up from the 2010 model:
• TUFLOW 2010 release version was adopted with iDP (Intel Compiler Double Precision)
• For buildings, the model adopted a combination of depth-varying high roughness in the floodplain and low roughness outside the floodplain. Some buildings were also raised around their upstream perimeter.
• A 50% blockage factor was applied to the waterway areas of all bridges, box culverts, and pipe culverts with clear openings under 6 meters. Additionally, blockage factors of 20% and 50% were applied to lintel pit openings and grated pits, respectively. Pit inlet curves were adopted. An unblocked model scenario was also modelled with an envelope of results adopted.
• A 5m grid size within the 2D domain was adopted.
• Initial and continuing loss rates of 10mm and 2.5mm/hr were applied to all pervious areas of the catchment. No loss rates were applied to impervious areas.
• Depth-varying roughness was applied in the 2D domain.
• The open channels are modelled using 1D elements.
• Results were trimmed to a 0.05m depth threshold. Isolated patches of flooding were also removed from the flood map if the area of inundation was smaller than 250m2 or the maximum depth of flooding was less than 300 mm.
• Model runs were carried out for the rainfall event durations of 25 minutes to 9 hours for a 1% AEP event (100-year flood event). The 2-hour storm duration resulted in the highest flood levels across almost the entire study area and was thus adopted for all design floods.
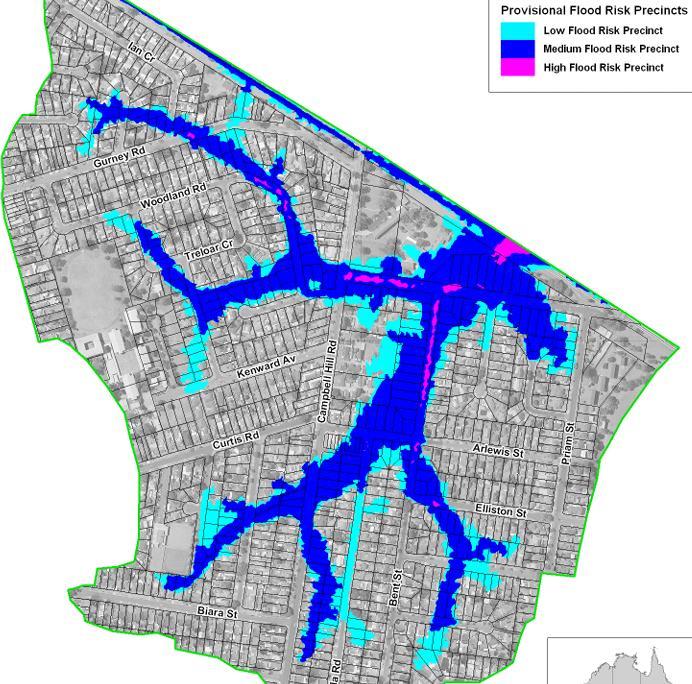
The previous Flood Risk Precincts (FRPs) from the 2010 Study are shown in Figure 2-5 The results show that low and medium risk precincts are widespread but there is minimal high flood risk precinct in the study area (1% AEP provisional high hazard).
A climate change sensitivity assessment was undertaken to estimate the potential impact of a 10% increase in rainfall intensity on stormwater flooding in the Wolumba catchment. It predicted an increase in 1% AEP flood levels of approximately 0.02 to 0.03 metres across much of the upper catchment, and increases in the range of 0.05 to 0.1 metres in the central catchment and locally up to 0.2m in the lower portion of the catchment.
Figure 2-5 Provisional Flood Risk Precinct Mapping from the 2010 Wolumba Flood Study (Source: BMT WBM, 2010)
3 Review of Available Data
CBC has provided Stantec with a range of available data to inform this Flood Study Update and FRMS&P for the Wolumba sub-catchment Review of the available data is summarised in this chapter
3.1 Flood Study Data
3.1.1 Canterbury-Bankstown Council Data
CBC provided Stantec with Flood Study Data for the Wolumba Catchment Flood Study (BMT WBM, 2010) commissioned by the former Bankstown City Council.
As part of project inception, CBC provided Stantec with PDF copies of the flood study reports, as well as copies of the TUFLOW hydrology / hydraulic models and associated input files for all design storm runs. Included within the GIS files are 2D materials layers, building polygons, CBC pit and pipe data, model topography, and other relevant model inputs. CBC also provided model results for the design storms runs
The provided results included 1 EY, 0.5 EY, 0.2 EY, 10%, 5%, 2%, 1%, 0.5%, 0.2% and 0.1% AEP design storms, PMF and climate change scenarios.
Stantec re-ran the above models for the 1% AEP event and compared with the provided results and confirmed that the provided results were able to be replicated using the models provided
3.1.2 Cumberland City Council Data
CCC provided Stantec with the Flood Study model for the WMAwater 2012 Duck River Flood Study. While CCC did not provide model results in the data package, Stantec re-ran the Duck River model for the 1% AEP and PMF events and compared extents to flood maps from the WMAwater 2012 report and found negligible differences from the original Flood Study model. XP-RAFTS hydrology model outputs were provided as TUFLOW input files, but the XP-RAFTS model was not made available.
For the ongoing Duck River, Duck Creek and A’Becketts Creek ARR2019 Flood Study Update being prepared by Royal Haskoning DHV, CCC provided high level advice on 1% AEP peak flows from preliminary hydrology model results, and copies of the preliminary pit and pipe database from this study to facilitate the modelling herein
3.2 Previous FRMS&P Data
CBC made available to Stantec the project data for the Duck River Floodplain Risk Management Study and Plan (Molino Stewart, 2012). The project data provided include:
• Community consultation information
• Various GIS layers
• TUFLOW models for the mitigation options (not including results)
• Property database information
• Flood risk precinct mapping layers
• Floor level and ground survey points
3.3 Site Visits
During project inception, Stantec and CBC staff conducted a site visit of the areas of interests / critical locations within the study area. This was beneficial for the project team to further familiarise with the study area. Particular attention was paid to the hotspots identified in the previous Flood Studies, and locations that may be candidates for flood mitigation measures to relieve flood affectation at these locations. Key observations recorded during the site visit included:
• Local drainage systems, mainly the key hydraulic structures and stormwater outlets,
• Hydraulic controls such as roads, bridges, culverts, and topographic controls,
• Debris causing temporary obstructions and permanent obstructions to the flowpaths,
• Low lying and possibly flood affected areas based on review of flood model results, and,
• Flood affected open space areas and parks for potential flood detention opportunities.
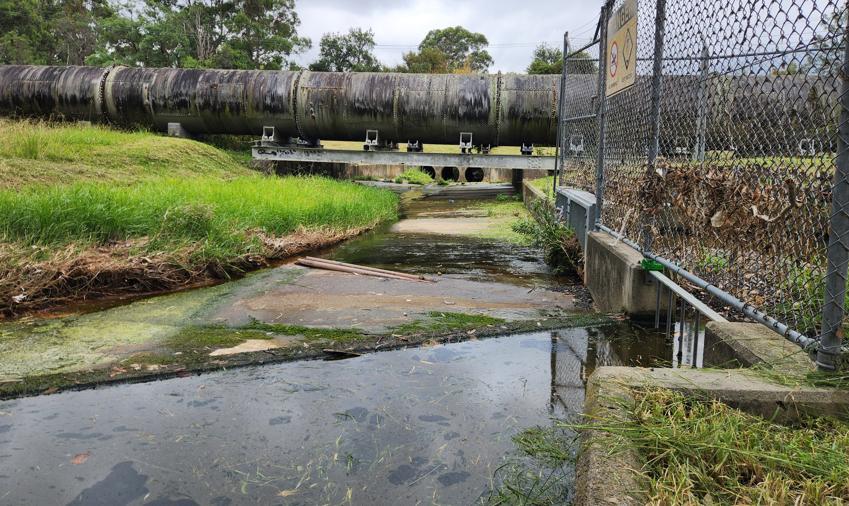
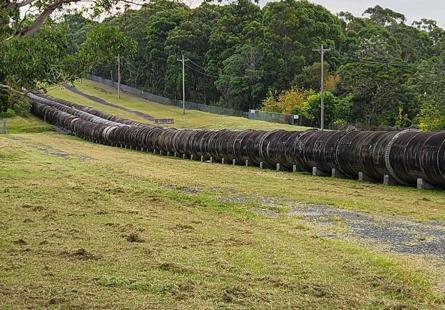
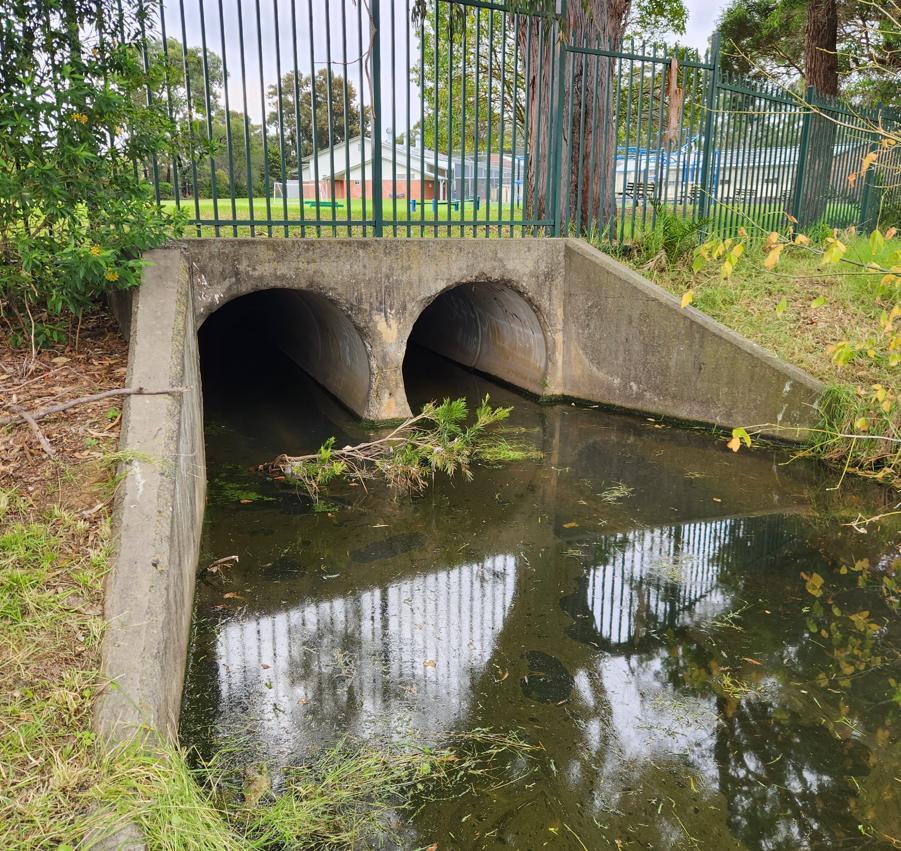
The site visit was conducted over one day on the 17 June 2024. In total, 2 sites were inspected with the visited locations shown in Figure 3-1 Photos and notes were recorded by Stantec providing information about potential flooding concerns at the visited locations, and potential opportunities and constraints on any possible flood risk management options at all locations. A collection of photos of visited sites are presented in Figure 3-2 and Figure 3-3
Figure 3-1 Site Visit Locations
Figure 3-2 Photos of Sydney Water Pipeline Channel Crossing at Site 1 from South Looking North (Top) and North-West (Bottom)
Figure 3-3 Photo of Council-Owned Trunk Drainage Outlet to Sydney Water Corridor at Site 1 Looking South
3.4 Floor Level Survey
Floor level survey was undertaken for the Wolumba catchment as part of the Duck River Catchment FRMS&P (Molino Stewart, 2012). Council provided copies of the floor level survey.
The provided survey data was in GIS format as points with survey points for the following:
• Floor level points including surveyed floor level in m AHD,
• Floor level estimate points for sites with no access,
• Ground level points, and,
• Natural surface points.
Of most relevance to this study is the floor level points from the first bullet point above. These 192 surveyed floor levels have been used to define floor levels for most of the flood affected properties in the Wolumba sub-catchment
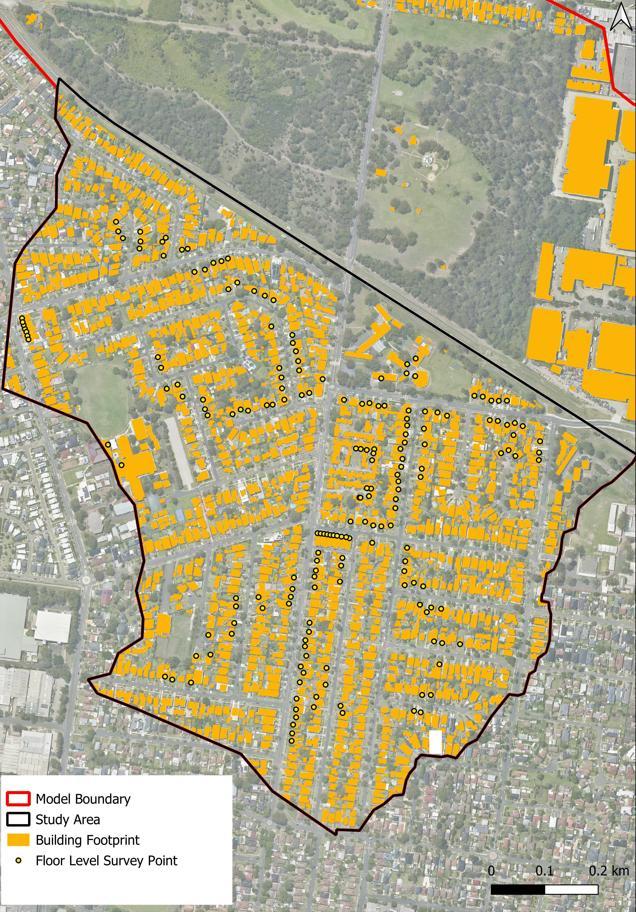
Additional floor level survey and a combined dataset including above data were also provided. The location of the surveyed floor level points are shown in Figure 3-4
3.5 Building Footprints
NSW DCCEEW provided Stantec access to a building footprint layer recorded by Geoscape in 2021. This layer covered all of the catchment area. When compared to the previous building footprint layer accounted for within the various Flood Study models, the level of detail in the Geoscape layer was assessed to be better, relating to more up to date and enhanced sampling techniques.
A review of this building footprint layer against the previous Flood Study footprints showed significant differences. This is expected to be attributable to improved recording techniques in the more recent GIS database, and in some locations as a result of recent development altering the building footprints since the Flood Study layers were prepared. The layout of the building footprint layer is shown in Figure 3-4
Figure 3-4 Floor Level Survey and Building Footprints (Geoscape)
3.6 Council GIS Data
As part of project inception, CBC provided Stantec with the following GIS data for the study:
• Local Government Area (LGA) boundary,
• Cadastral boundary layer,
• Catchment and sub-catchment boundary layer,
• Heritage layer,
• Road centrelines,
• Biodiversity, and threatened species layers,
• Stormwater pit and pipe network,
• Evacuation centres layer
• Land zoning layer
• Vulnerable facilities layer
Aside from these GIS layers, various other publicly available GIS layers were sourced by Stantec for this study including high quality aerial imagery from MetroMap (2024) recorded at various periods for the Study Area and its surrounds. This aided in not only providing details about the current site, but also the historical site at the time of the Flood Study.
3.7 Pit and Pipe Database
3.7.1
Canterbury-Bankstown Council Data
Stormwater pit and pipe data was provided by CBC for the Wolumba catchment The layer includes all CBC owned stormwater pipes and culverts within the study area It is understood that the pit and pipe data incorporates recent survey undertaken by CBC
The details provided within the pit and pipe database included:
• For stormwater pits the details included: pit dimensions, if the pit was an inlet type in terms of kerb, inlet or manhole, and on-grade or sag pit, and invert and depth of the pit.
• For pipes / culverts details included dimensions (diameter for pipes and width and height for culverts), and inverts.
3.7.2
Cumberland City Council Data
As discussed in Section 3.1.2, CCC provided stormwater pit and pipe layers within their LGA. The layer contained conduit sizes, and inverts as estimated by Royal Haskoning DHV as part of the ongoing Flood Study Update currently being prepared for CCC
3.8 LiDAR
The following LiDAR (Light Detection and Ranging) datasets are available from the ELVIS - Elevation and Depth - Foundation Spatial Data website. The datasets appear to have been recorded on the following dates:
• April 2013,
• June 2019, and
• May 2020.
All three datasets are 1m x 1m ASC grid data set in 2km x 2km tile with an accuracy of 0.3m (95% Confidence Interval) vertical and 0.8m (95% Confidence Interval) horizontal in GDA94 and MGA Zone 56 projection
A review of the above LiDAR datasets found that the June 2019 LiDAR dataset should be merged with the May 2020 LiDAR dataset to ensure comprehensive coverage of the study area. This merging is necessary because the 2020 LiDAR data did not cover the entire study area. Merged LiDAR datasets provided the most comprehensive coverage, accuracy and latest available dataset that covered the entire catchment.
4 Model Development
4.1 Model
Approach
4.1.1 Selection of Hydrology Modelling Approach
Due to the complex nature of floodplain flow patterns in urban catchments, a computerised modelling approach for the prediction of flood levels has been adopted in this study area. For computerised flood analysis, two types of numerical models are generally required:
• A hydrologic model, covering all the sub-catchments of the project area. The hydrologic model simulates the catchment rainfall-runoff processes, generating the runoff inflows that the hydraulic model uses to predict design flood behaviours.
• A combined one-dimensional / two-dimensional (1D/2D) hydraulic model representing the catchment. The hydraulic model simulates the flow behaviour of the pipe flows, overland flowpaths, waterways and associated floodplains, producing flood levels, discharges and velocities.
For the simulation of the catchment rainfall-runoff processes, the direct rainfall-on-grid approach is adopted, whereby rainfall is applied to every location within the catchment. Through this approach rainfall is applied to the 2D grid representing the catchment and flows are routed through the grid. In this way, a direct rainfall-on-grid approach (which has been adopted for this study area) combines the hydrologic and hydraulic components of simulation into a single model. Furthermore, adoption of a rainfall-on-grid methodology is consistent with that adopted in previous flood modelling for the study area.
4.1.2
Selection of Flood Model Software
TUFLOW is a 1D/2D hydrodynamic modelling package that was developed (and is still being expanded upon) in Australia. TUFLOW has been subjected to extensive testing and validation, with results compared favourably to first-principal theory as well as other leading software packages.
TUFLOW is an acronym for 2D Unsteady FLOW modelling software. The 2D aspect comes from the finite volume grid method used for the aboveground hydraulic calculations; the unsteady aspect comes from its ability to calculate results that vary with time.
TUFLOW incorporates the ESTRY 1D network modelling system for modelling culverts and pipe networks. It is capable of modelling large urban catchments because of its ability to incorporate a pit and pipe network, and its strength of being able to nest 1D channels into a 2D domain. It can model the hydrology, the aboveground and the belowground hydraulics of a catchment at the same time.
The hydraulic model for the study area adopts the TUFLOW HPC (Heavily Parallelised Compute) engine. The main advantage of TUFLOW HPC is that it provides significantly quicker model run times compared to the conventional TUFLOW Classic (CPU based). HPC provides the ability to run models on GPU (Graphics Processing Unit) graphics cards, to achieve significantly shorter model run times, increasing modelling capabilities to be able to run hydraulic models with higher cell resolution, across larger extents and more scenarios. TUFLOW offers HPC as an alternate 2D Shallow Water Equation
(SWE) solver to TUFLOW Classic. Whereas TUFLOW Classic is limited to running a simulation on a single CPU core, HPC provides parallelisation of the TUFLOW model allowing modellers to run a single TUFLOW model across multiple CPU cores or GPU graphics cards (which utilise thousands of smaller CUDA cores).
The TUFLOW engine of the model is 2025-1-1-iSP-w64 TUFLOW release. The projection set up is MGA Zone 56 GDA94, consistent with CBC GIS database.
The adoption of TUFLOW as the basis for hydrology and hydraulic modelling is consistent with the original Flood Study model previously adopted by CBC However the previous study adopted an older version of TUFLOW Classic (rather than GPU) and was modelled in AGD 1966 NSW ISG Zone 56/1 projection
4.1.3 Basis for Current Model
The basis for this Flood Study Update is the Wolumba Catchment Flood Study (BMT WBM, 2010), being the only study available for the catchment The model updates conducted as part of this project summarised in the following sections represent significant changes to the above mentioned model
4.2 TUFLOW Hydrology Component Set-up
4.2.1 Application of Rainfall to the Model
For the entire domain of the TUFLOW model, a rainfall-on-grid (also referred to as direct rainfall) approach has been applied, where rainfall hyetographs are applied directly to the 2D domain of the model. This is applied through a TUFLOW 2d_rf input file, with design rainfall developed and exported for this project into a TUFLOW compatible format.
With respect to hydrology modelling for building footprints removed from the 2D domain of the TUFLOW model (further details in Section 4.3.4), a modified rain inflow polygons (2d_SA_All) approach has been adopted. This methodology is as follows:
• The building areas removed from the model 2D domains active cells (2d_code) have rain inflow polygons (2D_SA_All) added around the blocked building layer using a 2m buffer polygon.
• The inflow polygons evenly distribute runoff volumes from the building footprint areas removed from the model to the 2D domain (2D grid cell surface) immediately around each building.
This approach for blocked buildings is a modification to the rainfall-on-grid methodology for hydrology adopted across all other parts of the TUFLOW model.
4.2.2 Rainfall Losses
Consistent with guidance within the latest ARR2019 version 4.2, rainfall losses have been applied through initial (in mm) and continuing losses (mm/hr). This approach to modelling rainfall losses is consistent with other flood studies completed for CBC.
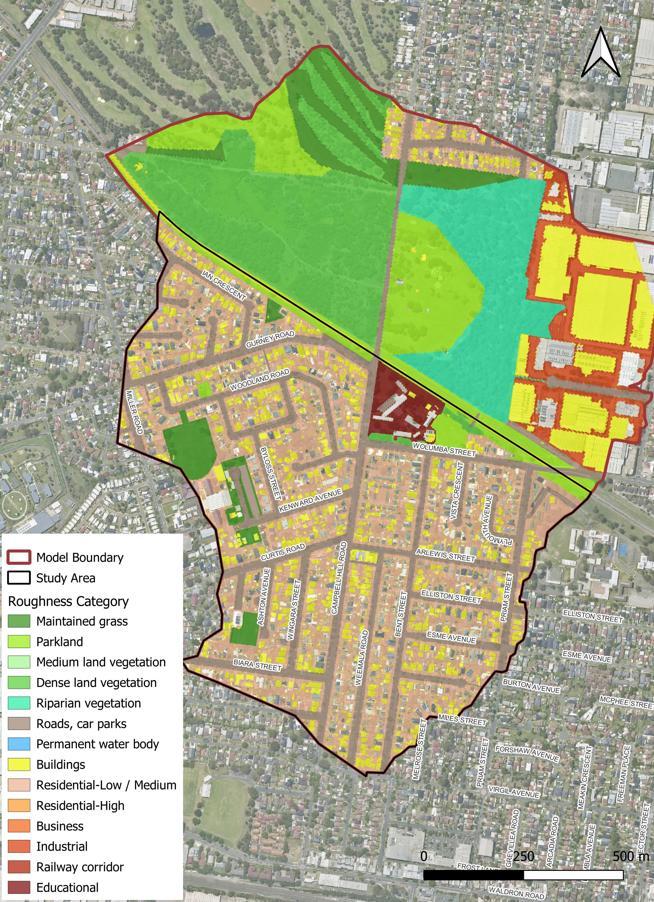
As the model is a rainfall-on-grid model, initial and continuing rainfall losses were applied to the hydrology component of the TUFLOW 2D model based on an assumed impervious percentage for each surface type. The layout of surface material mapping for the model is shown in Figure 4-4
Pervious initial losses have been based on the Probability Neutral Burst Initial Losses (PNBIL) available from the ARR Data Hub for the study area. The adoption on PNBIL is in accordance with the recommended hierarchy of design loss methods when no calibrated losses are available as outlined in Floodplain Risk Management Guide – Incorporating 2016 Australian Rainfall and Runoff in Studies (NSW Government, 2019) These losses have been extracted from the ARR Data Hub for the study area discussed in Section 5.2.1, with a copy of the ARR Data Hub outputs included in Appendix A.
For application of rainfall losses for the design model, 2D materials in the model were categorised into one of three categories:
• Pervious surfaces – For all pervious surfaces a continuing loss of 0.8 mm/hr was applied, consistent with guidance for 0.4 x Data Hub value from the Floodplain Risk Management Guide – Incorporating 2016 Australian Rainfall and Runoff in Studies (NSW Government, 2019). Initial loss was applied based on ARR Data Hub PNBIL as outlined previously, being both AEP and duration specific. The following 2D materials were defined as pervious:
‒ Maintained grass
‒ Parkland
‒ Medium land vegetation
‒ Dense land vegetation
‒ Riparian vegetation
• Impervious surfaces – For all 100% impervious surface types an initial and continuing loss of 1.0 mm and 0.0 mm/hr respectively were applied. The following 2D materials were defined as impervious:
‒ Roads, car parks and open concrete
‒ Permanent waterbody
‒ Buildings
• Aggregated surfaces – For surface types with a mix of pervious and impervious surfaces, composite losses have been developed for each material based on the assumed impervious percentage for each. Continuing losses have been scaled for impervious percentage applied to the 0.8 mm/hr for pervious surfaces. Initial losses have been scaled for impervious percentage to the variable losses for pervious surfaces as per guidance from ARR2019. The following 2D materials were defined as aggregated with the adopted impervious percentages:
‒ Residential – low and medium – 50% impervious
‒ Residential – high density – 80% impervious
‒ Business – 85% impervious
‒ Industrial – 95% impervious
‒ Railway corridor – 11% impervious
‒ Educational – 80% impervious
For ARR87 design rainfall versions of the current model, the same initial and continuing losses have mostly been applied. The one exception is for pervious initial loss where a constant 10 mm has been applied rather than the event-specific ARR2019 derived losses.
For the extreme events, i.e. 0.05% AEP and PMF, it has been conservatively assumed that the catchment was saturated prior to these extreme events. Therefore for the entire study area initial and continuing losses of 0mm and 0mm/hr have been adopted for these two extreme events.
The application of rainfall losses and the loss values themselves are consistent with similar recent flood studies prepared on behalf of CBC.
4.3
4.3.1
TUFLOW 2D Hydraulic Component Set-up
Model Extent
The TUFLOW model extent has been defined by the upstream catchment extent of the Wolumba subcatchment, and has been extended downstream to include 74.8 ha of catchment area within the Cumberland LGA. This model extension to the north has been conducted for several reasons:
• Extending the main channel by 650 metres downstream of the study area boundary to South Granville industrial precinct in Cumberland LGA reduces the impacts within the study area of tailwater boundary assumptions.
• Extending the model to the north also allows for assessment of impacts downstream of the study area for flood risk management options modelling in the FRMS&P component of the project.
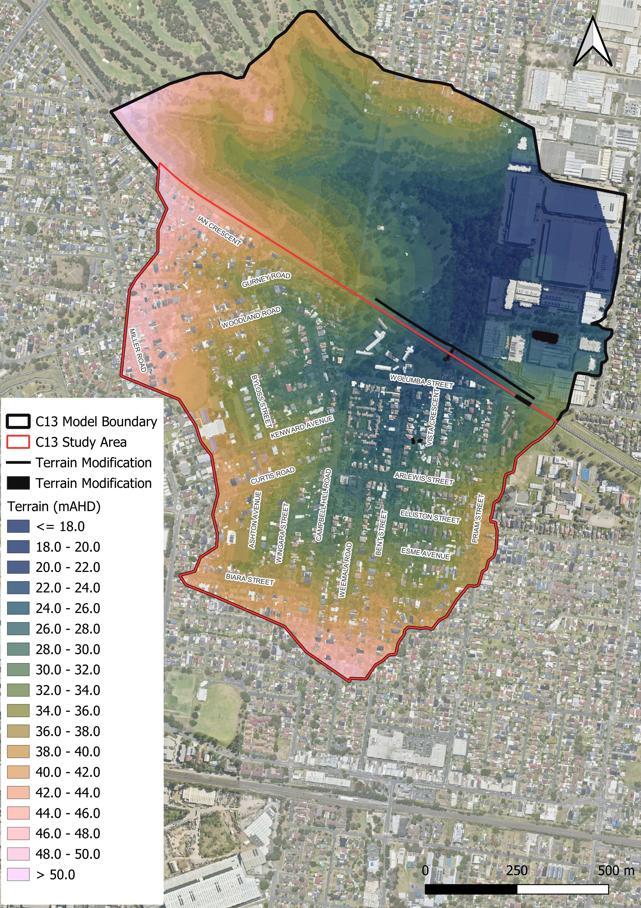
The total catchment area modelled for the TUFLOW model is 160.6 ha. The TUFLOW model extent is shown in Figure 4-1.
4.3.2 Model Terrain
The TUFLOW model terrain has predominantly been based on 1m grid LiDAR data recorded between 2019 and 2020 sourced from the ELVIS portal (refer to Section 3.8 for further details). This updates the LiDAR from the original Flood Study model (BMT WBM, 2010) This updated LiDAR data represents changes that have occurred in the catchment since 2010
Detailed review of available LiDAR data compared to other survey data sources showed that the LiDAR required some refinement in a number of locations. As such, terrain modifications were applied in the TUFLOW model using survey surfaces, and terrain modification (2d_zsh) polygons, lines and points to provide improved model terrain at the following locations:
• A short section of open channel (not included in the 1D channel network) has been included in the 2D domain using terrain modification lines (2d_zsh) to define basic rectangular channel sections using surveyed levels to set channel inverts. This was applied to the concrete lined channel at the study area outfall within the SW pipeline corridor. The level of the channel was reviewed against available LiDAR and CCTV details of the upstream trunk drainage lines.
• On the northern side of the SW pipeline corridor there is an earth berm that crosses the main channel outflow This section of berm has not been accurately represented in the LiDAR, therefore a top of levee modification has been applied.
• For some building footprints, terrain modification polygons have been applied to fill data gaps in the LiDAR resulted from triangulation issues. In addition, for representation of building blockage in key floodplains, some building footprints have been raised to the surveyed or estimated floor level as discussed further in Section 4.3.4
• As discussed further in Section 4.3.6, permanent waterbodies have had terrain modifications applied to LiDAR to raise levels to the outfall inverts to remove any flood storage for these waterbodies.
The layout of terrain modification polygons and lines is shown in Figure 4-1
4.3.3 Grid Cell Size
In the adoption of an appropriate grid cell size in TUFLOW 2D modelling, it is important to consider both the level of refinement of the model results, together with the overall run times. While a high, level of refinement may be preferred in some cases, a model that takes a significantly long time to run can create issues in the design model stage of the Flood Study and in subsequent projects that rely on the TUFLOW model.
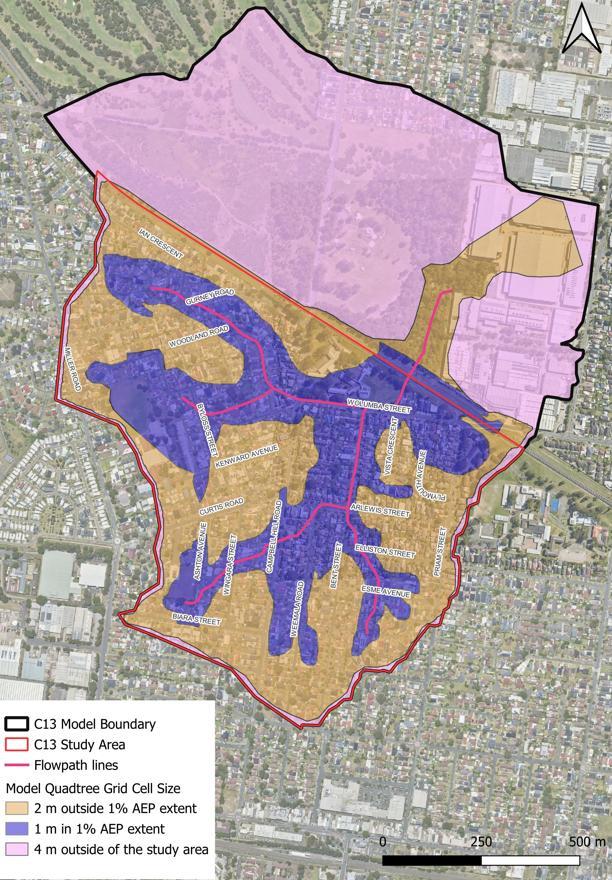
The TUFLOW model set-up adopts a variable grid cell size based on the Quadtree version of TUFLOW. The adopted model grid cell sizes are as follows:
• For areas in the vicinity of the 1% AEP extent as shown in Figure 4-2 (within CBC LGA) – 1 metre grid cell size. For these critical hydraulic areas where the definition of the floodplain needs to be most refined, a small grid cell size has been adopted.
• For areas outside of the 1% AEP extent in the study area – 2 metre grid cell size.
• For areas outside of the study area (within Cumberland LGA) – 4 metre grid cell size. A coarser grid is considered appropriate for these less critical areas of the model extent.
With TUFLOW calculating at every grid centre point, corner and mid-point, effectively the model calculates at half the grid cell sizes referenced above. This grid cell size resolution is considered appropriate for accurate modelling of urban overland flows while still maintaining manageable model run times by increasing grid cell size in non-flooded areas.
The number of grid cells in the design model with the above configuration is approximately 0.48 million, and using TUFLOW GPU this produces manageable model run times. The layout of the 1m, 2m and 4m grid portions of the model are shown in Figure 4-2
Figure 4-1 Hydraulic Model Boundary and Adopted Model Terrain
Figure 4-2 Hydraulic Model Quadtree Grid Cell Size Layout
4.3.4 Buildings
Building footprints for the study area have been delineated within the Geoscape building footprint data, made available by NSW DCCEEW for this project (refer to Section 3.5). Using this data as a basis, there are three methods used to represent buildings in a 2D hydraulic model. These are:
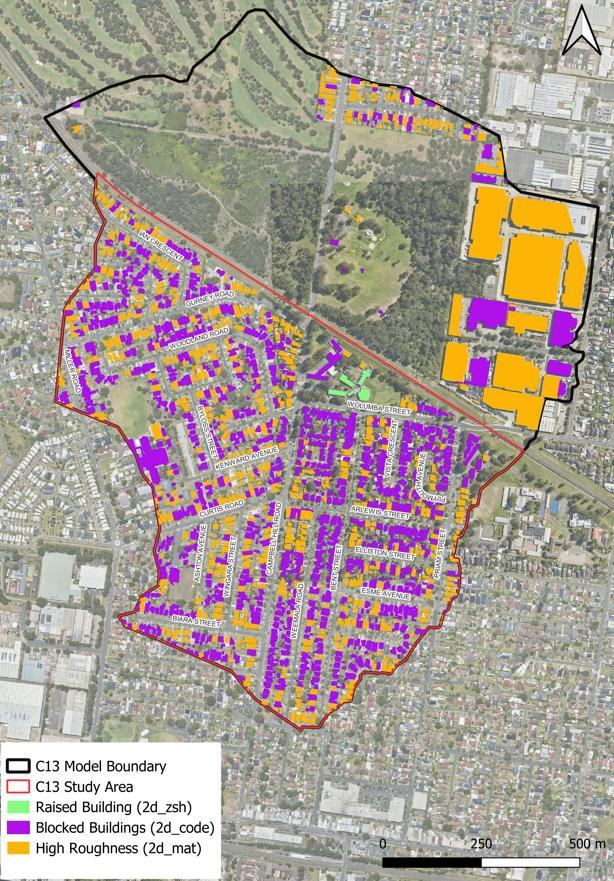
1. Blocking of buildings, to represent a complete obstruction to the surface (2d_code). This is preferred where buildings are solid impermeable construction both below and above the floor level.
2. Raising the model terrain to the floor level (where survey data is available), and adopting high roughness for the area above the floor level. This is preferred where buildings have solid impermeable construction below floor level, but less obstruction above floor level.
3. Utilising a high roughness value across the footprint of the building with no terrain modification. This is preferred for more permeable structures both below and above floor level including suspended buildings of non-flood compatible construction materials.
In this project, for the high roughness approach, a depth-varying roughness has been adopted for buildings with a Manning’s n of 0.015 for depths less than 30mm interpolated to a Manning’s n of 1.0 for depths greater than 0.1 metres.
For the purposes of this project, the following approach for modelling buildings has been adopted:
• For all buildings in the model boundary with 1% AEP flood depths less than 0.3 metres: It has been assumed these buildings will not have overfloor flooding and therefore Method 1 above has been adopted i.e blocking of building footprints using a 2d_code approach. To ensure that flowpaths between closely spaced buildings can be maintained in the model, the building footprints from the Geoscape buildings layer were reduced by a 0.5 metre buffer. This aimed to ensure grid cell size in the model did not artificially block any flowpaths between buildings.
• For buildings with 1% AEP flood depths greater than 0.3 metres: It has been assumed these buildings will have overfloor flooding and therefore a depth-varying roughness approach has been adopted with no terrain modification as per Method 3 above
• For commercial / industrial buildings with large footprint and experience 1% AEP flood depths greater than 0.3 metres, Method 2 above has been adopted, i.e buildings have been raised to a surveyed (or estimated where floor level survey is not available) floor level and a depthvarying roughness approach applied above that level.
This methodology for modelling buildings in the 2D domain is generally consistent with other recent Flood Studies undertaken on behalf of CBC within the LGA
The layout of the proposed building footprints adopting the three different model approaches is shown in Figure 4-3
Figure 4-3 Hydraulic Model Building Footprints and Modelling Approach
4.3.5
Hydraulic Roughness
Hydraulic roughness was simulated in the 2D domain of the TUFLOW model using variable Manning’s n roughness based on surface types. The roughness values for the different surfaces are summarised in Table 4-1, based on the same surface type mapping for deriving the impervious percentage.
Surface types were mapped using a combination of cadastre for land use types, aerial imagery and site observations. The layout of the surface types is shown in Figure 4-4
Consistent with other recent Flood Studies undertaken on behalf of CBC within the LGA, depthvarying roughness values have been adopted with Layer 1 being mostly high roughness for sheet flow less than 0.03 metres depth. For Layer 2, for depths greater than 0.1 metres roughness values become more in-line with typical roughness values for the land use. TUFLOW interpolates the roughness values between these two layer depths
Table 4-1 Adopted 2D Material Roughness Values
Figure 4-4 Hydraulic Model Adopted Roughness Mapping
4.3.6
Initial Water Levels
For all waterbodies and ponds within the study area, it has been assumed conservatively that all available flood storage in the waterbody has been occupied prior to the design floods occurring. Therefore terrain modifications (2d_zsh polygons) were adopted to ‘fill’ all waterbodies to their approximate discharge weir level such that they would not provide any additional flood storage during the flood model simulation. Based on knowledge of the floodplain downstream of the model boundary, there are no tailwater influences in this area; therefore, no downstream tailwater conditions have been applied in the model.
4.3.7 Boundary Conditions
All inflows to the TUFLOW model have been derived from Rainfall-on-Grid hydrology covering the entire study area. There are no model inflows from other external catchments or external hydrology models, all runoff has been generated by rainfall-on-grid hydrology within the TUFLOW model.
Within the TUFLOW model, the downstream boundary has been located 650 metres downstream of the study area boundary to reduce tailwater influence from the model boundary assumption. This location was chosen to ensure downstream conditions were realistically captured without introducing instability near the modelled area of interest.
Water levels at this downstream boundary were derived using two set-ups:
• For the 1D outlet of the culverts under South Granville precinct, a constant downstream water level (‘HT’ boundary) in the culvert of 16.3m AHD was adopted This was modelled as a 1d model discharge (1d_bc) element with the assumption that there would be negligible downstream tailwater impacts on the study area.
• For the wider floodplain, a 2D discharge line (2d_bc) was adopted covering the width of the floodplain across the north-west boundary of the model near South Granville precinct. This boundary adopted a water level slope at the downstream boundary of 0.02 (or 2.0%) for all design events. This gradient was adopted to reflect the approximate terrain gradient at this location.
In addition, around the perimeter of the model where minor surface outflows were required, additional 2d_bc flow boundary line were added to allow these perimeter trapped runoff flows to be able to drain realistically from the model. This boundary adopted a stage–discharge (H-Q) relationship through an assumed 0.01 (or 1%) water level slope.
4.4 TUFLOW 1D Hydraulic Component Set-up
Within the TUFLOW model, all surface flows have been modelled within the two-dimensional (2D) domain. The one-dimensional (1D) component of the TUFLOW model has been used to model culverts, bridges, pit and pipe structures. There are no 1D channels within the Wolumba subcatchment.
4.4.1 Channels, Culverts and Bridges
There are very few channels, culverts or bridges within the study area conveying mainstream flows under road crossings and through residential neighbourhoods that have inflows or outlets to the 2D domain The only instance is the concrete-lined open channel within the SW pipeline corridor marking the downstream boundary of the study area. A summary of each element and how it was modelled in the TUFLOW model is included below:
• The outlet of the twin pipes from the upstream CBC stormwater network discharges via culvert headwall into the channel.
• The channel is a wide, and relatively shallow concrete-lined open channel with a slight Vshape in its base. The channel has been modelled in 2D domain using zsh modifications. The channel inverts have been estimated using surveyed pipe inverts upstream, CCTV data for the upstream pipes, and the levels recorded in the LiDAR data available. The pipe survey and CCTV estimated levels to be lower than the LiDAR, in the end it was estimated the actual channel inverts were somewhere between the two datasets. The channel has been modelled as a simple rectangular shape with approximate width equal to that of the concrete channel. This approach was considered appropriate, given the fine 1m grid adopted (0.5m calculation spacing), and that this channel is downstream of the study area and therefore not in the specific area of interest.
• The channel has a minor concrete diversion weir into a fenced GPT structure. There is standing water normally upstream of this weir, with even minor stormwater runoff to overtop the weir and bypass the GPT. The weir was modelled with a 0.5m high zsh line across the channel, with an initial water level applied in the upstream area to the same height as the weir, and a high roughness area adopted for the GPT fenced area to replicate its likely flow obstruction.
• The irregular bridge opening under the SW pipeline was modelled as a Bridge-Weir (BW) type 1D element. For this section a channel cross section is implemented with an impervious layer representing the bridge deck, and weir details for the overtopping of the bridge. The channel section for the bridge opening in the 1D was replicated from the original Flood Study model with inverts modified to reflect the revised channel levels. Terrain modifications were applied to represent the bridge obvert in the 2D domain, while a layered blockage (2d_lfsch) was added to represent the pipeline bridge. A minor level of permeability was adopted for the lower sections to represent the small gap between the bridge beam and the suspended pipeline above. For the 1D bridge layer, 2D connections line (2d_sx) interfaces with the 2D channels both upstream and downstream.
• The detention berm across the north side of the SW corridor was modelled as a terrain modification (2d_zsh) line with levels estimated based on LiDAR and site visit observations.
• The four (4) 1.2m diameter pipes under the berm were modelled as 1D elements, with 2D connections line (2d_sx) interfaces with the 2D channels both upstream and downstream.
• Downstream of the SW Pipeline, the heavy vegetation resulted in inaccurate terrain levels, therefore a representative channel has been lowered approximately using a terrain modification (2d_zsh) line.
As noted previously, details of these trunk drainage channels and culverts, owned by Sydney Water, were not included in the CBC provided stormwater drainage network layers. Therefore, details were estimated as outlined above.
A Mannings roughness of 0.016 has been applied to all pipes and culverts, with entry loss coefficient of 0.5 and exit loss coefficient of 1.0 applied for all elements. For all elements a height and width contraction coefficient of 0.6 and 0.9 respectively have been applied.
The location of all modelled pipes, culverts and bridges for the main drainage corridors is shown in Figure 4-5
4.4.2
Stormwater Drainage
The stormwater pit and pipe network for the study area has been included in the 1D component of the TUFLOW model. The data for the stormwater network has been based on the following:
• Pit and pipe sizes, inverts and alignments within the study area were based on recently surveyed layers provided by CBC (refer to Section 3.7.1). This data was validated against the modelled pit and pipe layer from the original Flood Study model (BMT WBM, 2010).
• For the lower sections of trunk drainage in the CBC network, review of surveyed levels relative to LiDAR levels of the concrete channel downstream showed unresolved differences. CBC provided Stantec CCTV data for these sections of pipe, and using LiDAR, CCTV depths, and surveyed levels, an estimated and adjusted set of inverts were applied for the pipes downstream of Wolumba Street.
• For Cumberland LGA to the north, Cumberland City Council provided an interim copy of 1D drainage network (pit and pipe data) from the concurrent Duck River, Duck Creek and A’Becketts Creek ARR2019 Update (Royal Haskoning DHV, ongoing). Within this data CCC had pipe and culvert dimensions, however inverts had been estimated by Royal Haskoning using average cover depths. In lieu of surveyed invert levels, it is assumed that the accuracy of this data was acceptable for the purposes of modelling for this project as this data was for outside of the study area.
All circular pipes and rectangular box culverts included in the final TUFLOW model are shown in Figure 4-5. A Mannings roughness of 0.016 has been applied to all pipes and culverts in the stormwater network, with entry loss coefficient of 0.5 and exit loss coefficient of 1.0 applied for all elements. For rectangular culverts a height and width contraction coefficient of 0.6 and 0.9 respectively have been applied.
Over 155 inlet pits were included in the updated model. All pits named ‘nodes’ in the database with no surveyed details were assumed to be closed manholes and were not modelled as inlet pits in the updated flood model.
The inlet pits have been modelled as SX boundaries that connect the 1D to the 2D domain. Pit inlet capacity has been accounted for within the hydraulic model through sizing pits individually and assigning flow rating curves for each pit. The pit rating curves were calculated using Watercom’s HEC-22 calculation spreadsheet For stormwater inlet pits, a range of different pit details were
available from Council’s database including width, length, type (grated inlet, kerb inlet or manhole), kerb length, and configuration (sag or on-grade). The number of potential combinations for all of these different pit details meant that there were too many unique combinations to reasonably establish rating curves for each. Therefore the following standard pit details were adopted in the model, resulting in 90 unique pit types each of which has its own generic rating curve. The various pit sizes from the database were scaled to the nearest standard dimension creating the following number of combinations:
• 10 lintel only size combinations – 5 pits within the Wolumba catchment;
• 16 grate only size combinations – 16 pits within the Wolumba catchment;
• 19 lintel and grate combined sizes – 136 pits within the Wolumba catchment
• 45 different pit sizes total, with a sag and on-grade rating curve developed for each totalling 90 different inlet pit rating curves. In the Wolumba catchment there were in total 37 sag pits and 118 on grade pits.
As per CBC Development Engineering Standards Guide blockage policy, a 50% blockage factor has been applied to all sag type inlet pits, and a 20% blockage factor has been applied to all on-grade type inlet pits. The blockage factors have been applied within the rating curve calculation rather than within the TUFLOW 1D input layer. For the calculation of rating curves generic information was assumed consistent for each pit based on CBC standard drawings for inlet pit types.
The location of modelled pits including closed manholes, and inlet pits for lintels, grated pits and combined pits are shown in Figure 4-6.
4.4.3 Culvert Blockage Factors
As noted in the previous section, for the stormwater pit network blockage, factors of 50% for all sag pits and 20% for all on-grade pits have been applied in accordance with CBC blockage policy This blockage accounts for debris blockage at the typically grated inlets. Due to these grated inlets throughout the network, and due to reasonable grades on pipes minimising the risk of sedimentation in the pipes, it has been assumed that there is negligible blockage of the stormwater pipe network. Therefore no blockage factor has been applied to the stormwater network.
However it was determined that there was a reasonable debris blockage risk for the culverts and bridges with open channels upstream. Design blockage factors have been estimated using the ARR2019 design blockage calculation sheets included in Appendix A
The L10 design blockage length was assumed to be 2.0 metres representing fences and other debris. The overall debris potential was seen as ‘low’ resulting in blockage factors of 25% for all road crossing culverts or bridges with width / diameter of less than 4 metres and 0% blockage for all structure sizes greater than this.
All culverts with 25% design blockage applied in final modelling are shown in Figure 4-5
These design blockages were applied to all design flood AEPs. In addition, for the 1% AEP event, an ‘unblocked’ scenario was modelled whereby the culverts with 25% blockage were modelled as 0% blocked. Results from both the blocked and unblocked scenarios were enveloped for the 1% AEP to ensure that the worst-case model outputs, accounting for both blockage conditions, were used in establishing the Flood Planning Area (FPA) or setting the Flood Planning Levels (FPLs)
Figure 4-5 TUFLOW Hydraulic Model – Layout of 1D Channels, Culverts, Bridges and Pipes
Figure 4-6 TUFLOW Hydraulic Model – Layout of Modelled 1D Pits
5 Design Flood Modelling
Design hydrology for this project has been established in accordance with the latest available guidance within ARR2019 version 4.2. In addition, design flood modelling has been established in accordance with the guidance from the Floodplain Risk Management Guide – Incorporating 2016 Australian Rainfall and Runoff in Studies (NSW Government, 2019) The ARR2019 guidelines replace the previously adopted ARR87 guidelines, which were used as the basis for design flood estimation in the original Flood Study (BMT WBM, 2010).
Design flood modelling has been completed for eleven design events, being the 1 Exceedance per Year (EY), 0.5 EY, 0.2 EY, 10% AEP, 5% AEP, 2% AEP, 1% AEP, 0.5% AEP, 0.2% AEP, 0.05% AEP and Probable Maximum Flood (PMF) events.
5.1 ARR2019 Version 4.2 Guidance
In late 2022, the Australian Government Department of Climate Change, Energy, the Environment and Water (DCCEEW), in partnership with Engineers Australia, commenced an 18-month project to update the climate change considerations within Australian Rainfall and Runoff: A Guide to Flood Estimation (ARR). This work replaced Chapter 6 of Book 1 in ARR with a revised version (Version 4.2, released August 2024).
The project drew on a rigorous literature review of hydroclimatology under climate change, peerreviewed and published in international journals, and was informed by updated climate projections from the Intergovernmental Panel on Climate Change (IPCC). The review was followed by extensive industry consultation and testing to ensure the guidance provided practical, nationally consistent advice for design flood estimation under future climate conditions. The project was jointly funded through the National Emergency Management Agency under the Disaster Risk Reduction Package.
The ARR v4.2 guidance establishes nation-wide percentage increases in rainfall intensity above the ARR2019 baseline (1960–1990 climate) to account for the influence of climate change. Key features of the guidance are:
• Storm duration sensitivity – Shorter duration events (≤1 hour) are most sensitive to climate change, with recommended increases of approximately 15% per degree of global warming. For longer-duration events (≥24 hours), the recommended increase is lower, approximately 8% per degree.
• Planning horizons – Rainfall increase factors are provided for multiple timeframes:
o Short-term (2021–2040)
o Medium-term (2041–2060)
o Long-term (2081–2100)
• Shared Socio-economic Pathways (SSPs) – The guidance aligns with the latest IPCC AR6 framework, allowing practitioners to select rainfall increase factors under different global emissions and adaptation scenarios. Four SSPs are defined:
o SSP1 – sustainability pathway
o SSP2 – middle-of-the-road pathway
o SSP3 – fragmented world (high emissions, low adaptation)
o SSP5 – fossil-fuel intensive growth pathway
In consultation with NSW DCCEEW and CBC, it was agreed that the climate scenario to be adopted for the design flood model was the Year 2030 SSP2 conditions (though for the year 2030 there is no difference between SSP2 and SSP3 scenarios). This horizon and pathway were selected to conservatively represent ‘present-day’ conditions being the mid-point of the ARR ‘short-term’ range from 2021 to 2040.
The analysis in this instance has focussed on the intermediate pathways SSP2 and SSP3 rather than the lowest, SSP1, and highest pathway, SSP5. It appears current consensus is coalescing around SSP2 and SSP3 being the most likely future outcome based on current projections. This assumption reflects informal guidance provided to the industry by the authors of ARR4.2 and NSW DCCEEW representatives.
Modelling of several long-term climate scenarios has also been conducted to assess the sensitivity of flooding in the study area to the potential future impacts of climate change. This climate change assessment is summarised in Section 6.9.
It is noted that in all instances, scaling of design rainfall depths has occurred as per guidance from ARR2019 version 4.2, however rainfall loss scaling has not been applied, with ARR2019 baseline losses retained in all modelling. From testing on similar projects it has been found that the increased rainfall losses from scaling has negligible impact on model results. It was concluded that the more conservative assumption is to retain the smaller rainfall losses from the ARR2019 baseline condition.
5.2 Design Rainfall
ARR2019 Guidelines includes updated Intensity-Frequency-Duration (IFD) data, areal reduction factors (ARFs), and has introduced ensemble modelling methods to account for the variability in rainfall temporal patterns. All of these components and their application in the design flood model for the study area are summarised in the following sections.
5.2.1 Design Rainfall Depths
Design rainfall has been based on ARR2019 version 4.2 Intensity-Frequency-Duration (IFD) data extracted from the ARR Data Hub for the study area. The IFD has been based on the centroid of the study area at -33.8719 latitude and 150.9998 longitude. Upon review it was determined that the catchment was sufficiently small as to be reasonably represented by a single IFD rather than a spatially distributed set of IFDs.
The ARR Data Hub extracted data including IFD and PNBIL losses (both adopted within the design flood model) is included in Appendix A
As noted above, rainfall scaling of the baseline ARR2019 data (based on data prior to 1990) has been scaled to represent the 1.2 degrees of global warming projected to the Year 2030 for either SSP2 or SSP3. The adopted design rainfall depths for the TUFLOW model as tabulated in Table 5-1
It is noted that similar to large parts of Sydney, review of ARR2019 design rainfall depths, even when applying scaling to the year 2030 SSP2 conditions, still produces lower rainfall depths than the previously adopted ARR87.
5.2.2 Temporal Pattern Data
Ensemble modelling methods are employed in accordance with the ARR2019 Guidelines with ten temporal patterns per event and duration The study area is within the East Coast South zone for selecting temporal patterns from the ARR Data Hub as outlined in ARR2019 Book 2 Chapter 5
Design storms are sorted into three temporal pattern bins as shown in Figure 5-1. A different set of 10 temporal patterns are associated with each temporal pattern bin. The 1% AEP event, for example, falls within the ‘Rare’ to ‘very rare’ temporal pattern bin. The design events included within this study lie within the following TP bins:
• Frequent: 1EY, 0.5 EY, 0.2 EY
• Intermediate: 10% AEP, 5% AEP
• Rare to Very Rare: 2% AEP, 1% AEP, 0.5% AEP, 0.2% AEP and 0.05% AEP.
An ensemble of ten temporal patterns for each storm duration were loaded into TUFLOW for modelling directly from the ARR Data Hub (refer to Section 5.3 for further discussion of the ensemble model approach adopted for this study).
Figure 5-1 Bins for temporal patterns versus AEP (source: ARR Figure 2.5.12)
5.2.3
Areal Reduction Factor
In accordance with ARR2019, Areal Reduction Factors (ARFs) are required for catchments that are sufficiently large. The purpose of ARF is to account for the localised nature of storm bursts, the bigger the catchment area the less likely it is that storm burst will occur throughout the area.
It should be noted that the ARF provides a correction factor between the catchment rainfall depth (for a given combination of AEP and duration) and the mean of the point rainfall depths across a catchment (for the same AEP and duration combination). The ARF merely influences the average depth of rainfall across the catchment, it does not account for variability in the spatial and/or spacetime patterns of its occurrence over the catchment.
ARFs are determined based on a formula relating to catchment area, AEP event and duration. In large catchments however, there is a risk that applying one ARF across the total area would artificially reduce the total effective rainfall, and underestimate peak flows.
Due to the relatively small catchment size for this study area (0.7 km2) it has been assumed that a ARF value does not need to be applied for this catchment. Therefore an ARF = 1.0 has been adopted and conservatively there has been no areal reduction applied to the design rainfall.
5.2.4 Extreme Hydrology
The Probable Maximum Precipitation (PMP) refers to “the greatest depth of precipitation meteorologically possible for a given duration” (Bureau of Meteorology, 2003), and is used together with spatial and temporal patterns to estimate the Probable Maximum Flood (PMF). Based on the location of the study area, the Generalised Short-Duration Method (GSDM) (BoM, 2003) is appropriate for the derivation of PMPs up to durations of 6 hours and catchments less than 1,000 km2
The calculation of the GSDM PMP rainfall was prepared in accordance with Section 3.3. of ARR2019 Book 8 The centroid of the catchment was derived and appropriate factors were applied to produce the rainfall for the 15 minute – 6 hour durations. To calculate the IFD for PMP using GSDM approach the following parameters were adopted for the catchment:
• Smooth proportion of 100%
• Elevation Adjustment Factor (EAF) value of 1.0 (mean elevation is well below the 1500m threshold for EAF reductions)
• Moisture Adjustment Factor (MAF) value of 0.70 from contour mapping from Figure 3 of BoM 2003
These factors were used to establish the PMP estimate for the catchment. The average rainfall depth approach was adopted, averaging rainfall across the catchment from the PMP ellipsoidal approach. The ellipses were aligned to include the most of the catchment within the smaller ellipses as was possible. The resultant rainfall totals for the PMF short duration events are tabulated in Table 5-2
In addition, two long duration PMP storms were modelled, the 12-hour and 24-hour storms. Due to the fast catchment response, these events were unlikely to be critical, however for consideration of the maximum duration of flooding it was considered important that these long duration storms be simulated. The following assumptions were made in the GSAM set-up:
• The GSAM is designed to estimate PMP between 24 and 96 hours, with no preliminary estimates available for 12 hr, therefore 12hr were calculated by interpolation.
• GSAM Coastal zone was assigned to catchment as PMP Zone.
• PMP rainfall depths were calculated for both Summer and Autumn seasons across zones to compare, since the highest rainfall can occur in either season depending on the catchment’s location, size, and the duration being considered.
• Moisture Adjustment Factor (MAF) value of 0.899 for summer and 0.843 for Autumn were calculated according to EPW seasonal catchment average (was obtained from annual/Autumn EPW grid), 'Summer/Annual’ EPW annual standard (80.80 mm) and ‘Autumn’ April-May EPW autumn standard (71.00 mm)
• Topographic Adjustment Factor – TAF was estimated as 1.22.
• Summer and Autumn PMP values (mm) were calculated and maximum of the seasonal values (summer) for each duration rounded to the nearest 10 mm to obtain final GSAM PMP depth.
For both GSDM and GSAM PMP storms a single temporal pattern was adopted resulting in 10 model runs in total for the PMF: 15-minute, 30-minute, 45-minute, 1-hour, 1.5-hour, 2-hour, 3-hour, 6-hour, 12-hour and 24-hour.
Table 5-2 Adopted PMP Rainfall Events
5.3 Ensemble Model Approach
Ensemble modelling methods are employed for all non-PMF events in accordance with the ARR2019 Guidelines. Ensemble modelling involves modelling a set of 10 different Temporal Patterns (TPs) for each design event and storm duration. As the adopted model approach is rainfall-on-grid within TUFLOW, the hydrology and hydraulic modelling occurs within the same model. Therefore the ‘ensemble in hydrology and hydraulics method’ as outlined within Section 4.3.3 of the Floodplain Risk Management Guide (NSW Government, 2019) is considered the only feasible approach for this project A flow chart of the ‘ensemble in hydrology, mean in hydraulics method’ from the Floodplain Risk Management Guide (NSW Government, 2019) is shown in Figure 5-2
In order to maintain manageable model run times, a modified version of the ensemble model in hydrology and hydraulics has been developed herein. The adopted ensemble modelling approach to produce the final design model runs for this project includes:
• Establishment of a coarser version of the design flood model in TUFLOW for TP selection runs. The objective of the coarser model set-up is to reduce model run times and file sizes, with non-essential result files turned off to also maintain efficient file sizes. This coarser model is mostly identical to the design flood model but has the following modifications to set-up:
» For areas of 1m grid cell size in the design flood model (shown in Figure 4-2), a coarser 2m grid cell size has been adopted. As this covers a large portion model extent and results in a four-fold reduction in the number of grid cells, this greatly reduces the model size and runtime.
• Three representative design Annual Exceedance Probabilities (AEPs) – the 20% AEP, 5% AEP and 1% AEP, have been selected to represent the frequent, intermediate and rare TP bins (refer to Section 5.2.2 for further discussion). All 10 temporal patterns for these three AEPs have been modelled in the coarser TUFLOW model for all storm durations from 15minute to 6-hour
• The closest to mean TP across the study area is reviewed from the coarser model results, and this single TP for each storm duration is selected for modelling in the final design model Selected TPs for each of the three modelled AEPs are applied to all design events within the three respective TP bins.
• In the design model, the single selected TP for all storm durations were modelled for the ten (10) design events (except for the PMF)
• Critical duration analysis of the design model results was undertaken and the critical durations across the study area were identified for all design events for adoption in the final model results.
• For the 1% AEP event, an envelope approach has been adopted for the design flood results encompassing both blocked and unblocked culvert scenarios.
Figure 5-2 Flow Chart for the ‘Ensemble in hydrology and hydraulics’ Approach (Source: NSW DCCEEW, 2019)
5.3.1
Critical Duration and Temporal Pattern Selection
The final design events for each AEP are tabulated in Table 5-3. As shown for all non-PMF events there are only 1-2 storm durations that are critical for each AEP. Generally, the shorter duration events are critical for the upper reaches of the catchment, while the longer duration events are critical for the lower floodplain.
Critical duration mapping for all relevant AEPs is included in Appendix B For the 1% AEP event this includes distinguishing whether the critical event occurs under blocked or unblocked conditions.
Table 5-3 Critical Storm Events for Design Flood Modelling
1 EY
0.5 EY
0.2 EY
10% AEP
5% AEP
2% AEP
1% AEP
0.5% AEP
0.2% AEP
0.05% AEP
PMF
45-minute
45-minute
45-minute
25-minute
30-minute
25-minute
30-minute
20-minute
30-minute
20-minute
30-minute
20-minute
30-minute
20-minute
30-minute
20-minute
30-minute
15-minute
30-minute
TP09
TP09
TP09
TP09
TP08
TP09
TP08
TP01
TP05
TP01
TP05
TP01
TP05
TP01
TP05
TP01
TP05
GSDM
GSDM
5.4 Model Validation
Similar to many overland flow affected urban catchments, there is limited historical gauged level or flow information within the study area. In addition, with minimal historical flooding observations or records within the study area, it was not possible to calibrate or validate the hydraulic model to a historical flood event.
Beyond calibration to historical flood events, another way to have confidence in model results is a validation to the previous flood study models. This can provide further evidence of suitable model setup, considering the extensive work that had been conducted in setting up the various models of past flood studies.
This model validation for this study has been in the form of:
• For the hydrology component of the TUFLOW model, validation has been conducted by comparing peak flows and hydrographs at the downstream end of the study area as summarised in Section 5.4.1
• For the hydraulic component of the TUFLOW model, validation has been conducted by comparing peak flood level results to the original Flood Study model as summarised in Section 5.4.2
It is noted that ultimately the current TUFLOW model has been set-up using the latest available modelling practices and software, with additional data now available for the study area as well.
5.4.1 Flow Comparison to Previous Models
A flow comparison has been conducted for the following PO lines: PO_26, PO_27 and PO_28 which are located immediately upstream, in between and downstream of the SW Pipelines. Peak flow results from the current TUFLOW model have been compared to the following previous Flood Study for the 1% AEP design flood event:
• Original Wolumba Flood Study (BMT WBM, 2010) – TUFLOW Rainfall-on-Grid hydrology model. The peak flow at PO_26, PO_27, PO_28 for this model were 28.6, 23.8 and 25.6 m3/s.
The basis for this validation is two versions of the current TUFLOW hydraulic model:
• Model Scenario E25 - Retains the ARR87 design IFD for the 2-hour critical duration as per the previous study. This is the ‘blocked’ version of the model. The peak flow at PO_26, PO_27, PO_28 for this model scenario are 23.4, 14.6 and 23.6 m3/s.
• Model Scenario D01 – Final design runs adopting ARR2019 version 4.2 design rainfall for the year 2030 SSP2 scenario. This includes both blocked and unblocked versions of the model. The critical duration at the downstream boundary of the study area is 20 minute based on temporal pattern TP01. The peak flow at PO_26, PO_27, PO_28 for this model scenario is 17.0, 9.4 and 16.9 m3/s and 17.3, 8.5 and 16.6 m3/s for the blocked and unblocked versions of the model respectively.
Flow hydrographs for the above three models are shown in Figure 5-3. The results show that the ARR87 version of the current model, where design rainfall reflects previous modelling, there is an 18% decrease in peak flows relative to the original Flood Study model from 2010. There is a delayed hydrograph peak in the ARR87 version of the current model relative to the timing of the original Flood Study hydrograph, which likely explains the reduced peak flows. It appears that due to updated building modelling and roughness modelling in the 2D domain that overland flows are slightly slower in the current model, reducing the peak flow at the outlet of the study area.
Figure 5-3 TUFLOW Model Validation – 1% AEP Flow Hydrograph Comparison to Previous Models for Wolumba Catchment Immediately Upstream and Downstream of SW Pipeline Corridor Crossing (PO_26 and PO_28)
The adopted design model for this study based on ARR2019 version 4.2 shows flow reductions relative to the previous model. This comparison shows the relative impacts of the update in design rainfall adopted within this study as summarised in Section 5.2
5.4.2 Water Level Comparison to Previous Models
Another form of model validation, specifically for the hydraulic component of the model, is a comparison of peak flood level results to previous models. To enable a review of the hydraulic model differences without the influence of changes in design rainfall, the previous model results have been compared against the results based on the ARR87 version of the current model
Water level differences for the current ARR87 model less Original 2010 Flood Study model for the 1% AEP event are shown in Figure 5-4. PMF level differences are shown in Figure 5-5
Figure 5-4 TUFLOW Model Validation – 1% AEP Peak Water Level Differences – Current Model with ARR87 Hydrology less Original 2010 Flood Study
The model results show sections of water level increases and decreases across most of the study area, typically less than 0.1 metres. The largest area of water level increase is near the downstream outlet of the study area where water levels are over 0.3 metres higher relative to the original Flood Study across a large ponding area. Review has found this is due to changes in terrain levels in this area, specifically changes in the channel levels in the SW pipeline corridor.
Further discussion of model updates that contribute to these differences in model results is included in the next section for sensitivity analysis outcomes.
5.5 Sensitivity Analysis
As the current TUFLOW model was being developed, the impacts of each component of the model update were documented through an iterative process. This process involved each model update being conducted in isolation so that the impacts of that component were clearly understood. Multiple iterations of the model update were conducted throughout development. The basis for the model development was test runs retaining the critical design rainfall from previous models for the 1% AEP 2-hour duration storm.
Figure 5-5 TUFLOW Model Validation – PMF Peak Water Level Differences – Current Model with ARR87 Hydrology less Original 2010 Flood Study
Only at the end of the development process was the change made to the final adopted ARR2019 version 4.2 design rainfall (refer to Section 5.2 for more details). At which point the following two design model versions were developed:
• Coarse design model for Temporal Pattern selection (T01)
• Adopted design model (D01)
Many of the model iterations in development were only minor or localised changes, however some updates involved critical changes in model inputs or schematisation. It is the impacts on model results for these significant model updates that forms the basis for this sensitivity analysis.
The model’s sensitivity to key model updates with respect to water level impacts are included in Appendix C. The key model updates analysed and the sensitivity outcomes to these model changes are as follows:
Sensitivity S01: Updating of model configuration (E01 less original FS)
This comparison is for the initial model updates to general model configuration and model extent, with no changes to the model inputs. Specifically, the following model updates are included in this review:
The S01 results show mostly minor water level impacts of less than 0.05 metres with areas of increase and decrease. The areas of significant impact is within the ponding area upstream of the SW pipeline where levels have reduced by more than 0.1 metres as a result of the change in downstream boundary conditions.
Sensitivity S02: Updating of 2D Model Terrain (E02 less E01)
This comparison is for various updates to the 2D grid and terrain. Specifically, the following model updates are included in this review:
• Updating base LiDAR for the model (2019 / 2020 LiDAR replacing 2009 model LiDAR)
• Extending 2D model domain to include catchment of Cumberland LGA (additional runoff diverted into study area not previously modelled).
The S02 results show isolated areas of water level increases and some areas of decreases typically between 0.05 – 0.20 metres. These impacts are due to the change in LiDAR and grid cell size resulting in varied terrain and flood levels. The water levels near the study area outfall have increased by up to 0.3 metres (offsetting the S01 impacts) due to changes in terrain at this location.
Sensitivity S03: Updating of 2D Roughness Mapping (E13 less E12)
This comparison highlights the impacts of the changes in material mapping and depth-varying roughness values from the original FS to the current model set-up (refer to Section 4.3.5 for details).
The results show relatively minor impacts with both increases and decreases typically less than 0.05 metres. The largest impacts are isolated sections where the higher roughness values have resulted in water level increases of up to 0.3 metres. The ponding area upstream of SW pipeline has increases in excess of 0.1 metres as the change in roughness mapping in the SW corridor has resulted in more flow constriction.
Sensitivity S04: Updating of Stormwater Network in 1D (E08 less E03)
This comparison highlights the impacts of replacing the stormwater pit and pipe network from the original model with the updated stormwater network information from CBC (refer to Section 4.4.2 for more details). For the majority of the network, there are no significant changes to the pipe sizes from the original model, only changes to inverts. However some sections of the model do involve addition of entirely new sections of stormwater network, such as in Cumberland LGA.
The results show very minor impacts of less than 0.05 metres, both increases and decreases, in isolated locations. This suggests that the change in pit and pipe layers has been only minor.
Sensitivity S05: Impact of Updating Design Rainfall (D01 less E25)
This comparison highlights the change from ARR87 design rainfall from the previous models to the ARR2019 version 4.2, year 2030 SSP2 design rainfall of the current model (refer to Section 5.2 for more details). There are water level decreases of between 0.05 – 0.10 metres throughout the model, with the biggest impacts being in the ponding area upstream of the SW corridor where levels have reduced by greater than 0.1 metres. These reductions are a result of the decrease in rainfall depths from the change in design rainfall from ARR87 to ARR2019. The selection of a mean temporal pattern (instead of the max), compared to the single ARR87 temporal pattern has also contributed to less flows.
Sensitivity S06: Impact of Culvert Blockage (D01 less D01 Unblocked)
This comparison highlights the impacts of the design blockage assumptions for the adopted design model (25% blockage for all culverts less than 4 metre width) compared to 0% blockage for all culverts (‘unblocked’ scenario). The assumed pit blockage factors have not been changed between these two model versions.
The results show localised water level increases upstream of the blocked culverts within the SW pipeline corridor. In the ponding area upstream levels have increased by between 0.05 – 0.10 metres. However these impacts do not extend far into the study area, showing that modelling of the study area is not sensitive to blockage assumptions.
Sensitivity S07: Suitability of Coarse TP Selection Model (D01 less T01)
This sensitivity check confirms that the adoption of a coarser TUFLOW model set-up for TP selection runs (T01) was a suitable representation of modelling for the adopted design model (D01). The results show that the models produce similar outcomes with only localised and minor flood level differences between the two model configurations. This confirms that the coarser model set-up was suitable for the purposes of Temporal Pattern selection for the final design model.
6 Design Flood Results
6.1 Model Result Processing
Design flood modelling results from the TUFLOW model have been post-processed using the following approach:
• The results for all critical storm duration events modelled for each AEP have been combined into a single set of results for each AEP. For the 1% AEP event this included enveloping the blocked and unblocked scenarios.
• Flood extent trimming: Flood extents for each AEP have been trimmed through the following process consistent with other recent Flood Studies undertaken on behalf of CBC within the LGA:
» A minimum depth filter of 0.05 metres has been applied
» Removal of isolated flooding that has an area less than 250 m2 and a maximum depth of less than 0.3 metres
• All model result grids have been trimmed to these final flood extents for the relevant AEP.
• For results presented in this report, trimming has occurred to the study area boundary, removing flood mapping within Cumberland LGA.
6.2 Modelled Flood Behaviour
The following modelled flood behaviour summaries have been based on the four identified major flowpaths (FP1 to FP4) in the study area shown in Figure 2-4
Figure 6-1 shows flood extents for a range of AEPs to provide an indication on the severity of flooding for the full range of flood events, rather than just a single event. Included within the figure is the flood extents for six design events - the 1 EY, 0.2 EY, 5% AEP, 1% AEP, 0.2% AEP and PMF.
The model results show the following for each flowpath:
• FP1: The flowpaths through residential areas upstream are relatively disjointed with ponding in sections for the 1 EY and 0.2 EY. In the 5% and 1% AEP and larger events the flowpath becomes more extensive. On Arlewis Street and Bent Street the flowpath continues along the road in all events including the 1 EY. The flow crosses Wolumba Street causing widespread flooding through the sports fields of Chester Hill North Public School and discharges to the concrete channel within the SW pipeline corridor.
• FP2: The flowpath had ponding at various sections near Esme Avenue, Ellison Street, and Bent Street in events as frequent as the 1 EY. The flowpath between Greendale Crescent and Esme Avenue becomes more flooded in the 5% AEP and greater events.
• FP3: From Mercy Avenue overland flows occur in events as frequent as the 1 EY. The flows become contained within the Woodland Road corridor, before joining FP4 flows and diverting east along Wolumba Street which contains flows up to the 0.2 EY before converging with FP1.
• FP4: There is minor ponding near Treloar Crescent. East of Bylos Street an overland flowpath occurs in the 0.2 EY and greater events.
Figure 6-1 Design Flood Model Results – Flood Extents for Six Design Events for Upper FP1 and FP2
6.3 Peak Flood Maps
A full set of flood maps has been prepared for the design flood model for all eleven (11) design AEPs, including 1 EY, 0.5 EY, 0.2 EY, 10% AEP, 5% AEP, 2% AEP, 1% AEP, 0.5% AEP, 0.2% AEP and 0.05% AEP and the PMF. This complete map set is provided in Appendix D
The following flood result maps were prepared based on processed TUFLOW model results (refer to Section 6.1) and are presented based on the critical storm duration for each event as summarised in Section 5.3:
• Figure D1–D11: Peak flood extent and 1 metre contours in m AHD for all AEPs.
• Figure D12–D22: Peak flood depths in metres for all AEPs.
• Figure D23–D33: Peak velocity in metres / second for all AEPs.
• Figure D34–D44: H1–H6 flood hazard category mapping for all AEPs.
• Figure D45–D55: Time of inundation in hours for all AEPs.
• Figure D56 and D57: Flood function mapping for the 1% AEP and PMF events
• Figure D58: Pipe capacity assessment outcomes considering all AEPs.
6.4 Study Area Inflows and Outflows
Review of model results has confirmed there is only one significant outflow location from the study area being the discharge point at the concrete-lined open channel in the SW pipeline corridor. There are no external catchments from Cumberland LGA that discharge into the study area The discharge locations, numbered and shown in Figure 6-2, are as follows:
1. SW corridor discharge: Flows in the concrete-lined open channel on the south side of the SW corridor, immediately downstream of the CBC stormwater network outlet headwalls. This summary should include all overland flows and stormwater network flows combined as they discharge from the study area (PO_26). This location is upstream of the pipeline bridge.
2. Study area discharge: Flows in the vegetated channel downstream of the SW corridor within Cumberland LGA. Relative to location 1, this provides an indication of the flow impacts of the SW pipeline bridge and the berm and pipe outfall from the SW pipeline (PO_ADD_37)
The peak flows for three key events are tabulated in Table 6-1 The results show some minor flow increase between location 1 and 2, suggesting the flow obstructions within the SW pipeline do not significantly alter peak flows, in fact local runoff from the SW pipeline corridor may slightly increase flows downstream.
Table 6-1 Peak Outflow Results (in m3/s) along the Study Area Boundary
Figure 6-2 Study Area Inflow and Outflow Locations for Wolumba Sub-Catchment
6.5 Hazard Classification
A new method of hazard categorisation has been developed and is included in the 2019 edition of Australian Rainfall & Runoff (Book 6: Flood Hydraulics, Section 7.2.7). The classification is still based on depth and velocity but utilises six categories based on the stability of children, adults, the elderly and vehicles in flood waters. The ARR hazard category curves are shown in Figure 6-3. H1-H6 hazard category mapping for all design events is included in Appendix D
The 2023 Flood Risk Management Manual identifies three primary flood functions (also referred to as hydraulic categories) to describe flood-prone land: floodway, flood storage, and flood fringe. These categories support flood planning by differentiating between areas that convey floodwater, store it temporarily, or pose minimal impact if developed.
In this study, hydraulic categories were determined using indicator thresholds based on velocity, depth, and velocity–depth product, in line with provisional threshold values provided by CBC. These thresholds are plotted in Figure 6-4 and summarised below:
• Floodway: Floodways are areas that convey a significant portion of the flood flow. If obstructed, these areas would cause unacceptable increases in flood levels or flow redirection that could adversely affect other areas. They are typically high-energy zones and should be protected from development.
CBC-adopted indicator thresholds used to define floodways:
o Velocity ≥ 1.00 m/s, or
o Velocity–depth product ≥ 0.30 m²/s
• Flood Storage Areas: Flood storage areas act as temporary holding zones for floodwaters during the passage of a flood. Blocking or filling these areas can lead to significant increases in flood levels and discharges elsewhere in the catchment.
CBC-adopted threshold:
o Areas outside of the floodway where depths ≥ 0.20 m
These zones play an important role in reducing downstream flood peaks and attenuating flows and are often targeted for preservation in floodplain planning.
• Flood Fringe Areas: Flood fringe areas represent the remainder of the flood-prone land those areas that are outside the floodway and flood storage zones and do not contribute significantly to flow conveyance or flood storage. These areas are typically subject to lower flow velocities and depths and may be suitable for more flexible development options (subject to flood compatibility).
CBC-adopted threshold:
o Areas outside of the floodway where depths < 0.20 m
These indicator-based categories are considered provisional. They are commonly used at the planning stage to identify strategic flood risk areas, but may be refined during future floodplain risk management studies, detailed modelling, or site-specific development applications.
Provisional flood function mapping has been prepared for the 1% AEP event as shown in Figure D56 in Appendix D
6.7
Pipe Capacity Assessment
The modelled pipe capacity in terms of AEP event that the pipes begin flowing full has been mapped for all pipes and culverts in the study area. This was done using the 1D_ccA outputs from TUFLOW model which shows pipe's percentage full. After initial testing it was confirmed that 100% full was a better threshold than other tested thresholds.
Where pipe capacity did not reach 100% full in any design event, the pipe capacity was classified as ‘> PMF’ Pipes that were flowing full in the most frequent design flood event modelled 1 EY, were noted as ‘< 1 EY’.
The number of pipes within the study area for each event capacity is tabulated in Table 6-2
Reviewing results, 37% of all pipes have a capacity of less than a 1 EY event, 24% with capacity less than 0.5 EY, while a further 21% have a capacity up to the PMF or greater meaning they are not flowing full in even rare flood events. It is likely that these pipes have flows bypassing the inlets as the
Figure 6-4 Flood Function Limits for Peak Flood Depth and Velocity Results (Source: CBC)
reason to not be full in the PMF event. This result shows that the majority of pipes have insufficient capacity, or are not capturing enough flows
The pipe capacity results for the study area are shown in Figure D57 of Appendix D
Table 6-2 Pipe Capacity Assessment Outcomes
6.8 Duration of Inundation
The maximum time of duration for flooding within the 2D domain has been based on the ‘Tdur’ result grid results extracted from the TUFLOW model results. This result records the duration (in hours) from when flooding commences to when it recedes. To determine when flooding becomes ‘significant’, a depth threshold of 0.05 metres has been applied.
The duration of inundation results are shown in Appendix D. The presented results consider the maximum duration of flooding across all modelled durations, not just those that are critical in terms of peak levels.
The results show that the duration of flooding within the study area is typically less than 1 hour, with the exception of the PMF where duration of flooding is only slightly extended, though rarely exceeding 1.5 hours.
6.9 Climate Change Assessment
Climate change impacts on flooding are typically accounted for in two forms:
• Sea Level Rise and the impacts on tailwater conditions: This study area is elevated above any sea level rise impact horizon for tailwater conditions, therefore these impacts did not need to be considered as part of this study.
• Rainfall increase, which affects design rainfall inputs and flood magnitude.
As mentioned in Section 5.1, guidance released by ARR in 2024 (referred to as ARR4.2) introduces a new approach for estimating future rainfall changes, based on event duration, design year, and Shared Socioeconomic Pathways (SSPs). Following discussion with CBC and NSW DCCEEW, it was decided herein to adopt within the design flood modelling, rainfall corresponding to a Year 2030 SSP2 scenario as per guidance from ARR2019 version 4.2. This accounts for 1.2 degrees of expected global warming above pre-1990 baseline conditions, as per latest IPCC projections, with the majority of that temperature increase already having occurred by the year 2025.
Four additional future climate scenarios have been assessed for the 1% AEP critical events as part of this study:
• Year 2050, representing an intermediate-term planning horizon (24-years from the date of this study) Two SSPs have been considered:
» Year 2050 SSP2: The projected global temperature increase above pre-1990 baseline conditions for this scenario is 1.7 degrees Celsius, and 0.5 degrees above the adopted year 2030 design conditions. For the critical durations (all 1-hour or less) this translates to rainfall increases of 27% above pre-1990 baseline and 7 6% above adopted design conditions (year 2030 SSP2)
» Year 2050 SSP3: The projected global temperature increase abovepre-1990 baseline conditions for this scenario is 1 8 degrees Celsius, and 0 6 degrees above the adopted year 2030 design conditions. For the critical durations (all 1-hour or less) this translates to rainfall increases of 29% above pre-1990 baseline and 9 3% above adopted design conditions (year 2030 SSP2).
• Year 2100, representing a long-term planning horizon (74-years from the date of this study) Two SSPs have been considered:
» Year 2100 SSP2: The projected global temperature increase abovepre-1990 baseline conditions for this scenario is 2.5 degrees Celsius, and 1.3 degrees above the adopted year 2030 design conditions. For the critical durations (all 1-hour or less) this translates to rainfall increases of 41% above pre-1990 baseline and 19% above adopted design conditions (year 2030 SSP2)
» Year 2100 SSP3: The projected global temperature increase abovepre-1990 baseline conditions for this scenario is 3.3 degrees Celsius, and 2.1 degrees above the adopted year 2030 design conditions. For the critical durations (all 1-hour or less) this translates to rainfall increases of 66% above pre-1990 baseline and 41% above adopted design conditions (year 2030 SSP2)
An illustration of projected global temperature changes for the current SSPs relative to the pre-1990 baseline is shown in Figure 6-5. This graph shows the relative temperature changes between 2030, 2050 and 2100.
The 1% AEP peak flood level and hazard category impacts for these four future climate scenarios relative to the adopted design scenario of the year 2030 SSP2 are included in Appendix E. The results show:
• For the two 2050 scenarios (SSP2 and SSP3), the flood level impacts are quite similar as the global temperature difference between the two scenarios is 0.1 degrees meaning the rainfall depths are quite similar. For the majority of the study area impacts for both scenarios are less than 0.05 metres. The areas of most significant impact is the ponding on the floodplain upstream of the SW pipeline (FP1), and the ponding area upstream of Wolumba Street (FP3) where impacts are still less than 0.1 metres.
• For the year 2100 SSP2, flood impacts are more pronounced with impacts along most flowpaths between 0.05 – 0.10 metres. Impacts within the two ponding areas noted above also become more pronounced at between 0.1 – 0.2 metres
• For the year 2100 SSP3, flood impacts are significant with impacts along almost all flowpaths up to 0.3 metres. However, nowhere in the study area does impacts exceed 0.3 metres.
• Hazard category impacts are minor, with only isolated locations of hazard category increases throughout the study area. The exception is for the year 2100 SSP3 where the road reserves of Bent Street and Wolumba Street have isolated sections of significant hazard increase.
Figure 6-5 Projected global temperature increases above pre-1990 baseline associated with SSPs and Selected Future Climate Scenarios Adopted for this Study (Yellow Circles) (Source: ARR2019 Book 1 Chapter 6)
7 Conclusion
This Wolumba Catchment Flood Study Update applies current industry-standard flood estimation methods and guidance, including Australian Rainfall and Runoff 2019 (Version 4.2) and relevant NSW DCCEEW floodplain management guidelines, to define flood behaviour for a range of design flood events.
A coupled 1D/2D TUFLOW hydrology and hydraulic model has been developed for the Wolumba catchment through a rigorous process consistent with the methodology adopted in other recent Flood Studies undertaken on behalf of CBC within the LGA. The model has been validated against the previously developed model and generally demonstrates good agreement particularly in defining the flow paths. Accordingly, the model is considered robust and can be used with confidence to assess design flood behaviour.
The model has been run for the 1 EY, 0.5 EY, 0.2 EY, 10% AEP, 5% AEP, 2% AEP, 1% AEP, 0.5% AEP, 0.2% AEP, 0.05% AEP and PMF events. Flood levels, depths and velocities have been mapped, along with the H1-H6 flood hazard categories, flood function, duration of flooding and pipe capacity assessment Design model results show four flowpaths within the study area, with overland flooding along these flowpaths affecting residential parts of the catchment.
Assessment of the impacts of rainfall increases due to climate change was undertaken along with assessment of sensitivity to various model parameters such as updates to model configuration, design rainfall, hydraulic roughness, structure blockage rates, stormwater network and grid cell size. Climate change assessment was for four future climate scenarios for year 2050 and 2100, and SSP2 and SSP3.
The study will be used by CBC and various stakeholders to inform flood planning and emergency management in the Study Area. The outputs of the Flood Study will provide information on current and future flood risk which is important for increasing community awareness and for building resilience. This updated Flood Study and TUFLOW model form the basis of assessment for the FRMS&P of this study area.
8 References
Ball J, Babister M, Nathan R, Weeks W, Weinmann E, Retallick M, Testoni I, (Editors), 2019, Australian Rainfall and Runoff: A Guide to Flood Estimation, Commonwealth of Australia
BMT WBM (2010) Wolumba Catchment Flood Study, prepared for Bankstown City Council
Canterbury-Bankstown Council (2023) Canterbury-Bankstown Development Control Plan (DCP) 2023
Canterbury-Bankstown Council (2023) Canterbury-Bankstown Local Environment Plan (LEP) 2023
Molino Stewart (2012) Duck River Catchment Floodplain Risk Management Study and Plan, prepared for Parramatta City Council, Auburn City Council and Bankstown City Council
NSW Government (2005) Floodplain Development Manual
NSW Government (2015) Floodplain Risk Management Guide – Modelling the Interaction of Catchment Flooding and Oceanic Inundation in Coastal Waterways, November
NSW Government (2019) Floodplain Risk Management Guide – Incorporating 2016 Australian Rainfall and Runoff in Studies
NSW Government (2021) Considering flooding in land use planning: Guideline, July
NSW Government (2021) Environmental Planning and Assessment Amendment (Flood Planning) Regulation 2021
NSW Government (2021) Local Planning Direction - Section 9.1(2) of the Environmental Planning and Assessment Act 1979 - Flooding
NSW Government (2021) Planning Circular - Considering flooding in land use planning: guidance and statutory requirements
NSW Government (2021) Standard Instrument (Local Environmental Plans) Amendment (Flood Planning) Order 2021
NSW Government (2021) State Environmental Planning Policy Amendment (Flood Planning) 2021
NSW Government (2023) Flood Risk Management Manual: The management of flood liable land, February
Note Preburst interpolation methods for catchment wide preburst has been slightly altered. Point values remain unchanged.
ClimateChangeFactors
SSP3-7.0
SSP5-8.5
LossFactors
Initial Loss (Adjustment Factors)
Continuing Loss (Adjustment Factors)
Temperature Changes (Degrees, Relative to 1961-1990 Baseline)
LayerInfo Time Accessed 21 January 2026 07:04PM
Version 2024_v1
Note Updated climate change factors for IFD Initial loss and continuing loss based on IPCC AR6 temperature increases from the updated Climate Change Considerations (Book 1: Chapter 6) in ARR (Version 4.2). ARR recomends the use of Current and nearterm (2030 midpoint). Medium-term (2050 midpoint) and Long-term (2090 midpoint)
ProbabilityNeutralBurstInitialLoss
2880
LayerInfo
Time Accessed 21 January 2026 07:04PM
Version 2018_v1
Note As this point is in NSW the advice provided on losses and pre-burst on the NSW Specific Tab of the ARR Data Hub is to be considered. In NSW losses are derived considering a hierarchy of approaches depending on the available loss information. Probability neutral burst initial loss values for NSW are to be used in place of the standard initial loss and pre-burst as per the losses hierarchy.
Wolumba Flood Study Update Report
A.2 ARR Design Culvert Blockage Assessments
STRUCTURE
:
OPENING WIDTH:………………….m
DEBRIS TYPE/MATERIAL/L10/SOURCE AREA - There may be more than one material type to consider! Debris Type/Material L10 Source Area How Assessed
DEBRIS AVAILABILITY (HML) – for the selected debris type/size and its source area
Availability
Medium
Low
• Dense forest, thick vegetation, extensive canopy, difficult to walk through with considerable fallen limbs, leaves and high levels of floor litter.
• Streams with boulder/cobble beds and steep bed slopes and banks showing signs of substantial past bed/bank movements.
• Arid areas, where loose vegetation and exposed loose soils occur and vegetation is sparse.
• Urban areas that are not well maintained and/or old paling fences, sheds, cars and/or stored loose material etc., are present on the floodplain close to the water course.
• State forest areas with clear understory, grazing land with stands of trees
• Source areas generally falling between the High and Low categories.
• Well maintained rural lands and paddocks, with minimal outbuildings
• Streams with moderate to flat slopes and stable beds and banks.
• Arid areas where vegetation is deep rooted and soils resistant to scour
• Urban areas that are well maintained with limited debris present in the source area.
DEBRIS MOBILITY (HML) - for the selected debris type/size and its source area
Mobility
High
Medium
Low
• Steep source area with fast response times and high annual rainfall and/or storm intensities and/or source areas subject to high rainfall intensities with sparse vegetation cover.
• Receiving streams that frequently overtop their banks.
• Main debris source areas close to streams
• Source areas generally falling between the High and Low categories.
• Low rainfall intensities and large, flat source areas.
• Receiving streams that Infrequently overtop their banks.
• Main source areas well away from streams
DEBRIS TRANSPORTABILITY (HML) - for the selected debris type/size and stream characteristics
Transportability
High
Medium
Low
Typical Transporting Stream Characteristics
• Steep bed slopes (> 3%).and/or high stream velocity (V>2.5m/sec)
• Deep stream relative to vertical debris dimension (D>0.5L10)
• Wide streams relative to horizontal debris dimension. (W>L10)
• Streams relatively straight and free of constrictions/snag points.
• High temporal variability in maximum stream flows
• Streams generally falling between High and Low categories
• Flat bed slopes (< 1%).and/or low stream velocity (V<1m/sec)
• Shallow stream relative to vertical debris dimension (D<0.5L10)
• Narrow streams relative to horizontal debris dimension.(W<L10)
• Streams meander with frequent constrictions/snag points.
• Low temporal variability in maximum stream flows
Notes
SITE BASED DEBRIS POTENTIAL 1%AEP (HML) - for the selected debris type/size arriving at the site Debris Potential Combinations of the Above (any order) Notes
AEP ADJUSTED SITE DEBRIS POTENTIAL (HML) - for
Debris Blockage
Barrel Blockage
The following tables are only relevant to sites subject to a significant debris load of sediment. Where inlet blockage and barrel blockage are both likely, the blockage producing the greatest impact on flood behaviour should be used in design.
LIKELIHOOD OF SEDIMENT BEING DEPOSITED IN THE BARREL OR WATERWAY (HML)
Likelihood of Sediment: Eg. Medium
MOST LIKELY DESIGN BARREL BLOCKAGE (Bdes% ) for sediment of a particular mean size is then;
Likelihood That Deposition Occurs
For modelling blockage mechanism (type, location and timing), refer to Guideline Table 8
Wolumba Flood Study Update Report
Appendix B Critical Duration Mapping
Appendix B Critical Duration Mapping
Wolumba Flood Study Update Report
Appendix C Sensitivity Analysis Mapping
Appendix C Sensitivity Analysis Mapping
Wolumba Flood Study Update Report
Appendix D Design Flood Mapping
Appendix D Design Flood Mapping
Wolumba Flood Study Update Report
Appendix E Climate Change Assessment Mapping
Appendix E Climate Change Assessment Mapping
Stantec is a global leader in sustainable architecture, engineering, and environmental consulting. The diverse perspectives of our partners and interested parties drive us to think beyond what’s previously been done on critical issues like climate change, digital transformation, and future-proofing our cities and infrastructure. We innovate at the intersection of community, creativity, and client relationships to advance communities everywhere, so that together we can redefine what’s possible.