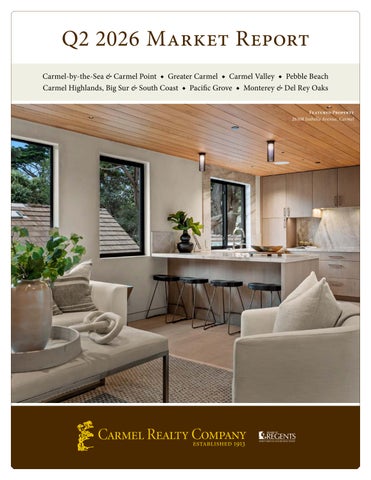
Q2 2026 Market Report Carmel-by-the-Sea & Carmel Point ◆ Greater Carmel ◆ Carmel Valley ◆ Pebble Beach Carmel Highlands, Big Sur & South Coast ◆ Pacific Grove ◆ Monterey & Del Rey Oaks Featured Property 26308 Isabella Avenue, Carmel
Carmel Realty Company’s Featured Listings Unique Pebble Beach Estate with Rich History
Glamorous Old Hollywood Style in Pebble Beach
1031 The Old Drive ■ 4 bed, 4 bath ■ $11,995,000
3321 17 Mile Drive ■ 7 bed, 6 bath ■ $11,500,000
Rare Opportunity for a New Build on Carmel Point Serene & Private Sanctuary in Carmel-by-the-Sea
26308 Isabella Avenue ■ 4 bed, 4 bath ■ $9,798,000
San Carlos 2 SW of 1st ■ 4 bed, 3 bath ■ $6,750,000
Timeless Design in the Heart of The Preserve
Set on a Scenic Ridge in Corral de Tierra
5 Via Vaquera ■ 4 bed, 3+ bath ■ $5,450,000
28000 Underwood Road ■ 3 bed, 2 bath ■ $3,475,000
Q2 2026 Market Report
Q2 2026 Market Report
Ta b l e o f C o n t e n t s
Get in-depth market updates for key areas across the Monterey Peninsula.
02
Market Overview
03
Carmel-by-the-Sea & Carmel Point
05
Greater Carmel
07
Carmel Valley
09
Pebble Beach
11
Carmel Highlands, Big Sur & South Coast
13
Pacific Grove
15
Monterey & Del Rey Oaks
Carmel Realty Company’s Q2 2026 Significant Sales On the Iconic Pebble Beach Golf Links
Truly One of the Best Views on Carmel Point
Digital Rendering
1536 Cypress Drive ■ SP: $31,000,000 ■ Represented Buyer & Seller
26177 Scenic Road ■ SP: $13,000,000 ■ Represented Buyer & Seller
Coveted Country Club Home in Pebble Beach
Breathtaking New Build in Carmel-by-the-Sea
1059 Marcheta Lane ■ SP: $9,000,000 ■ Represented Seller
Santa Fe 3 SW of Mt. View ■ SP: $5,650,000 ■ Rep. Buyer & Seller
Rarely Available Residence at Spanish Bay
Exceptional Private Estate in Corral de Tierra
28 Spanish Bay Cir. #28 ■ SP: $5,500,000 ■ Rep. Buyer & Seller
109 Corral de Tierra Road ■ SP: $2,650,000 ■ Represented Seller
01 Q2 2026 Market Report
Q2 2026 Market Overview Summer is one of the most exciting times of year on the Peninsula. The season truly showcases the exceptional lifestyle that makes this region such a sought-after place to call home. The real estate market was very strong through the first half of 2026. Buyers and sellers remain thoughtful in their decision-making, yet the enduring appeal of our coastal communities, combined with limited inventory and strong long-term value, continues to support a healthy market. As always, Carmel Realty Company remains committed to providing the local expertise and trusted guidance our clients rely on through every stage of the buying and selling process. The second quarter was very impressive overall with 317 properties being sold across the nine markets we track—a nearly 30% increase in the number of sales over the first quarter and a 14% gain compared to the same period last year. Sales dollar volume also climbed more than 34%, fueled by renewed strength in the luxury segment and a growing number of high-value transactions. Pebble Beach recorded its highest quarterly sales volume since early 2022, and the number of sales above $5 million has already matched the total for all of 2025. Carmel-by-theSea also posted its strongest quarter since 2023, with 35 closed sales and nearly $132 million in total sales volume. Elsewhere, Greater Carmel remained steady as average sales prices increased and inventory expanded, providing buyers with greater selection heading into the second half of the year. Carmel Valley also gained momentum over the first quarter, with improving buyer activity, faster-moving inventory, and continued demand across a variety of price points. Monterey and Pacific Grove both saw an increase in sales volume and sales activity, with robust inventory providing momentum heading into the third quarter. In Carmel Highlands and Big Sur, a limited number of transactions once again produced strong pricing performance, reinforcing the enduring value and desirability of these highly sought-after coastal properties. Carmel Realty Company continues to lead the luxury market across the Monterey Peninsula, representing more than 35% of all transactions above $5 million and over 42% of the market above $10 million this year. From landmark sales in Pebble Beach and Carmel-by-the-Sea to exceptional representation throughout our coastal communities, our agents continue to set the standard for local expertise, market knowledge, and exceptional client service. Each of the markets we serve continues to balance changing inventory levels, buyer demand, and pricing trends, making knowledgeable local representation more valuable than ever. Whether you are considering buying, selling, or simply staying informed, our team is here to provide trusted guidance every step of the way. We hope you enjoy this detailed analysis of the Monterey Peninsula real estate market and find it to be a valuable resource.
Q2 2026 Statistics Market Update Market Update
Carmel-by-the-Sea Carmel-by-the-Sea & Carmel Point & Carmel Point Carmel-by-the-Sea had an exceptionally strong second quarter, recording 35 sales—the highest quarterly total since Usanditia ne endem. Es ellictor sitat andendam et quae Q3 2023 and a 75% increase over the previous quarter. While omnimendamus il ium sapieni mustenis rerat pera et utes fewer luxury sales average sales price down from corerem nimus et, brought testrum the faccusandus. Q1’s unusually high levels, it remained a healthy $3.7 million, Tate nonsequi doloris sus natem debis mos earcipsapid quia and overall volume to nearly million, volum que sisales acestem untclimbed quos volor mo ma$132 veliquam ha-the highest since Q2 of 2024. Inventory also increased heading rum re ne laut accus alic tentis eos a simpos apiet eum fuga. into Q3, with 36 active listings providing more opportunities Ut quiae simincit aut omniantiis dem rerehenem ipit quat il ipsum re ni optatur, con necabore magnatur, niae. Omnim for buyers compared to just 23 at the end of last quarter. debit et occum quidel ius ma diorepeliat vendio enest, con Carmel Realty Company and Monterey Coast Realty core voloratiam qui officiis dolupiet lignate nisquas quam, continued to lead the market, representing 14 of the quarter’s corendae magniet officimos mi, que occat minus, ommo 35 sales, including the highest-priced MLS sale at nditiore $13 million cone omnitem volorest eictian destem. At officie and a $20idelit million off-market transaction, double-ended quassita quiam, cuptatati dolorestio both volorrovide sitiur by Carmel Realty. as as expeles ratiasperis eaquo
Average Selling Price
$3,768,554 22.6%
versus Q1 2026
16.8%
versus Q2 2025
Average Days on Market
7.8%
59
versus Q1 2026
13.5%
versus Q2 2025
Sales Volume
$131,899,388 35.5%
versus Q1 2026
4%
versus Q2 2025
Units Sold
35
75%
versus Q1 2026
03 Q2 2026 Market Report
25%
versus Q2 2025
Q2 2026 Quarterly Market Breakdown
Q2 2026 Sales by Segment
Average vs. Median Sales Price in millions
14% 14%
homes 65homes
14%
5 homes
41% 46%
18 homes 16 homes
26%
9 homes
Q2 2025
Q3 2025
Q4 2025
Average
in millions
Q2 2025
Q3 2026
Q2 2026 < $1m
Median
Total Sales Volume By Quarter
Q1
Q1 2026
Q4
$1m–$2m $2m–$3m $3m–$5m
Number of Closed Sales By Quarter
Q1
Q2 2025
Q3
Q4
2026
$5m+
Median Sales Price in millions
Q1
Q2 2025
Q3
Q4
2026
Did You Know? Carmel-by-the-Sea is known for attracting various celebrities and artists. Clint Eastwood served as mayor of the village from 1986-1988. Other notable celebrities, artists and writers who have called Carmel home include Doris Day, John Denver, Ansel Adams and Jack London. “Monterey County Fun Facts”, Monterey County Convention & Visitors Bureau, 2020
Q2 2026 Statistics Market Update
Greater Carmel
Carmel Woods, Mission Fields, Hatton Fields, Carmel Hills, High Meadows, Jacks Peak, Carmel Meadows, Carmel Views/ Rancho Rio Vista, Carmel Rancho, Hacienda/Del Mesa The Greater Carmel area experienced a steady second quarter with 23 sales, slightly below the previous quarter but generally consistent with recent market trends. Average sales price increased 7% as more activity shifted into the $1 million to $2 million range, although the market has yet to see a sale above $5 million this year. Inventory also improved, rising from 32 to 49 active listings, offering buyers more selection heading into the second half of 2026. Carmel Realty agents remained active throughout the quarter, representing clients in eight transactions, including a double-ended sale of the second highest sale of the quarter.
Average Selling Price
$1,916,391 7.4%
versus Q1 2026
6.5%
versus Q2 2025
Average Days on Market
63
21.3%
versus Q1 2026
16.7%
versus Q2 2025
Sales Volume
$44,077,000 1.2%
versus Q1 2026
30.6%
versus Q2 2025
Units Sold
23
8.0%
versus Q1 2026
05 Q2 2026 Market Report
25.8%
versus Q2 2025
Q2 2026 Quarterly Market Breakdown
Average vs. Median Sales Price
Q2 2026 Sales by Segment
in millions
22% 5 homes
13%
26%
3 homes
6 homes
39%
9 homes
Q2 2025
Q3 2025
Q4 2025
Average
in millions
Q2 2025
Q3 2026
Q2 2026 < $1m
Median
Total Sales Volume By Quarter
Q1
Q1 2026
Q4
$1m–$2m $2m–$3m $3m–$5m
Number of Closed Sales By Quarter
Q1
Q2 2025
Q3
Q4
2026
$5m+
Median Sales Price in millions
Q1
Q2 2025
Q3
Q4
2026
Did You Know? Robert Louis Stevenson modeled Treasure Island’s Spyglass Hill after Point Lobos State Reserve near Carmel. “Monterey County Fun Facts”, Monterey County Convention & Visitors Bureau, 2020
Q2 2026 Statistics Market Update
Carmel Valley Including Santa Lucia Preserve
Carmel Valley showed improvement over the first quarter, with increases in sales, average sales price, and overall sales volume, although activity remained below the stronger quarters seen in 2025. After a slow start to the year, buyer activity accelerated in March and April before easing slightly in June. Homes also sold more quickly, with days on market falling to their lowest level since Q2 2024, while inventory increased modestly to 62 active listings. Carmel Realty maintained a strong presence in the Valley with multiple agent closings and seven active listings currently on the market.
Average Selling Price
$2,184,345 8.5%
versus Q1 2026
15.8%
versus Q2 2025
Average Days on Market
60
33.3%
versus Q1 2026
27.7%
versus Q2 2025
Sales Volume
$63,346,000 21%
versus Q1 2026
18.6%
versus Q2 2025
Units Sold
29
11.5%
versus Q1 2026
07 Q2 2026 Market Report
3.3%
versus Q2 2025
Q2 2026 Quarterly Market Breakdown
Average vs. Median Sales Price
Q2 2026 Sales by Segment
in millions
7%
10%
2 homes
3 homes
7% 2 homes
24%
7 homes
52%
15 homes
Q2 2025
Q3 2025
Q4 2025
Average
in millions
Q2 2025
Q3 2026
Q2 2026 < $1m
Median
Total Sales Volume By Quarter
Q1
Q1 2026
Q4
$1m–$2m $2m–$3m $3m–$5m
Number of Closed Sales By Quarter
Q1
Q2 2025
Q3
Q4
2026
$5m+
Median Sales Price in millions
Q1
Q2 2025
Q3
Q4
2026
Did You Know? Monterey County has 349 vineyards, 82 bonded wineries and 65 tasting rooms. The wide range of climates allow Monterey County to grow over 30 different wine grape varietals. “Monterey County Fun Facts”, Monterey County Convention & Visitors Bureau, 2020
Q2 2026 Statistics Market Update
Pebble Beach Pebble Beach continued its impressive momentum during the second quarter, with higher sales volume and transaction activity than both last quarter and the same period last year. Luxury demand remained especially strong, driving the highest quarterly sales volume since early 2022, with 16 properties selling above $5 million already this year— matching all of 2025. Carmel Realty Company dominated the upper end of the market, representing one side of seven of the top ten sales and more than half of the total dollar volume sold during the quarter, including the highest-priced sale double ended by Carmel Realty Company.
Average Selling Price
$4,956,451 17.5%
versus Q1 2026
43.9%
versus Q2 2025
Average Days on Market
83
1.2%
versus Q1 2026
118.4%
versus Q2 2025
Sales Volume
$133,824,166 6.1%
versus Q1 2026
68.9%
versus Q2 2025
Units Sold
27
28.6%
versus Q1 2026
09 Q2 2026 Market Report
17.4%
versus Q2 2025
Q2 2026 Quarterly Market Breakdown
Average vs. Median Sales Price
Q2 2026 Sales by Segment
in millions
7%
2 homes
33%
9 homes
19%
5 homes
15%
4 homes
Q2 2025
Q3 2025
Q4 2025
Average
in millions
Q2 2025
Q3 2026
Q2 2026 < $1m
Median
Total Sales Volume By Quarter
Q1
Q1 2026
Q4
26%
7 homes
$1m–$2m $2m–$3m $3m–$5m
Number of Closed Sales By Quarter
Q1
Q2 2025
Q3
Q4
2026
$5m+
Median Sales Price in millions
Q1
Q2 2025
Q3
Q4
2026
Did You Know? 17-Mile Drive through Pebble Beach is one of only nine private toll roads in the country, and the only one west of the Mississippi. “Monterey County Fun Facts”, Monterey County Convention & Visitors Bureau, 2020
Q2 2026 Statistics Market Update
Carmel Highlands, Big Sur & South Coast The Carmel Highlands and Big Sur market saw a typical number of transactions during the second quarter, but several high-end sales significantly boosted both average sales price and overall sales volume. The region recorded the highest individual sale of any market we track, exceeding $35 million, while three additional properties sold between $3 million and $5 million. Inventory remained relatively steady, and Carmel Realty agents continue to represent several notable listings as activity progresses into the second half of the year.
Average Selling Price
$8,650,417 133.6% versus Q1 2026
117.6%
versus Q2 2025
Average Days on Market
151
18.9%
versus Q1 2026
51%
versus Q2 2025
Sales Volume
$51,902,500 180.3% versus Q1 2026
63.2%
versus Q2 2025
Units Sold
20%
versus Q1 2026
11 Q2 2026 Market Report
6
25%
versus Q2 2025
Q2 2026 Quarterly Market Breakdown
Average vs. Median Sales Price
Q2 2026 Sales by Segment
in millions
16.33% 1 home
16.33% 1 home
50%
16.33%
3 homes
Q2 2025
Q3 2025
Q4 2025
Average
in millions
Q2 2025
Q3 2026
Q2 2026 < $1m
Median
Total Sales Volume By Quarter
Q1
Q1 2026
Q4
1 home
$1m–$2m $2m–$3m $3m–$5m
Number of Closed Sales By Quarter
Q1
Q2 2025
Q3
Q4
2026
$5m+
Median Sales Price in millions
Q1
Q2 2025
Q3
Q4
2026
Did You Know? Local settings from around the Monterey Peninsula have provided the backdrops for more than 180 films and television shows. You’ll recognize many scenes in HBO’s award winning mini-series Big Little Lies in Big Sur and the Carmel Highlands. “Monterey County Fun Facts”, Monterey County Convention & Visitors Bureau, 2020
Q2 2026 Statistics Market Update
Pacific Grove Pacific Grove enjoyed a strong second quarter, recording 45 sales—well above its typical quarterly pace. Increased buyer activity throughout May and June helped drive sales volume to nearly double that of Q1, while the average sales price rose more than 18% quarter over quarter. The luxury segment also strengthened, with five homes selling between $3 million and $5 million, and several high-end listings currently on the market. The quarter ended with 42 active listings in Pacific Grove, up from 33 last quarter and 31 this time last year.
Average Selling Price
$1,692,000 18.3%
versus Q1 2026
9.5%
versus Q2 2025
Average Days on Market
46
21.1%
versus Q1 2026
21.1%
versus Q2 2025
Sales Volume
$76,140,000 97.2%
versus Q1 2026
58.9%
versus Q2 2025
Units Sold
45
66.7% versus Q1 2026
13 Q2 2026 Market Report
45.2%
versus Q2 2025
Q2 2026 Quarterly Market Breakdown
Average vs. Median Sales Price
Q2 2026 Sales by Segment
in millions
11%
16%
5 homes
7 homes
11%
5 homes
62%
28 homes
Q2 2025
Q3 2025
Q4 2025
Average
in millions
Q2 2025
Q3 2026
Q2 2026 < $1m
Median
Total Sales Volume By Quarter
Q1
Q1 2026
Q4
$1m–$2m $2m–$3m $3m–$5m
Number of Closed Sales By Quarter
Q1
Q2 2025
Q3
Q4
2026
$5m+
Median Sales Price in millions
Q1
Q2 2025
Q3
Q4
2026
Did You Know? Point Pinos Lighthouse in Pacific Grove is the oldest continually operating lighthouse on the West Coast. “Monterey County Fun Facts”, Monterey County Convention & Visitors Bureau, 2020
Q2 2026 Statistics Market Update
Monterey & Del Rey Oaks Monterey and Del Rey Oaks posted an outstanding second quarter with 72 sales, the strongest quarterly performance since Q2 2024. Sales volume increased more than 65% over the previous quarter as buyer demand remained strong, despite most transactions occurring below $1.2 million. Homes sold faster than they have in nearly two years, and inventory expanded to 75 active listings heading into summer. Carmel Realty agents continued their strong market presence, representing buyers and sellers across numerous transactions throughout the quarter.
Average Selling Price
$1,273,032 12.7%
5.6%
versus Q1 2026
versus Q2 2025
Average Days on Market
25%
45
versus Q1 2026
6.3%
versus Q2 2025
Sales Volume
$91,658,280 65.5%
versus Q1 2026
15.2%
versus Q2 2025
Units Sold
72
46.9% versus Q1 2026
15 Q2 2026 Market Report
22%
versus Q2 2025
Q2 2026 Quarterly Market Breakdown
Average vs. Median Sales Price
Q2 2026 Sales by Segment
in millions
22%
16 homes
14%
1%
1 home
10 homes
25%
38%
18 homes
27 homes
Q2 2025
Q3 2025
Q4 2025
Average
in millions
Q2 2025
Q3 2026
Q2 2026 < $800k $800k-$1.2m $1.2m–$2m
Median
Total Sales Volume By Quarter
Q1
Q1 2026
Q4
Number of Closed Sales By Quarter
Q1
Q2 2025
Q3
Q4
2026
$2m–$3m
$3m+
Median Sales Price in millions
Q1
Q2 2025
Q3
Q4
2026
Did You Know? Nearly a quarter million tons of sardines were processed on Cannery Row in 1945, the year John Steinbeck’s Cannery Row was published. Cannery Row was previously named Ocean View Avenue but was renamed to honor John Steinbeck’s well-known novel. “Monterey County Fun Facts”, Monterey County Convention & Visitors Bureau, 2020
#1 Locally Owned Brokerage on The Monterey Peninsula As the current market share leaders in Carmel-by-the-Sea and Pebble Beach and leading luxury brokerage for over 110 years, we have consistently delivered outstanding quality and service to our clients. Our handpicked team of agents share our commitment to quality, integrity, and the community. Unmatched experience, local knowledge, and collaboration has allowed our team to achieve the highest average agent production and dominate the market year after year.
Scan the Code to Learn More About Our Agents & Team Members When you work with Carmel Realty Company, you can take comfort in knowing you are working with an authentic expert in Monterey Peninsula real estate.
Best Real Estate Company Carmel Pine Cone 2011-2015, 2017-2022, 2024 & 2025 | Monterey Herald Readers’ Choice Awards 2018-2025 Monterey County Weekly Best Of 2019-2025
Best Brokerage - Monterey/Carmel
Extraordinary Philanthropy Award
Modern Luxury San Francisco
Who’s Who in Luxury Real Estate 2025
Since 1913 | A Cornerstone in Luxury Real Estate for Over One Hundred Years CarmelRealtyCompany.com ■ 831.622.1000 ■ Dolores Street between 7th & 8th, Carmel-by-the-Sea