Carmel-by-the-Sea & Carmel Point ◆ Greater Carmel ◆ Carmel Valley Pebble Beach ◆ Carmel Highlands, Big Sur & South Coast
Q1 2026 Market Overview
As we move through the early months of 2026, the real estate market both nationally and here on the Monterey Peninsula continues to navigate a dynamic and evolving landscape. Ongoing volatility in the financial markets, coupled with uncertainty around interest rates and broader economic policy, has led many buyers and sellers to proceed thoughtfully. Despite these headwinds, our market remains grounded in longterm fundamentals, with many recognizing the enduring value of owning property along this unique and beautiful stretch of coastline. As in years past, we continue to adapt alongside our clients, providing guidance through changing conditions while focusing on long-term opportunity.
The Monterey Peninsula market delivered a strong start to the year. In fact, Q1 2026 marked the best first quarter in the past four years, with 246 total sales, an average sales price of $2.02M, and total sales volume reaching $499M. Across the Peninsula’s premier coastal markets, luxury demand reemerged as a defining theme of the quarter. Carmelby-the-Sea saw a notable increase in high-end transactions, with 35% of all sales closing above $5M, driving a sharp rise in both average price and overall volume. Pebble Beach saw the return of ultra-luxury activity, including two sales above $20M, the first seen in over three years in the area, along with another $10M transaction and several others above $5M. In Carmel Highlands and Big Sur, a limited number of transactions once again produced meaningful pricing strength, reinforcing the enduring appeal of these highly sought-after, low-inventory coastal properties. Together, these markets continue to demonstrate how a relatively small number of high-value transactions can significantly influence overall market performance on the Peninsula.
Greater Carmel also experienced increased sales activity, due to a higher concentration of transactions in communities such as Del Mesa and Hacienda Carmel. In addition, the slower moving inventory in the Carmel Woods neighborhood saw several closures which contributed to longer days on market. Carmel Valley remained steady overall, with consistent transaction volume and a well-distributed mix of sales across price segments, while activity accelerated toward the end of the quarter, positioning the area for a strong spring.
Each of the markets we serve navigates a constant balancing act between supply, demand, and pricing. This makes it essential to have experienced, local, expert representation when buying or selling a home. Please reach out to one of our full-time professional agents should you or any of your friends or family be considering a real estate transaction here on the Monterey Peninsula.
We hope you enjoy the following detailed analytic view of our market.
Market Update
Market Update
Carmel-by-the-Sea & Carmel Point
Carmel-by-the-Sea & Carmel Point
Usanditia ne endem. Es ellictor sitat andendam et quae omnimendamus il ium sapieni mustenis rerat pera et utes corerem nimus et, testrum faccusandus.
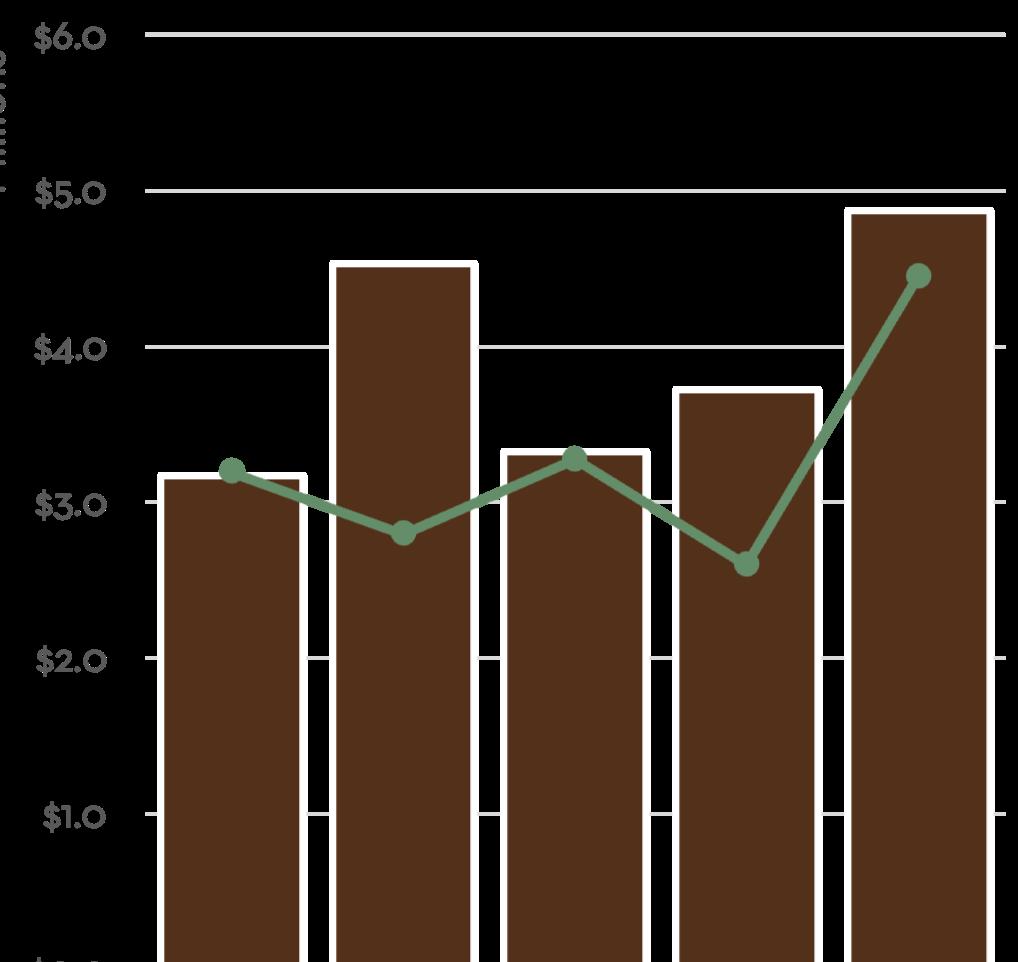
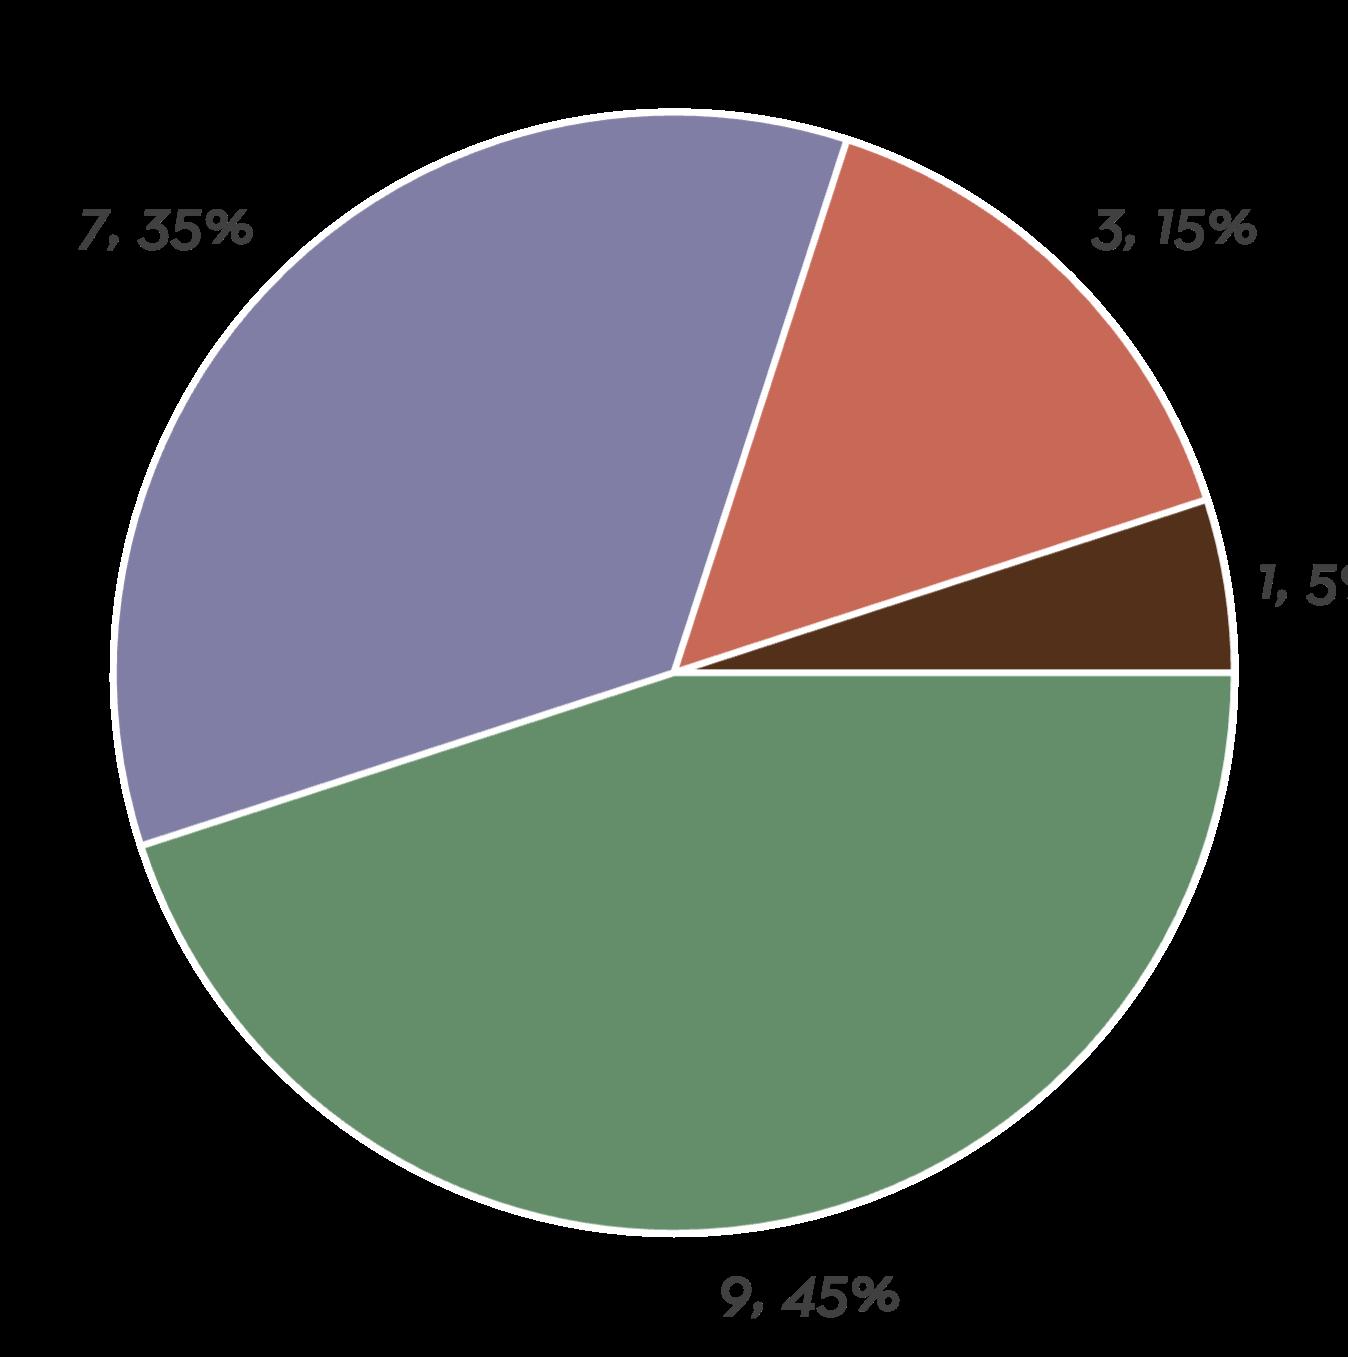
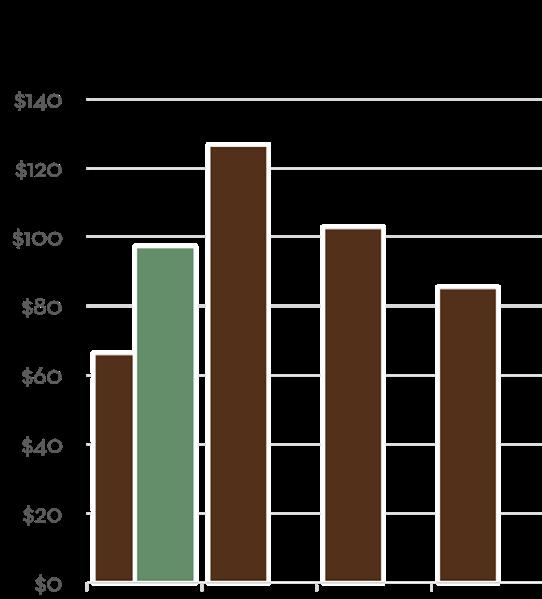
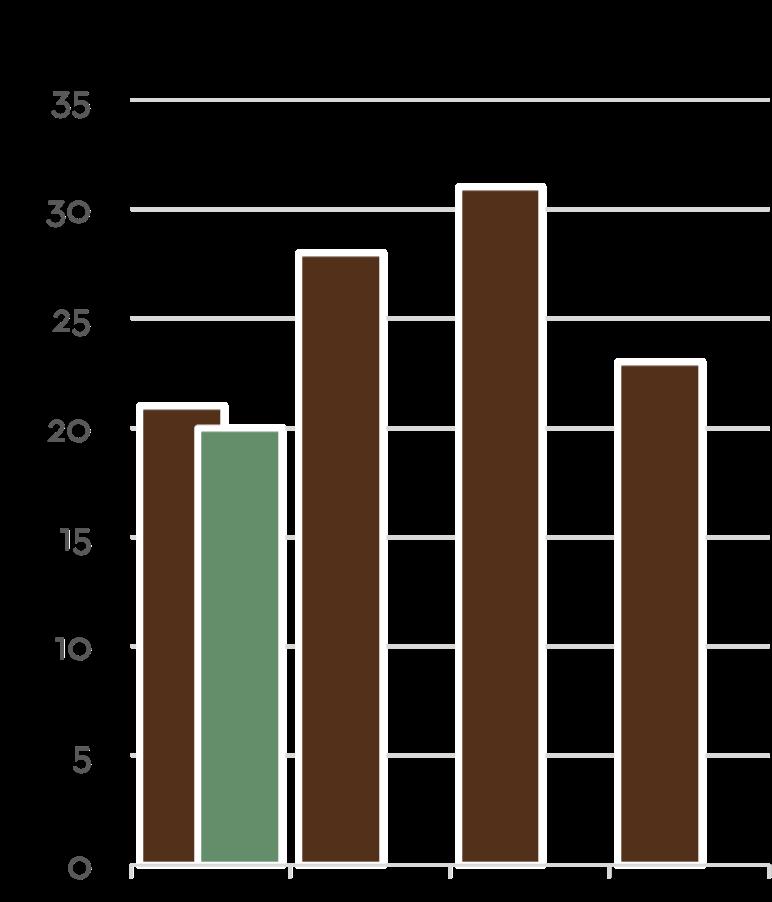
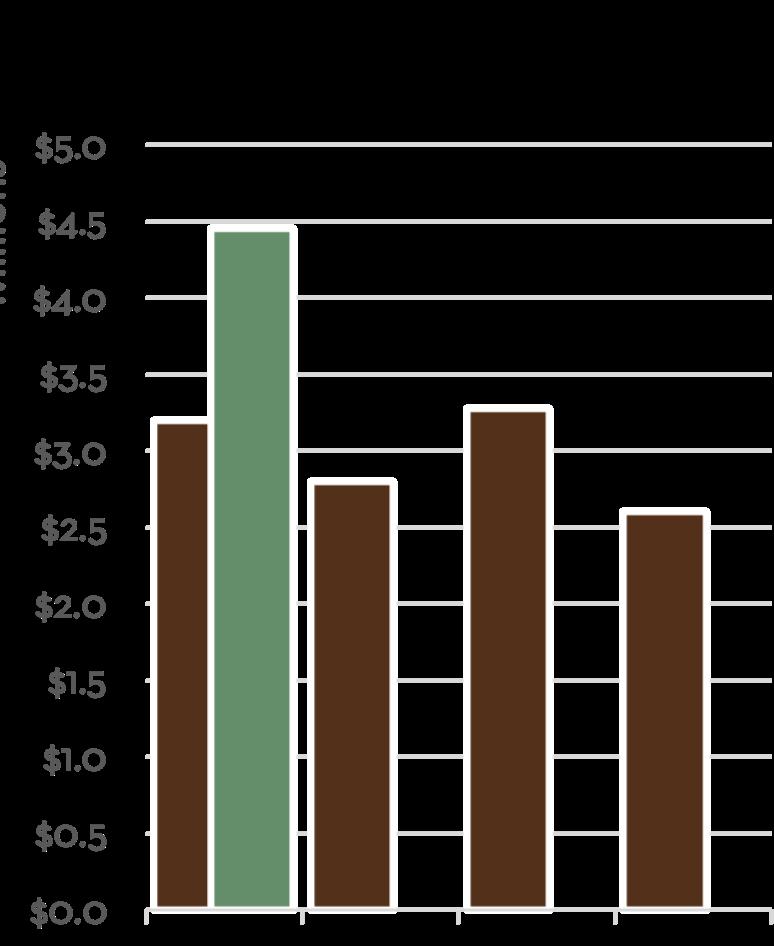
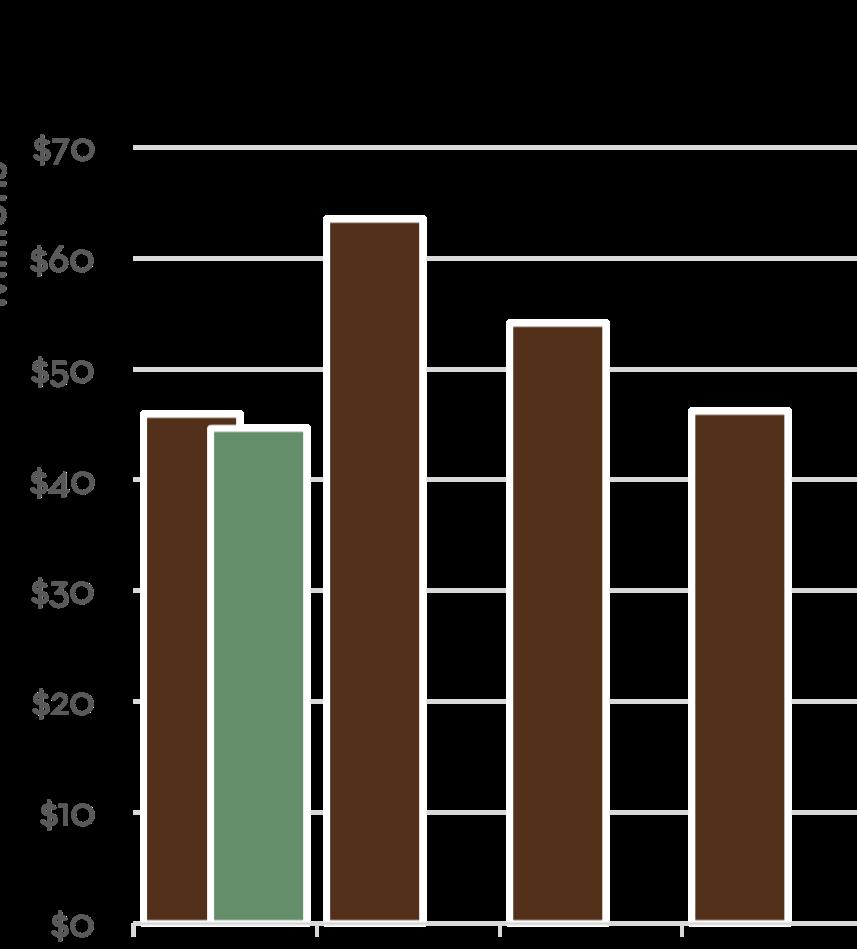
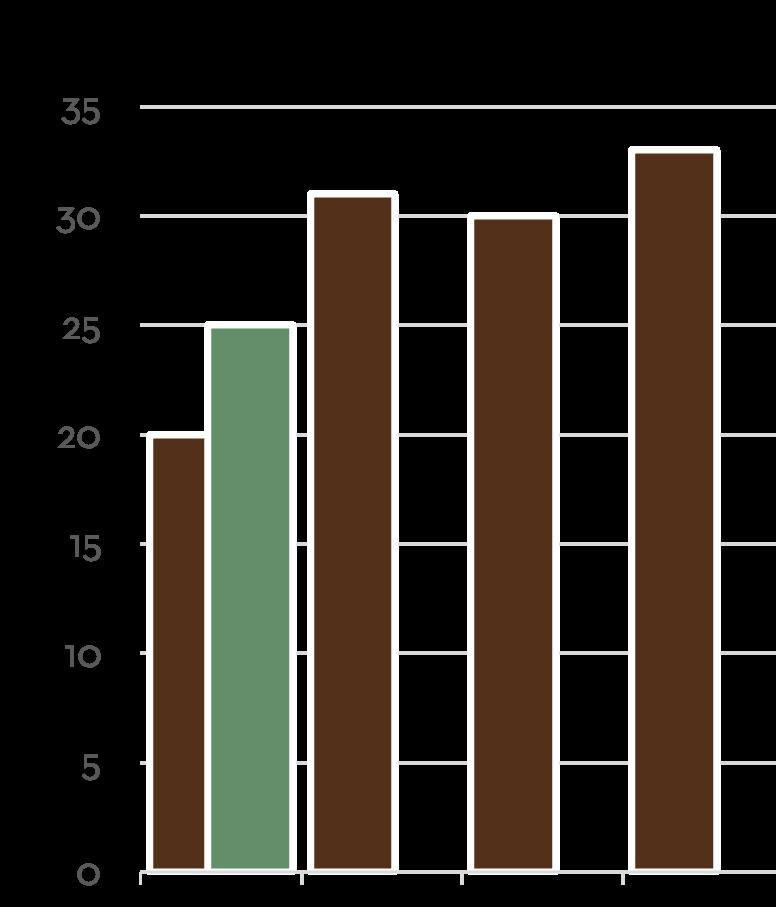
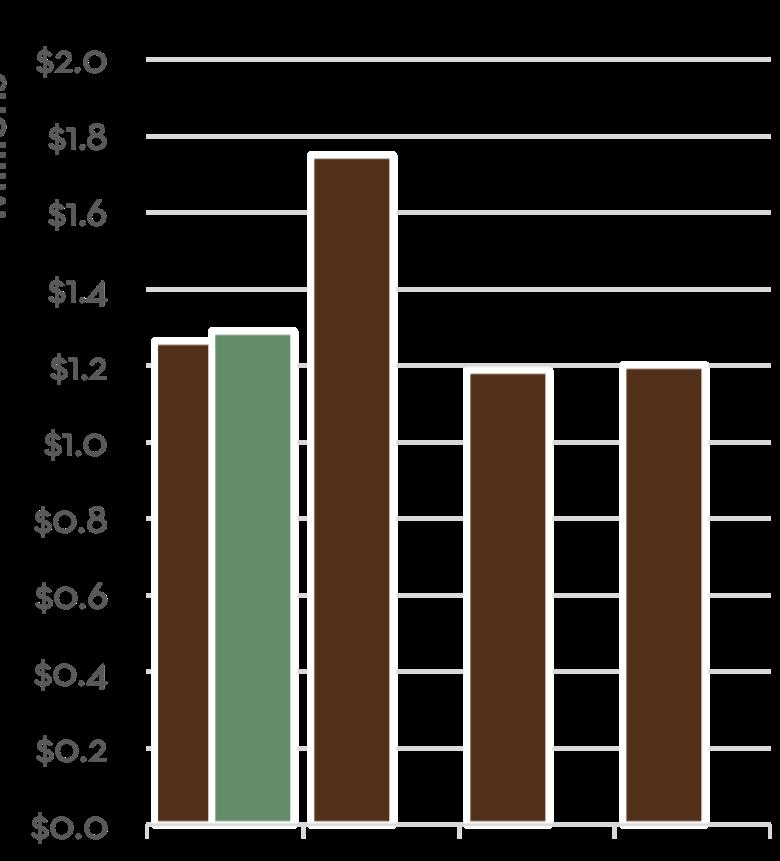
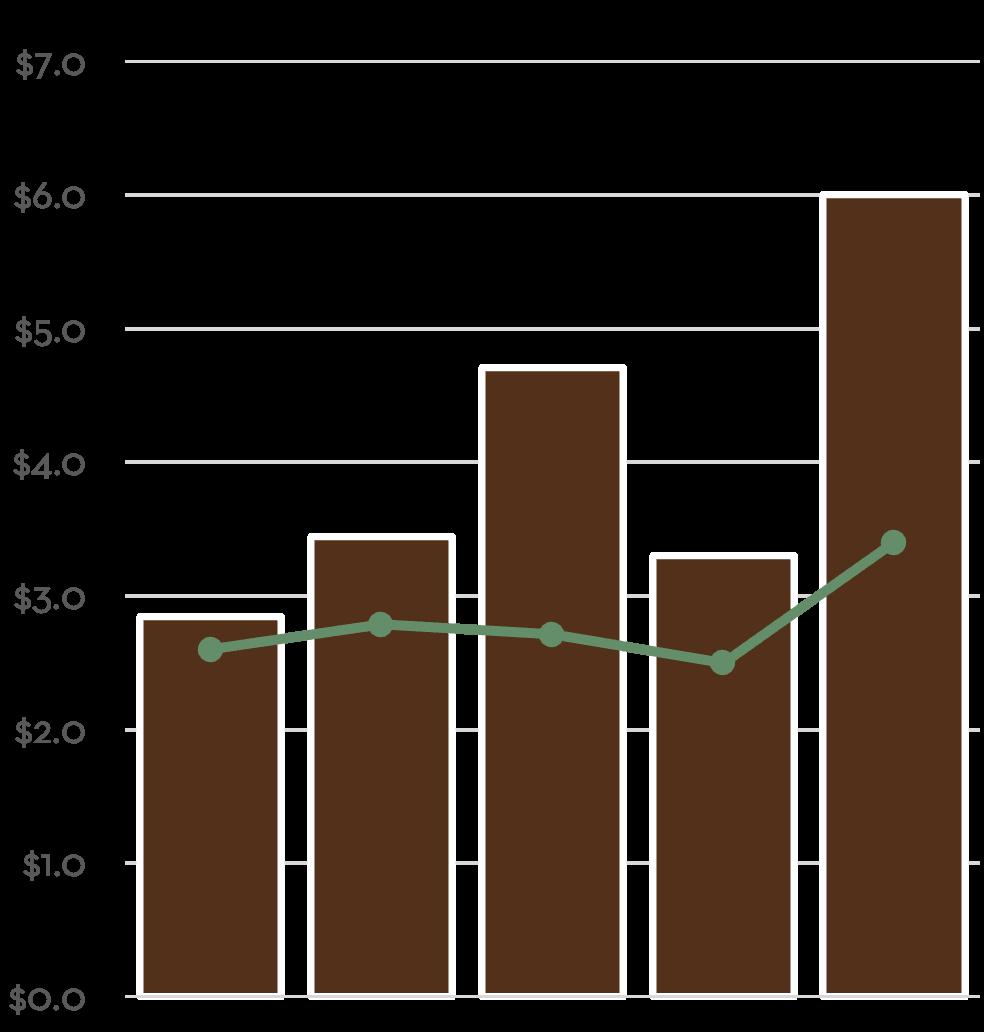
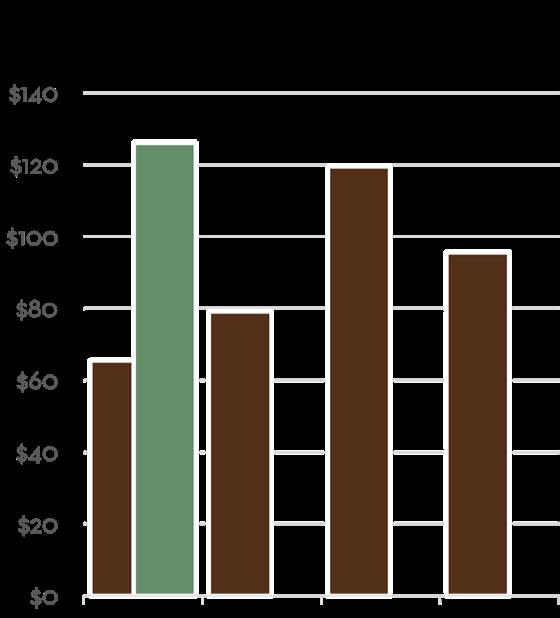
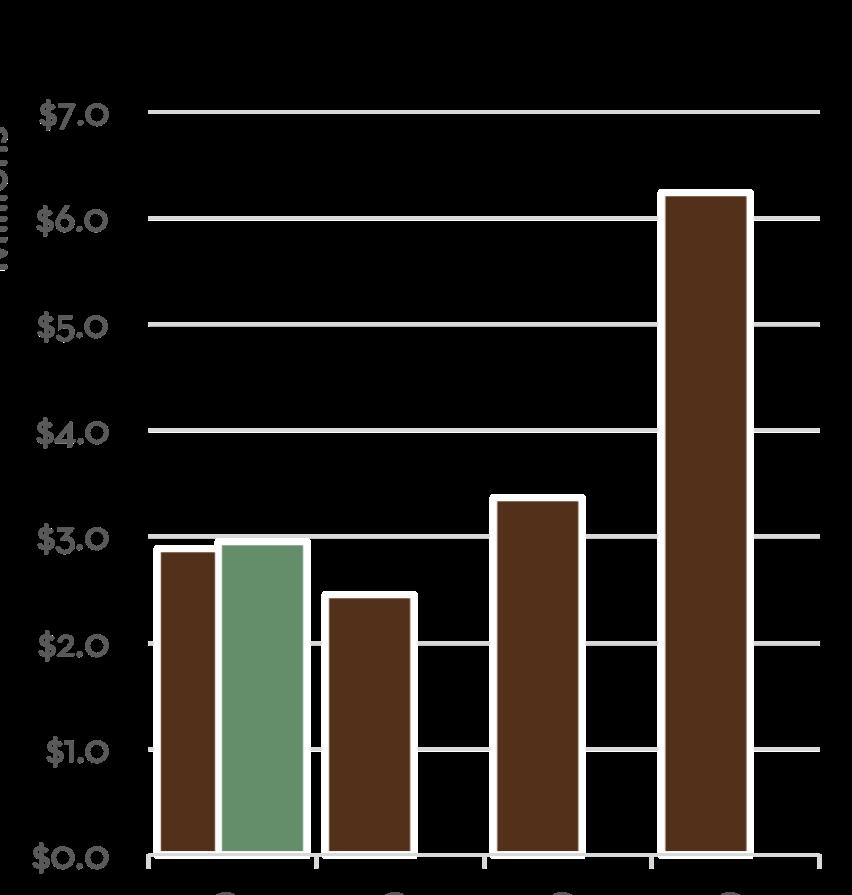
Carmel-by-the-Sea saw a typical start to the year in terms of number of transactions, with 20 home sales closing during the quarter. While the number of sales was par for the course, the average sales price spiked this quarter, totaling $4.86M, which was the highest over the past five quarters. This was thanks to an above average number of $5M+ sales to begin the year. Seven out of the 20 sales (35%) came in over $5M in sale price. As a result, total sales volume was up 46% year-over-year. Carmel Realty Company and partner brokerage Monterey Coast Realty, saw Agents represent clients on at least one side of the five highest priced transactions during Q1. Overall, 13 different Agents in our family of brokerages represented 18 out of 40 total transaction sides (40%) and over 46% of total sales volume in Carmel-by-the-Sea and Carmel Point during Q1 2026. These totals were each over double the nearest competing brokerage.
Tate nonsequi doloris sus natem debis mos earcipsapid quia volum que si acestem unt quos volor mo ma veliquam harum re ne laut accus alic tentis eos a simpos apiet eum fuga. Ut quiae simincit aut omniantiis dem rerehenem ipit quat il ipsum re ni optatur, con necabore magnatur, niae. Omnim debit et occum quidel ius ma diorepeliat vendio enest, con core voloratiam qui officiis dolupiet lignate nisquas quam, corendae magniet officimos mi, que occat minus, ommo cone omnitem volorest eictian destem. At officie nditiore quassita idelit quiam, cuptatati dolorestio volorrovide sitiur as as expeles ratiasperis eaquo
Q1 2026 Quarterly Market Breakdown
Average vs. Median Sales Price in millions
Total Sales Volume By Quarter in millions
Number of Closed Sales By Quarter
Did You Know?
Median Sales Price in millions
Carmel-by-the-Sea is known for attracting various celebrities and artists. Clint Eastwood served as mayor of the village from 1986-1988. Other notable celebrities, artists and writers who have called Carmel home include Doris Day, John Denver, Ansel Adams and Jack London.
“Monterey County Fun Facts”, Monterey County Convention & Visitors Bureau, 2020
Greater Carmel
Carmel Woods, Mission Fields, Hatton Fields, Carmel Hills, High Meadows, Jacks Peak, Carmel Meadows, Carmel Views/ Rancho Rio Vista, Carmel Rancho, Hacienda/Del Mesa
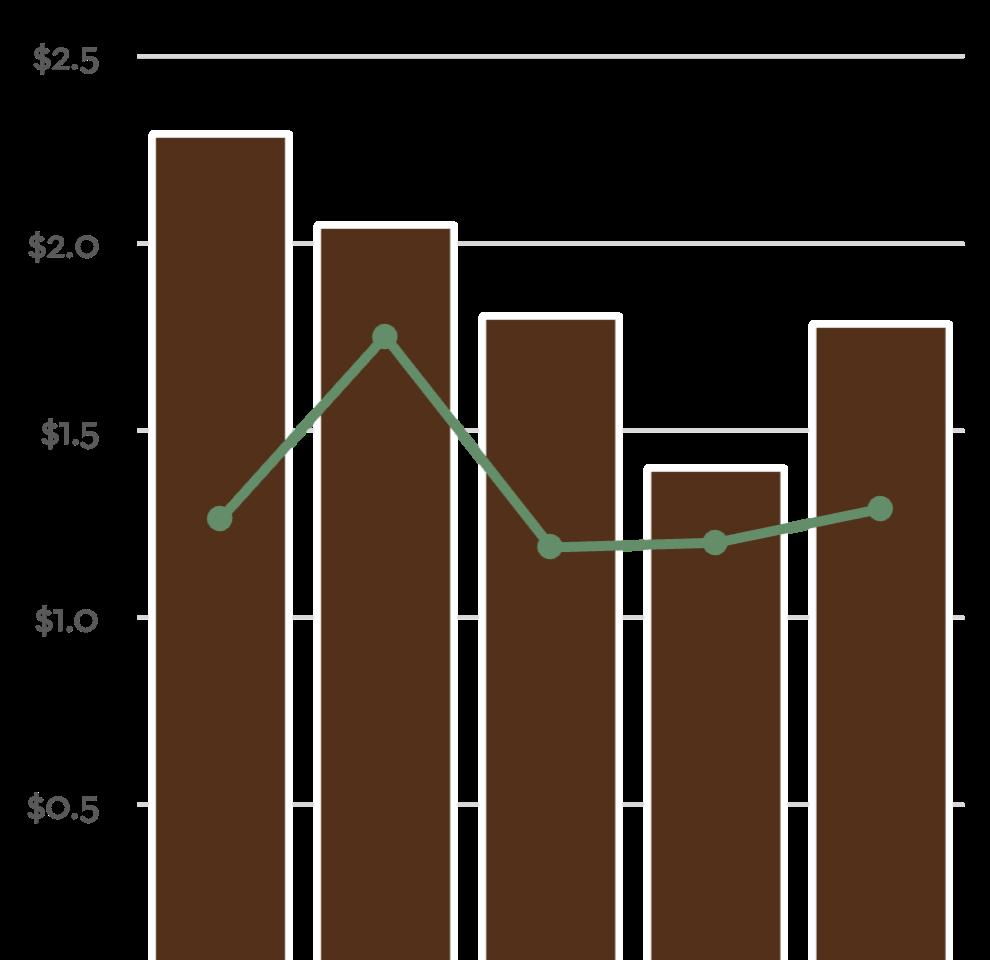
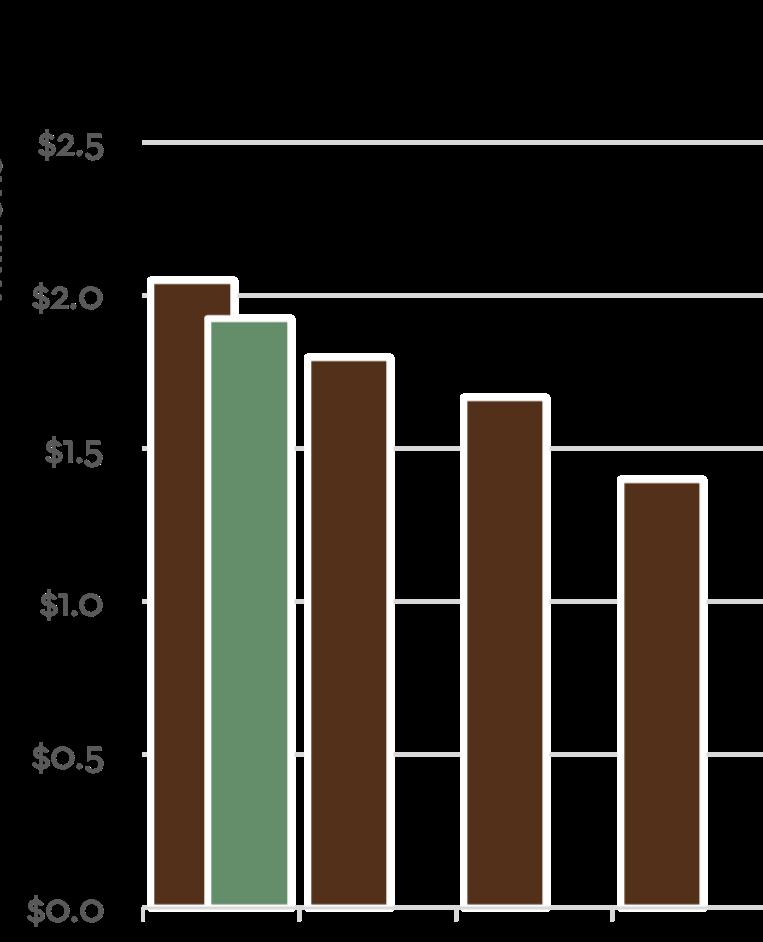
The Greater Carmel area had a nice quarter with 25 sales, after just 20 sales in Q1 last year. Twelve of the 25 sales during the quarter came from Del Mesa or Hacienda Carmel, which brought average sales price down year-over-year, coming in at $1.78M for the quarter. Six additional sales came from the Carmel Woods neighborhood, which was nice to see as the neighborhood was having a slower time selling during 2025. These Carmel Woods sales did contribute to the average days on market during the quarter rising to 80 days, the highest since Q1 2020. Carmel Realty Agents represented clients on five of these six Carmel Woods sales.
Days on Market 80 Average Selling Price $1,785,016
25% versus Q1 2025 versus Q4 2025 24.2% versus Q4 2025 3.3% versus Q1 2025 37.9% versus Q4 2025 70.2% versus Q1 2025 2.7% versus Q4 2025 27.7% versus Q1 2025 22.1%
Q1 2026 Quarterly Market Breakdown
Average vs. Median Sales Price in millions
Total Sales Volume By Quarter in millions
Number of Closed Sales By Quarter
Median Sales Price in millions
Did You Know?
Robert Louis Stevenson modeled Treasure Island’s Spyglass Hill after Point Lobos State Reserve near Carmel. “Monterey County Fun Facts”, Monterey County Convention & Visitors Bureau, 2020
Market Update
Carmel Valley
Including Santa Lucia Preserve
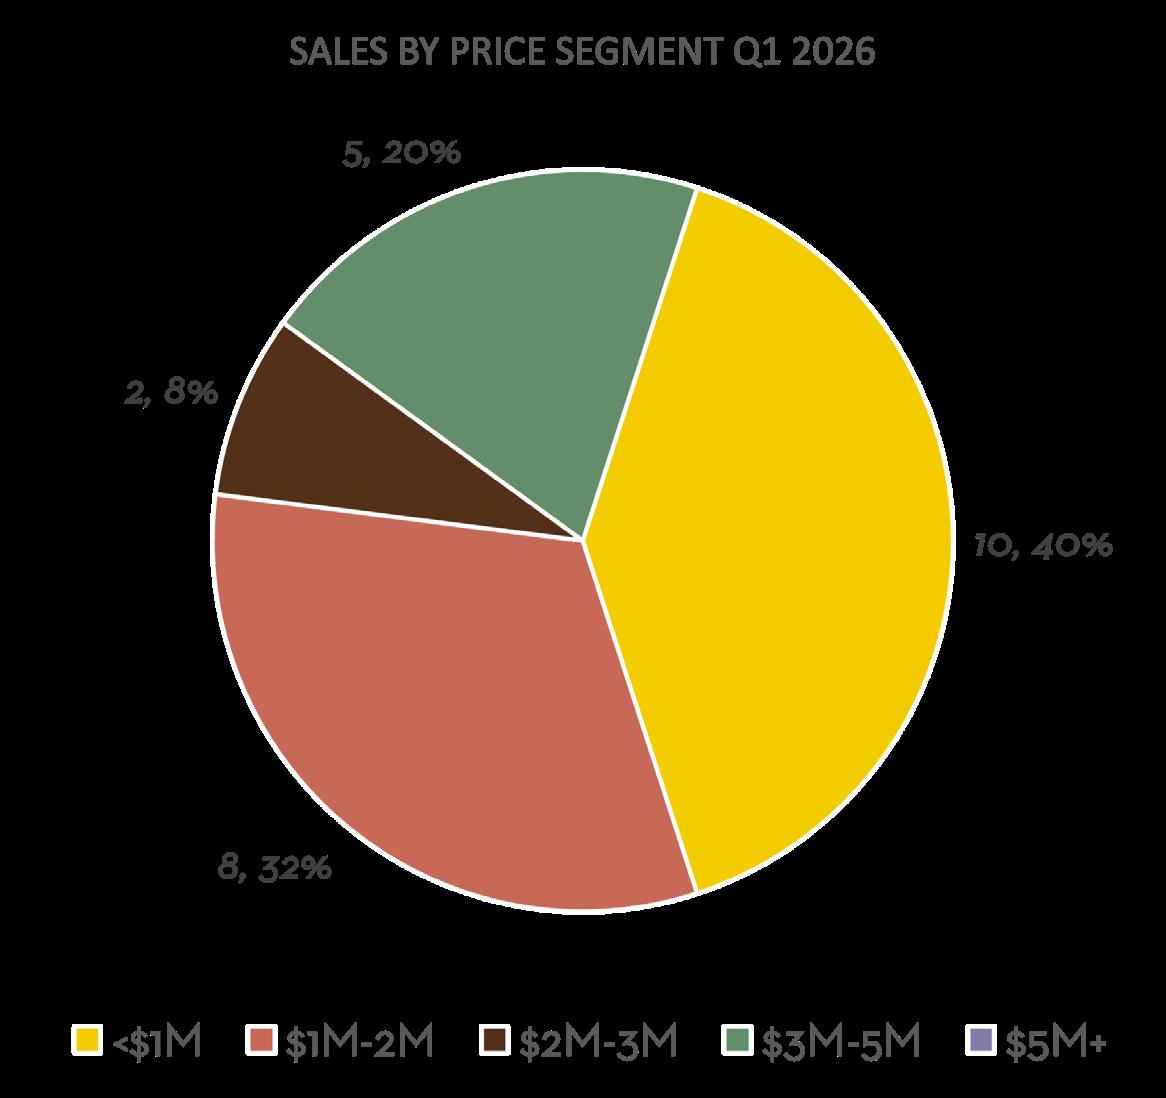
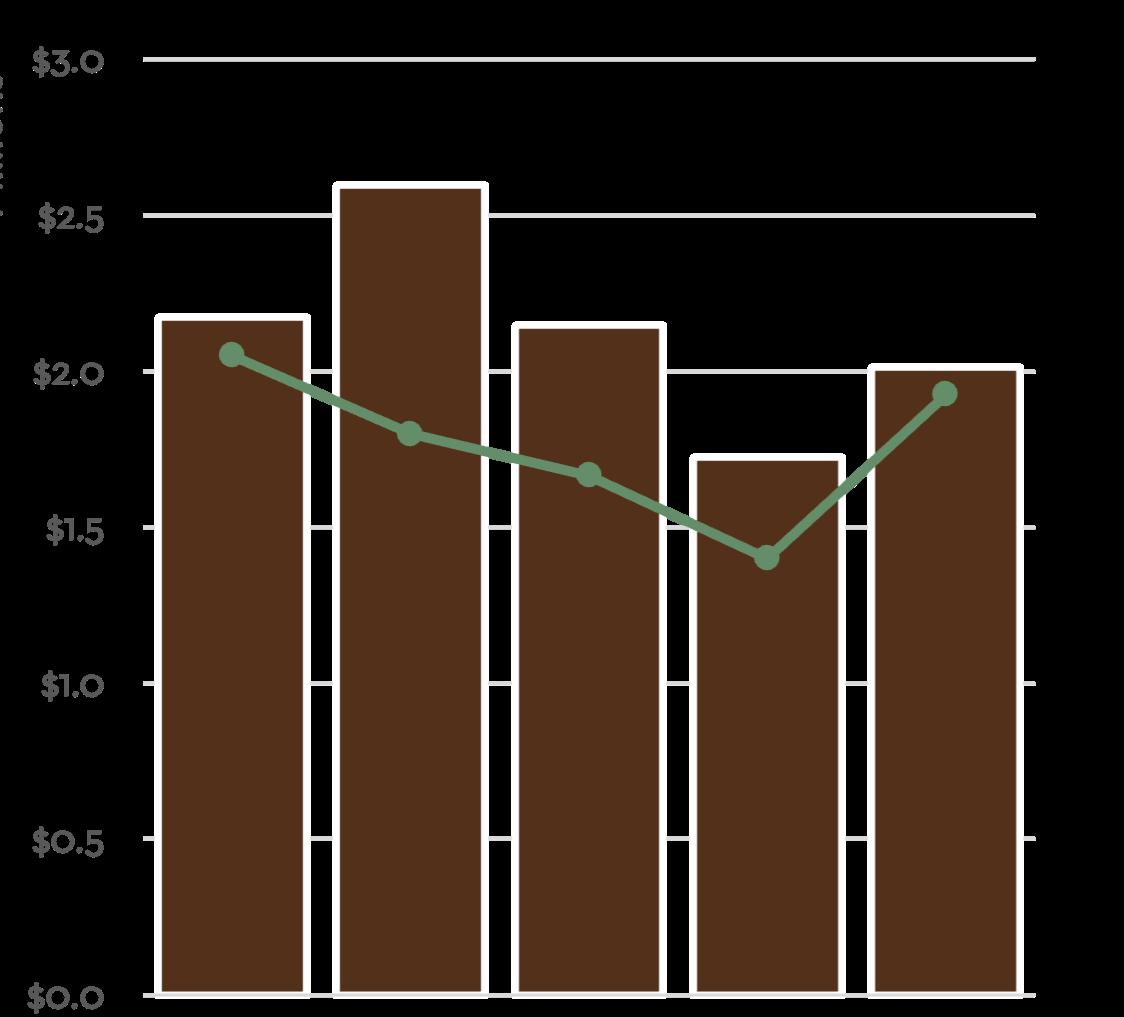
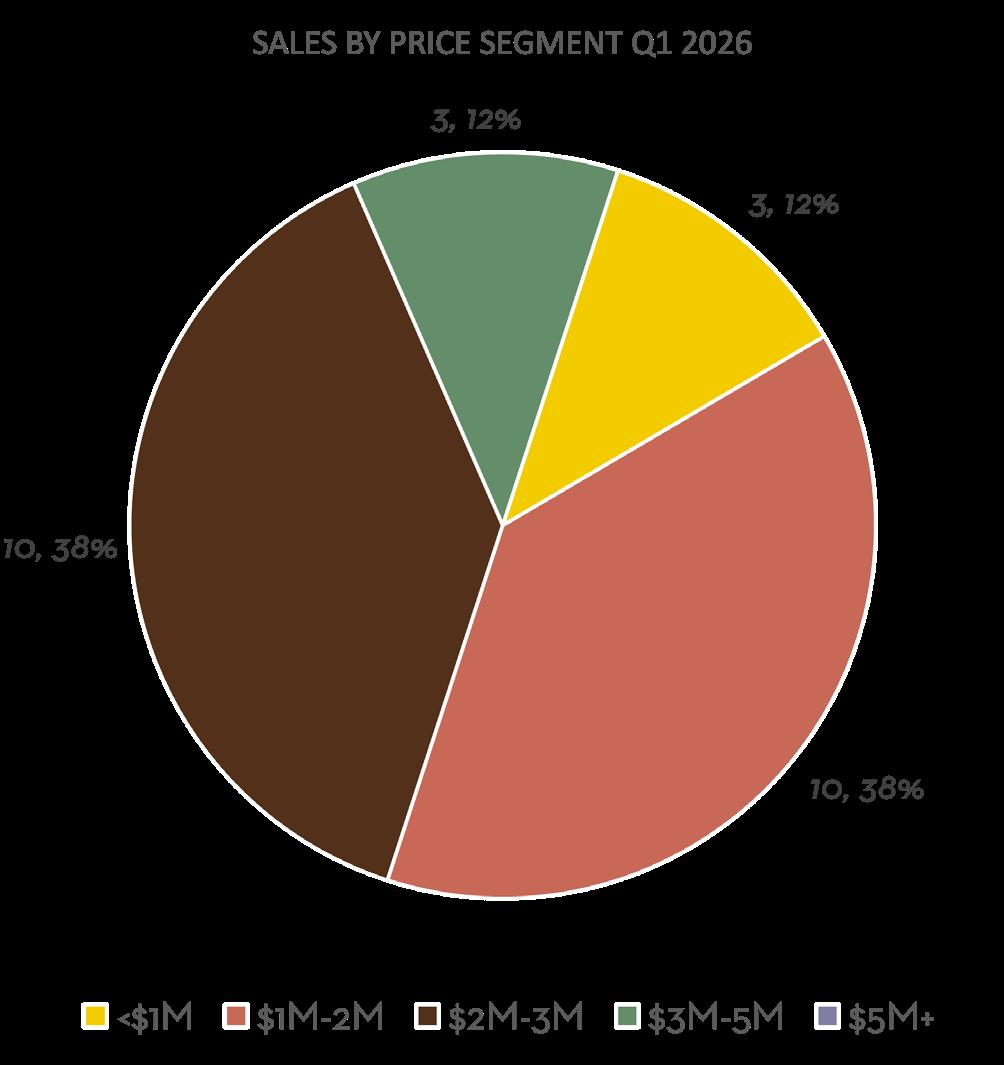
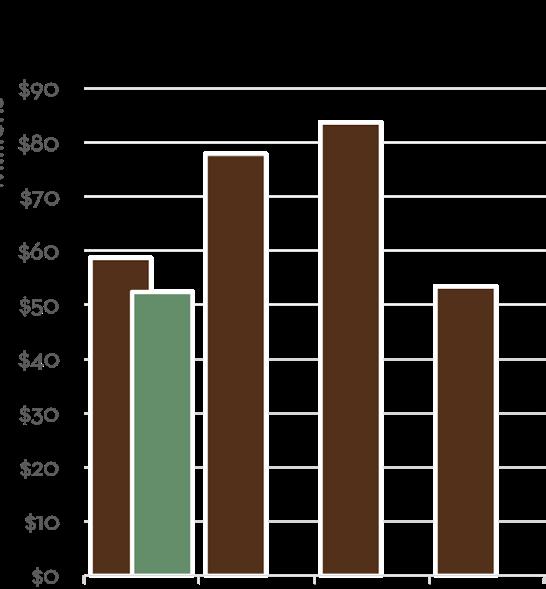
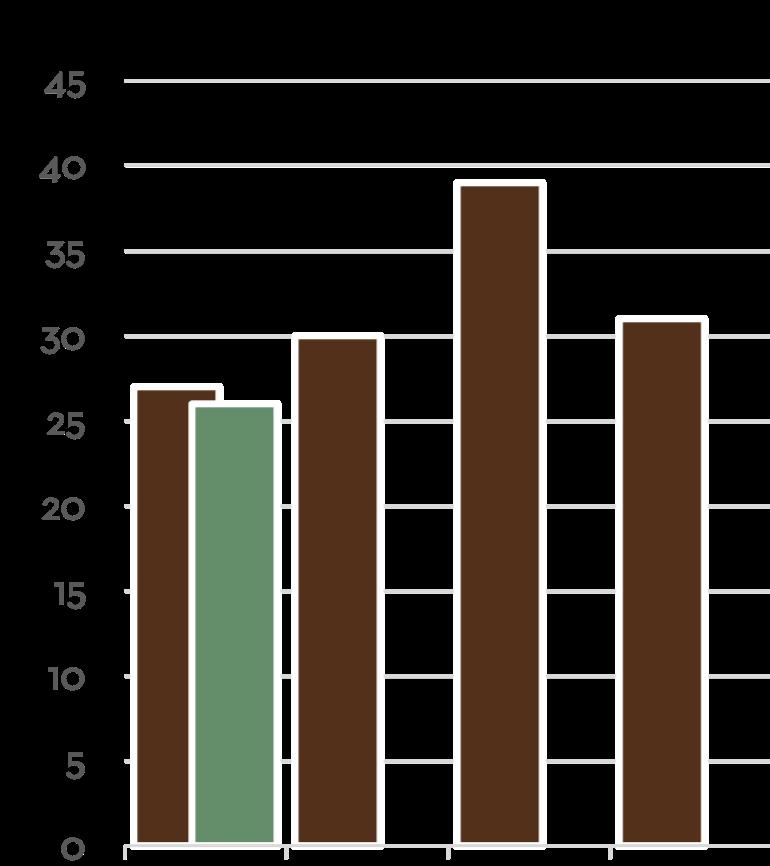
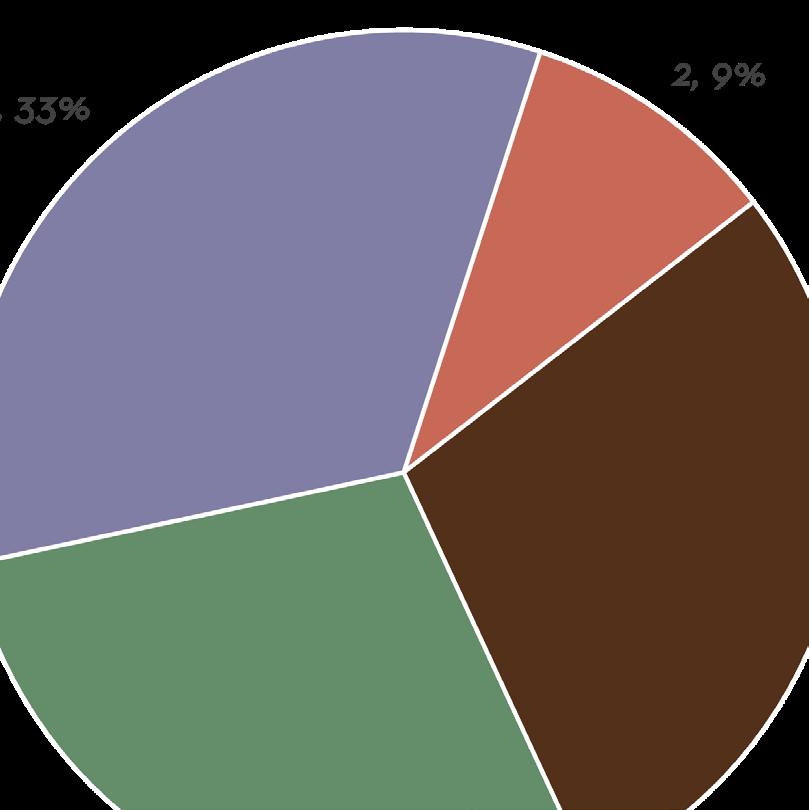
Carmel Valley had an average start to the year with 26 sales during Q1, just one below 2025’s Q1 number. The average sales price just topped $2M for the quarter, up 16.8% from Q4, but down 7.4% from last year’s Q1 average. The average days to sell in this area remains higher than most others across the Peninsula, totaling 90 for Q1, about the same as last year’s average of 94 days. The sales by segment found a balance during Q1 with 10 sales in the $1M-$2M range and 10 sales also in the $2M-$3M range. There were also a balanced 3 sales below $1M and 3 sales above $3M during the quarter. After just 12 closed sales over the first two months of the quarter, March saw 14 sales close in Carmel Valley with another 15 in escrow, showing promise for a nice spring bump moving into Q2.
Average Days on Market
90 Average Selling Price $2,012,852
Units Sold
26 Sales Volume $52,334,150
3.7% versus Q1 2025 versus Q4 2025 16.1% versus Q4 2025 2.1% versus Q1 2025 2.3% versus Q4 2025 34.3% versus Q1 2025 10.8% versus Q1 2025 7.4% versus Q4 2025 16.8%
Q1 2026 Quarterly Market Breakdown
Average vs. Median Sales Price in millions
Total Sales Volume By Quarter in millions
Number of Closed Sales By Quarter
Median Sales Price in millions
Did You Know?
Monterey County has 349 vineyards, 82 bonded wineries and 65 tasting rooms. The wide range of climates allow Monterey County to grow over 30 different wine grape varietals.
“Monterey County Fun Facts”, Monterey County Convention & Visitors Bureau, 2020
Pebble Beach
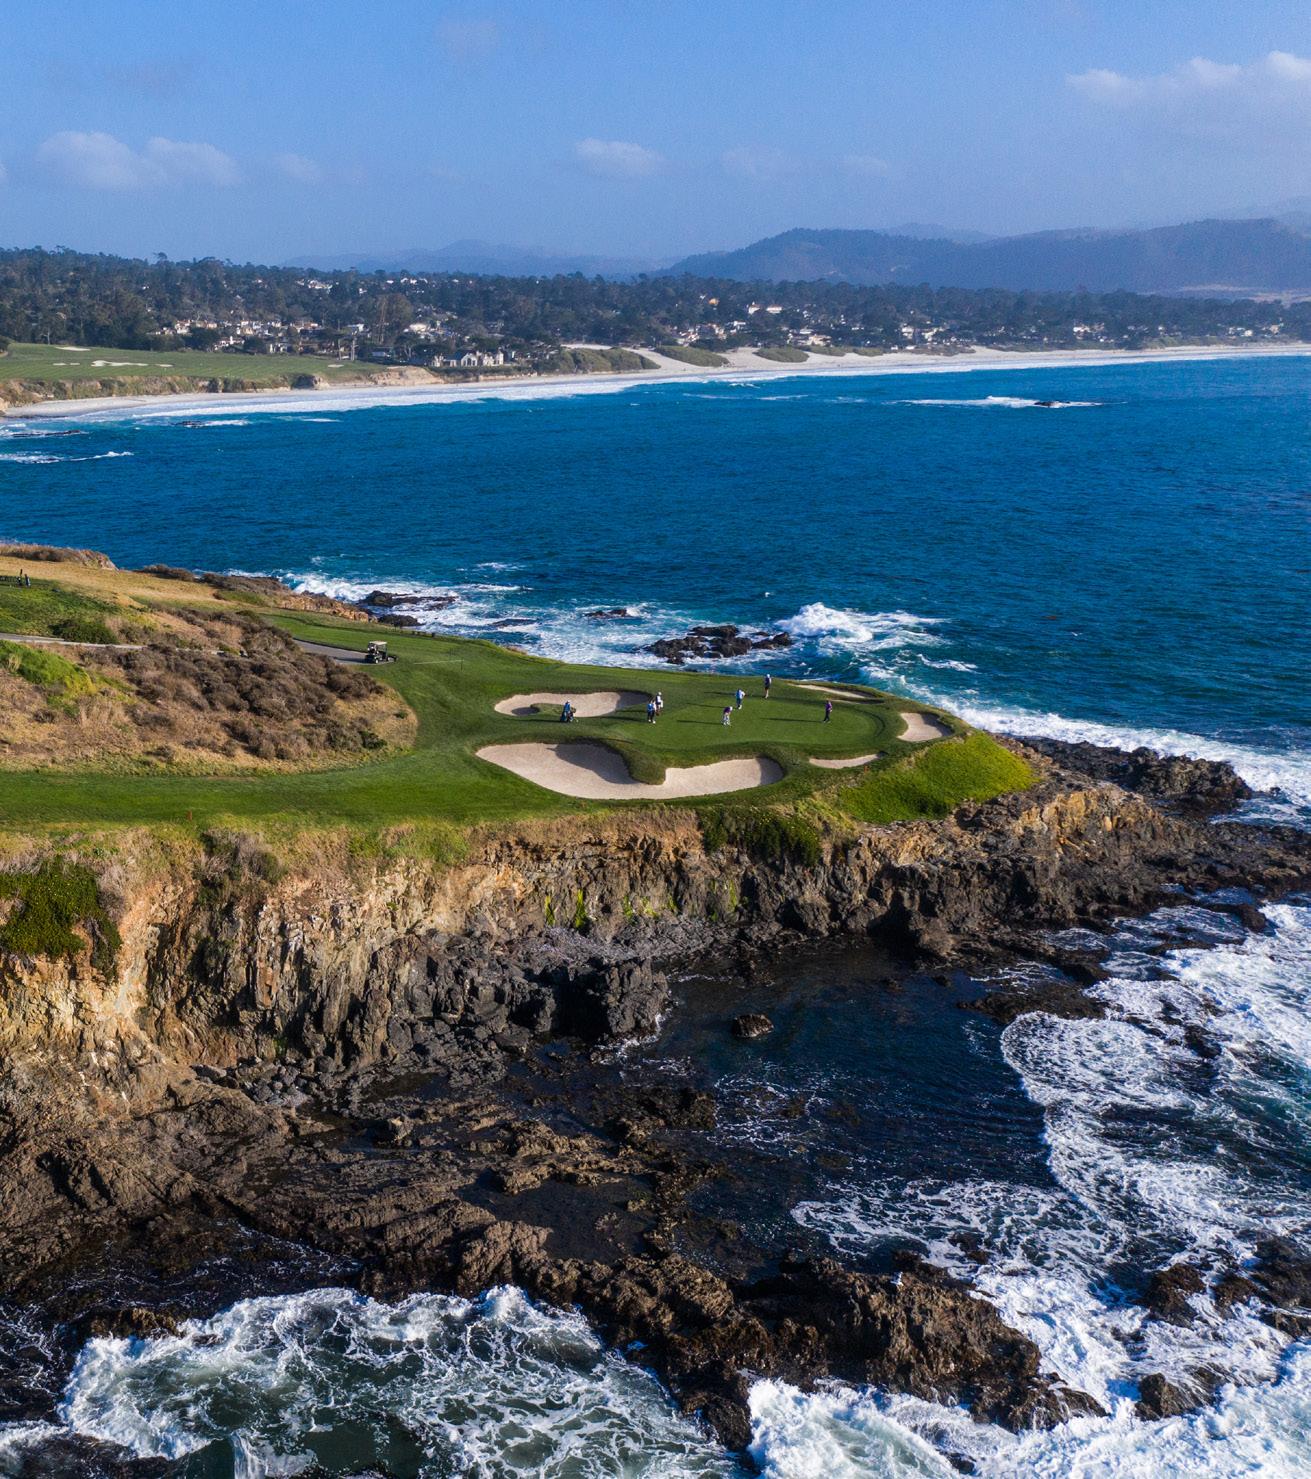
The first quarter of 2026 saw the return of the $20M buyer to Pebble Beach, with two such sales occurring during the quarter, after over three years without a $20M sale (since November 2022). In addition, one other $10M home sold, along with four more sales in the $5M-$9M range. The area saw 21 sales during the quarter, which was lower than any quarter last year, but beat out three of the four quarterly totals during a quiet 2024. Carmel Realty and Monterey Coast dominated the Pebble Beach market, representing at least one transaction side on 15 of the 21 sales during Q1, four of which were double ended. In total our family of brokerages represented 19 out of 42 transaction sides (45%), and 50% of total sales volume during Q1. The average days to sell was high in the area, totaling 84 days during Q1. This number continues to inch back to the 100+ average days we saw in the years leading up to 2020.
$6,004,310
Average Days on Market
84 Average Selling Price
21 Sales Volume
Statistics Units Sold
8.7% versus Q1 2025 versus Q4 2025 27.6% versus Q4 2025 31.8% versus Q4 2025 no change versus Q1 2025 58.5% versus Q1 2025 92.7% versus Q1 2025 111% versus Q4 2025 82%
$126,090,500
Q1 2026 Quarterly Market Breakdown
Quarter
Number of Closed Sales By Quarter
“Monterey County Fun Facts”, Monterey County Convention & Visitors Bureau, 2020 Did You Know?
17-Mile Drive through Pebble Beach is one of only nine private toll roads in the country, and the only one west of the Mississippi.
Carmel Highlands, Big Sur & South Coast
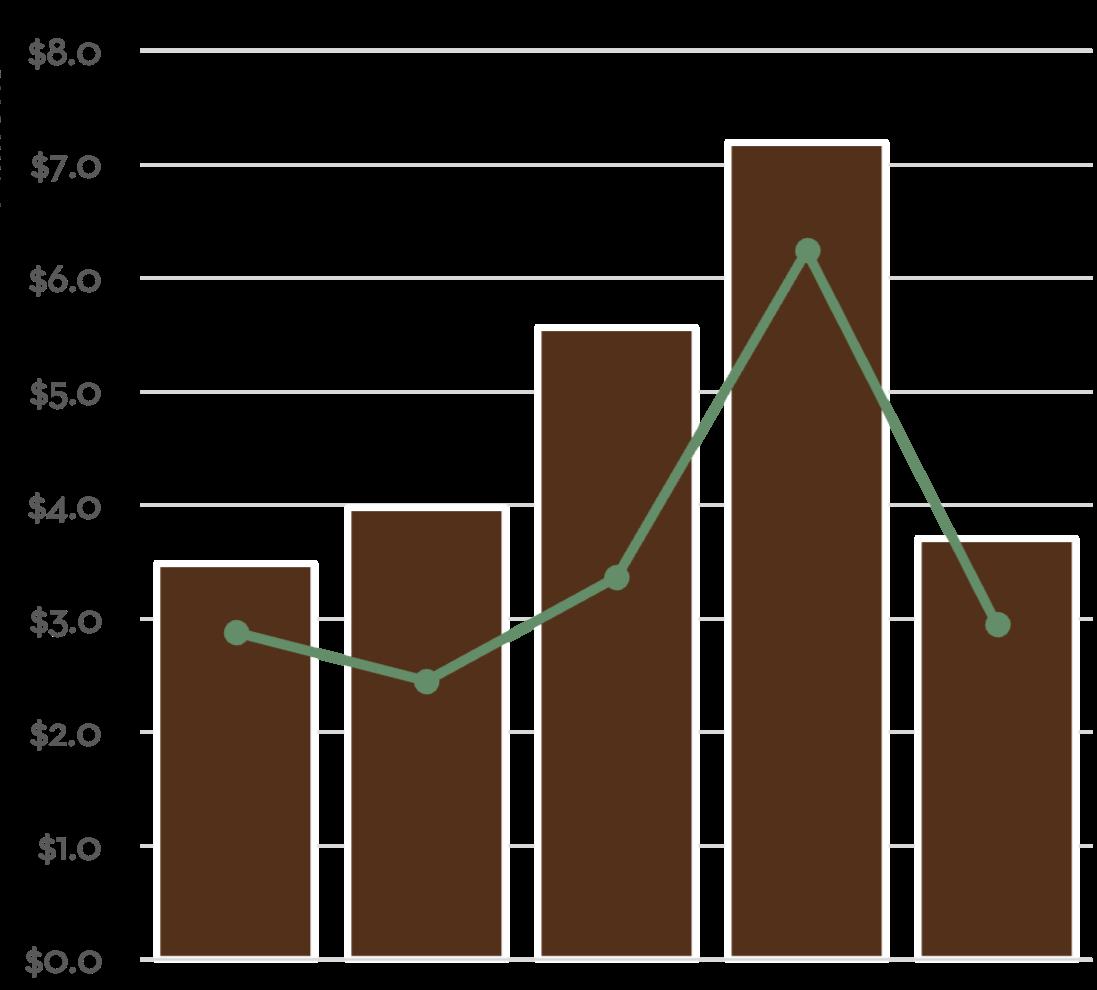
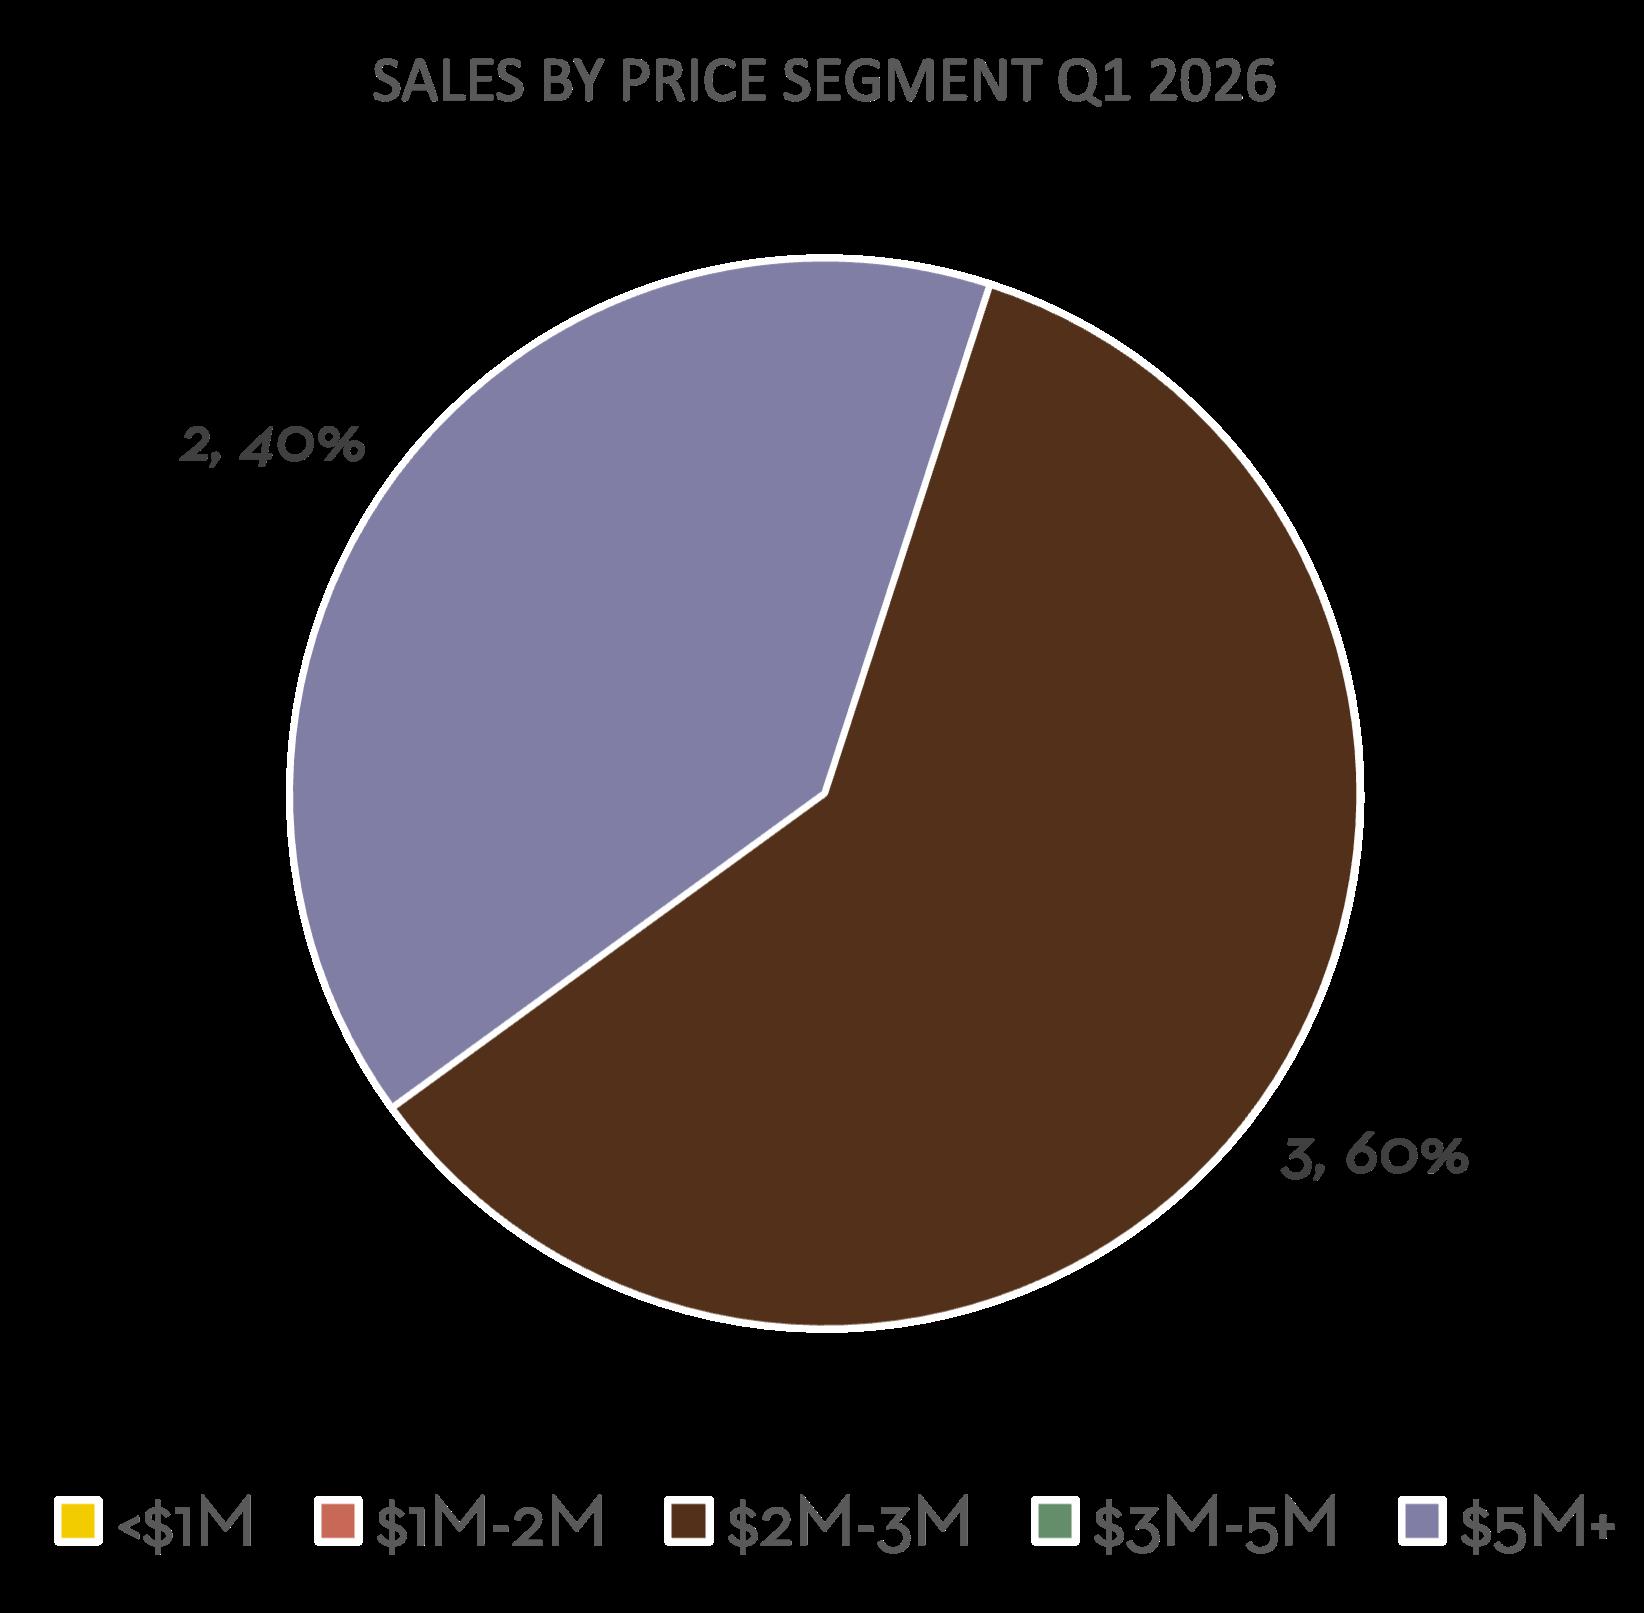
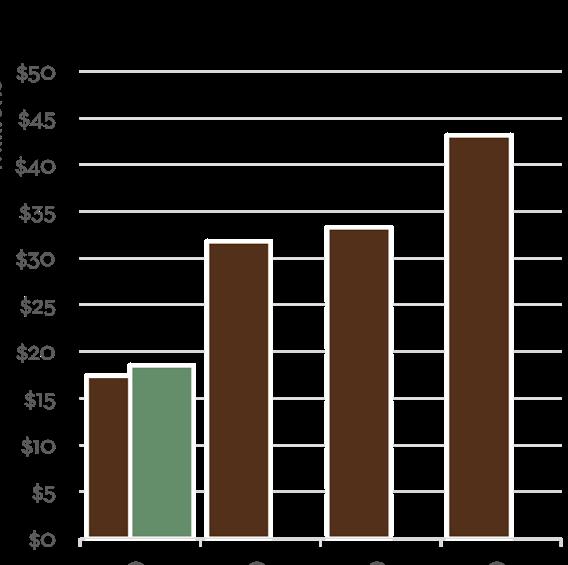
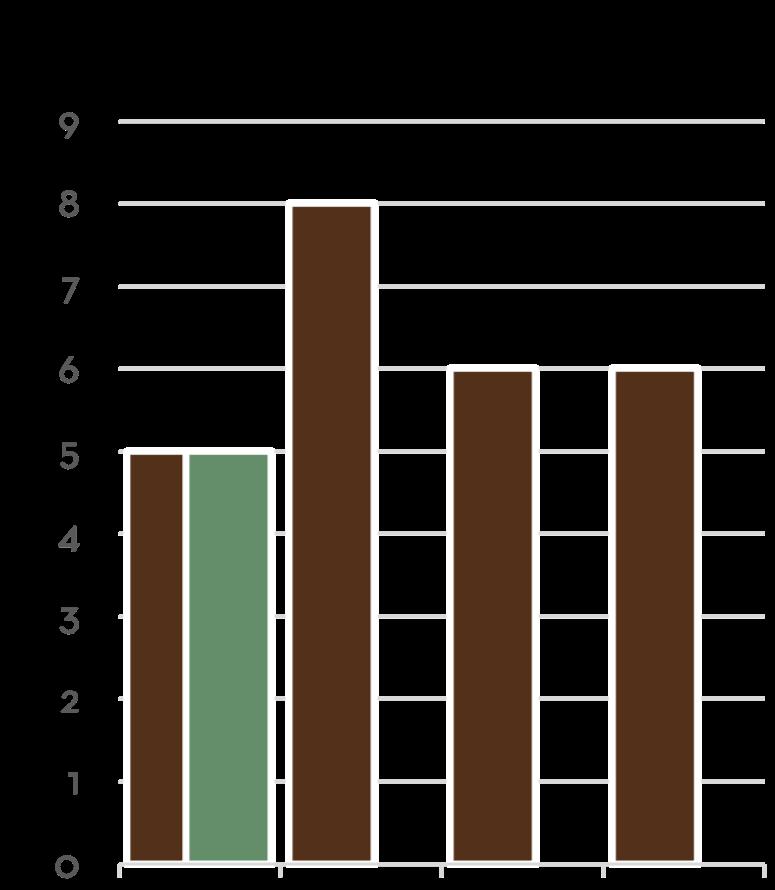
The Carmel Highlands and Big Sur area saw five sales during Q1 2026, the same as the previous year’s total. Four of these sales occurred in Carmel Highlands with the fifth taking place down the Big Sur Coast near Notley’s Landing. The average sales price for the quarter was $3.7M, up 6.3% year-over-year. Three sales occurred in the $2M-$3M range, with the other two falling between $5M-$5.5M. With 23 active listings, there is a good amount of inventory for this low transaction volume area. Our family of brokerages was pleased to represent both sides of two of the five sales during the quarter, each taking place in the Carmel Highlands.
Average Selling Price $3,703,000
versus Q1 2025 6.3% versus Q4 2025 48.5%
Average Days on Market
127
versus Q1 2025 2.4% versus Q4 2025
$18,515,000
versus Q1 2025 6.3% versus Q4 2025
Units Sold
5 Sales Volume
no change
versus Q1 2025 versus Q4 2025
Q1 2026 Quarterly Market Breakdown
Average vs. Median Sales Price in millions
2 homes 3 homes
Total Sales Volume By Quarter in millions
Number of Closed Sales By Quarter
Median Sales Price in millions
Did You Know?
Local settings from around the Monterey Peninsula have provided the backdrops for more than 180 films and television shows. You’ll recognize many scenes in HBO’s award winning mini-series Big Little Lies in Big Sur and the Carmel Highlands.
“Monterey County Fun Facts”, Monterey County Convention & Visitors Bureau, 2020