SEDAR 91 Puerto Rico
CFMC SSC Meeting
April 8, 2026


CFMC SSC Meeting
April 8, 2026
● Background
● S57 Assessment Approach
● S91 Assessment Approach
● S91 Sources of data
● Data & Life History Overview
● S91 Models
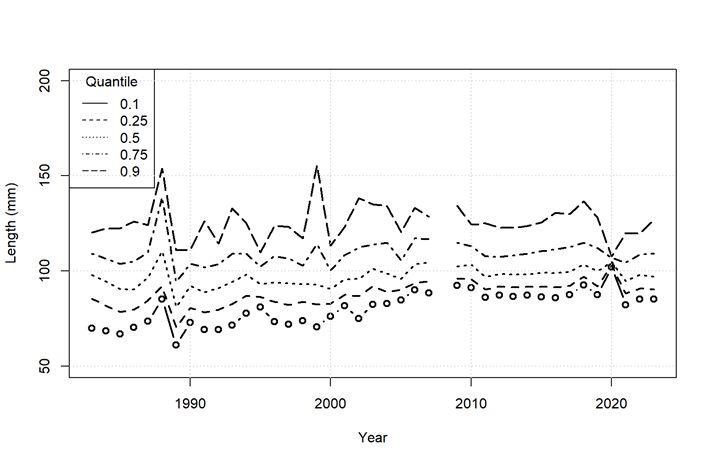
● Quantile Analysis
● Figures
● SSC Discussion and Next Steps
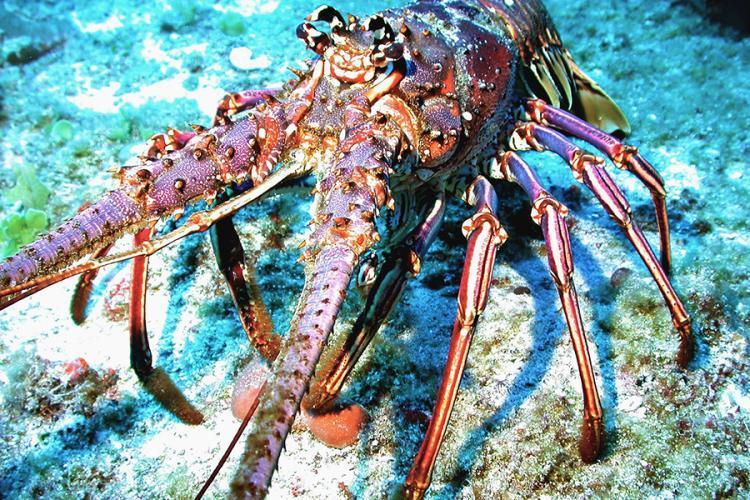
● SEDAR 91 addressed the stock assessment for US Caribbean Spiny Lobster.
● The process consisted of an in-person Data Workshop, with several webinars before and after the workshop and a series of assessment webinars.
● The Stock Assessment Report (SAR) for US Caribbean Spiny Lobster – Puerto Rico was disseminated to the public in September 2025.
● The SSCs are tasked with recommending whether the assessments represent Best Available Science, whether the results are useful for providing management advice and developing fishing level recommendations.
● SEDAR 57 (S57) was the first application of Stock Synthesis (SS3) in the US Caribbean (2019).
● The Puerto Rico assessment models developed during S57 were fit to catch time series and length composition information from dive and pot/trap fisheries using a data-limited to moderate implementation of SS3.
● S57 resulted in a satisfactory determination for providing management advice.
● A data-only update was conducted though 2022 to provide OFLs and ABCs through 2023-2025.
● Iterate on existing SEDAR 57 (S57), SEDAR57 Update (S57U) length-based statistical catch at age models using SS3 through 2023
● SS3 was implemented as a length-based statistical catch-at-age model. Forward-projecting, age-structured population dynamics model that is fit to landings (removals), length composition data, and indices of abundance.
● Landings from self-reported fisher logbooks
● Length compositions from shore-based port sampling
● Life history parameters carried over from SEDAR 57
● (New) length compositions obtained from SEAMAP-C dive surveys conducted off of the Southwest Puerto Rico coast during 2021-2023
● (New) length compositions obtained from an HJR Reefscaping lobster trap survey conducted throughout Puerto Rico coastal waters during 2021-2022
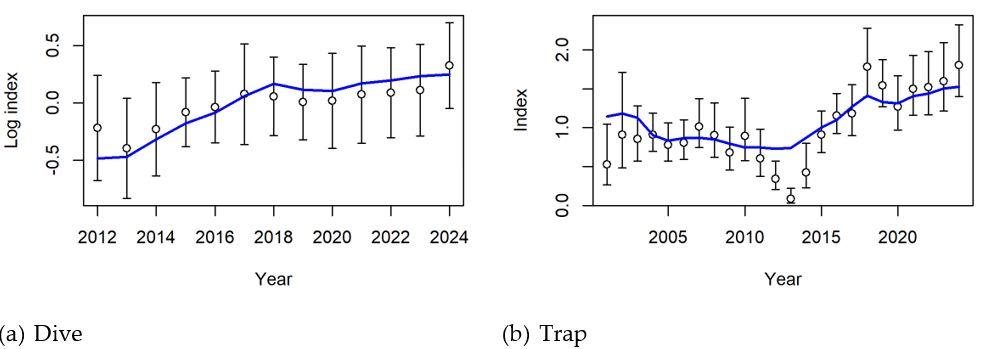
● (New) Fishery-dependent indices of abundance from fisher logbooks
● Landings: lognormal error
● Composition: multinomial error
● No indices of relative abundance *Indices included for S91 sensitivity run
● Two-sex model; 50-50 sex ratio
● Island-specific length-weight relationships
● Growth parameters estimated using VBGF
● M = 0.34, used for all age classes
● Fecundity relationships based on relationship from SW Cuba (SEDAR 8), maturity parameters derived by Die (2005)
● No recreational fishing ~ recreational fishing constant, ignored
● Release (discard) mortality ignored due to selective nature of trap/pot and dive fisheries
● Age structure: 0 to 15+
● Size bins: 51mm – 248mm (2 – 9.8 inches)
● One area models; single spawning population and associated stock recruitment function (Beverton-Holt)
*S57 and S57U steepness (h) = 0.95; S91 h = 0.99
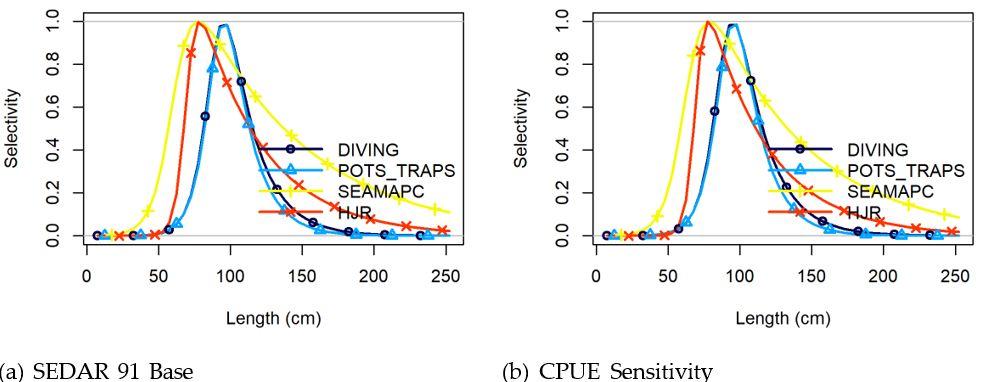
● Length-based selectivity and retention for primary fleets
● Complete catch history; assumed commercial landings known, precisely
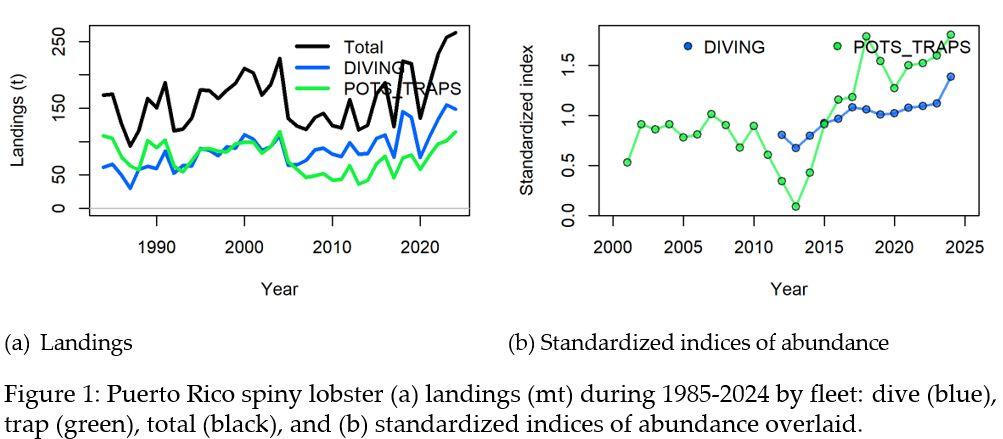
● Catches have increased in recent years, but PR Department of Natural and Environmental Resources have reported evidence of high abundance (Matos-Caraballo et al. 2024).
Initial init S57 parameters unchanged + data through 2023 and start year changed to 1985
2initf init + initial fishing mortality estimated for each fleet
seamapc 2initf + SEAMAP-C data fit with exponential logistic selectivity parameters
hjr seamapc + HJR data fit with exponential logistic selectivity parameters
S91 Base new_eq hjr + equilibrium initial catches for each fleet based on likelihood profiles
selex1 new_eq + dive fishery is initialized with logistic selectivity pattern; only estimating 1st limb
selex2 new_eq + dive fishery is initialized with logistic selectivity pattern; 3 estimated parameters
steep new_eq + steepness fixed to 0.8
combsex new_eq + male growth and L-W for females to approximate a single male sex model
Sensitivity
lw new_eq + US Caribbean region length-weight parameters
eq_hi hjr + equilibrium initial catches for each fleet based on likelihood profile highest values
eq_lo hjr + equilibrium initial catches for each fleet based on likelihood profile lowest values
eq_cv_hi new_eq + 0.3 initial catch CV
indices new_eq + fishery-independent indices of abundance
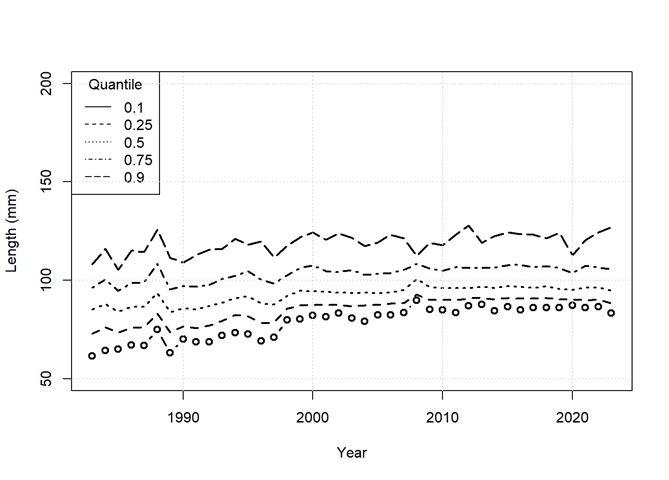
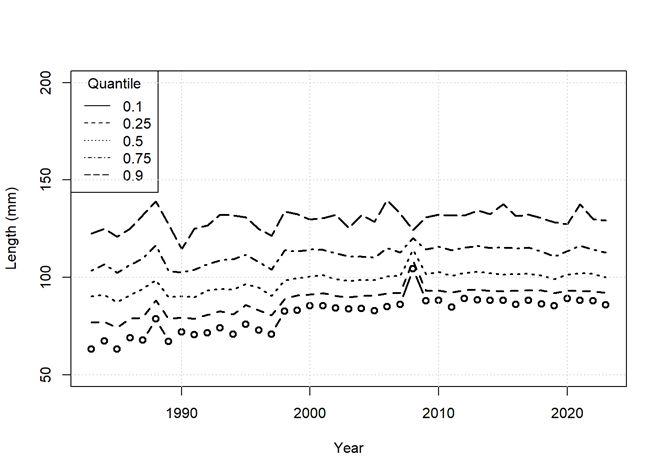
Median 10th, 25th, 50th, 75th, and 90th quantiles of length composition data (mm)for Puerto Rico spiny lobster in the dive fleet. Females (left) & Males (right).
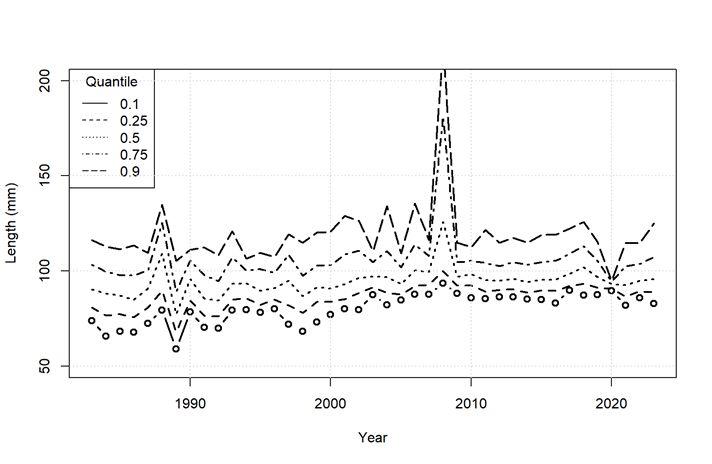
Median 10th, 25th, 50th, 75th, and 90th quantiles of length composition data (mm) for Puerto Rico spiny lobster in the trap fleet. Females (left) & Males (right).
Puerto Rico spiny lobster (a) landings (mt) during 1985-2024 by fleet: dive (blue), trap (green), total (black), and (b) standardized indices of abundance overlaid.
Puerto Rico spiny lobster observed (open circles) and predicted indices of relative abundance (blue) and 95% uncertainty interval standard errors bars for the CPUE sensitivity model scenario based on the model assumption of lognormal error.
Puerto spiny lobster selectivity by model scenario and by fleet for the S91 base and CPUE sensitivity model scenarios: dive (dark blue), pot/trap (light blue), SEAMAPC (yellow), and HJR Reefscaping (red).
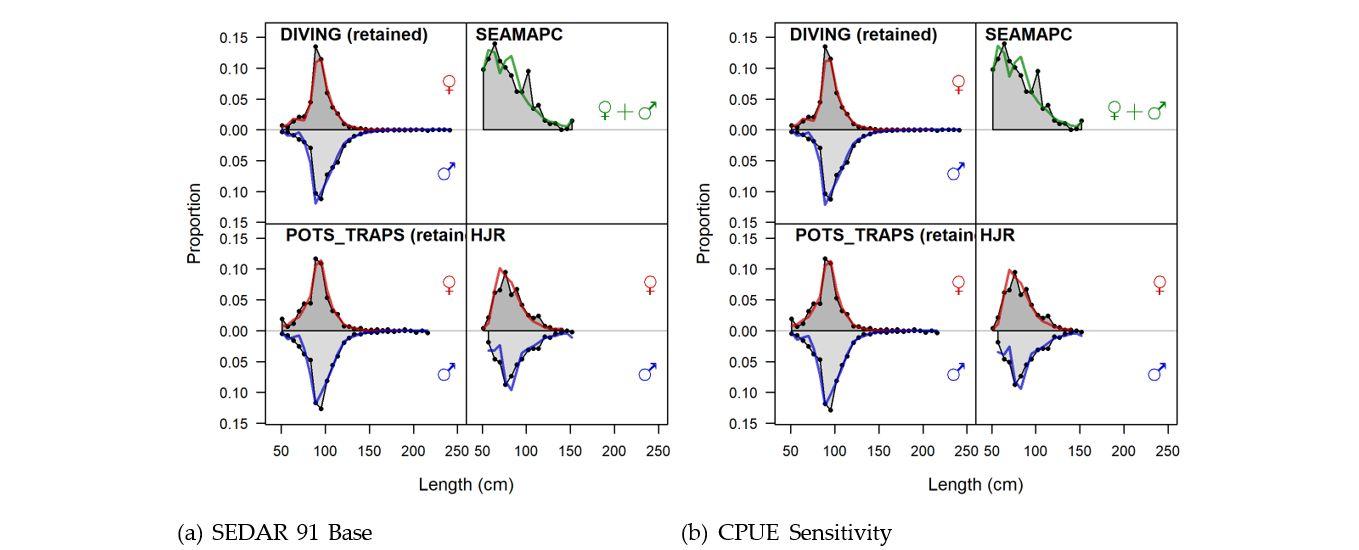
Puerto Rico spiny lobster observed and predicted length distributions in millimeters for the S91 base and CPUE sensitivity model scenarios. Red and blue solid lines represent predicted length compositions, while gray regions represent observed length compositions.
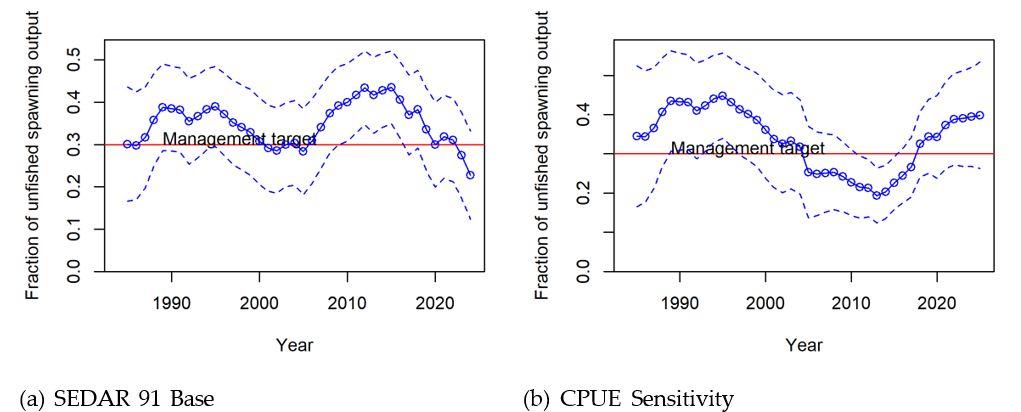
Puerto Rico spiny lobster spawning biomass ratio (total biomass / unfished spawning stock biomass) or the S91 base and CPUE sensitivity model scenarios. The dotted lines represent 95% confidence intervals.
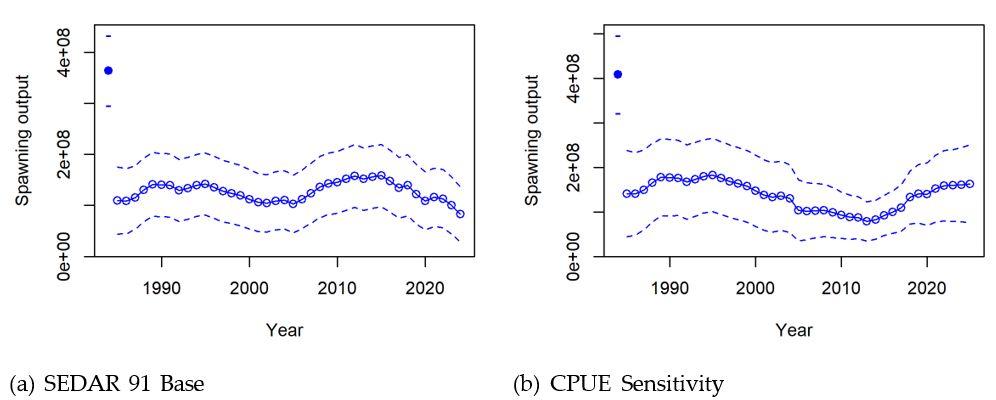
Puerto Rico spiny lobster spawning stock biomass in metric tons for the S91 base and CPUE Sensitivity model scenarios. The dotted lines represent 95% confidence intervals.
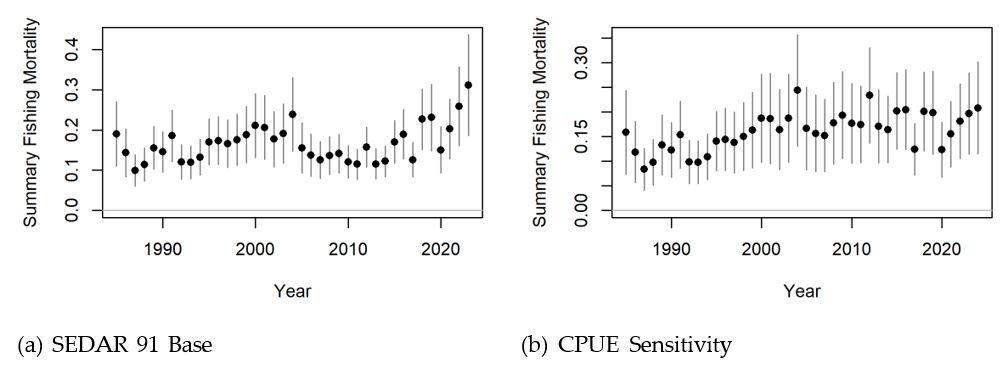
Puerto Rico spiny lobster fishing mortality (total biomass killed / total biomass) time series for the S91 base and CPUE Sensitivity model scenarios. The vertical lines represent 95% confidence intervals.
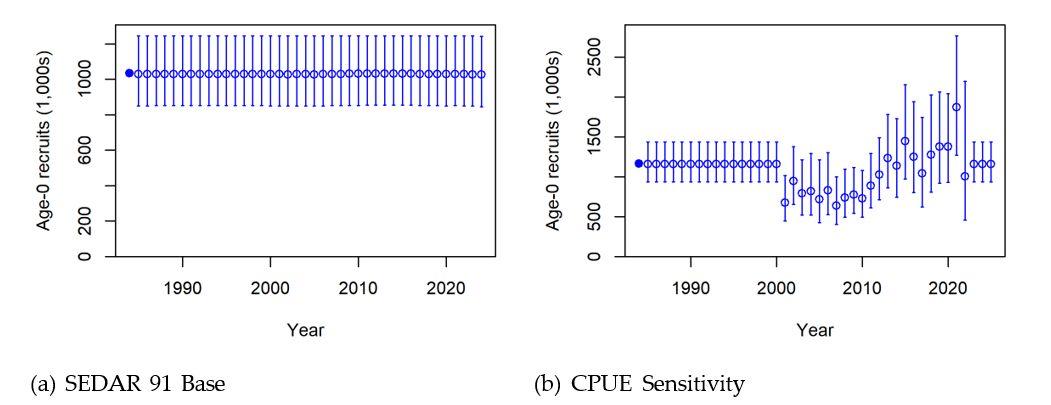
Puerto Rico spiny lobster recruitment in thousands of fish for the S91 base and CPUE Sensitivity model scenarios. The vertical bars represent 95% confidence intervals. For the CPUE Sensitivity model scenario, recruitment is estimated as deviations from the underlying spawner-recruit relationship. The model estimates main recruitment deviations from 2001 to 2022 and uses a bias adjustment ramp that begins in 1988.
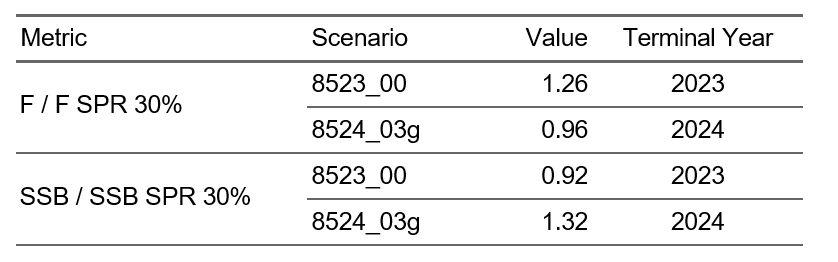
Puerto Rico spiny lobster fishing mortality rate and spawning stock biomass ratios relative to the rate and biomass of the stock associated with the MSY proxy (based on SPR 30%).
Puerto Rico spiny lobster derived quantities of the MSY proxy (based on SPR 30%) in metric tons and in pounds. CV is calculated as the SD divided by the parameter estimate.

Necessary assumptions for recent landings (2025 & 2026)
P* = 0.45 CFMC input for management uncertainty
σ = 0.5 SSC input scientific uncertainty