2 | MATERIALSANDMETHODS
2.1 | Studylocationandsitedescription
Thisstudyoccurredatanoffshoreaquaculturefacilitydedicatedtotheproductionofcobia(Rachycentroncanadum). Cobiaisalargepelagicfishwhosenaturaldistributioniscircumtropical,withtheprobableexceptionoftheeastern TropicalPacific(Franks&Brown-Peterson,2002).Cobiaexhibitrapidgrowthandothercharacteristicsdesiredby aquaculturists(Benettietal.,2010).Cobiaisarelativelynewfishtotheaquacultureindustry.Researchintoaquaculturetechniquesforcobiabeganinthe1970sintheUnitedStates(Hassler&Rainville,1975),andlarge-scaleproductionbeganinthe1990s(Liaoetal.,2004).Today,thetotalannualproductionofcobiaislessthan50,000tons globally,mostofwhichoccursinChina(FAO,2013).
ThefarmsiteislocatedontheAtlanticcoastofPanamaintheCostaArribaregion.Thesiteisapproximately 13kmoffshore,indepthsrangingfrom55to65m.Atthebeginningofphaseone(2012),thefarmsitewasoccupied by16OceanSpar “Sea-Station” cages,each~6,400m3.Duringthe2013sampling,therewere21cagesonsite.By 2017,thenumberofcagesonsitehadgrownto22.Thefarmhasbeenoperatingcontinuouslysince2010,although thedatacollectedinthisarticlearethefirstlarge-scaleefforttocollectdataoneffluentimpacts.Futureadditionsto thefarmareplanned,althoughthecagesintendedforuseinthefutureareconsiderablylarger(14,400m3)andwill belocatedonanewsiteapproximately1kmtothewestofthecurrentsite.
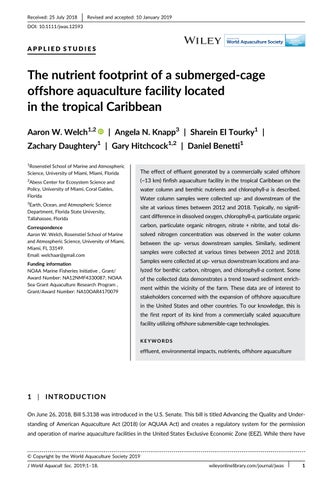
TheOceanSparSeaStation's6,400m3 cagesconsistofa24m-tallcentralsparorientedverticallyinthewater columnandsurroundedbyanexteriorrimwithadiameterofapproximately35mthatcirclesthesparatitsmidpoint. Nettingisstretchedfromthetopofthespar,downaroundtherim,andbacktothebottomofthespar,creatinga three-dimensionalspacethatresemblestwoconesjoinedattheirbases(Figure1).Cagesaremooredwithmultipoint mooringssecuredwithinananchorgridandaremaintainedinasubmergedposition,althoughtheyaresurfaced occasionallyformaintenanceorharvesting.Whensubmerged,thecagesrestwiththetopofthesparmorethan
10mbelowthesurface,whichcanbesubmergedtogreaterdepths.Theentiregroupofcagesismooredintwoseparatemooringgrids.Inthisarticle,thegroupofcagesinthesetwomooringgridsisreferredtocollectivelyasthe “cagefield.”
Cagesaretendedtobyasmallfleetofserviceboats,includingfeedboats,harvestboats,andmaintenanceboats. Diversworkinandaroundthecagesonadailybasis.Pelletizedfeedisprovidedtothefishviaapumpingsystemthat deliversfeedtothefishthroughextendedhosesconnectedtofeedboats.Feedisprovidedtothecagesoncedaily atarateof<3%ofbiomassperday.Cagesaregenerallystockedsothatthefinaldensityatharvestremainsbelow 25kg/m3.Thetargetharvestsizeofthefishis4–5kg.Thetotalbiomassinthecagesattheendof2012was 571,907kg,andthetotalbiomassinthecagesattheendof2013was919,917kg.Sincethen,thebiomassonthe farmhasrisensteadilyandreached1,360,000kgattheendof2017.
Theeconomicfeedconversionratio(eFCR)onthefarmthroughoutthestudyperiodhasgraduallydeclinedand, today,isbetween2.5and3.0,wheretheeFCRdescribesthefeedingefficiencyofanimalproductionoperations.The eFCRisthetotalamountoffeedprovidedtoacohortoffishdividedbytheamountofwhole,wet-weightbiomass ofthatcohort.TheeFCRisnotmodifiedtoaccountforfishescape,mortality,oranyotherformofcroplossthat occurspriortoharvest.
ThelocalclimateatthefarmsiteistypicalforitslocationwithintheInter-TropicalConvergenceZone(ITCZ). Strongtradewindsblowgenerallyfromthenorthtothesouthandbringprecipitationtotheareaastheyreachthe mountainousisthmusandshedmoisture.ShiftsintheITCZgenerateawetseasonthatrunsgenerallyfromMayto DecemberandadrierseasonfromJanuaryuntilApril(Jackson&D'Croz,1997).Farmstaffreportsthatestimated waveheightsatthesitearetypically<1m,althoughtheycanreach4–5mundersevereconditions.Duringthesamplingdescribedinthismanuscript,researchersexperiencedalloftheseconditions,includingestimatedwaveheights of4–5m.
Surfacecurrentsatthesitehavebeenmeasuredbyfarmstaffusingavarietyofdifferentcurrentmetersandrun alongshoreinapredominantlyeastwarddirection(although,occasionally,currentswillrunwestward)atspeeds between0.05and0.7m/s.Thesemeasurementswereconsistentwithconditionsobservedduringthesampling describedhere.Verticalcurrentprofileswerenotavailableduringour2012or2013samplingcampaigns;however, in2015,currentmeasuringdeviceswereinstalledbyfarmmanagement.Resultingdataindicatethatcurrentsarerelativelyconsistentwithintheupper30mofthewatercolumnandthendecreasewithdepthbutretainthesame directionofflow.The2012samplingoccurredduringwindy(~10–25km/hr)andrainyconditions,withseasofupto 3m.Currentsduringthe2012samplingwerevariable.The2013samplesweretakenduringweathercharacterized byveryhot(~30 C)andcalm(≤5km/hr)conditions,withnorain.Samplingduring2017and2018occurredinall weatherandcurrentconditions,includingdryandrainyseasonconditions.
2.2 | Phase1samplecollection
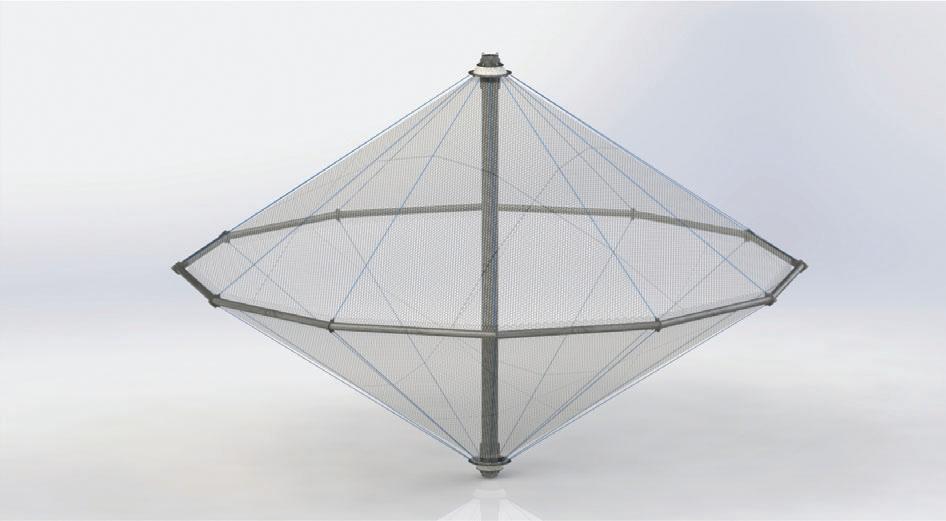
Duringphaseoneofthisproject,samplingworkwasconductedbyateamfromtheUniversityofMiami.Thephase onesamplingprotocolwasdesignedtoevaluatewhethertheaquaculturefacilityaffectedthebiogeochemicalcharacteristicsoflocalwatersandsediments.Watercolumnsampleswerecollectedfortheanalysisofdissolvedoxygen (DO),totaldissolvednitrogen(TDN),nitrate+nitrite(NO3 +NO2 ),chlorophyll-a (chl-a),particulatecarbon(PC), andparticulatenitrogen(PN)concentrations.Thewatercolumnsamplingstrategyincludedcollectingsamplesatone upstreamlocationandthreedownstreamlocationsforeachsampling “run” (Figure2).SamplinglocationswerechosenbasedonthetrajectoryofaCoastalOceanDynamicsExperimentdesigndrifter(Davis,1985)releasedtotrack surfacecurrentsaroundthecagesite.Priortosampling,thedrifterwasdeployedwithinthecagefieldandfollowed withtheresearchboatinordertodeterminethecurrentdirection.Oncethedrifterconfirmedthecurrentdirection, itwasretrieved,andtheresearchboatwasmovedtotheupstreamsideofthecagefieldwherean “UpstreamStation” waschosen.ThepreciselocationoftheUpstreamStationvariedfromruntorunbutwasalwayswithin75mof thecagesontheupstreamsideofthecagefield.InordertocollectsamplesattheUpstreamStation,theresearch
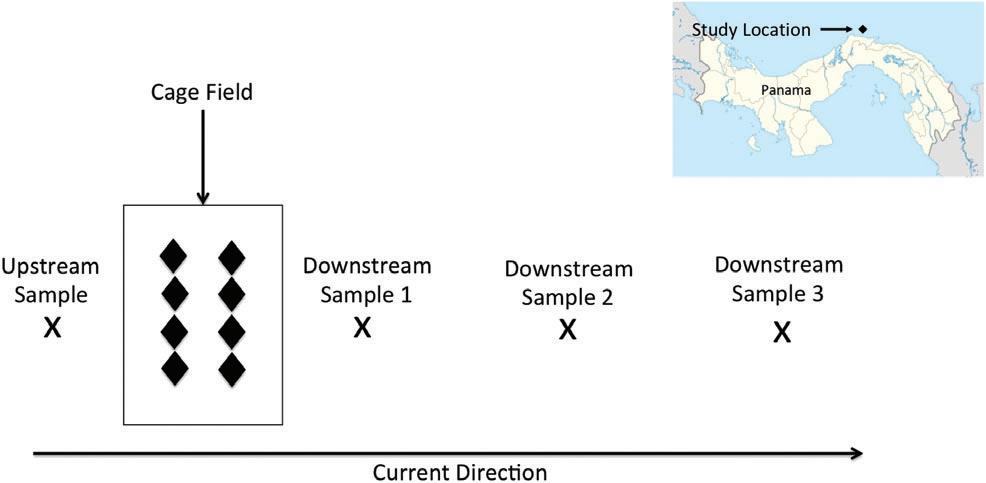
boatwasmooreddirectlytooneofthe “crown” buoysthatweresecuredtothemooringgrid'souteranchors.Once samplesandmeasurementswerecollectedattheUpstreamStation,thedrifterwasreleasedonatrajectorythat allowedittopassthroughthecagefieldandthendriftdownstreamwiththeprevailingcurrents.Downstream1stationwaslocatedatthepointwherethedrifterclearedthecagefieldonthedownstreamsideofthecagesiteand wasalwayswithin75mofthecages.StationsDownstream2andDownstream3werelocatedatapproximately1-hr intervalsalongthedriftertrajectorydownstreamofthecagesite(Figure2).DistancesbetweenStationsDownstream 1,Downstream2,andDownstream3variedwiththecurrentandrangedfromafewhundredmeterstomorethana kilometer.Samplingbeganapproximately2hrafterfarmcrewshadbegundailyfeedings.
ThedrifterwasbuiltattheUniversityofMiamiandconsistedoffoursailsarrangedinan “X” shapearoundacentralmast.Eachsailwasapproximately50cminwidthand50cminheight.Themastwasconstructedof75cmof200 polyvinylchloridepipe,andthesparsweremadefrom0.500 outerdiameterfiberglassrods.Thefiberglassrodswere insertedinthemast(topandbottom)viaholesdrilledintothesparatrightanglestooneanother.Sleevessewedinto thesails(topandbottom)allowedthemtobeaffixedtotherods.Thesparwasballastedwithtwo16-ozleadweights atthebottom,andfour1200 all-purposestyrofoambuoyswereattachedtothetopspars,ensuringthatthedrifter maintainedaverticalorientationwhilesubmergedinthewatercolumn.
Ateachsamplingstation,individualwatersamplesweretakenat5,15,30,and60m.Sampleswerecollected fromthesamplingvesselusingahand-operated10LNiskinbottle(GeneralOceanics,Miami,FL)thatwasclosed withamessenger.DepthsweremeasuredusingpremeasuredlengthsoflineattachedtotheNiskinbottle.Individual samplesfromeachstationanddepthwerestoredin10-Lhigh-densitypolyethylene(HDPE)carboysinacooleruntil returningtolandwheretheywereprocessedwithin6hrofcollection.Inadditiontocollectingindividualwatersamples,insituDO,temperature,andsalinitymeasurementsweremadeateachstationusingaSeabirdSBE43DOsensor(SeabirdElectronics,Bellevue,WA)attachedtoaSBEM19conductivity,temperature,depth(CTD)unit(Seabird Electronics,Bellevue,WA).TheDOsensorandCTDunitweredeployedbyhandimmediatelyafterthewatersampleswerecollected.Theunitsweredeployedbyhandandthenallowedtodescendtothebottomat~0.3m/s.The DOsensorandCTDunitwereretrievedatthesameapproximatespeed.TheCTDunitandDOsensorwerefactory calibratedpriortodeployment(SeabirdElectronics,Bellevue,WA).
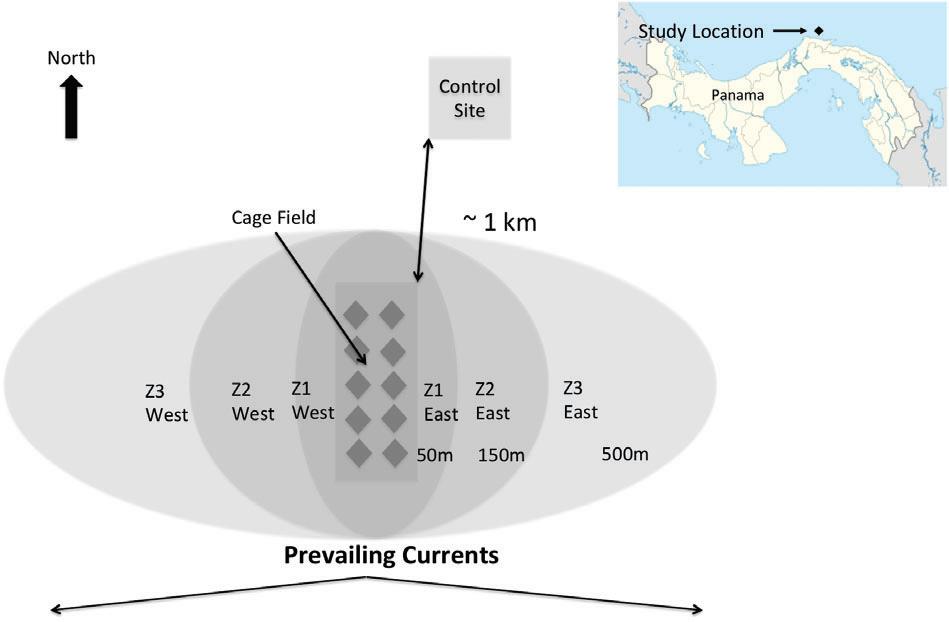
Similartothewatercolumn,sedimentsampleswerecollectedtoevaluatetheeffectsoftheaquaculturefacility onsedimentbiogeochemicalparameters.Samplingwasdividedintothreezones:anearzone(Z1),within50mofthe cagefield;anintermediatezone,between50and150mfromthecagefield(Z2);andafarzone,between150and 500mfromthecagefield(Z3).Eachzonewasfurthersubdividedontheeastandwestsideofthecagessothateach
FIGURE2 Watercolumnsamplingschemerelativetopositionofcagefield
zonehadaneastandwestsubzone(Z1E,ZIW,Z2E,Z2W,Z3E,Z3W)(Figure3).Currentsatthesiteranprimarilyto theeast,makingtheeasternsubzonesthedownstreamzones,whilethewesternsubzonesweretheupstreamzones. Finally,sampleswerecollectedfromacontrolsiteinalocation(1kmtothenorth)thatwasunaffectedbytheeffluentfromthecagefieldbecauseoftheprevailingcurrentdirection(Figure3).
Sedimentsampleswerecollectedwithan8.2-LiterPonargrabsampler(WildlifeSupplyCompany,Yulee,FL). Immediatelyuponopeningthegrabsampler,1cmofthetoplayerofsedimentwascollectedintoaplasticbagand storedoniceinacoolerforsedimentchl-a analysisonshore.Inaddition,~200mLofsedimentwascollectedinto plasticbagsandstoredoniceinacooleruntilreturningtoland,wheresampleswerestoredfrozenat 20 CforshipmentbacktotheUnitedStates.
2.3 | Phase2samplecollection
Duringphase2ofthiswork,sampleswerecollectedforadditionalsedimentandwatercolumnanalysis.Monitoring beganinearly2017andwasperformedbyfarmemployeesassistedbypersonnelfromtheUniversityofMiami.Sedimentsamplingwasconductedusingthesameschemeusedin2013,butZone3waseliminatedfromconsideration, leavingZ1E,Z2E,Z1W,andZ2W(Figure3).Thecontrolsiteutilizedin2017wasthesamesiteutilizedduringthe 2013samplingwork.AsduringPhase1,currentsatthesiteranprimarilytotheeast,makingtheeasternsubzones the “downstream” zones,whilethewesternsubzonesweretheupstreamzones.Samplesinthesecondphaseofthe monitoringprogramwerecollectedusinga2000 HeavyKB-CoreSampler(WildlifeSupplyCompany,Yulee,FL)with plasticcoreliners.Thecorerwasdeployedfromaworkboatoutfittedwithanelectricwinch.Whencoreswere retrieved,thetop2.5cmofthecorewasextrudedfromthecoreliners,collectedintoplasticbags,andstoredonice inacooleruntilreturningtoland.AllsamplesweredeliveredonicetoAquatecLaboratoriesinPanamaCity,Panama within24hrofcollection,wheretheywereanalyzedforTOC.
Watersamplesforammonia(NH4+)analysiswerealsocollectedbeginningin2017.Thesesampleswerecollectedonceamonthfromwithinsubmergedcagesatmidcagedepth(approximately20m)andatacontrolsite approximately1kmsouthofthecagefield.Watersampleswerecollectedusingahand-operated10-LNiskinBottle
FIGURE3 Sedimentsamplingschemerelativetocagefield.Sitesin “Zone1” , “Zone2”,and “Zone3” are~50m, 150m,and500meastandwestofthecagefield,respectively.Controlsiterepresentedby “C”
(GeneralOceanics,Miami,FL)thatwascarriedbyadiverforsamplestakeninthecagesandoperatedfromthesamplingvesselforsamplestakenatthecontrolsite.
2.4 | Phase1sampleanalysis
ForNO3 ,+NO2 andTDNconcentrations,watercolumnsampleswerefilteredthrougha0.7 μmWhatmanGF/F glassmicrofiberfilterandcollectedinto60-mLacid-washed,sample-rinsedHDPEbottlesandimmediatelyfrozenat 20 C.ThesesampleswereshippedfrozentotheUniversityofMiami,UnitedStates,whereNO3 +NO2 and TDNconcentrationweremeasuredusingchemiluminescentanalysis(Braman&Hendrix,1989)andpersulfateoxidationofTDNtoNO3 (Solorzano&Sharp,1980),adaptedaccordingtoKnapp,Sigman,andLipschultz(2005),with theresultingNO3 measuredbychemiluminescence.ThechemiluminescentanalysisofNO3 +NO2 wasperformedusingaconfigurationwithadetectionlimit~0.05 μM(±0.1 μM1 SD).TheconcentrationofTDNinasample isthesumofdissolvedorganicnitrogen+NO3 +NO2 +ammonium(NH4+),andthepropagatederrorforTDN concentrationmeasurementswas±0.5 μM(±0.3 μM1 SD).
In2013,thewatercolumnchl-a concentrationwasanalyzedonsiteinPanamabasedonmethodsdescribedin Holm-HansenandRiemann(1978).Briefly,concentrationsweredeterminedbyfiltering150mLofsamplethrougha WhatmanGF/Fglassmicrofiberfilterwithnominalporesizeof0.7 μm.Filterswerethenplacedinacentrifugetube with8mLofmethanol,stirred,andfrozenforaminimumof24hr,afterwhichtime,sampleswereallowedtoriseto roomtemperatureinawarmwaterbathandthencentrifugedfor1min.Thesupernatantwaspipettedoff,andthe fluorescenceofsampleswasmeasuredusingaTurnerDesignsTrilogyFluorometer(TurnerDesigns,SanJose,CA). Immediatelyaftertheinitialreading,twodropsof10%HClwasaddedtothetesttube,andasecondreadingwas taken,anecessarystepfordeterminingphaeopigmentconcentration.Betweeneachsample,thetesttubewasrinsed intriplicatewithmethanol.Chl-a concentrationwasnotanalyzedin2012.
In2013,watercolumnsuspendedPCandPNconcentrationsweremeasuredbyfiltering1.5Lofsampleontoa precombusted(4hrat450 C)25mmWhatmanGF/Fglassmicrofiberfilterandthendryingthefilterina50 CdryingovenlocatedonsiteinPanama.FilterswerethenstoredinpolycarbonatefiltercasesandshippedtotheUnited Statesforanalysis.OnceintheUnitedStates,PCandPNsamplefilterswerepelletizedandsenttotheUCDavisStableIsotopeFacilityforquantificationofthePCandPNcontentbycombustionanalysis.PCsampleswerenotacidifiedandsoincludebothparticulateorganicandinorganiccarbon.
In2013,sedimentsamplesforPCandPNanalysiswerepackagedinto60-mLHDPEbottles,frozenat 20 C, andthenshippedfromPanamatotheUnitedStatesforanalysis.OnceintheUnitedStates,thesampleswere thawedandplacedinadryingovenat50 Cforapproximately48hr.Oncedry,thesampleswereweighedintotin capsulesandsenttotheUCDavisStableIsotopeFacilityforanalysis.
In2013,samplesintendedforsedimentchl-a analysiswerefrozeninPanamaandshippedtotheUniversityof Miami.Analysisofsedimentchl-a contentwasconductedbythawingfrozensedimentsamplesandthenweighing themandtransferringthemtopreweighedtesttubes.Testtubesandsampleswerethenreweighedinordertodeterminetheweightofthesedimentsample.Afteranaccurateweightwasestablishedforeachsample,chl-a was extractedin9mLofethanol.Sampleswerespuninacentrifugeandstoredat 20 C.Sampleswerethenbroughtup toroomtemperatureandcentrifuged.Chl-a analysiswasperformedonthesupernatantliquid.ATurnerDesignTrilogyLaboratoryFluorometerwithachl-a modulewasusedfortheanalysis.Analysiswasperformedusingthe methodsoutlinedinHolm-HansenandRiemann(1978).
2.5 | Phase2sampleanalysis
SedimentsamplescollectedduringPhase2ofthisresearchweresenttoAquatecTestingLaboratoriesinPanama City,Panama,wheretheywereanalyzedforTOCaccordingtotheUnitedStatesEnvironmentalProtectionAgency methodseawater(SW)9060A.TheSW9060Amethodconvertsorganiccarbontocarbondioxide(CO2)via
combustion,whereitisthenmeasureddirectlyviainfraredabsorbanceorisconvertedtomethane(CH4)andthen measuredusingaflameionizationdetector.
WatersamplescollectedforNH4+ analysisinPhase2ofthisresearchwereanalyzedatonsitelaboratoryfacilitiesusingaHachDR900Colorimeter(Hach,Loveland,CO).WatersamplesforNH4+ wereanalyzedusingthe AmmoniaSalicylatemethod(Hachmethod8155).
2.6 | Statisticalanalysis
TheKruskal-WallisRankSumtestfornonparametricdatawasusedtoevaluatewhetherthereweresignificantdifferencesbetweenthenutrientconcentrationsmeasuredinthewatercolumnandbenthicsamplescollectedupstream versusdownstreamoftheaquaculturecagefield.GiventhatphotosynthesisproducesDO,PC,PN,andchl-a in marinesurfacewaters,whilerespirationinsubsurfacewatersconsumesDO,PC,andPNandregeneratesinorganic nutrientsatdepth(Emerson&Hedges,2008),weonlycompareupstreamversusdownstreamwatercolumnmeasurementsatagivendepth.Wealsoevaluatedthedistributionofnutrients,DO,andchl-a ondensity(i.e.,sigma theta)surfacesinsteadofbydepth,butthisdidnotaffectourresults(SupportingInformationTableS1).
3 | RESULTS
3.1 | Phase1:Upstreamversusdownstreamwatercolumnnutrientconcentrations
TheDOconcentrationinupstreamanddownstreamsampleswerelargelysimilar,althoughinsomecases,DOconcentrationsatindividualdepthswerepotentiallydistinguishablefromeachother.Comparingtheupstreamversus downstream2012DOconcentrationsusingtheKruskal-Wallistest,nosignificantdifference(i.e., p ≥ 0.1inallcases) wasdetectedbetweenthesamplescollectedat5,15,or30m.TheaverageDOconcentrationintheseupperthree depthsrangedbetween6.44±0.01and6.47±0.01mg/L(Figure4,Table1).However,inthe201260msamples, theupstreamDO(6.49±0.01mg/L)wassignificantlyhigherthanthedownstreamDO(6.46±0.01mg/L)atthe 0.1 ≥ p ≥ 0.05significancelevel(Figure4,Table1).In2013,theaverage5mupstreamDOconcentrationwas 6.32±0.01mg/L,whichwaslowerthantheaveragedownstreamDOconcentrationat5m,whichwas 6.33±0.01atthe0.1 ≥ p ≥ 0.05significancelevel.In2013,theaverage15mupstreamDOwas6.32±0.00mg/L, whichwassignificantlyhigherthanthedownstreamDOconcentrationof6.30±0.02mg/L,alsoatthe
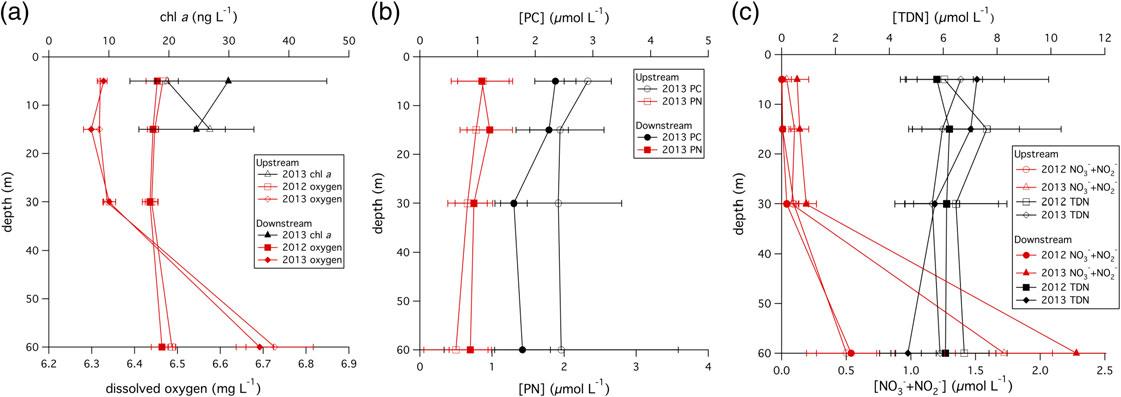
FIGURE4 Watercolumnchlorophyll-a (triangles)anddissolvedoxygen(squaresanddiamonds)(a),particulate carbon(circles)andnitrogen(squares)(b),andtotaldissolvednitrogen(squaresanddiamonds)andNO3 +NO2 (circlesandtriangles)(c)forupstream(opensymbol)anddownstream(filledsymbol)samplinglocationsin2012 and2013
TABLE1 Average(±1 SD)watercolumnmeasurements
NO3 +NO2 (μM) 20122013
Depth(m)UpstreamDownstreamUpstreamDownstream
50.00±0.000.00±0.000.04±0.040.12±0.09 150.01±0.020.01±0.020.10±0.040.14±0.07 300.09±0.110.04±0.090.08±0.050.19±0.08 600.50±0.230.54±0.341.72±0.382.28±1.02
TDN(μM)
20122013
Depth(m)UpstreamDownstreamUpstreamDownstream 56.0±1.45.8±1.46.6±1.67.3±2.7 157.6±2.86.2±1.56.0±1.17.0±1.8 306.5±1.96.1±1.95.6±1.05.7±0.8 606.8±1.66.1±1.95.9±1.84.7±1.1
Oxygen(mg/L)
20122013
Depth(m)UpstreamDownstreamUpstreamDownstream 56.47±0.016.45±0.036.32±0.016.33±0.01 156.45±0.006.44±0.016.32±0.006.30±0.02 306.44±0.026.44±0.026.34±0.016.34±0.01 606.49±0.016.46±0.026.73±0.096.69±0.03
Chl-a (μg/L)
20122013
Depth(m)UpstreamDownstreamUpstreamDownstream 5N/AN/A19.7±1.929.9±16.4 15N/AN/A26.8±2.624.6±9.6
PCsusp(μM) 20122013
Depth(m)UpstreamDownstreamUpstreamDownstream 5N/AN/A2.91±0.412.35±0.36 15N/AN/A2.43±0.762.24±0.34 30N/AN/A2.40±1.101.63±0.23 60N/AN/A2.45±2.031.78±0.48
PNsusp(μM) 20122013
Depth(m)UpstreamDownstreamUpstreamDownstream 5N/AN/A0.88±0.360.86±0.43 15N/AN/A0.78±0.220.97±0.32 30N/AN/A0.66±0.270.75±0.26 60N/AN/A0.50±0.440.70±0.29
Note. TDN:totaldissolvednitrogen.
0.1 ≥ p ≥ 0.05significancelevel.However,in2013,the30mupstreamanddownstreamDOconcentrations,both 6.34±0.01mg/L,werenotdistinguishablefromeachother.Similarly,theupstreamanddownstreamDOconcentrationscollectedat60min2013,6.73±0.09and6.69±0.03mg/L,respectively,werenotsignificantlydifferent fromeachother(Figure4,Table1).
Theconcentrationofchl-a wasmeasuredinsamplescollectedat5and15min2013.The5maverageupstream chl-a concentration,19.7±1.9ng/L,wassignificantlylowerthanthedownstream5mchl-a concentrationof 29.9±16.4ng/Latthe0.1> p >0.05significancelevel.However,inthe15msamples,therewasnodifferencein theupstreamversusdownstreamchl-a concentration(26.8±2.6and24.6±9.6ng/L,respectively)(p >0.1) (Figure4,Table1).
Sampleswerecollectedatalldepthsinboth2012and2013forNO3 +NO2 andTDNconcentrationmeasurements.TheNO3 +NO2 concentrationofsamplesfrom5,15,and30mweretypically<0.2 μMand,at60m, increasedto~0.5 μMin2012andto~2.0 μMin2013(Table1).In2012,theupstreamversusdownstreamNO3 + NO2 concentrationswerenotsignificantlydifferentatanydepth.In2013,theKruskal-Wallistestindicatedthat theupstream5and30mNO3 +NO2 concentrationsweresignificantlylowerthanthedownstreamsamplesatthe 0.025> p >0.01significancelevel.However,theupstreamversusdownstreamsamplesat15and60mdidnot showsignificantdifferencesintheirNO3 +NO2 concentrations(i.e., p >0.1).TDNconcentrationswererelatively constantwithdepthinthewatercolumnandrangedfrom4.7±1.1to7.6±2.8 μM(Figure4,Table1).Therewas noevidenceofsignificantlydifferentTDNconcentrationsinupstreamversusdownstreamsamplesatanydepthin eitheryear.
WatercolumnPCconcentrationswerethehighestinsurfacewatersanddecreasedwithdepth,rangingfrom 2.91±0.41 μMinupstream5msamplesto1.78±0.48 μMindownstreamsamplescollectedat60m(Figure4, Table1).Similarly,thewatercolumnsuspendedPNconcentrationswerethehighestinsurfacewatersanddecreased withdepth,rangingfrom0.88±0.36 μMin5mupstreamsamplesanddecreasingto0.50±0.44 μMin60-m upstreamsamples(Figure4,Table1).AnalysisofthewatercolumnsuspendedPCconcentrationsfrom2013using theKruskal-Wallistestindicatedthatthe5mand30m2013upstreamsampleshadhigherPCconcentrationsthan thedownstreamsamplesatthe0.1> p >0.05significancelevelbutthatthemeansofthe15-and60-msamplePC concentrationswereindistinguishable.TheKruskal-Wallistestwasunabletoidentifyasignificantdifferenceinthe PNconcentrationinupstreamversusdownstreamsamplesat5,15,30,or60m(p >0.1)(Figure4,Table1).
3.2 | Phase1:Upstreamversusdownstreambenthicchl-aandPC,PNconcentrations
Sedimentsampleswerecollectedin2013toevaluatewhethertheaquaculturefacilityaffectedbenthicchl-a,PC, andPNcontent.WhenthebenthicPCcontentfromsamplescollectedatallsevensamplinglocations(Z1E,Z1W, Z2E,Z2W,Z3E,Z3W,andcontrol)wascompared,theKruskal-Wallistestwasunabletoidentifydistinctpopulations (i.e., p ≥ 0.1inallcases);thesamewastrueforevaluationofthePNandchl-a contentofsamplesfromallsevenlocations.WhenwecomparedthemeanPC,PN,andchl-a contentofasmallersetofsamplinglocations,therewas strongerevidenceofadifferencebetweenthesamplinglocations.Forexample,whenthePCcontentfromthecontrolsitewascomparedwiththePCcontentofsamplescollectedatZ1EandZ1W,theKruskal-Wallistestindicated that,atthe p ≤ 0.075levelofsignificance,thereisevidencetosuggestthatatleasttwoofthepopulationsaredifferent(Figure5).Asthe “downstream” Z1EsitehasthehighestPCcontent,38.6±5.3mgC(gsed) 1,andthecontrol and “upstream” Z1Wsitehadsimilarconcentrations(28.1±2.5and28.1±0.3mgC[gsed] 1,respectively),weconcludethatthedownstreamsitehassignificantlyhigherbenthicPCcontentthanthecontrolorupstreamlocations (Table2).WhenevaluatingthebenthicPNcontent,weagaincomparedsamplesfromthecontrolsitewiththosecollectedattheZ1EandZ1Wsitesandfoundthattheteststatisticindicatedthat,atthe p <0.061levelofsignificance, thereisevidencetosuggestthatatleasttwoofthepopulationsaredifferent(Figure5).Similartotheeffectofthe aquaculturecagefieldonbenthicPCcontent,thesamplecollectedatZ1E,immediatelydownstreamofthecagefield, hadthehighestbenthicPNcontent(1.8±0.4mgN[gsed] 1)comparedtothecontrolandZ1Wsites,bothofwhich hadbenthicPNcontentsof1.3±0.1mgN[gsed] 1)(Figure5,Table2).However,theevidencewaslesscompelling thattheaquaculturecagefieldsignificantlyaffectedbenthicchl-a content.Whilethemeanbenthicchl-a contentat thesitesimmediatelyupstream(0.3±0.2 μgchl-a [gsed] 1)anddownstream(0.4±0.3 μgchl-a [gsed] 1)ofthe cagefieldwerehigherthanatthecontrolsite(0.3±0.0 μgchl-a (gsed) 1),themeanswerenotsignificantlydifferent
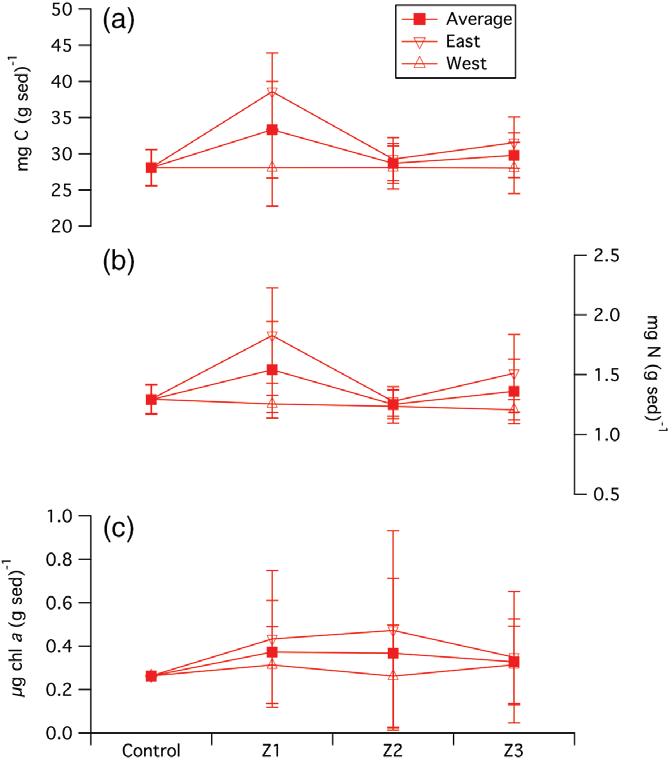
FIGURE5 Meanbenthiccarboncontent(a),nitrogencontent(b),andchlorophyll-a content(c)atallsites(filled squares),atsiteswestofthecagefield(opentriangles),andatsiteseastofthecagefield(openinvertedtriangles)
fromeachother(i.e., p >0.1)(Figure5).Similarly,whilethemeansofthebenthicchl-a samplescollectedatZ2Eand Z2Wshowthegreatestdifference(i.e.,0.5±0.5and0.3±0.2 μgchl-a (gsed) 1,respectively)(Table2),becauseof thehighSDassociatedwiththesemeasurements,whenthesesampleswerecomparedwiththosefromthecontrol site,theKruskal-Wallistestcouldnotdiscriminatebetweenthemeansofthepopulations(i.e., p ≥ 0.1).
3.3
| Phase2:Waterqualityandsedimentmonitoringresults
InPhase2,sedimentsamplingwasconductedattwolocationstothewestofthecages(Z1WandZ2W)aswellasat twolocationstotheeastofthecages(Z1EandZ2E)andata “control” samplinglocationtothenorthofthecages (Figure3).Thissamplingschemewasidenticaltotheschemeusedin2013,butthethirdzone(Z3EandZ3W)was eliminatedfromanalysis(Figure3).InApril2018,inclementweatherandequipmentfailurespreventedthesampling ofZ1WandZ2W.WhenthemedianTOClevelsfromsampleswerecollectedonasingledateatallfivesampling
TABLE2 The2013average(±1 SD)benthicmeasurements
LocationCcontent(mgC/gsed)Ncontent(mgN/gsed)Chl-
Z3W28.04±1.491.21±0.080.31±0.18
Z3E31.54±3.541.51±0.330.35±0.30
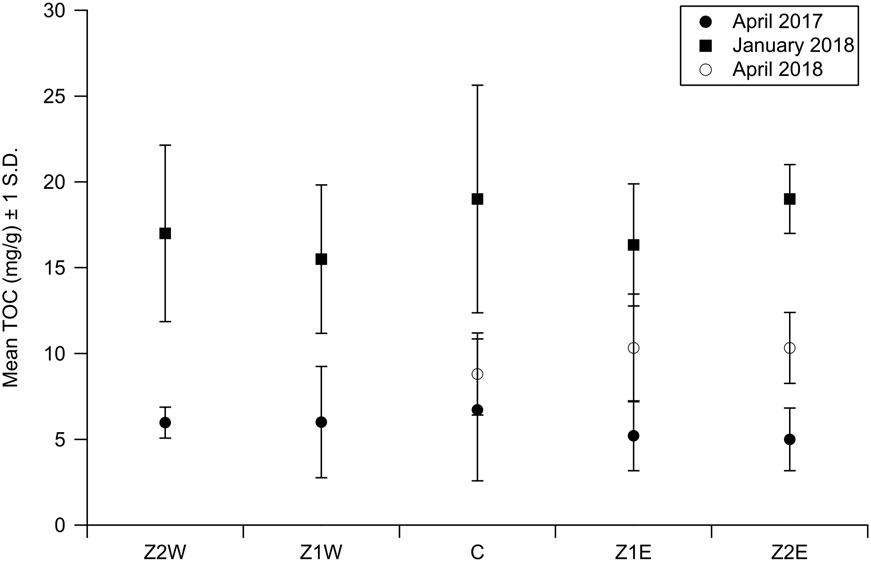
FIGURE6 Meanbenthictotalorganiccarbonconcentrations(mg/g)(+1 SD)atsamplinglocationsbeneath aquaculturecagessampledinApril2017(filledcircles),January2018(filledsquares),andApril2018(opencircles)
locations(orthreelocationsinthecaseoftheApril2018samplingsession),theKruskal-Wallistestwasunableto identifydistinctpopulations(i.e., p ≥ 0.1inallcases)(Figure6).
WhenmedianTOClevelsineachzonewereanalyzedovertime,however,theyshowedsignificantvariation.In ZIE,theApril2017medianTOC(5.4mg/g)wassignificantlydifferent(p =0.0004)fromtheJanuary2018median TOC(15.5mg/g)butnotsignificantlydifferentfromtheApril2018medianTOC(10.0mg/g).InZ2E,theApril2017 medianTOC(5.3mg/g)wassignificantlydifferentfromboththemedianTOCinJanuary2018(19.0mg/g)andApril 2018(13.0mg/g)(p =0.0002).Inthecontrollocation,theApril2017medianTOC(6.0mg/g)wassignificantlydifferentfromtheJanuary2018medianTOC(19.0mg/g)(p =0.015)butwasnotdifferentfromtheApril2018median TOC(9.0mg/g).InZ1W,theApril2017medianTOC(7.4mg/g)wassignificantlydifferentthantheJanuary2018 medianTOC(14.0mg/g)(p =0.02).InZ1W,theApril2017medianTOC(5.9mg/g)wassignificantlydifferentfrom theJanuary2018medianTOC(14.5mg/g)(p =0.02)(Figure6,Table3).
Watercolumnsampleshadammonialevelsthatrangedfrombelowthedetectionlimitoftheanalyticalmethod upto0.43ppminsidethecages.Atthecontrolsite,ammonialevelsrangedfrombelowthedetectionlimitofthe analyticalmethodto0.53ppm.Whiletherelativelylimitednumberofwatersamplesprecludedstatisticalanalysis, therewasnotrendevidentinthedata(Figure7).
4 | DISCUSSION
Whilecontinuedmonitoringwillbenecessarytoevaluatethelong-termeffectsonthebenthicandwatercolumn ecosystems,thedatareportedhereindicatethattheneteffectofthenutrientsemittedbytheaquaculturefacilityin coastalPanamahasbeenminimaloverthedurationofthetimethatmonitoringhasoccurred.
TABLE3 MeanbenthicTOCconcentrations(±1 SD)atindividualsamplinglocations
Z2WZ1WCZ1EZ2E January20175.97(0.9)6.00(3.24)6.72(4.13)5.20(2.04)4.99(1.83) January201817.0(5.14)15.5(4.32)19.0(6.64)16.3(3.56)19.0(2.0) April20188.80(2.39)10.33(3.14)10.33(2.07)
Cage 111-112 (10 m)
Control Site (10 m)
FIGURE7 Measuredammonia(NH4+ levels(ppm)withincages(darkgraydiamond)andatthecontrolsite1km awayfromcage(lightgraysquare)fromMay2017toApril2018
InPhase1,whilewatercolumnparameters,suchasslightlyhigherNO3 +NO2 andTDNconcentrations,in downstreamversusupstream2013samples(Figure4,Table1)potentiallyrecordedthesignatureofaquaculture effluent,thedifferencesbetweenupstreamanddownstreamsamplesweretypicallynotsignificant.Thislackofasignificantimpactonthewatercolumnfromtheaquaculturecageswas,insomeways,unexpected.Cobia(R.canadum) haverelativelyhighratesofnitrogenexcretionandoxygenconsumption(Feeley,Benetti,&Ault,2007).Inaddition, elevatedlevelsofammonia(Belias,Bikas,Dassenakis,&Soullos,2003;Huang,Huang,Meng,Hsieh,&Chen,2012; Neofitou&Klaoudatos,2008;Pittaetal.,2006;Pitta,Karakassis,Tsapakis,&Zivanovic,1999;Sanderson,Cromey, Dring,&Kelly,2008;Wildish,Keizer,Wilson,&Martin,1993)andreducedlevelsofDO(Johanssonetal.,2006;Wu, Lam,MacKay,Lau,&Yam,1994)intheimmediatevicinityofcageshavebeenreportedinanumberofdifferent aquaculturesettings.Despitethis,therewasnoconsistentevidenceofhighernutrientconcentrationsorreduced DOconcentrationsinthedata.
Inotherrespects,however,thelackofadetectableimpactonthepelagicenvironmentbeyondthecagefield agreeswithpriorresearchconductedatsitescomparabletotheoneinthisstudy(Alstonetal.,2005;Pittaetal.,1999; Pittaetal.,2006;Pittaetal.,2009;Soto&Norambuena,2004;Vezzullietal.,2008).Generally,thesefarmshavebeen locatedindeepandwell-mixedoligotrophicwaters(Sarà,2007).Researchersatthesesiteshavehaddifficultyobservinganymeasurableeffectonthepelagicenvironmentfromfarmoperationsatdistancesbeyondafewmetersfromthe cagerimswhenmeasuringbiogeochemicalproperties.Vezzullietal.(2008),forexample,analyzedtheimpactoforganic wastegeneratedbyacapture-basedbluefintuna(Thunnusthynnus)farmonthesurroundingenvironment.Thefarmin questionwaslocatedonanexposedsiteofftheSWcoastofItaly.Thesitewas<1kmfromshoreandin~45mof water.Analysisofthechl-a andorganicmatter(particulatebiopolymericcarbon)samplestakenatsamplingstationsin theimmediatevicinityofthecagesshowednostatisticallysignificantdifferencesrelativetoacontrolsite(Vezzulli etal.,2008,p.373).Similarly,themeasuredbiogeochemicalproperties(e.g.,DO)wereconsistentatboththecagesites andthecontrolsites.Inanearlierstudy,Pittaetal.(2006)studiedtheeffectonthepelagicenvironmentofagroupof threecommercialseabream(Sparusaurata)andseabass(Dicentrarchuslabrax)farmslocatedinSpain,Italy,andGreece. Eachfarmproducedbetween250and1,150m.t.peryear.Atonefarm,astatisticallysignificantspikeinnutrients (NH4+ andPO4)wasevidentatthecageedgerelativetoacontrolsiteatadistanceof500mwhensamplesweretaken atdiscretedepths(0m,10m,andonthebottom).Integratedwatercolumnsamplingaroundanddownstreamofthe farms,however,detectednoeffectonthebiogeochemicalvariablesanalyzed,includingchl-a,PON,POC,NH4+,PO4,
andNO3 concentrations(Pittaetal.,2006).Theseresultsindicatedthatmixinganddiffusionreducedtheanalyzed variablestobackgroundconcentrationsveryquickly.Alstonetal.(2005)monitoredtheimpactofanexperimentaloffshorefarminPuertoRicoculturingmuttonsnapper(Lutjanusanalis)andcobia(R.canadum).Thisworkutilizedanarray offixedpoint-monitoringstationsinandaroundthetwo-cagefarmsitewherebimonthlysamplesweretakenandanalyzedforNH4+,NO2 +NO3 ,andPO4 inthewatercolumn.Nostatisticallysignificantdifferenceswerenotedforany monitoredwatercolumnvariableoverthecourseofthestudy.
Interpretingthesedimentdatacollectedhereismoredifficult.InPhase1ofourstudy,theamountofPCandPN inthesedimentaroundthecagesiteshowsatrendtowardincreasedorganicloadingunderthecagesrelativetothe controlsite(Figure5).Whenbrokendownbysubzone,theresultsareevenmoresuggestiveofatrendtoward increasedorganicloadinginthebenthosbecausethemeanvaluesforbenthicPCandPNarehighestontheeastside ofthecagefield(ZIE)inthedirectionoftheprevailingcurrent.(Figure5,Table2).TheobservedincreaseinPCand PN,however,wasmodest,andthesametrendwasnotobservedintheTOCdatacollectedinPhase2.
InPhase2,TOClevelsinthebenthicenvironmentdidnotappeartovaryasafunctionofthesamplelocation butinsteadvariedsignificantlyovertime.TOClevelsgenerallyincreasedacrossallsamplelocations,includingthe controlsite,betweenApril2017andJanuary2018andthendecreasedagainacrossallzonesandthecontrolsite betweenJanuary2018andApril2018.Thefactthatthesechangesoccurredacrossallsampledlocationsandgenerallychangedinthesamesensesuggeststhatseasonalprocesses,suchasPanama'swet-season/dry-seasonmeteorologicalpatternand/orannualprimaryproductivitycycles,mayalsobeinfluencingthefluxoforganicmaterialtothe sediments(Aller&Stupakoff,1996;Gooday,2002;McKee,Aller,Allison,Bianchi,&Kineke,2004).MoredatacollectionisneededtoestablishtheextenttowhichTOClevelsfluctuateasaresultofseasonalprocesses.
Aswiththeresultsfromthewatercolumnsampling,resultsforthesedimentsamplingconductedinthisstudy weregenerallyinaccordwithpublishedresultsfromsimilarwork,mostofwhichhaveshownthatthemajorityofenvironmentalimpactscreatedbynet-penaquacultureoccurinthebenthos(Aguado-Giméz&Garciá-Garcia,2004;Carroll, Cochrane,Fieler,Velvin,&White,2003;Domínguez,Calero,Martín,&Robaina,2001;Edgar,Macleod,Mawbey,& Shields,2005;Kalantzi&Karakassis,2006;Klaoudatos,Klaoudatos,Smith,Bogdanos,&Papageorgiou,2006;Mazzola, Mirto,&Danovaro,1999;Porelloetal.,2005;Schendel,Nordström,&Lavkulich,2004;Soto&Norambuena,2004).
Thedatapresentedhereshouldprovideareasonforcautiousoptimismabout emergingoffshoreaquaculturetechnologies.Undoubtedly,thereleaseoflargeamountsofnutrientsintomarineecosystemsisoneofthegreatworriesassociatedwithcage-basedaquacultureofanysort.Saràetal.(2011),forexample,correlatedincreasedinputsofNandP fromaquaculturewithrisingchl-a concentrationsinalargecoastalembaymentintheMediterranean.Increasedlevelsof nitrogenandphosphorusmayalsostimulatebloomsofvarioustypesofphytoplanktonthatcouldbedetrimentaltothe functionofahealthymarineecosystem.Harmfulalgaebloomsareanobviousconcern,butthereareotherpossibledownstreamecologicaleffectsrelatedtopersistentnutrientoverenrichment,suchasregimeshiftsthatleadtooutbreaksofcnidariansorotherless-desirablespecies(Richardson,Bakun,Hays,&Gibbons,2009).Ithasalsobeendemonstratedthat thereleaseofsignificantquantitiesofnitrogenandphosphoruswithouttheproportionalreleaseofothertracenutrients (e.g.,silica)mightfavorparticulargroupsofphytoplanktonoverothers,thuscreatingan imbalanceatthelowertrophic levelsofamarineecosystem(Doeringetal.,1989;Justic,Rabalais,Turner,&Dortch,1995;Nieuwerburgh,Wänstrand,& Snoeijs,2004;Parsons,Harrison,&Waters,1978).Thereisalsothepossibilitythatmacrofaunainnearbyecosystems mightbedislocatedbecauseoftheinputofadditionalnutrients.Increasedepiphytegrowthbecauseofnutrientavailability,reducedlightforphotosynthesisbecauseofhigherlevelsofturbidity,andotherproblemsrelatedtoaquacultureeffluentscanbedestructivetosensitivebenthicecosystemssuchascoralreefandseagrassmeadows(Marba,Santiago,DiazAlmela,Alvarez,&Duarte,2006;Ruiz,Marco-Mendez,&Lizaso,2009).Inshort,evenwithoffshoreaquaculture,andeven giventherelativelybenignresultsreportedinthisstudy,itislikelythatthereisanupperleveltothecarryingcapacityof theenvironmentforthesesystems(Pitta,Apostolaki,Giannoulaki,&Karakassis,2005;Saràetal.,2011).Atsomepoint, thesustainedinputofnutrientsintoawaterbody,evenavery largeone,islikelytohaveunpredictableandpotentially harmfulimpacts.
Nonetheless,nutrientsofthesortdischargedbyaquaculturefacilitiesarenot,ipsofacto,pollution.NandPlieat thebaseoftheocean'sfoodwebanddrivetheprimaryproductionthat,inturn,drivesglobalfisheriesproduction (Ryther,1969).Agrowingbodyofliteraturesupportsthenotionthatlarge-scalenutrientinputsfromaquaculture facilitiescanhavepositiveeffectsonfisheriesoverlarge(regional)spatialscales(López,Bunke,&Shirai,2008; Machiasetal.,2004,2005,2006).Thesestudiescorrelatetheinstallationoflarge-scaleaquaculturefacilitieswith increasesinfishstockbiomass,aswellasthemeantrophiclevelandaggregateamountofwildfisherylandingsina region.Thesestudiessuggestthatnutrientsflowquicklythroughphytoplanktonatthebaseofthetrophicpyramid anduptohigher-orderconsumers(Pittaetal.,2009).Insomepartsoftheaquacultureindustry,thesenutrientflows arealreadybeingexploitedtoproduceadditionalmarketableproductviaIntegratedMultiTrophicAquaculturetechniques(Chopin,Cooper,Reid,Cross,&Moore,2012;Reidetal.,2010).Finally,itshouldbenotedthatthenegative effectsofaquacultureeffluentcanbemitigatedthroughconscientiousmanagement.Publishedliteratureonthesubject,forexample,indicatesthattemporaryfallowingtechniques(i.e.,leavingcagesemptyforaperiodof timebetweenharvestandrestocking)canlessentheeffectsofnutrientloadingonthebenthos(Macleod, Moltschaniwskyj,&Crawford,2006).
Astheoffshoreaquacultureindustrygrows,questionsabouttheappropriatescaleandlocationoffarmswillpersist(Lesteretal.,2018).Whilenosinglestudycananswerallofthesequestionsorresolvethemyriaduncertainties surroundingthedevelopmentofthisindustry,thisstudyindicatesthatappropriatelysited,commerciallyscaledoffshoreaquacultureinstallationshavethepotentialtooperateinawaythatproducesarelativelysmallnutrient footprint.
ACKNOWLEDGMENTS
WeacknowledgefundingsupportfromtheNOAAMarineFisheriesInitiative(grantnumberNA12NMF4330087) andtheNOAASeaGrantAquacultureResearchProgram(projectnumberNA10OAR4170079).
ORCID
AaronW.Welch https://orcid.org/0000-0002-5274-1893
REFERENCES
Adams,A.,Aguirre,T.,Allen,B.,Allen,G.,Anderson,E.,Auster,P., Wintner,R.(2009,January16). Consensusviewpoint. LetterSubmittedtotheGulfofMexicoFisheryManagementCouncil.Subj:PublicHearingDraft:FisheryManagement PlanforRegulatingOffshoreMarineAquacultureintheGulfofMexico.[LettertoThomasMcIlwain,Chair,GulfofMexicoFisheryManagementCouncil].2203N.LoisAvenue,Suite1100,Tampa,FL33607].Retrievedfromhttp://www. namanet.org/sites/default/files/documents/GOMFMC%20Aqua%20FMP%20112_Group_Sign-on%20Letter_Final_ 011609.pdf
AdvancingtheQualityandUnderstandingofAmericanAquacultureAct.(2018). 115thCongress. Retrievedfromhttps:// www.congress.gov/115/bills/s3138/BILLS-115s3138is.pdf
Aguado-Giméz,F.,&Garciá-Garcia,B.(2004).Assessmentofsomechemicalparametersinmarinesedimentsexposedtooffshorecagefishfarminginfluence:Apilotstudy. Aquaculture, 242,283–296. Aller,J.,&Stupakoff,I.(1996).ThedistributionandseasonalcharcteristicsofbenthiccommunitiesontheAmaonshelfas indicatorsofphysicalprocesses. ContinentalShelfResearch, 16(5–6),717–751. Alston,D.,Cabarcas,A.,Capela,J.,Benetti,D.,Keene-Meltzoff,S.,Bonilla,J.,&Corttes,R.(2005). Environmentalandsocial impactofsustainableoffshorecagecultureproductioninPuertoRicanWaters (NOAAFederalContractNumber NA16RG1611.FinalReport).
Belias,C.,Bikas,G.,Dassenakis,M.,&Soullos,M.(2003).EnvironmentalimpactsofcoastalaquacultureinEasternMediterraneanBays:ThecaseofAstakosGulf,Greece. EnvironmentalScienceandPollutionResearchInternational, 10(5),287–295. Benetti,D.,O'Hanlon,B.,Rivera,J.,Welch,A.,Maxey,C.,&Ohun,M.(2010).Growthratesofcobia(Rachycentroncanadum) culturedinopenoceansubmergedcagesintheCaribbean. Aquaculture, 302,195–201. Braman,R.,&Hendrix,S.(1989).Nanogramnitriteandnitratedeterminationinenvironmentalandbiological-materialsby vanadium(III)reductionwithchemi-luminescencedetection. AnalyticalChemistry, 61,2715–2718.
Carroll,M.,Cochrane,S.,Fieler,R.,Velvin,R.,&White,P.(2003).Organicenrichmentofsedimentsfromsalmonfarmingin Norway:Environmentalfactors,managementpractices,andmonitoringtechniques. Aquaculture, 226,165–180. Chopin,T.,Cooper,J.,Reid,G.,Cross,S.,&Moore,C.(2012).Open-waterintegratedmulti-trophicaquaculture:Environmentalbiomitigationandeconomicdiversificationoffedaquaculturebyextractiveaquaculture. ReviewsinAquaculture, 4,209–220.
Davis,R.(1985).DrifterobservationsofcoastalsurfacecurrentsduringCODE:Themethodanddescriptiveview. Journalof GeophysicalResearch, 90,4756–4772.
Doering,P.,Oviatt,C.,Beatty,L.,Banzon,V.,Rice,R.,Kelly,S., Frithsen,J.(1989).Structureandfunctioninamodel coastalecosystem:Silicon,thebenthosandeutrophication. MarineEcologyProgressSeries, 52,287–299.
Domínguez,L.,Calero,G.,Martín,J.,&Robaina,L.(2001).Acomparativestudyofsedimentsunderamarinecagefarmat GranCanariaIsland(Spain).Preliminaryresults. Aquaculture, 192,225–231.
Edgar,G.,Macleod,C.,Mawbey,R.,&Shields,D.(2005).Broad-scaleeffectsofmarinesalmonidaquacultureonmacrobenthosandthesedimentenvironmentinsoutheasternTasmania. JournalofExperimentalMarineBiologyandEcology, 327,70–90.
Emerson,S.,&Hedges,J.(2008). Chemicaloceanographyandthemarinecarboncycle (p.453).NewYork,NY:CambridgeUniversityPress.
Feeley,M.,Benetti,D.,&Ault,J.(2007).Elevatedoxygenuptakeandhighratesofnitrogenexcretioninearlylifestagesof thecobia Rachycentroncanadum (L.),afast-growingsubtropicalfish. JournalofFishBiology, 71,1662–1678.
FoodandAgricultureOrganization(2013).Fisheriesandaquaculturesoftware.In FishStatPlus – Universalsoftwareforfishery statisticaltimeseries.Rome,Italy.Retrievedfrom:FAOFisheriesandAquacultureDeparment.http://www.fao. org/fishery/statistics/software/fishstat/en FoodandWaterWatch.(2011). Fishyfarms:TheGovernment'sPushforfactoryfarminginouroceans. Retrievedfromhttp:// www.foodandwaterwatch.org/sites/default/files/fishy_farms_report_oct_2011.pdf Franks,J.,&Brown-Peterson,N.(2002).Areviewofage,growth,andreproductionofcobia, Rachycentroncanadum,from U.S.WatersoftheGulfofMexicoandAtlanticOcean. Proceedingsofthe53rdGulfCaribbeanFisheriesInstitute, 53, 554–569.
Gooday,A.(2002).Biologicalresponsestoseasonallyvaryingfluxesoforganicmattertotheoceanfloor:Areview. Journal ofOceanography, 58,305–332. Hassler,W.,&Rainville,R.(1975). Techniquesforhatchingandrearingcobia,Rachycentroncanadum,throughlarvalandjuvenile stages. PaperpresentedattheUniversityofNorthCarolinaSeaGrantCollegeProgram,UNC-SG-75-30,Raleigh,North Carolina,26pp.
Holmer,M.(2010).Environmentalissuesoffishfarminginoffshorewaters:Perspectives,concernsandresearchneeds. AquacultureEnvironmentInteractions, 1,57–70.
Holm-Hansen,O.,&Riemann,B.(1978).Chlorophyll a determination:Improvementsinmethodology. Oikos , 30 (3), 438–447.
Huang,Y.,Huang,S.,Meng,P.,Hsieh,H.,&Chen,C.(2012).Influenceofstrongmonsoonwindsonthewaterqualityaround amarinecage-culturezoneinashallowandsemi-enclosedbayinTaiwan. MarinePollutionBulletin, 64(4),851–850. Jackson,J.,&D'Croz,L.(1997).Theoceandivided.InA.Coates(Ed.), CentralAmerica:Anaturalandculturalhistory (pp.38–71).NewHaven,CT:YaleUniversityPress.
Johansson,D.,Ruohonen,K.,Kiessling,A.,Opedal,F.,Stiansen,J.,Kelly,M.,&Juel,J.(2006).Effectofenvironmentalfactors onswimmingdepthpreferencesofAtlanticsalmon(Salmosalar L.)andtemporalandspatialvariationsinoxygenlevelsin seacagesatafjordsite. Aquaculture, 254(1–4),594–605.
Justic,D.,Rabalais,N.,Turner,R.,&Dortch,Q.(1995).Changesinnutrientstructureofriver-dominatedcoastalwaters:Stoichiometricnutrientbalanceanditsconsequences. Estuarine,CoastalandShelfScience, 40(1),339–356. Kalantzi,I.,&Karakassis,I.(2006).Benthicimpactsoffishfarming:Meta-analysisofcommunityandgeochemicaldata. MarinePollutionBulletin, 52,484–493. Kearney,J.(2010).Foodconsumptiontrendsanddrivers. PhilosophicalTransactionsoftheRoyalSocietyB, 365,2793–2807. Klaoudatos,D.,Klaoudatos,D.,Smith,J.,Bogdanos,K.,&Papageorgiou,E.(2006).Assessmentofsitespecificbenthicimpact offloatingcagefarmingintheeasternHiosIsland,easternAegeanSea,Greece. JournalofExperimentalMarineBiology andEcology, 338,96–111.
Knapp,A.,Sigman,D.,&Lipschultz,F.(2005).NisotopiccompositionofdissolvedorganicnitrogenandnitrateattheBermudaAtlantictime-seriesstudysite. GlobalBiogeochemicalCycles, 19,1018.
Lester,S.,Gentry,R.,Kappel,C.,White,C.,&Gaines,S.(2018).OffshoreaquacultureintheUnitedStates:Untappedpotentialinneedofsmartpolicy. ProceedingsoftheNationalAcademyofScience, 115(28),7162–7165.
Liao,I.,Huang,T.,Tsai,W.,Hsueh,C.,Chang,S.,&Leano,E.(2004).CobiacultureinTaiwan:Currentstatusandproblems. Aquaculture, 237(1–4),155–165.
López,B.,Bunke,M.,&Shirai,J.(2008).MarineaquacultureoffSardiniaIsland(Italy):Ecosystemeffectsevaluatedthrougha trophicmass-balancemodel. EcologicalModeling, 212,292–303.
Machias,A.,Giannoulaki,M.,Somarakis,S.,Maravelias,C.,Neofitou,C.,Koutsoubas,D., … Karakassis,I.(2006).Fishfarming effectsonlocalfisherieslandingsinoligotrophicseas. Aquaculture, 261,809–816.
Machias,A.,Karakassis,I.,Labropoulou,M.,Somarakis,S.,Papdopoulou,K.,&Papaconstantinou,C.(2004).Changesinwild fishassemblagesaftertheestablishmentofafishfarmingzoneinanoligotrophicmarineecosystem. Estuarine,Coastal andShelfScience, 60,771–779.
Machias,A.,Karakassis,I.,Somarkis,S.,Giammoulaki,S.,Papadoupoulous,K.,&Smith,C.(2005).Theresponseofdemersal fishcommunitiestothepresenceoffishfarms. MarineEcologyProgressSeries, 288,241–250. Macleod,C.,Moltschaniwskyj,N.,&Crawford,C.(2006).Evaluationofshort-termfallowingasastrategyforthemanagementofrecurringorganicenrichmentundersalmoncages. MarinePollutionBulletin, 52,1458–1466. Marba,N.,Santiago,R.,Diaz-Almela,E.,Alvarez,E.,&Duarte,C.(2006).Seagrass(Posidoniaoceanica)verticalgrowthasan earlyindicatoroffishfarmderivedstress. Estuarine,CoastalandShelfScience, 67,475–483. Mazzola,A.,Mirto,S.,&Danovaro,R.(1999).Initialfish-farmimpactonmeiofaunalassemblagesincoastalsedimentsofthe WesternMediterranean. MarinePollutionBulletin, 38(12),1126–1133.
McKee,B.,Aller,R.,Allison,M.,Bianchi,T.,&Kineke,G.(2004).Transportandtransformationofdissolvedandparticulate materialsoncontinentalmarginsinfluencedbymajorrivers:Benthicboundarylayerandseabedprocesses. Continental ShelfResearch, 24,899–926. NationalOceanicandAtmosphericAdministration.(2018). Currentfisherystatistics2017-2:ImportsandExportsofFishery ProductsAnnualSummary,2017Revised. Retrievedfromhttp://www.st.nmfs.noaa. gov/Assets/commercial/trade/Trade2014.pdf
Neofitou,N.,&Klaoudatos,S.(2008).Effectoffishfarmingonthewatercolumnnutrientconcentrationinasemi-enclosed gulfoftheEasternMediterranean. AquacultureResearch, 39(5),482–490. Nieuwerburgh,L.,Wänstrand,I.,&Snoeijs,P.(2004).GrowthandC:N:PratiosincopepodsgrazingonN-orSi-limitedphytoplanktonblooms. Hydrobiologia, 514,57–72. Parsons,T.,Harrison,P.,&Waters,R.(1978).Anexperimentalsimulationofchangesindiatomandflagellateblooms. Journal ofExperimentalMarineBiologyandEcology, 32,285–294.
Pitta,P.,Apostolaki,E.,Giannoulaki,M.,&Karakassis,I.(2005).Mesoscalechangesinthewatercolumninresponsetofish farmingzonesinthreecoastalareasintheeasternMediterraneanSea. Estuarine,CoastalandShelfScience, 65,501–512.
Pitta,P.,Apostolaki,E.,Tsagaraki,T.,Tsapakis,M.,&Karakassis,I.(2006).Fishfarmingeffectsonchemicalandmicrobialvariablesofthewatercolumn:Aspatio-temporalstudyalongtheMediterraneanSea. Hydrobiologia, 563,99–108. Pitta,P.,Karakassis,I.,Tsapakis,M.,&Zivanovic,S.(1999).Naturalvs.maricultureinducedvariabilityinnutrientsandplanktonintheeasternMediterranean. Hydrobiologia, 391,181–194.
Pitta,P.,Tsapakis,M.,Apostolaki,E.,Tsagaraki,T.,Holmer,M.,&Karakassis,I.(2009). ‘Ghostnutrients’ fromfishfarmsare transferredupthefoodwebbyphytoplanktongrazers. MarineEcologyProgressSeries, 374,1–6.
Porello,S.,Tomassetti,P.,Manzueto,L.,Finoia,M.,Persia,E.,Mercatali,I.,&Stipa,P.(2005).Theinfluenceofmarinecages onthesedimentchemistryintheWesternMediterraneanSea. Aquaculture, 249,145–158.
Reid,G.,Liutkus,M.,Bennet,A.,Robinson,S.,MacDonald,B.,&Page,F.(2010).Absorptionefficiencyofbluemussels(Mytilusedulis and M.trossulus)feedingAtlanticsalmon(Salmosalar)feedandfecalparticulates:Implicationsforintegrated multi-trophicaquaculture. Aquaculture, 299,165–169.
Richardson,A.,Bakun,A.,Hays,G.,&Gibbons,M.(2009).Thejellyfishjoyride:Causes,consequencesandmanagement responsestoamoregelatinousfuture. TrendsinEcology&Evolution, 24(6),312–322.
Ruiz,J.,Marco-Mendez,C.,&Lizaso,J.(2009).Remoteinfluenceofoff-shorefishfarmwasteonMediterraneanseagrass (Posidoniaoceanica)meadows. MarineEnvironmentalResearch, 69,118–126. Ryther,J.(1969).Photosynthesisandfishproductioninthesea. Science, 166(3901),72–76.
Sanderson,J.,Cromey,C.,Dring,M.,&Kelly,M.(2008).Distributionofnutrientforseaweedcultivationaroundsalmon cagesatfarmsitesinnorth-westScotland. Aquaculture, 278,60–68.
Sarà,G.(2007).Ameta-analysisontheecologicaleffectsofaquacultureonthewatercolumn:Dissolvednutrients. Marine EnvironmentalResearch, 63,390–408.
Sarà,G.,LoMartire,M.,Sanfilippo,M.,Pulicanò,G.,Cortese,G.,Mazzola,A., Pusceddu,A.(2011).Impactsofmarineaquacultureatlargespatialscales:Evidencesfromnandpcatchmentloadingandphytoplanktonbiomass. MarineEnvironmentalResearch, 71(5),317–324.
Schendel,E.,Nordström,S.,&Lavkulich,L.(2004).Flocandsedimentpropertiesandtheirenvironmentaldistributionfroma marinefishfarm. AquacultureResearch, 35(5),483–493.
Solorzano,D.,&Sharp,J.(1980).Determinationoftotaldissolvednitrogeninnaturalwaters. LimnologyandOceanography, 25,751–754.
Soto,D.,&Norambuena,F.(2004).Evaluationofsalmonfarmingeffectsonmarinesystemsintheinnerseasofsouthern Chile:Alarge-scalemensurativeexperiment. JournalofAppliedIchthyology, 20(6),493–501.
Vezzulli,L.,Moreno,M.,Marin,V.,Pezzati,E.,Bartoli,M.,&Fabiano,M.(2008).Organicwasteimpactofcapture-based AtlanticbluefinetunaaquacultureatanexposedsiteintheMediterraneanSea. Estuarine,CoastalandShelfScience, 78, 369–384.
Wildish,D.,Keizer,P.,Wilson,A.,&Martin,J.(1993).Seaso nalchangesofdissolvedoxygenandplantnutrientsinseawaternearsalmonidpensinthemacrotidalBayofFundy. CanadianJournalofFisheriesandAquaticSciences , 50(2), 303–311.
Wu,R.,Lam,K.,MacKay,D.,Lau,T.,&Yam,V.(1994).Impactofmarinefishfarmingonwaterqualityandbottomsediment: Acasestudyinthesub-tropicalenvironment. MarineEnvironmentResearch, 38(2),115–145.
SUPPORTINGINFORMATION
AdditionalsupportinginformationmaybefoundonlineintheSupportingInformationsectionattheendofthe article.
Howtocitethisarticle: WelchAW,KnappAN,ElTourkyS,DaughteryZ,HitchcockG,BenettiD.Thenutrientfootprintofasubmerged-cageoffshoreaquaculturefacilitylocatedinthetropicalCaribbean. JWorld AquacultSoc.2019;1–18. https://doi.org/10.1111/jwas.12593