QUARTER 1, 2026

QUARTER 1, 2026
January to March, 2026



We would like to acknowledge the Traditional Owners of the land upon which we work, learn and play: the Wurundjeri Woi-wurrung people of the Kulin Nation.
We pay our respects to all First Nations Elders, past and present, for they hold the memories, the traditions, the culture and the hopes of First Nation Australians.
We express our gratitude for their continued contributions to our learning and for their continued willingness to partner with us on our reconciliation journey.
We commit to honouring and respecting the connection First Nation Australians have with the beautiful land upon which this school is built, to extending and strengthening our relationships with First Nation Australians, to listening to their voices and to taking action that will lead to positive change.
Th s Quarter 1, 2026 Susta nabil ty Report tracks Camberwe l Grammar School s progress towards achieving ts quarter and annual Net Zero by 2030 commitment and compar ng Year-over-Year (YOY) trends The report provides analysis w th n s x core sector areas: Energy (E ectric ty, Solar and Gas), Transport (Road and Air), Resource Recovery (Landf ll and Recycl ng), Sustainab e Purchas ng & Procurement (Paper), Water Conservation, and Biod vers ty Improvement
Each sector's targets are aligned with the Net Zero by 2030 goals The new quarter y target is ca culated as a proportion of the annual target based on the 2024/2025 average consumption for that specific quarter. This methodology ensures a more rea istic context for evaluating resource consumption and target performance Whi e the u t mate Net Zero targets remain aggressive, analysing YOY trends prov des critica nsight nto the impact of strategic operational planning and behaviour impacts for each sector n rea t me
Q1 2026 em ssions total ed 359 tCO2e, driven pr mar ly by Solar LGCs (71 59%), fol owed by Gas (13 65%), Landfi l (6 13%), Transport (5 01%), and Water (3 62%)
Year-over-Year Trends
The sectors trending favourably due to consumption reduction compared to Q1, 2025 include:
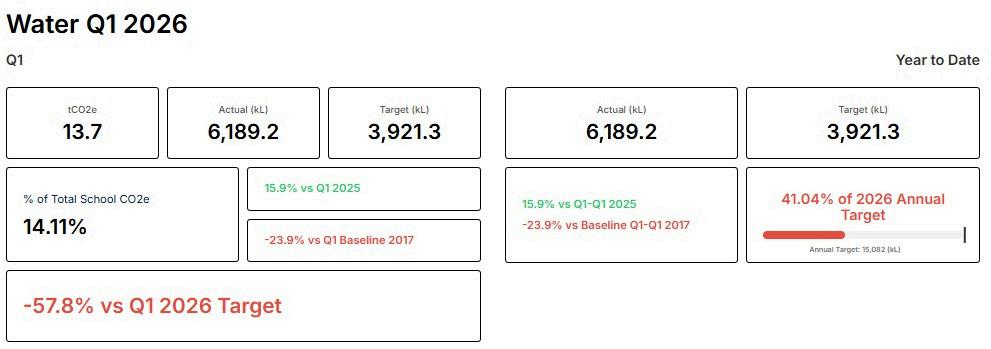
Water: 15% reduction through efficient irr gation and respond ng to SWEP alerts.
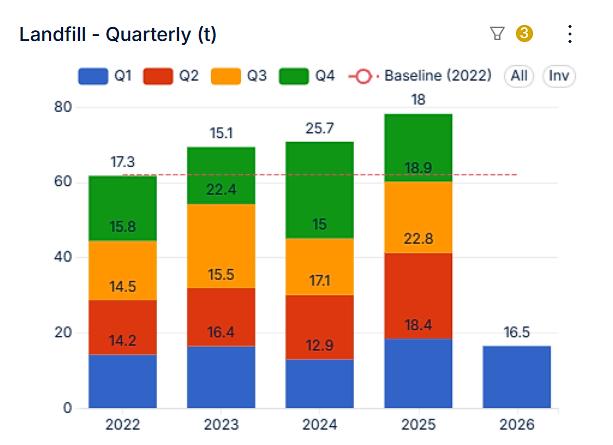
Landfill: A 10 7% waste reduction was achieved this quarter through the facil t es team's furniture rehom ng efforts, reduc ng skip usage from three to one year-over-year.
Biodiversity: 0% (no change) due to B od vers ty Audit to be comp eted in Q3, 2026
The sectors nearing a positive trend (<2% increase) compared to Q1, 2025 inc ude:
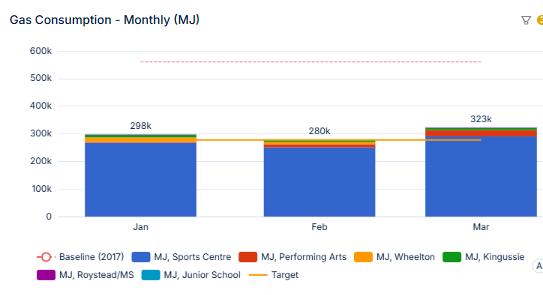
Gas: Overa l gas usage rose just 0.1%, as consumption decreased across most bui d ngs but increased 7% n the Sports Centre (th s increase in under invest gation)
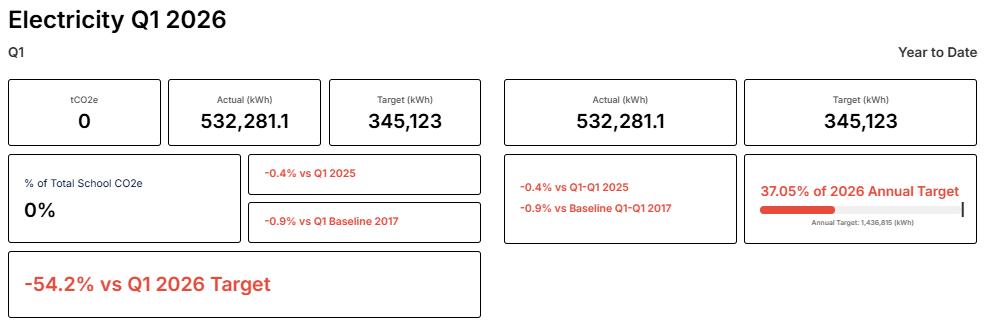
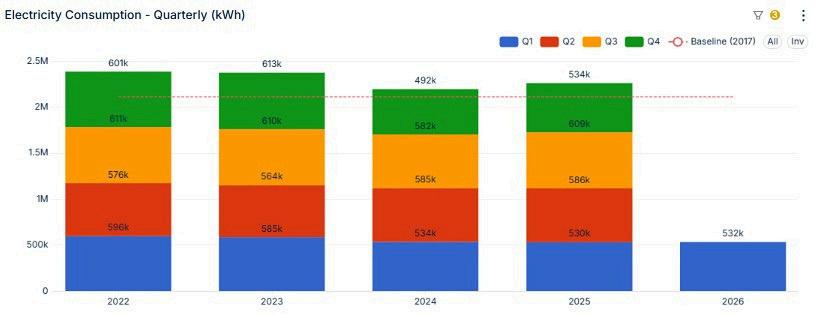
Electricity: Th s 0.4% YoY ncrease s m nima cons der ng late-2025 electr fication pro ects, primarily because warmer weather reduced March heating demand
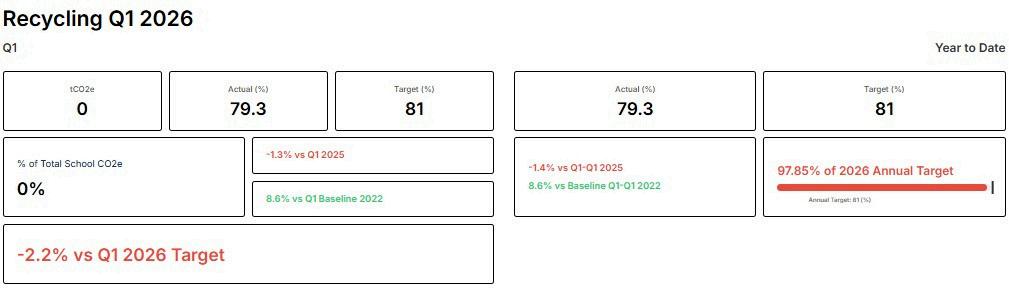
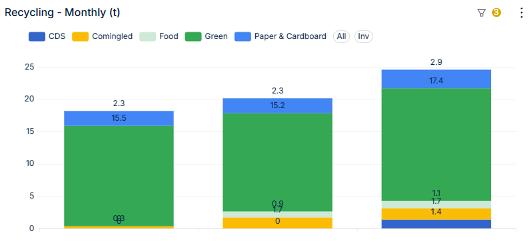
Recycling waste: Overall recycl ng rates decreased by 1.3% year-over-year, althoguh we d d see m nor increases in paper, CDS, and food waste (but a reduction in green waste tota )
The Sectors trending unfavourably due to consumption increases (>2% increase) compared to Q1, 2025 inc ude:
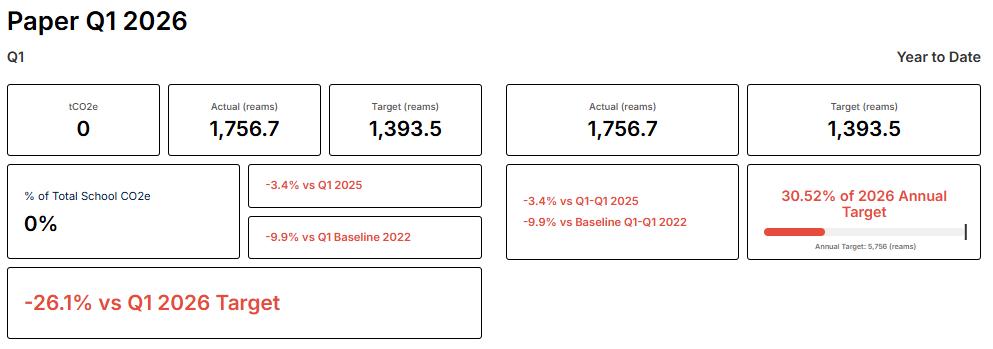
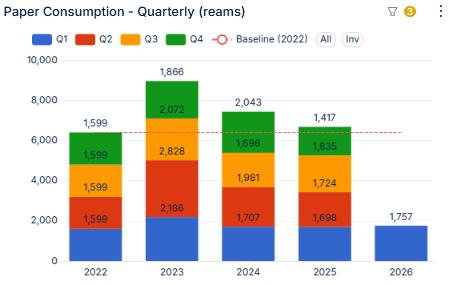
Purchasing & Procurement (Paper): A 3.4% ncrease due to in-house printing ncreasing, requiring further ana ysis of pr nt ng hab ts
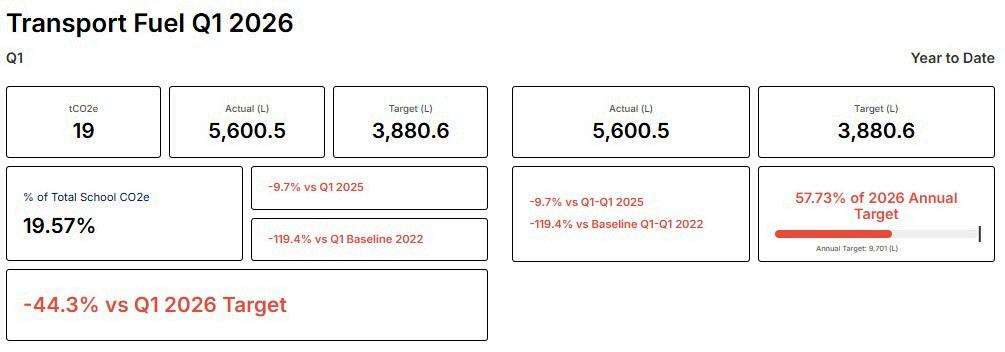
Transport (Road): 9.7% ncrease due to increased camps and road tr ps n Term 1. Net Zero by 2030 Performance
The sectors on track or performing to the Q1 target include:
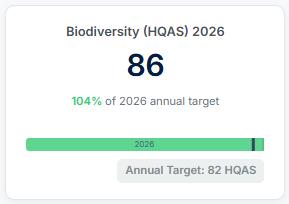
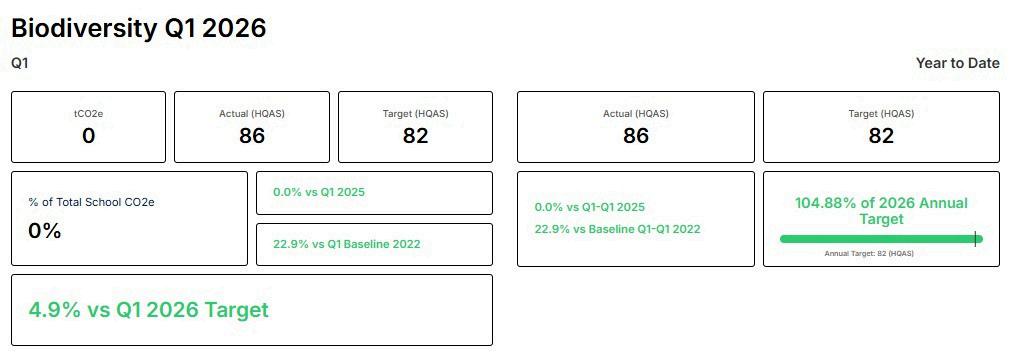
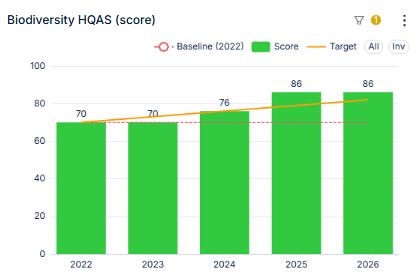
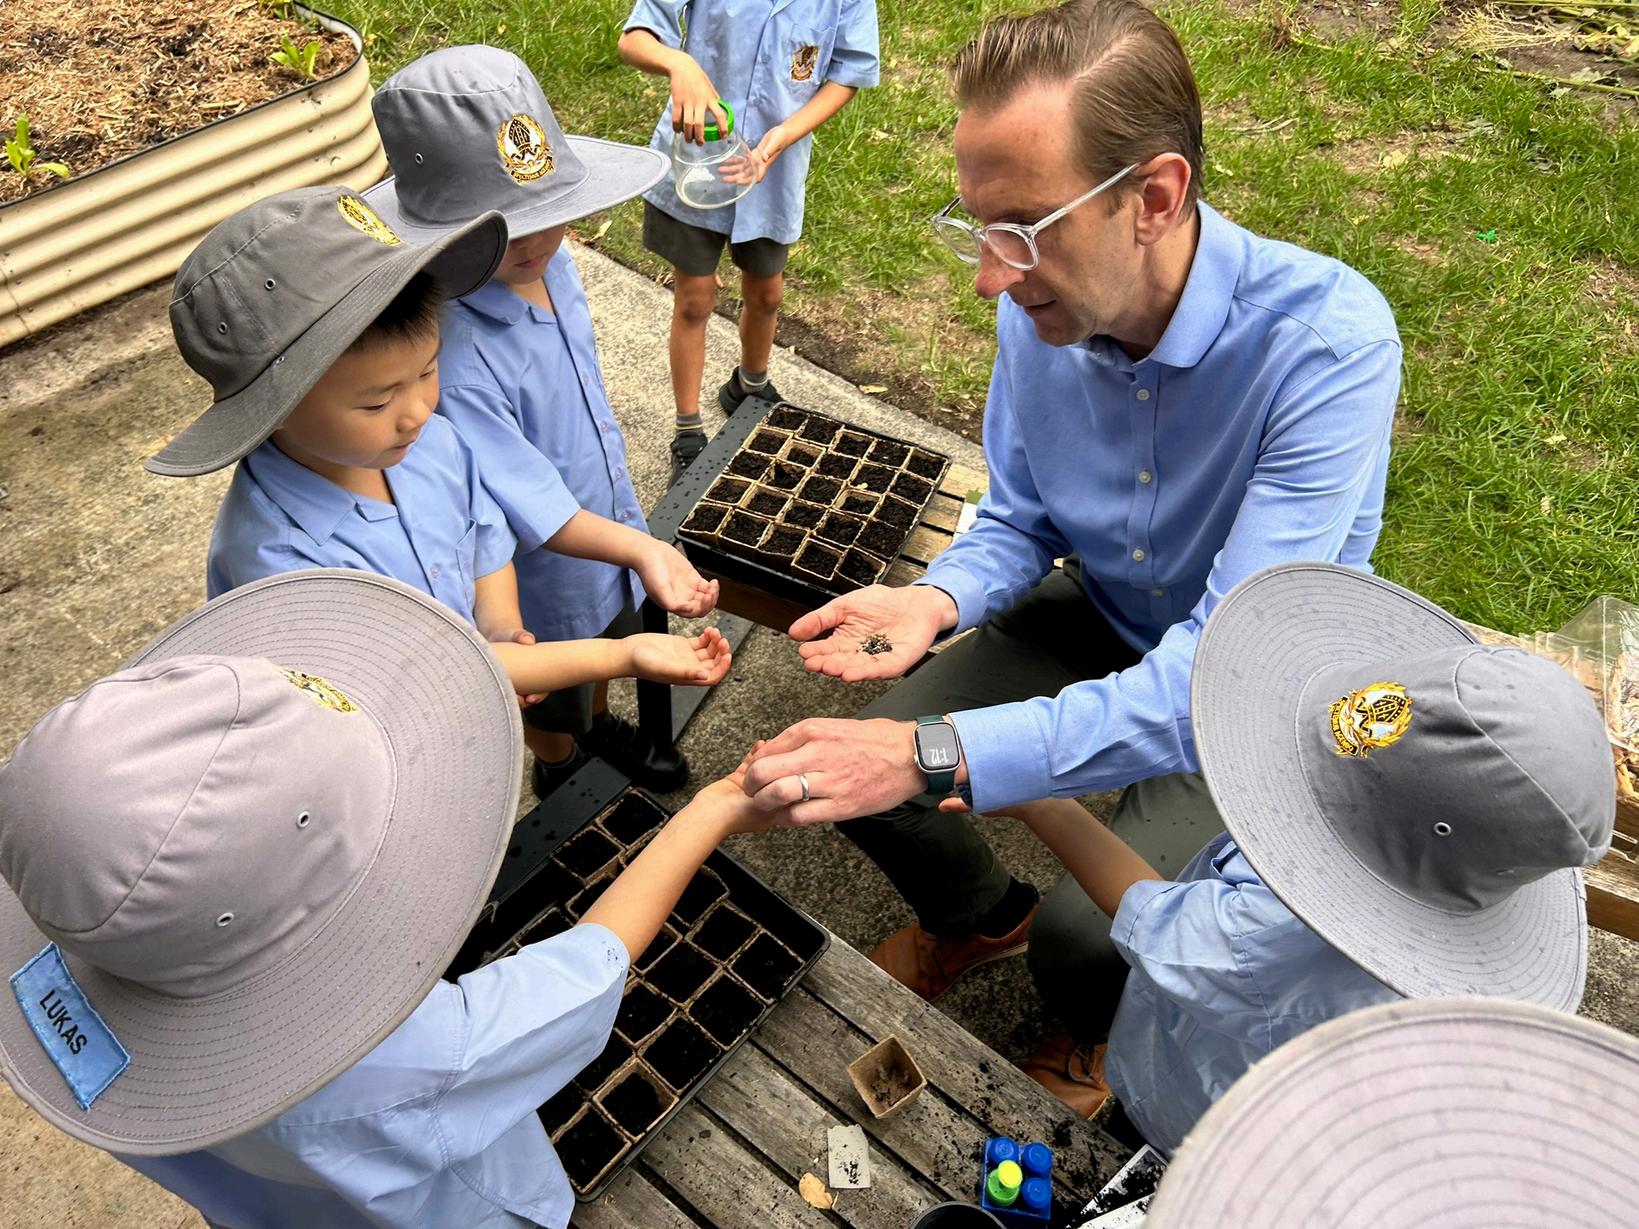
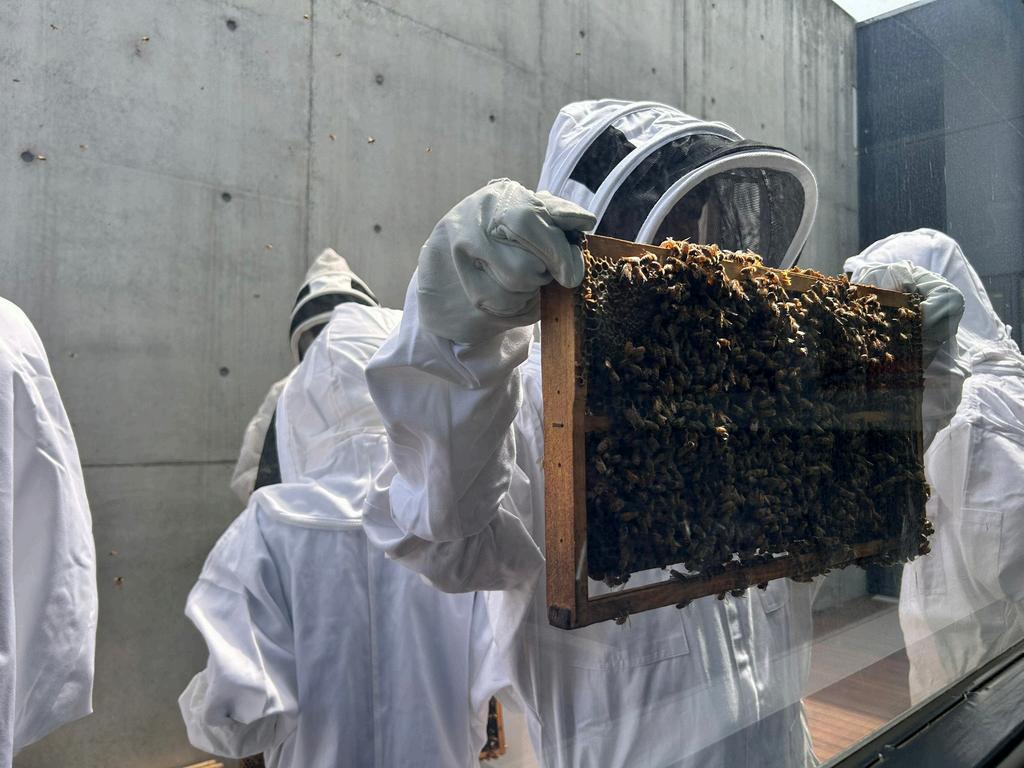
Biodiversity: The Habitat Quality Score (HQAS) is 86, 4 9% above the annua target of 82 During Q1, 2026 Roystead garden bed p anting included 108 natives and 40 non-native plants occurred The HQAS is carried over from 2025, and a Term 3 audit will determ ne the revised 2026 HQAS.
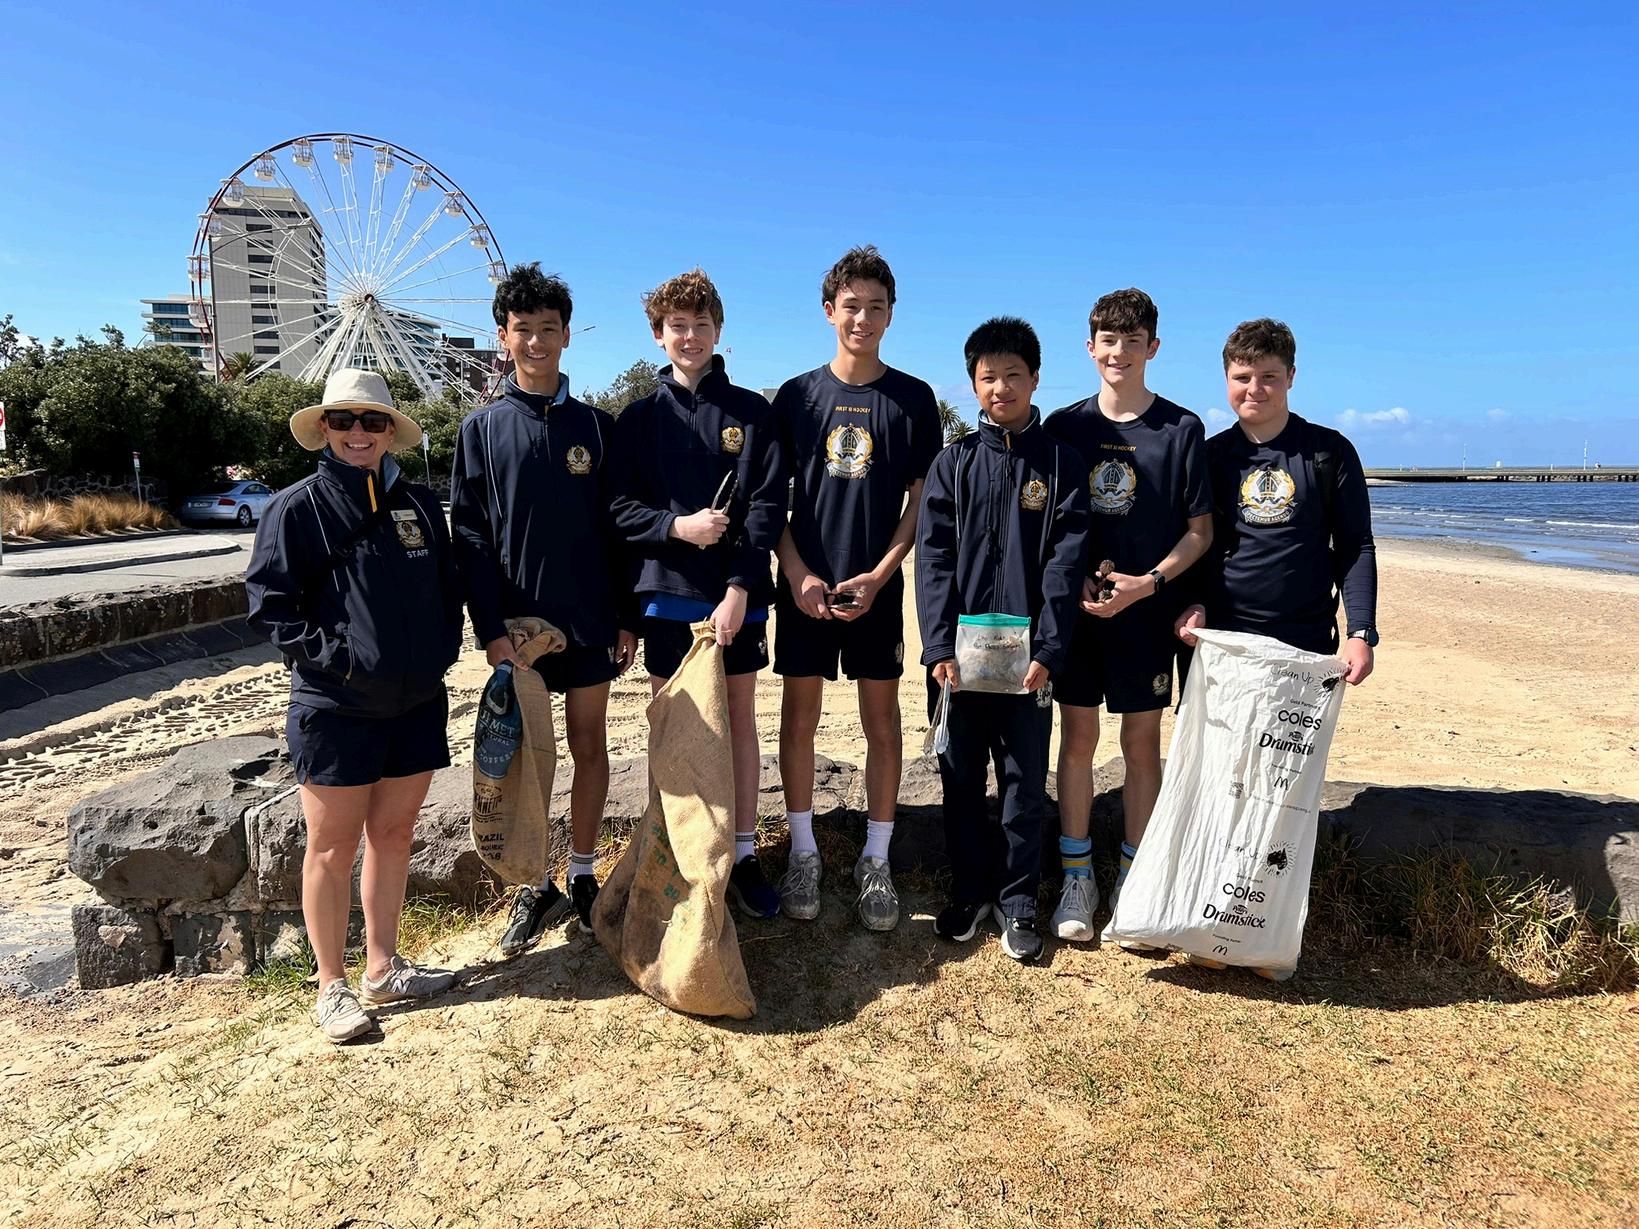
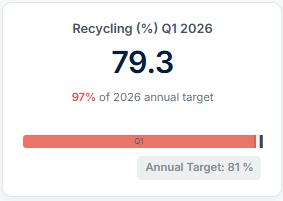
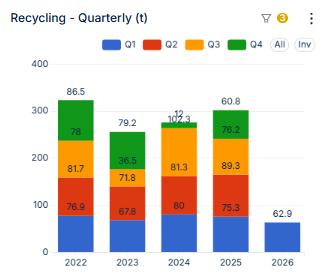
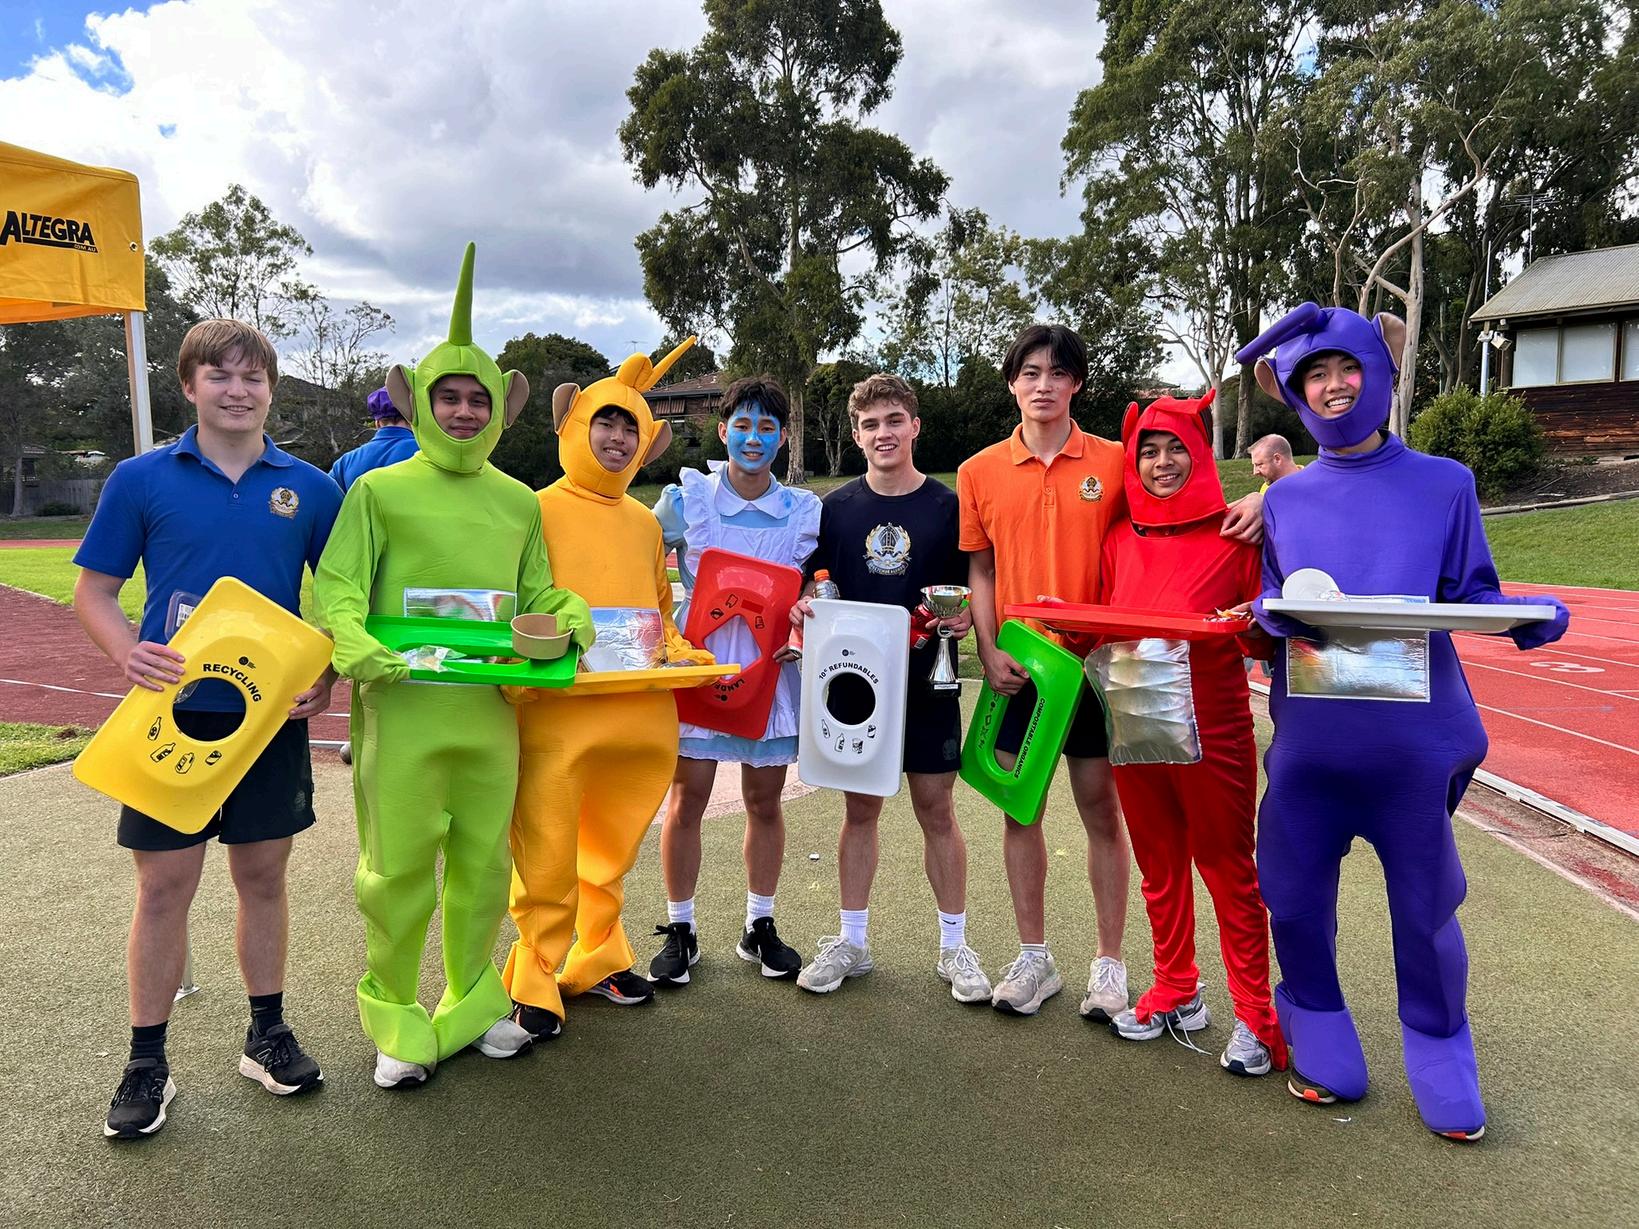
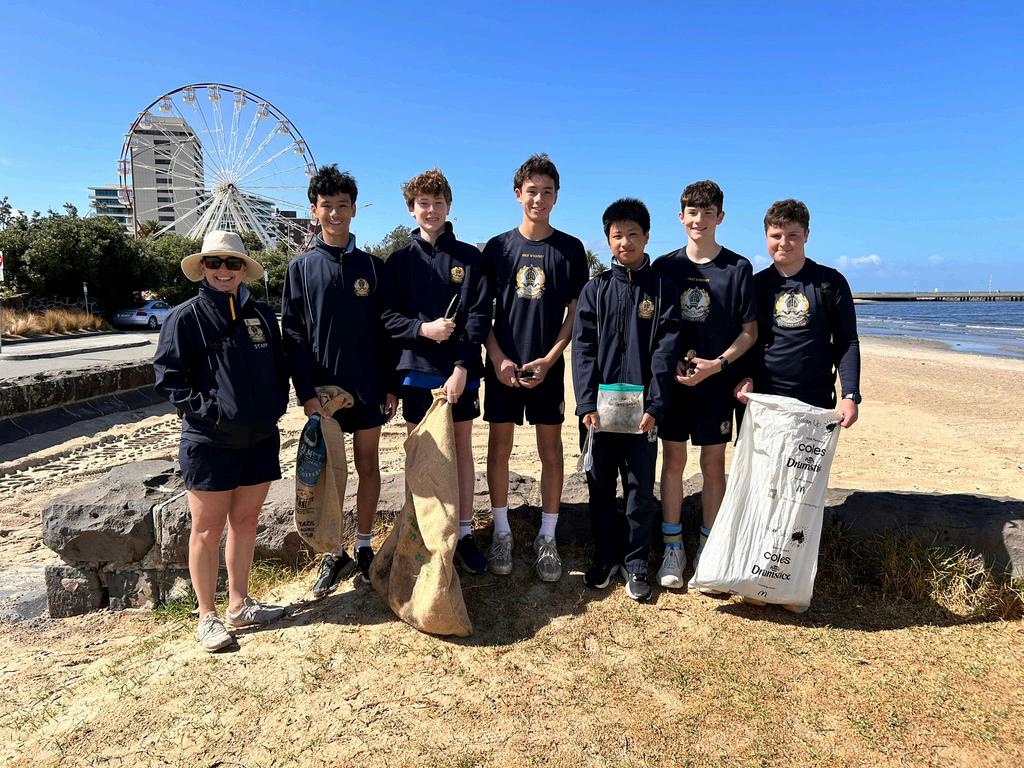
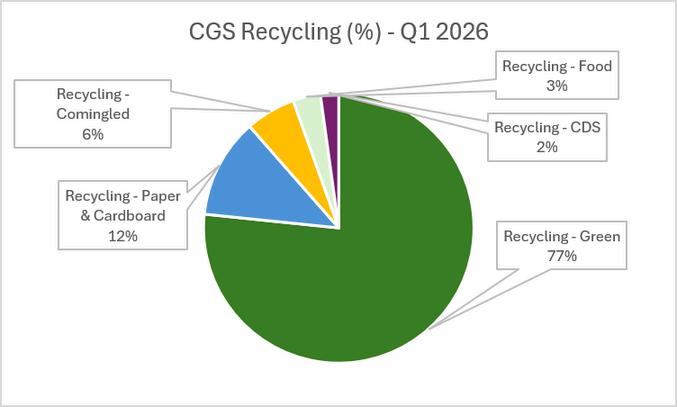
Resource Recovery - Recycling: 79.3% of total waste was recycled in Q1 2026. Recyc ing reached 62.9 tonnes, narrowly missing the 81% target by 2 2% Green waste led recovery (48 2t) but dropped 24% year-on-year, dr ving a 1.4% overall recycl ng decline. This was offset by a 20% surge in paper/cardboard (7.5t). Comingled (3.77t) increased by 2% and the container deposit col ect on gained momentum, rais ng $138 revenue for Towards2050 sustainab lity student group.
The sectors underperforming to the Q1 target include:
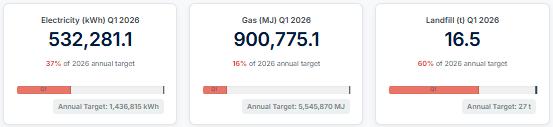
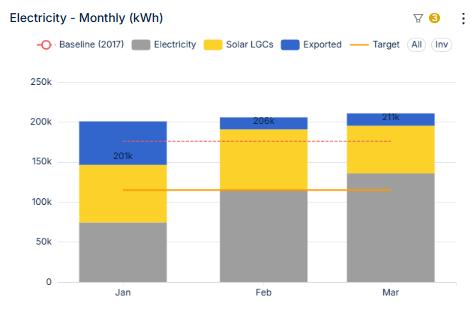
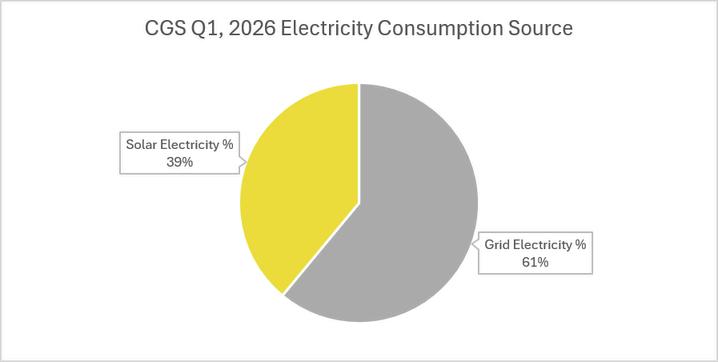
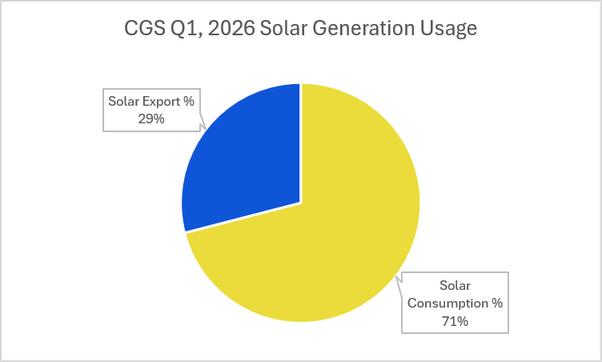
Electricity: Consumption reached 532,281 kWh, exceed ng the Q1 target by 54 2% and rising 0 4% YoY This accounts for 37% of the annua target. Ons te solar generated 292,374 kWh, 39% of this was uti ised on campus and 29% was exported to the grid (primarily n January)
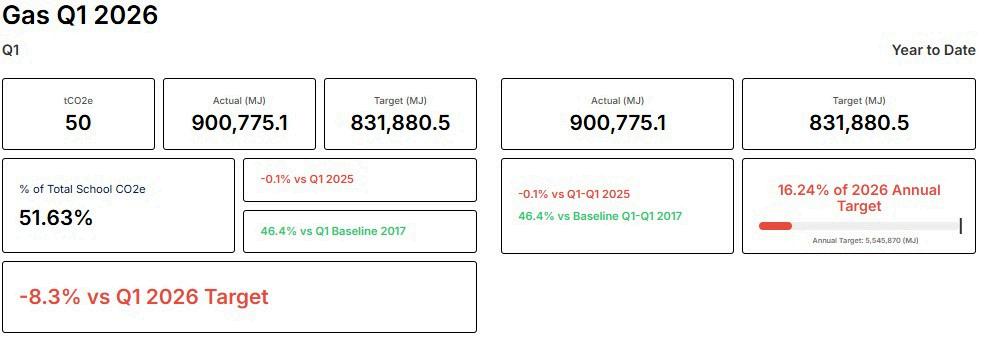
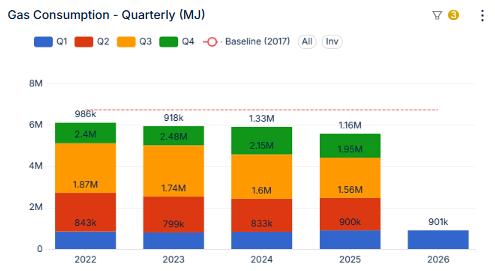
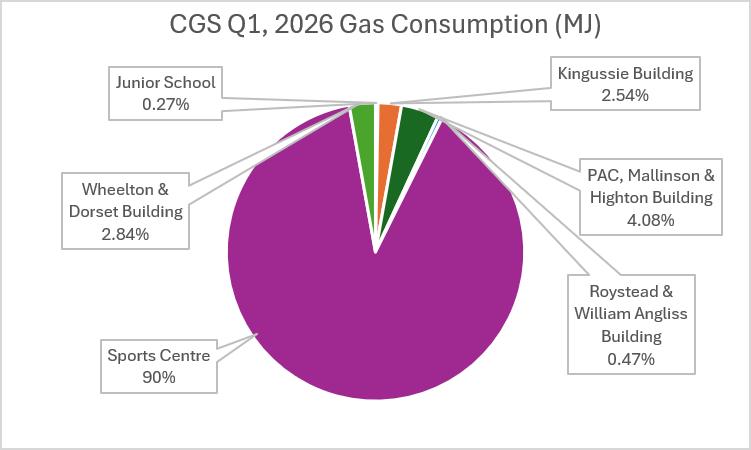
Gas: 900,775 MJ of gas was consumed, underperforming the quarter target by 8 3% Quarter-on-quarter trend saw minima change, with 0 1% ncrease from Q1, 2025 The Sports Centre consumed 90% of tota Q1 usage, fol owed by PAC/Mall nson/H ghton (4.1%), Whee ton (2.8%), Kingussie (2.4%), Roystead (0.4%) and Jun or School (0.3%). 16% of the annual gas target has been used
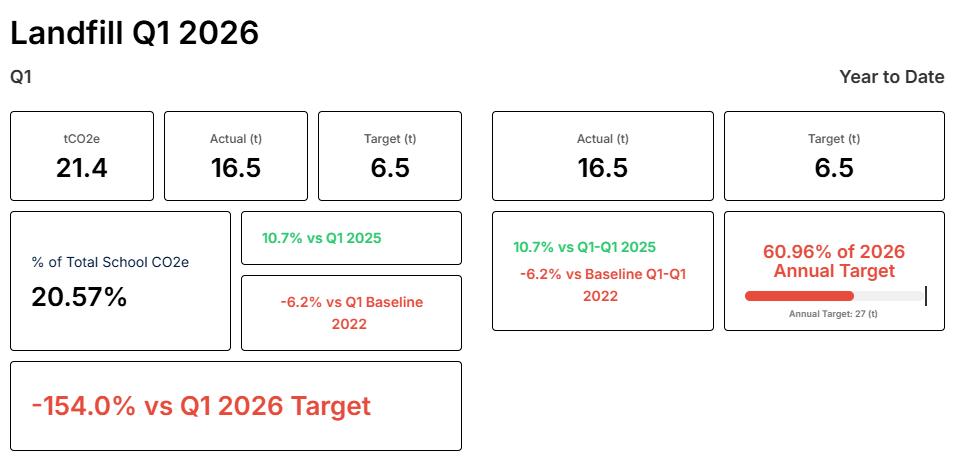
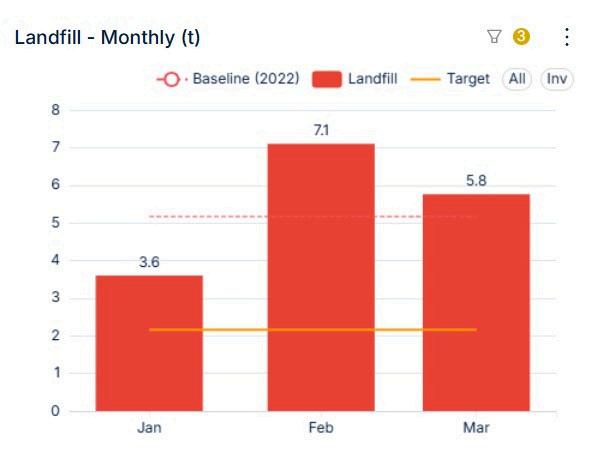
Landfill: 16 5 tonnes of landfi l was col ected, 10 tonnes more than the Q1 target of 6 5 tonnes Landfi l is the most underperforming sector, overshooting the target by 154%. Of the 77.97 tonnes of tota waste collected, andfil made up 21% The first quarter has used 61% of the annual 27-tonne landfill al owance
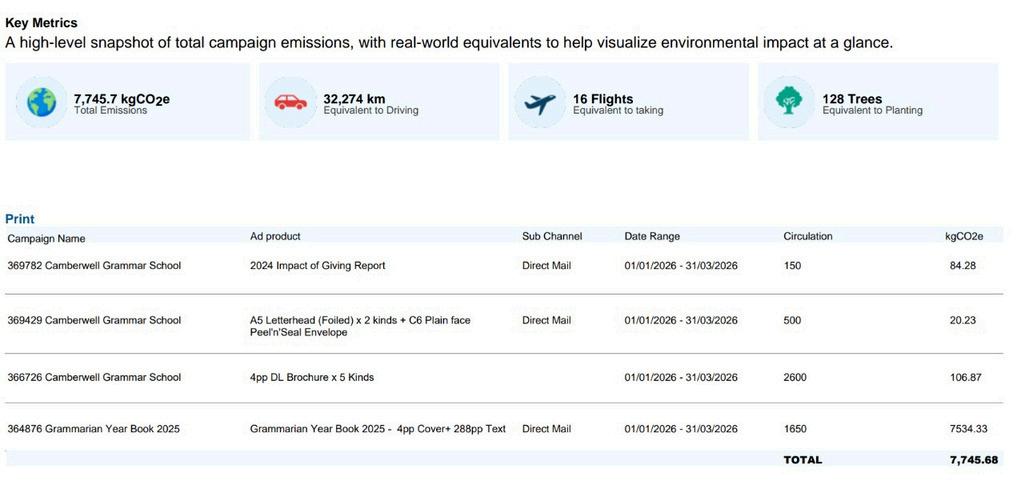
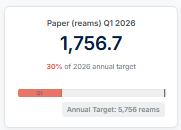
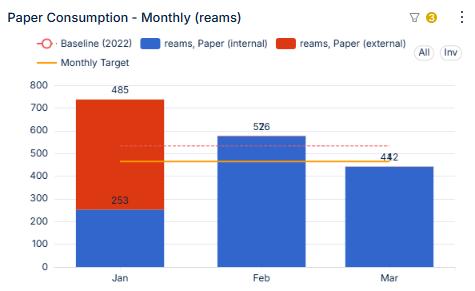
Purchasing & Procurement (Paper): Paper consumpt on hit 1,757 reams n Q1, m ssing the 1,393 5 reams Q1 target by 26.1%. Interna printing rose 6.7% to 1,270 reams (72% of total). External printing fe l 4% year-over-year, aided by reducing the volume of printed Grammarian’s by five hundred copies a ongs de sma ler pr nt obs Q1 paper consumption has used 30% of annua paper target.
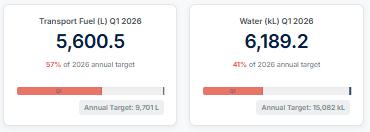
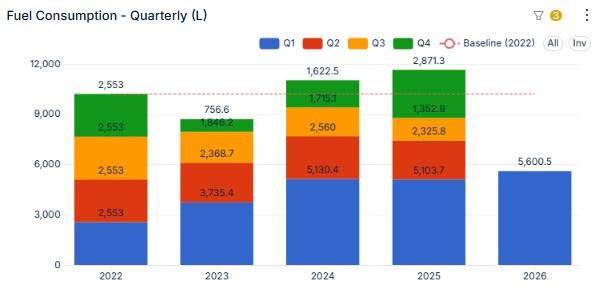
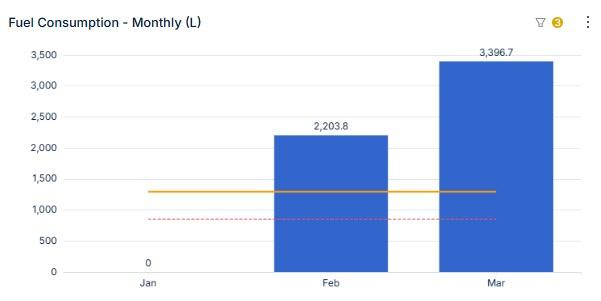
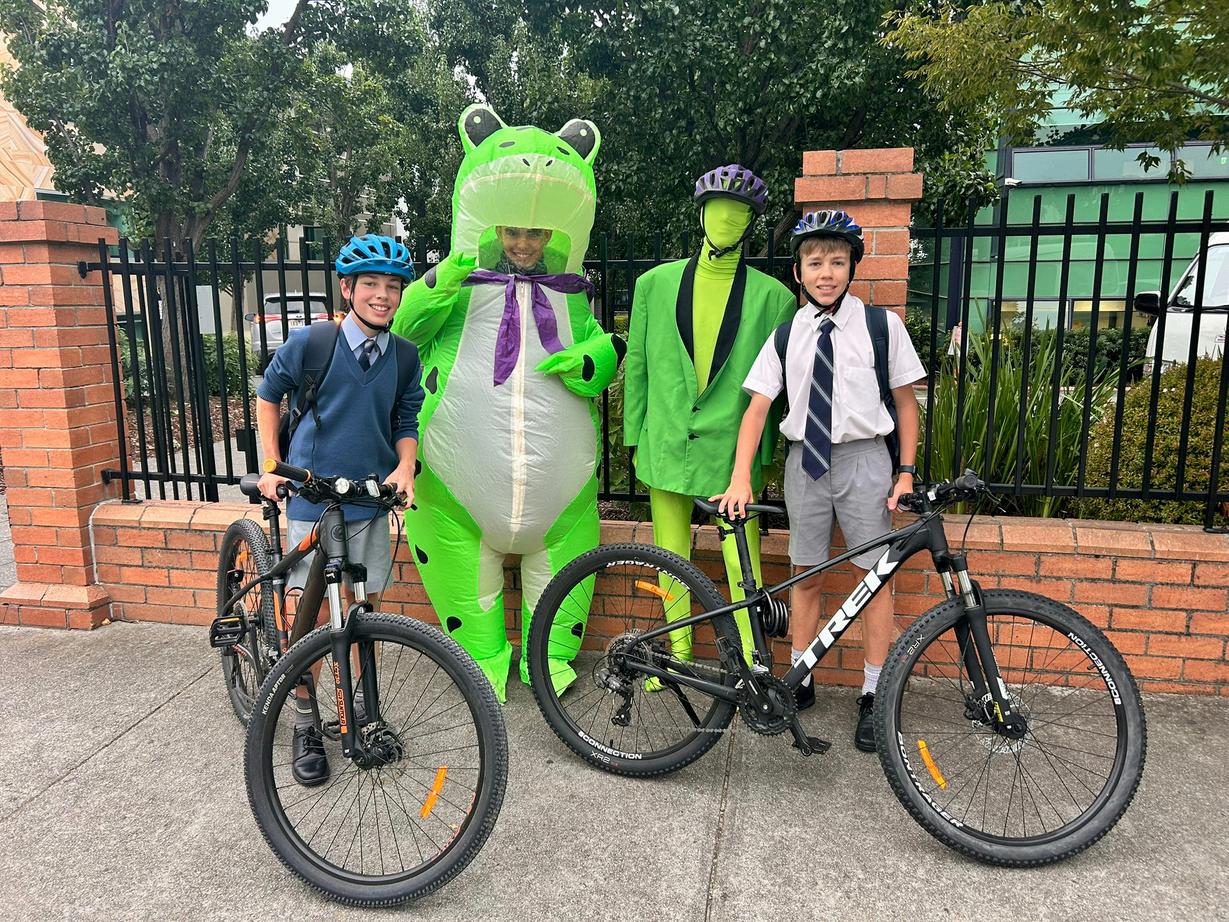
Transport: Q1 road trip fuel usage hit 5,600 L, exceeding the 3,880.6 L Q1 target by 44.3% and rising 9.7% year-overyear Th s increase was dr ven by Jun or School Anglesea camp and Term 1 excursions The increase accounts for 300 add t onal students traveling a total of an additional 1,000 km and consuming approx mately 600 L more than Q1 2025. 57% of the annua target has been used
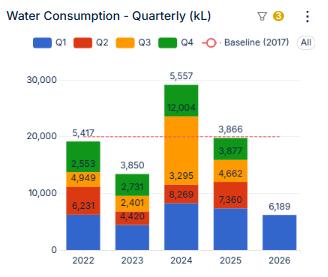
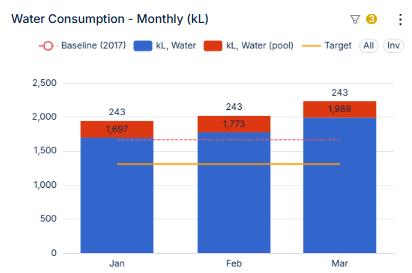
Water: 6,189 2 kL of water was consumed n Q1, miss ng the 3,921 3 kL Q1 target by 57 8% Although the period had lower than average rainfall and h gher than average temperature, efficient rr gation and rapid responses to SWEP not fications drove a 15 9% reduct on in usage compared to Q1 2025 41% of annua water target has been ut lised
Air travel emiss ons are current y addressed through offsetting rather than reduction targets to pr oritise in-person student learning and staff development. Consequently, having no air transport trips or tours in Q1 2026 resulted n 0 tCO2-e offsets. Eastern Press is a carbon neutral printer engaged to complete large CGS pub ication print ng
This report out ines sector consumption and targets, compar ng the current quarter to the previous quarter and basel ne years For detailed data assumptions, p ease refer to the Appendix
Year-over-Year Trending Performance in Q1 2026
Favourable Trend Vs Q1 2025
Adverse Trend vs. Q1 2025
Year-Over-Year Performance

On track against Q1 Targets
Tracking behind Q1 Targets
Net Zero Performance
Electricity: Because the schoo 's grid electricity is 100% renewable, the on y emissions recorded under electr city come from solar generation where the arge Scale Cert ficates (LGCs) were sold Paper & Printing: While outsourced print ng through Eastern Press is ful y offset, internal in-house pr nting is a known gap that is not yet captured in the Scope 3 nventory. Travel: Air transport emissions were zero for Q1 2026 simply because no flights were booked during this period, mean ng no Greenfleet offsets needed to be triggered.
Biodiversity Q1, 2026
School

2017 Grid electr c ty - quar er y data estimated from annual total.
2017 No so ar pane s n p ace ( nstalled in 2018)
2021 Grid electr c ty - quar er y data estimated from annual total
2021 Solar se f-consumpt on e ectrici y use is associated with grid-equ va ent CO2e emiss ons as school s sel ing al as LGCs. Applies to subsequen years.
2021 Using 80/20% solar sp it for self-consumption/export based on 2019 CGS Energy Ana ysis data - Sharepoint 2019 (see CGS Susta nab l ty Drive)
2022 From 2022, grid electricity is 100% Green power, hence 0 assoc ated CO2 emiss ons App ies to subsequent years data and targets
2022 Using solar spli of 75/25% for se f consump ion/export based on 2022 solar data sent by CGS in May 2023
2024 Q1 data upda ed based on RACV da a prov ded by Jo ema l on June 17 (CGS Data Summaries for Report ng - So ar Data for Report ng - Column B) using 2023 self-consumption/export sp it (69 87%/30 13%)as RACV consumption/export data unrel able due to outage where Sports Centre usage was excluded from those Q1 figures.
2024 Using 2023 emiss on factors as 2024 not yet avai able
2024 Target includes grid and solar e ectr c ty use Solar target based off 2021 generation and 2023 solar spl t se f-cons/export
2025 Solar data down oaded from Fron us dashboard & ENGIE dashboard provides real-t me data analysis. ENGIE d gital b l uploaded to Tre lis Technologies for testing. Solar LGCs emissions calculat on be ng determined.
2026 NGA Factor Scope 2 & 3 used to determine So ar LGC emiss on calcula ion n-house ENGIE & CGS So ar Production uploaded to Trel is Technolog es and transferred to CGS Dashboard for ana ysis and report ng
2018 Us ng 2018 em ssion factors Quar er y data estimated from RSS annual total
2021 Quarter y data estimated from RSS annual to al Using 2021 emiss on factors
2021 M3 data from waste contractor and us ng dry waste density to convert to weigh . Quarter y da a est mated from annual total. Using 2021 em ssion factors.
2022 2022 is now basel ne and start ng po nt for target reduction unt l 2030
2022 Ca cu ated from RSS monthly volume us ng 70kg/m3 density fac or (dry waste). Using 2022 emiss on factors.
2023 September nc udes a 9m3 ad hoc skip or renovat on waste - us ng assoc ated dens ty and em ssion factor for Construction and Demol tion' waste, respec ively 1.1 t/m3 and 0.2 tCO2/ .
2023 Weight obtained from waste contractor from August.
2023 Ca cu ated from RSS monthly volume us ng 70kg/m3 density fac or (dry waste) Using 2022 emiss on factors
2024 Weight rom Veo ia unava lable for Q1 - calculat ng from RSS monthly volume and using 70kg/m3 densi y factor instead Us ng 2023 emiss ons factors unt l 2024 is pub ished
2025 Landfi l (tonnage) from Veo ia Eco og c Dashboard - move away from volume (m3) for more accurate report ng. Tria l ng Trell s Techno og es for data centralisat on.
2026 Landfi l data downloaded from Veo ia Eco ogic Dashboard and uploaded to Tre lis Technologies Per odic reporting transferred to CGS Sustainab l ty Dashboard for ana ysis and reporting
2026 Q1 - One bulk skip co lected building materia s
2021 Landfi l annua tota from was e contractor (m3) and using dry waste dens ty to convert to we ght Recycl ng estimated from RSS annual total volumes and convert ng to we ght w th waste stream density Quarter y data est mated from annua tota s.
2022 Landfi l ca cu ated from RSS monthly volume us ng 70kg/m3 density fac or (dry waste) Recycl ng calcu ated from RSS monhtly tota recyc ing vo umes and using weighted average of waste dens ty of recycl ng m x (2022 and Q1, Q2 2023) 160 kg/m3
2022 2022 is now base ine and starting point or target reduct on unti 2030 - as 2017/2018 was incomp ete/not representa ive
2023 Landfi l September includes a 9m3 ad hoc sk p for renovation waste - using associated density and emiss on factor for 'Construc ion and Demo it on was e, respective y 1.1 t/m3 and 0.2 tCO2/t.
2023 No Green Was e data for December from CGS waste contractor, us ng RSS volume instead and green waste dens ty
2023 Landfi l weight obtained from waste contractor from August.
2023 Recyc ing weight obtained from waste contractor from July 2023 for al except food waste Food waste calculated from RSS volume and using food waste dens ty to ca cu ate we ght Appl es to Q3 and Q4
2023 Landfi l ca cu ated from RSS monthly volume us ng 70kg/m3 density fac or (dry waste) Recycl ng calcu ated from RSS monhtly tota recyc ing vo umes for Q1 & Q2 and using weighted average of waste dens ty of recycl ng mix (2022 and Q1, Q2 2023) 160 kg/m3.
2024 Weight from Veol a unavai ab e for Q1 so using industry waste dens ties to ca cu ate from volumes on RSS instead The sma l amount o organics co lected ast days of January were mixed w th GRW
2025 Recyc ing data down oaded from Veo ia Ecolog c Dashboard and up oaded to Tre l s Techno ogies Per od c report ng trans erred to CGS Sustainabi ity Dashboard for ana ysis and report ng CDS introduced as ano her recycl ng waste stream. Data recev ed from Return-It via Scouts Victoria Partnersh p.
2026 Downloaded Veolia recyc ing data, up oaded o Tre l s, and trans erred to CGS Dashboard for final reporting and analys s.
2017 Quarterly data estimated from annua tota . Us ng 2017 emission factors.
2017 Includes Panorama buses & Staff dr ven Budget hire (assumed al diese - noting some budget hire are gasol ne) Appl es to al subsequent years
2021 Quarterly data estimated from annua tota Us ng 2021 emission factors
2022 2022 is basel ne year
2022 Monthly estimate based on total yearly l tre usage from panorama and budget h re Us ng 2022 em ssion factors
2023 Monthly estimate ca culated from quarterly tota
2024 March - CGS noted higher L use due to Year 5 Kangaroobie Camp (4186km) , Year 8 Angahook Surf Camp (2652km) & SS athlet cs day (479km)
2024 February - CGS noted h gher L use due to Year 4 Angelsea Camp (915km) AGSV Ki more (864km)
2024 Includes budget and Panorama hire Using average car eff c ency for budget h re
2024 Target - A l road ransport emiss ons to be offset from 2024 (no em ssion associated). Appl es to subsequent years targets.
2025 Panorama and Budget data uploaded with Tre l s Technologies for data centra isation tr al
2026 Budget itres is ca culated in-house (CGS) and up oaded to Tre l s Techno ogies for em ssions calculation Panorama (L) downloaed from Panorama dahsboard
2021 No a r travel hat year
2022 No a r travel hat year
2023 Monthly data estimated from quarter y total
2023 Student trips - 2023 s base ine year
2023 Business tr ps - 2023 s base ine year
2024 A l a r trave transport s offset (Greenfleet carbon offsetting) therefore no em ssion assoc ated
2025 Targets removed from Air Trave Tia l ng Trel is Technolog es or Bus ness Travel da a centra isat on
2026 A r transport em ssions are calcu ated via the ICAO methodology, shared w th Greenfleet for offset ing, and ut l zed by Te lis Technologies for reporting.
2021 Quarterly data est mated from RSS annua total
2022 Paper basel ne s 2022 ac ual as 2017 data was incomplete
2022 Monthly estimate based on otal yearly usage from Premier, Mclures, Finsbury and Eastern press.
2023 McC ures (internal) data provided by CGS Print Room and Eas ern Press (externa ). Ana ysis completed by CERES consu ting.
2024 McC ures (internal) data provided by CGS Print Room and Eas ern Press (externa ) Ana ysis completed by CERES consu ting
2025 McC ures (internal) and Eastern Press (externa ) month y ream totals calculated CGS- n-house Test ng Trel is Technolog es for paper data centra isation, ana ysis and report ng
2026 Paper consumption ca cu ated n-house, up oaded o Tre l s Techno ogies and transpfered to CGS Dashboard for anaylsis and report ng
2026 Eastern Press Q1, 2026 Emiss son Report prov ded “Key Metr cs - Carbon Offsets”.