161
137 167 177
Governor’s Office of Economic Opportunity
158
158
131
14
141
157
129
189
174
187
148
137 143 123 153 Version 1.0 142 142 165 163 173 148 175 134 145
146
174
147
181
OPPORTUNITY FRAMEWORK
116 182
122 131
148
169
136
138 19, 2025 136 November 154
161 Be the place of Foundational Pillars The State of Utah strives to be the nation’s top-performing137 Vision: 158 141 167 116-137 138-143 144-155 156-170 141 157 177 unmatched opportunity 129 economy with unrivaled life quality. The Governor’s Office 131 136 novatio CT 136 138 n 136 154 158 DE 141 137 143 123 153 of Economic Opportunity serves as a guardian of Utah’s 189 174 and146 livability. MA 159 142 142 MD 146 148 174 165 169 163 advance We NH 176 long-term success by focusing on three pillars that drive187 148 Mission: 161 173 137 147 158 148 NJ 143 GOEO 141 175 167 145 Utah’s long-term economic 141 134 RI 137 2.0 157 177 economic success: innovation, capital, and life quality. 129 VT 156 131 181 136 15 and CT 136 138 success116so people 136 154 182 158 DE 141 137 143 122 Success comes from aligning our vision, mission, and 123 153 a 189 * MA 159 l businesses can thrive — 174 142 142 146 L i f eMD 131 146 174 165 guiding principles with actionable focus areas and 10171-189capital, 163 NH 176 through 116-137 138-143 144-155 innovation, 156-170 173 147 148 187 * Includes Human, Physical, 148 NJ 143 175 fostering collaboration among statewide stakeholders. and quality of life. 134 145 RI 137 and Social Capital
u a li t y
I
n
148
158
138-143
Human capital – Support Utah’s young, healthy, and well-educated workforce as a strategic advantage. Physical capital – Continue to prioritize 15 transportation and water infrastructure.
Year-over Job Change
10 collaboration Social capital - Ensure and connectivity between statewide 5 development and regional economic strategies. 0
Projects of statewide significance – Coordinate and advance generational -5 The Point, opportunities, including MIDA, Inland Port, 2034 Olympic and -10 Paralympic Winter Games, and more. Innovation Economy – Be the best -15 in the nation for startups. Support2005 2000 the collaboration of Utah’s universities, industry leaders, entrepreneurs, and policymakers to turn big ideas into real-world solutions.
144-155
156-170 80
Olympic opportunity – Capitalize on 2010 2015 2020 2025 the 2034 Olympics and Paralympics to catalyze community success and prevent and solve challenges.
80 60 40
1.5%
1.2%
0.9%
1.6%
0.9%
1.6%
CT 1.6% DC -0.3% DE 1.0% MA 1.6% MD 0.7% NH 1.2% NJ 0.9% RI 0.7% VT 1.5% WV 0.6%
1.1%
0.3%
1.5% 2.0%
1.6% 1.3% 0.9%
1.3%
0.9%
2.0%
2.6%
11.9%
-7.9%1.0% 0.8% 0.7%
5 -15
2020
0
GOEO 2010 2.0
2005
al *
2000
2005
100.8
2015 1.7%
-7.9%
2010
100.0
2015
1.0% 2020
2.6%
2.6
L ife 2020
96.7
2025
103.3
98.7
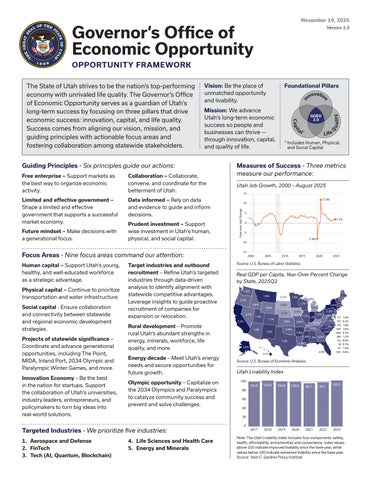
Source: U.S. Bureau of Labor Statistics
120 GDP per Capita, Year-Over Percent Change Real by State, 2025Q2 100 2019 2020 2021 102.8 2022 100.0 1.0% 120 80
103.3
1.9%
100.0 0.8%
60 40 40 0.7%
20
-0.5% 1.4% 102.8 1.3% 0.0%
0.6%
1.1%
2017 1.0%
0.9%
2018 0.9%
2017 1.6%
1.2%
0.9%2019
1.5% 1.1% 1.5%
2018 2.0%
0.9% 2.0%
2.6%
120
100.0
1.6% 1.3% 0.9%
2.6%
100.8
2.5%
0.3%
1.6%
1.3% 2023
100.8 0.1%
1.2% 2.2%
0.8%
2023
0.7%
0.0%
0.2%
1.2%
20 2.5%
00
0
1.2%
2.5%
2025 2000
-5
100 0.7% 60 80
1.9
0.7%
CT 1.6% DC -0.3% DE 1.0% MA 1.6% 2020 MD 0.7% NH 1.2% NJ 0.9% RI 0.7% VT 1.5% WV 0.6%
2019
Source: U.S. Bureau of Economic Analysis 100 100.0
102.8
100.8
100.0
80
96.7
98.7
103.3
120 Utah Livability Index 60 40 100
100.0
20 080
2017
2018
102.8 2019
100.8 2020
2021
100.0 2022
96.7
98.7
2021
2022
103.3
2023
60 40 20 0
Targeted Industries - We prioritize five industries: 1. Aerospace and 120Defense 2. FinTech 100 3. Tech (AI, Quantum, Blockchain) 100.0
2015
80
Energy decade – Meet Utah’s energy -7.9% needs and secure opportunities for future growth.
1.2% 2.2%
0.9%
-7.9% 10
102.8
60 – Promote Rural development 40 rural Utah’s abundant strengths in 1.7% 20 energy, minerals, workforce, life 0 2017 2018 2019 2020 2021 2022 quality, and more.
0.0%
0.8%
2.6%
-10
Target industries 60and outbound 40 recruitment – Refine Utah’s targeted 20 industries through data-driven 0 2017 analysis to identify alignment with 2018 statewide competitive advantages. Leverage insights to guide11.9% proactive recruitment of companies for 120 100 expansion or relocation. 102.8 100.0 100.8 100.0 96.7 98.7
1.1%
1.0%
1.7%
-15 100.0 171-189
2.5%
0.1%
t
116-137
1.3%
0.2%
1.2%
-10
120
Focus Areas - Nine focus areas command our attention: 100
0.7%
2.5%
15
182 physical, and social capital.
131
0.7%
1.4%
0.0%
-5 ovatio Utah Job Growth, 2000 –n n August 2025
123 153
MA 159 Data – Rely 142 on data 142 146 informed MD 146 165 -10 and evidence to 163 guide and inform NH 176 173 147 -15 148 decisions. NJ 2000 2005 2010143 145 175 134 Prudent investment – Support RI 137 VT 156 181 116 wise investment in Utah’s human,
-0.5%
0.6%
C a pi
Future mindset – Make decisions with a generational focus. 122
-5
1.9%
0.8%
u a li t y
174
Shape a limited and effective government that supports a 187 successful 148 market economy.
137
1.0% 0.7%
Q
189 –174 Limited and effective government
182
I
Year-over Job Change
141 Collaboration 141 – Collaborate, 5 129 convene, and coordinate136 for the CT 136 0 138 136 betterment of Utah. 154 DE 141 143
157
122
VT 156
116
n
167 Free enterprise – Support markets as 177 the best way to organize economic 131 activity. 158
181
11.
131 Success - Three metrics 11.9% Measures of 0 116-137 144-155 156-170 171-189 measure our138-143 performance:
Year-over Job Change
137
Year-over Job Change
t
Q
C a pi
15
169
Guiding Principles - Six principles guide our actions:10 161
5
17
4. Life Sciences and Health Care 5. Energy and Minerals 102.8
100.8
2017
2018
2019
2020
2023
Note: The Utah Livability Index includes four components: safety, health, affordability, and amenities and convenience. Index values above 100 indicate improved livability since the base year, while values below 100 indicate worsened livability since the base year. 100.0Source: Kem C. Gardner Policy Institute 96.7 98.7
103