In the Mix
The product assortment for retailers still relies heavily on three categories: holiday, candles and home fragrance, and home décor. For 2025, holiday garnered the top spot, with 88 percent of retailers carrying such items vs. 83 percent in the previous survey. Candles and related items jumped into second, with 86 percent carrying them vs. 75 percent in 2024, while home goods fell to No. 3. (79 percent) from No. 1 (88 percent).
Candles were also tied with fashion products such as clothing, jewelry and accessories for the top item on the list of product categories being added for 2026. The survey found 40 percent of retailers plan to add or expand in those areas. Other popular additions cited include stationery/greeting cards, noted by one-third of retailers; baby/infant products (29 percent) and gourmet food (27 percent).
Additionally, one-quarter of retailers said they would be expanding or adding to their bath and body and inspirational product lines this year.
The highest average best-selling price point went to wall art at $69, followed by gift baskets, $60; and fashion items, $53. The lowest price point was held by stationery/greeting cards at $7.
Nearly all retailers (91 percent) carried Americanmade products in 2025 and plans are for 74 percent of them to expand the category as the United States celebrates its 250th anniversary this year. About half of retailers (54 percent) also carry locally sourced products, with 17 percent planning to add or increase items in that category.
Third-party platforms continue to garner business from gift retailers, with nearly one-third of respondents citing this as a resource. This channel has grown steadily from 22 percent in 2023 to 26 percent in 2024 to 2025’s 31 percent. Major markets were the No. 2 source at 24 percent, leapfrogging it ahead of sales reps (19 percent) and vendor’s websites (17 percent). In 2024, vendor’s wholesale websites were second.
Top Categories Carried in 2025
Stationery/greeting cards
Baby/infant products
Wall art
Gourmet food
Kids' products
Inspirational products
Tabletop
Home textiles
Locally sourced
Ceramics/pottery
Toys
Handcrafted products
Religious/faith based
Eco-friendly/sustainably sourced
Snarky/punny products
Garden products
Pet products
Collectibles
Licensed products
Gift baskets or product bundles
Private label/custom for store
Cause related
Gourmet tools
Best-Selling Price Points on
Top-Growing Product Categories
Fashion products/accessories/jewelry
Candles and accessories/home fragrance
Stationery/greeting cards
Baby/infant products
Gourmet food
Bath and body/aromatherapy
Inspirational products
Holiday products
Gift baskets or product bundles
Kids' products
Toys
Home décor/home accents
Tabletop
Handcrafted products
Locally sourced
Snarky/punny products
Religious/faith based Cause related
Private label/custom for store
Wall art
Pet products
Ceramics/pottery
Garden products
Eco-friendly/sustainably sourced
Home textiles
Collectibles
Gourmet tools
Licensed products
Bath and
Candles and accessories
%
Jar
Loose (votives/pillars/tapers)
Warmers/melts
Flameless/LED candles
Holders/vessels
Air
Fashion products and accessories
products
Gourmet food
Gourmet tools
Home décor
Stationery products
Garden products
%
Tabletop
Taking Care of Business
The impact of artificial intelligence (AI) is being felt everywhere, including among gift retailers. Two-fifth of retailers (42 percent) are currently using AI-powered tools to help run their business, putting them third behind graphic design tools (73 percent) and inventory management software (51 percent).
Looking more in-depth at the implementation of AI, 68 percent of retailers said they use it to create product descriptions or images, 58 percent use it for social media posts and 53 percent deploy it for creating targeted promotions. Other applications of note include inventory optimization (26 percent), conversational search on a website (26 percent) and demand forecasting (10 percent). In addition, retailers said they are using AI to write flyers and newsletters, solve technical issues with software, produce company manuals and help with branding.
Facebook (82 percent) and Instagram (73 percent) have risen to the top of the social media list, widening the gap with other
channels such as Pinterest (24 percent), YouTube (18 percent) and TikTok (18 percent). X (formerly Twitter) continues to lose traction among retailers, dropping to 4 percent use from 17 percent just two years ago.
Videos, reels and stories are still the main vehicle for connecting with shoppers at 71 percent. However, more retailers in 2025 said they interacted via comments and DMs (62 percent) than previously, while sales through posts dropped to 40 percent from around 50 percent. About half (53 percent) also said they crafted daily social posts, making it the No. 3 social media activity.
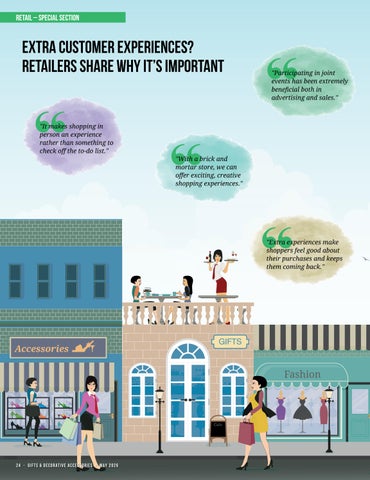
The top means for enhancing customers’ experiences, according to the survey, were offering product discounts (77 percent), extending shopping hours (68 percent), adding food and beverages to stores (60 percent) and offering free gift wrap (60 percent). Celebrity or designer appearances were offered by just 9 percent of retailers.
What Technologies/Tools Do You Use to Help Run Your Business?
Product categories
Baby/infant products
Bath and body/aromatherapy: Soaps, hand lotion, body moisturizers, lip care, bath bombs/bath salts/shower bursts, men’s personal care, personal fragrance, sleep wellness, face care, CBD oil/CBD-based, hair care
Candles and accessories/home fragrance: Jar candles, soy candles, diffusers, flameless/LED candles, loose (votives/pillars/tapers), holders/vessels, natural/ eco-friendly candles, air fresheners, warmers/melts, painted/sculpted/designer candles
Caused related
CBD-themed
Ceramics/pottery
Collectibles
Eco-friendly/sustainably sourced
Fashion products/accessories/jewelry: Jewelry, handbags/totes, scarves, hats/ hair accessories, eyewear, wraps, slippers, socks, stretch jeans and other women’s pants, athleisure wear, men’s accessories, resort wear/beach coverups, general footwear, other apparel
Garden products: Wind chimes, bird feeders/baths, flags, outdoor mats, statues/ accents, planting pots, garden tools/accessories, outdoor lighting, outdoor canvas art
Gift baskets or product bundles
Gourmet food: Chocolate, candy/treats, jams, shelf-stable food, tea, coffee, pet treats, other grocery items
Gourmet tools: Kitchen textiles, wine/bar accessories, cookbooks, kitchen utensils, kitchen gadgets, baking accessories, tea accessories, coffee accessories
Handcrafted products
Holiday products: Christmas, Easter, birthdays, Mother’s Day, Thanksgiving, Valentine’s Day, Halloween, Graduation, Father’s Day, Independence Day, Hanukkah, New Year’s Eve, Juneteenth
Home décor/home accents: Decorative accents, wall art/signage, decorative pillows, photo frames, accent lighting, tabletop/serveware, permanent/faux botanicals, blankets/throws, clocks, mirrors, accent rugs
Home textiles
Inspirational products
Licensed products
Accessories
Locally sourced
Pet products
Private label/custom for store
Religious/faith based
Snarky/punny products
About the data
Gifts & Decorative Accessories’ Strategic Insights fielded an annual online survey to gift retailers in February and March 2026. The findings contained in this report are qualitative in nature. They are derived from a small sample of respondents and should not be projected in numeric terms to larger populations. As such, the findings are directional and should be considered descriptive rather than explanatory.
GIFTS
Stationery/greeting cards: Greeting cards, books, journals, notepads, coloring/ activity books, writing instruments, calendars/planners, stickers/buttons/ patches, desk/home office accessories, gift wrap, party products, paint/art kits
Tabletop: Coffee cups/mugs, cutting/cheese/charcuterie boards, serveware, vases, table linens, stemware, melamine, glassware/crystal, centerpieces, dinnerware, tea/coffee pots/sets, flatware, bamboo, sustainable
Toys: Games/puzzles, plush, arts and crafts, books/music, dolls, outdoor toys, pretend play, STEM/educational, blocks, action figures, construction sets, STEAM
Wall art