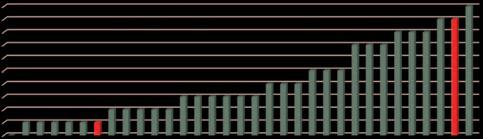
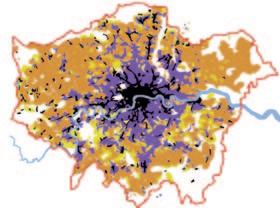
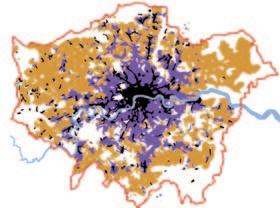
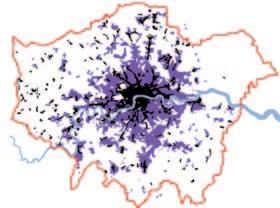
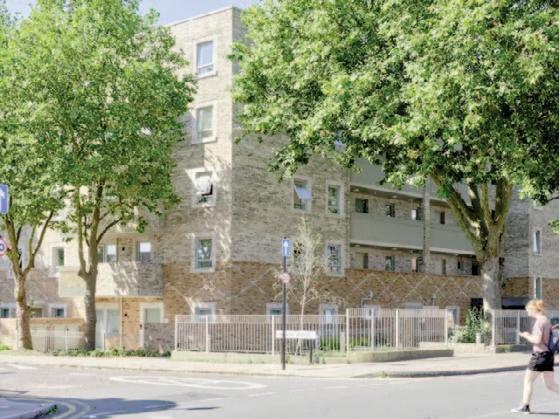
Olympia unveiled page 9; £9bn scandal of unspent developer contributions, LP&DF/ The Home Builders Federation page 46; Smarter growth around stations, Nicholas Falk page 58; Demographic projections for London, Ben Corr page 64
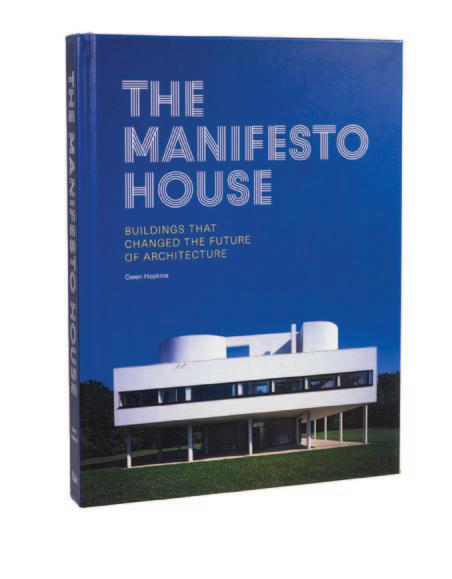
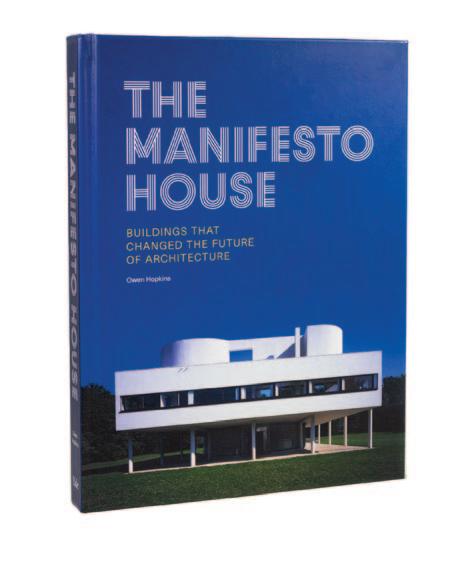
‘This beautifully illustrated survey brings fresh perspectives and insights to some of the world’s most celebrated and debated houses, with a special focus on the Modern Movement and what has come after. Few people will get the chance to visit all of these dwellings, but Owen Hopkin’s lively and engaging survey is the next best thing.’
Simon Bradley
Heatherwick's Kensington Olympia unveiled page 9
Crinkle-crankle wall featured in Kensington Gardens pavilion; ¡Pillo! page 35
The next meeting of the London Planning & Development Forum is at LSE Old Building, Houghton Street, London, WC2A 2AE, England
2pm on Tuesday 15th September 2026
Please email editor@planninginlondon.com if you would like to join in. For the agenda nearer the date please also look at planninginlondon.com >LP&DF
PiL138 CONTENTS
PAGE:
5 LEADERS
The devolution myth; Pennycook temporarily torpedoes City Plan 2040
7 PAUL FINCH
Designing for data – and housing
8 BEN DERBYSHIRE
Will Burnham be a lifeline for housebuilding?
9 Heatherwick's Kensington Olympia unveiled
OPINIONS
14 The Great Grid Upgrade | Charles Hardcastle
15 Placemaking in new towns | Alison Coutinho
17 Why station-proximity doesn't make a simple site | Matt Harmsworth
19 Demand side policy | Hugo Owen
20 Wishful thinking: CIL & A/C | Simon Ricketts
22 A counterpoint to the death of the high street | Jonathan Eastwood
23 The health of the high street | Clare Strachan
24 Simplify pre-commencement conditions for BNG | Nicky Brock
25 Culture in the City | Leanne Tritton
26 CIL and viability | Andrew Golland
27 Planning appeals | Andy Cowan
28 Geospatial data for planning | Josh Rains
BRIEFING
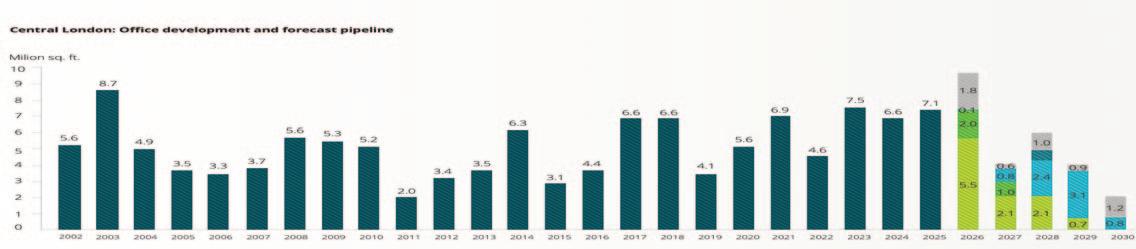
30 Deloitte London Office Crane Survey
33 Letter from Mark Willingale on agglomeration benefits; The LSX Leicester Square project ; 'Affordability not shortage is behind housing crisis'
34 CLIPBOARD
Queen Elizabeth II garden by HTA Design in Regent’s Park; Court clears Gatwick plan
35 ¡PILLO!
A housing system inflicting both feast and famine; Crinkle-crankle wall featured in Kensington Gardens pavilion; good news for unbearable bladders; The actual countryside... RIBA president calls for ‘strong leadership’
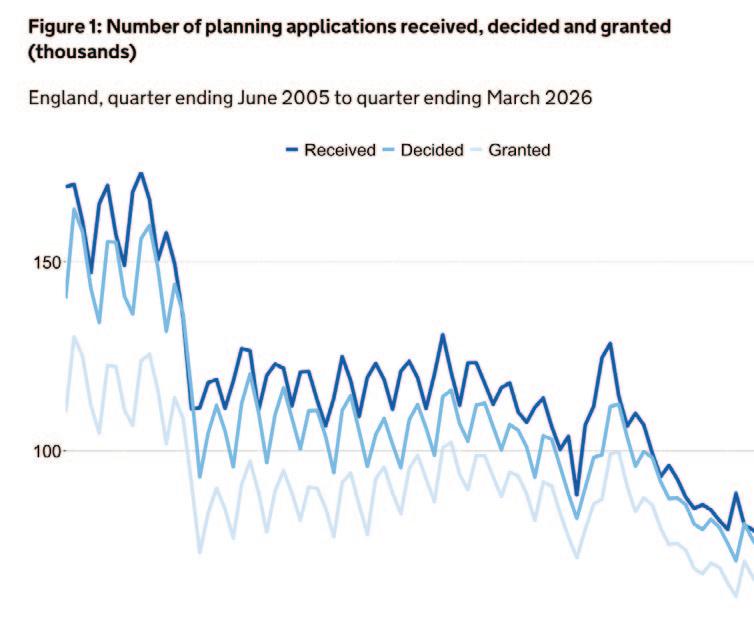
36 PLANNING PERFORMANCE
The number of applications received down 10 per cent from the same quarter last year Continues next page
40 LONDON PLANNING & DEVELOPMENT FORUM
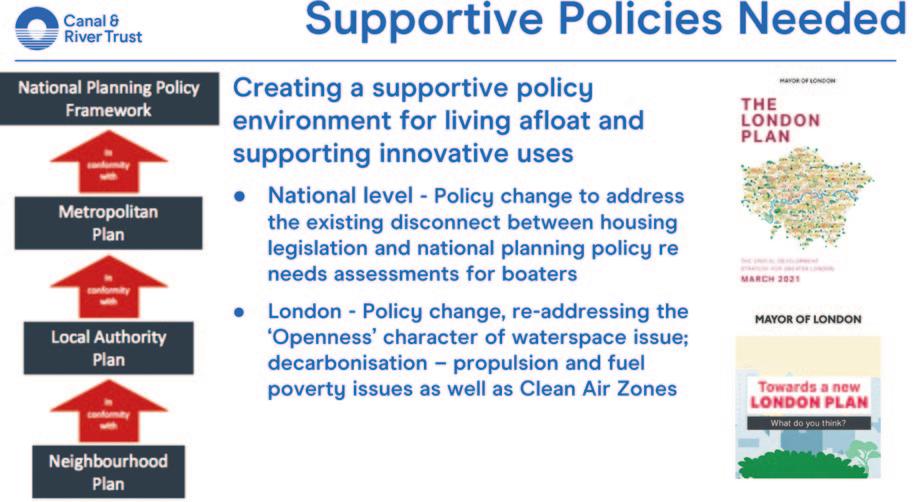
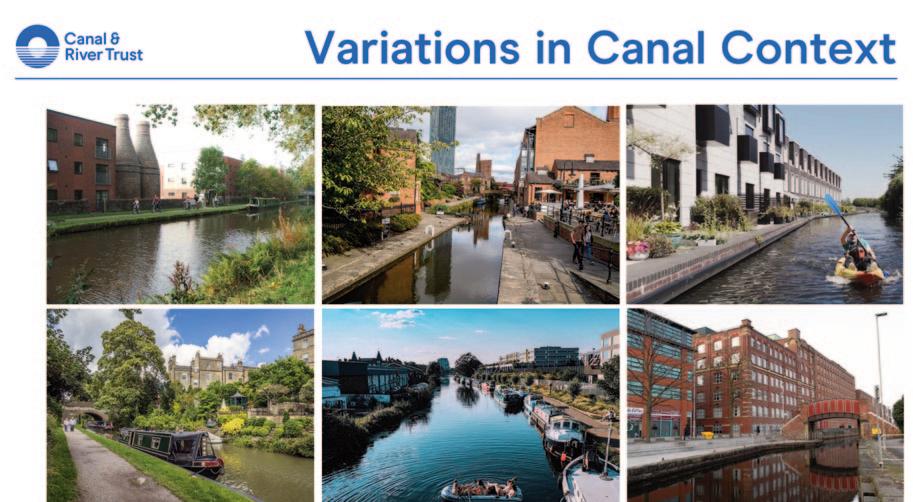
41 Canals and rivers: managing a fragile national asset | the Canal & River Trust
46 A £9bn scandal of unspent developer contributions | The Home Builders Federation
Chairman: Brian Waters MA DipArch (Cantab)DipTP RIBA MRTPI ACArch ppACA FRSA Principal: The Boisot Waters Cohen Partnership – brian@bwcp.co.uk
Vice-Chairmen: Riette Oosthuizen HTA Design: riette.oosthuizen@hta.co.uk and Brian Whiteley Brian.Whiteley@planningaid.rtpi.org.uk
Member bodies Association of Consultant Architects Planning Officers’ Society/Association of London Borough Planning Officers London Councils British Property Federation Design Council CABE City o London Law Society
Available only on subscription: £99 pa
Provides a licence for five copies by email See subscription form or buy online at www.planninginlondon.com.
Planning in London is published quarterly in association with The London Planning & Development Forum by Land Research Unit Ltd, Studio Petersham, Gorshott, 181 Petersham Road TW10 7AW
Confederation for British Industry DLUHC Design for London/ Urban Design London
Historic England
Environment Agency
Greater London Authority
Home Builders Federation
Landscape Architecture SE
London Chambers of Commerce & Industry
London Forum of Amenity Societies
London Housing Federation
National Planning Forum ICE, RIBA, RICS, RTPI, UDAL, TCPA Transport for London
London University (The Bartlett, UCL) University of Westminster
Contributors write in a personal capacity. Their views are not necessarily those of The London Development & Planning Forum or of their organisations.
Correspondence and contributions are invited for consideration. The editors reserve the right to edit material and letters supplied.
Made on a Mac
Affiliated members: Planning Aid for London London Metropolitan University
WITH
If city-region government is the answer, what exactly was the question?
The devolution myth
The prime minister-in-waiting, Andy Burnham, has made devolution of authority from Westminster to cities and regions his political calling card. His ambition to create a ‘nerve centre’ in Manchester to rival 10 Downing Street is understandable, given his long history as a regional mayor, but seems to ignore the realities of digital communication. Anywhere and everywhere can be a nerve centre. The postal address is a 19th century hangover.
Grandstanding about regional mayors is based on what Burnham claims are his successes in Granada-land: growth, buses, housing. In reality all the heavy lifting, as he half-acknowledges, was carried out by Howard Bernstein and Richard Leese, neither of whom had mayoral status. As for the buses, they were a gift from Boris Johnson. The service is now facing a budgetary crisis which no doubt Whitehall will be asked to bail out.
In respect of our experience of devolution since Tony Blair ripped up the British constitution, creating Parliaments in Scotland and Wales, can anyone seriously claim that those countries have been well governed since? The Nationalist elements of course claim that more devolution of power is required, and that is all that is holding them back. They never mention the ‘Barnett formula’, whereby English tax-payers pay massive irrecoverable subsidies to Scotland, Wales and Northern Ireland.
When John Prescott tried to introduce regional government in England, a gigantic majority threw out the idea in a referendum. Proponents ignore this, as they pretend that Brexit was a misunderstanding, not a democratic decision. Bizarrely, Burnham now appears to think that devolving power away from Whitehall means not only more localism, but the re-start of genuflection to Brussels and Strasbourg. You couldn’t make it up.
Then there is the worked example of a city mayor – the city being London, given a mayor by Tony Blair as a reaction to the abolition of the Greater London Council by Margaret Thatcher. What is the record of mayoral government compared with what went on before? Housing has been an ongoing disaster zone. The mayor now has planning powers (positive and negative), a huge housing budget (because Homes England does not operate in London), CPO powers, the ability to create mayoral development corporations, and the power to over-ride boroughs. None of this has resulted in a directly procured housing programme for affordable and social units. Instead, the mayor has penalised housebuilders by giving them unreachable targets to build out a social programme at their own expense.
This mad policy has demonstrably failed, to the point where there are now parts of London with no planning applications for any significant housing development. Too late, the mayor has slashed the target for ‘affordable’ to 20 per cent, only to be attacked by failed boroughs for doing so. It is hard to say whether this is because of politically-induced blindness to reality, or whether it is plain old stupidity, the expectation that repeating a failed policy will somehow guarantee success this time round.
Planning in London has been published and edited by Brian Waters, Lee Mallett and Paul Finch since 1992
Transport at least below ground, is a better story but owes little to London’s three mayors. Strategy planners who understood growing needs have been hugely successful in implementing rail-based projects which have kept London moving and, particularly in the case of the Elizabeth Line, changed the capital and its ‘mental map’ for the better and forever.
Alas, surface transport is another story – one of malice and incompetence which is successfully reducing what should be a major world city to a laughingstock of traffic jams, closed bridges and a hostility to ordinary Londoners daring to drive about in their own city. Instead, we are forced onto sweaty and unreliable buses, many still using routes based on 19th century habitation patterns, or onto equally packed tubes. The failure to repair and reopen Hammersmith Bridge raises the question of whether it is worth having a mayor at all. If the mayor can’t keep bridges open (Albert Bridge is now shut for a year, leading to massive congestion on Wandsworth, Battersea and Chelsea Bridges), what is the point in having one?
Pennycook’s action may come back to bite him
London government behaves as though it has a stable population, whereas it has increased by three million over the past four decades. That hasn’t stopped the surreal situation developing of schools closing because of falling family populations, this the result of a failure to build enough new homes for local people. New arrivals and the growing numbers of unemployables on Benefit Street means social housing is no longer for ordinary Londoners. There is no evidence that this is being addressed by the mayoralty.
London boroughs being put in special measures because of financial and administrative incompetence (eg Croydon) give little comfort about the joys of devolution. The man from Whitehall has to come in and sort it out.
If city-region government is the answer, what exactly was the question? And was it a good one? n
Pennycook temporarily torpedoes City Plan 2040
A spectacular own goal for UK plc from Housing and Planning Minister Matthew Pennycook with his 29th June direction to the City of London Corporation requiring a further examination of the assessment of tall buildings and their impact on the Tower of London World Heritage site. The City rejected Historic England’s suggestions the new plan should trim the ‘jelly mold’ outline of the City main cluster of tall buildings in the core to ameliorate impacts on views of and from the Tower of London. The inspector agreed. Pennycook’s misguided direction stalls adoption of City Plan 2040 and opens up risk for investors.
Chairman of the City’s Planning and Transportation Committee Tom Sleigh came out guns blazing: “This is unnecessary and anti-growth. The issue was examined in full more than a year ago. To send a complete, ready-to-adopt plan back for more hearings on a settled point is the wrong call and the cost will be missed economic growth.”
The City is receiving record numbers of applications for new and retro-fit schemes. Numbers of workers are 25 per cent up on pre-pandemic figures. It is running out of the ‘right stuff’ –new, improved space to satisfy a younger generation of workers, and businesses being transformed by AI. Phone calls to the Corporation have been made by irked investors wanting to know if Pennycook’s Exocet will affect their schemes.
The heritage lobby has found a back door through which to nobble the Minister. A pronouncement from international heritage body ICOMOS is thought to be imminent. Pennycook’s action may come back to bite him, however, in the anticipated Cabinet reshuffle should Andy Burnham choose to assert ‘Manchesterism’.
As we report on page 49, the London Property Alliance’s research shows central London’s growth has taken a big hit post-pandemic, despite the return of workers, and a rapidly growing shortage of Grade A space in the City and across the Central Activities Zone is one of growing businesses’ most pressing economic problems.
Lack of space compounds London’s inability to grow its economy as diminishing supply forces up rents. Even Canary Wharf, which was seen as struggling particularly post-pandemic, is benefitting from both major letting and investment deals.
The property lobby has been ineffective in getting its act together to make the argument for more new offices in the CAZ that take advantage of its unmatched accessibility. London’s economic decline relative to the rest of the UK, reducing supply, climbing rents, inability to tackle housing shortages, reducing London’s appeal, spell decline.
Poor growth in London means less money for government to achieve growth. Voters and markets will punish that, and any increased government borrowing in the absence of growth will be torpedoed by the Bond Market. Devolutionist Burnham should follow the money to achieve his aims. n
Designing for data – and housing FINCH FINCH
A shaft of light in the political, economic and security gloom pervading the UK: the government has joined forces with the RIBA to launch a competition to show how architecture can inform the design of data centres, so they make a contribution to rural or urban environments, writes Paul Finch
A shaft of light in the political, economic and security gloom pervading the UK currently: the government has joined forces with the RIBA to launch a competition to show how architecture can inform the design of data centres, so they make a contribution to rural or urban environments.
That is to say an aesthetic contribution, in addition to formal design requirements, which are likely to be largely a matter of engineering. In this, the precedent is the architecture of railways, sewerage systems, pumping stations and subsequently coalfired and nuclear power stations, where the magnificent precedent of the 19th century followed through until relatively recently.
The assumption that infrastructure design is a matter for process engineers and few others is being, happily, increasingly challenged, partly as a result of planning policy requirements to show how design quality is being incorporated in giant public investments, and partly because many public and private clients see a value in ‘good design’ because of general cultural views – allied with the notion that the well-designed may win those necessary planning permissions more quickly.
Data centres are tricky on many fronts. For one thing, the extraordinary amounts of energy they require make them an intellectual test case for the Zero Carbon lobby: is it appropriate to support their
development on the basis that the building itself is virtuous, but its activities are energy-guzzlers? And if they are ok, what about airports?
So far, the only creative idea about reconciliation of energy use and data centres is an idea from Arup, which won a World Architecture Festival award in 2023. This proposed the re-use of redundant oil rigs as under-water data centres. This brilliant proposition sounded fanciful, but was accompanied by analysis (as one would expect from Arup) of the global supply of oil-rigs which might be expected to become redundant over the next few decades.
This was not an architectural idea as such, but it had the characteristics of holistic architectural thinking which frequently derives from collaborations with engineers of all descriptions.
Happily, we now have an example of a planned data centre, in Scotland, where the inspiration for the design comes from Ancient Greece. The Stoainspired design by Graeme Nicholls, which could be mistaken for several buildings by David Chipperfield, shows that 19th century attitude is alive and well, and historicist in a good way. It is not an essay in why high-tech buildings can have thatched roofs. All power to the architect’s elbow, and to the serendipity that gave us this design just as government recognized that this is an important
Paul Finch CBE is
programme
director
of the World Festival of Architecture and joint publishing editor of Planning in London
design area. Working with the RIBA is, with any luck, a welcome sign that politicians might be starting to realise that architects can make things better.
Talking about holistic thinking takes us back to another Arup conceptual project, prompted by a challenge from veteran developer Sir Stuart Lipton to think about dense housing design which would be popular, replicable and economical.
There has been little publicity about this proposal to date, but the time must be right to launch it while Andy Burnham enjoys a honeymoon period as out new prime minister – with a huge interest in housing provision.
The Lipton/Arup idea is a 21st century version of the Marylebone mansion block building type which has proved resilient, desirable and valuable not just in that area of London, but across the capital often located close to the rail and/or Underground stations.
Generating this building type at scale is the name of the game. A concrete frame and kit-ofparts materials and products schedule are the means to an invaluable social end: quantity which does no sacrifice quality. The ideas have been assessed with contractors and are getting a green light.
This is the Holy Grail of public and indeed private housing aspirations and surely deserves to be pursued. We have managed it occasionally in the past, but not on a consistent basis. Consistent production is what we now need; could a Burnham administration create the conditions in which a researched and validated idea could be put into practice? n
Cato data centre by Graeme Nicholls architects
Will Burnham’s ‘Manchesterism’ be a lifeline for housebuilding?
The next prime minister must resist the temptation to unpick everything and instead build on existing progress, writes Ben Derbyshire
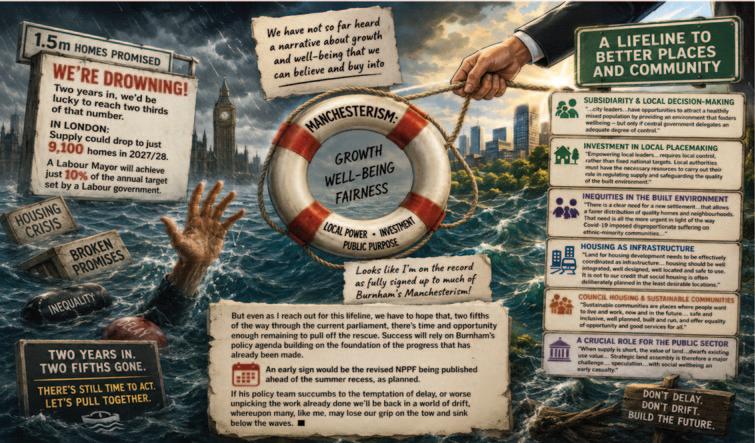
We’re drowning! Two years into a parliament that promised 1.5m homes, on current form we’d be lucky to reach two thirds of that number. In London, Molior predicts new supply could drop to just 9,100 homes in 2027/28. If so, a Labour Mayor will achieve just 10% of the annual target set by a Labour government.
I for one am happy to believe that the messages drifting down from Manchester are more than just flotsam. The messaging is important in itself. There’s a widespread view, which I share, that we have not so far heard a narrative about growth and well-being that we can believe and buy into. So even before we get into the flow of Andy Burnham’s actual policy agenda, at least we are receiving one, loud and clear, like it or not.
There’s lots of it that does actually buoy me up, reflecting many of the asks of my 2023 book, Home Truths, on which I based my Housing Today columns during that year. Bear with me while I reiterate some passages from my book.
On subsidiarity and local decision-making: “City leaders, exposed to the locational choices of citizens in a way that no national governments can be, have
opportunities to attract a healthily mixed population by providing an environment that fosters wellbeing –but only if central government delegates an adequate degree of control.”
On investment in local placemaking: “Empowering local leaders to shape their local housing market requires local control, rather than fixed national targets. Local authorities must have the necessary resources to carry out their role in regulating supply and safeguarding the quality of the built environment.”
On inequities in the built environment: “There is a clear need for a new settlement between government and society that allows a fairer distribution of quality homes and neighbourhoods. That need is all the more urgent in light of the way Covid-19 imposed disproportionate suffering on ethnic-minority communities, thanks to the unequal distribution of space in society.”
We have not so far heard a narrative about growth and well-being that we can believe and buy into
On housing as infrastructure: “Land for housing development needs to be effectively coordinated as
Benjamin Derbyshire is chair of HTA Design LLP and a past president of the RIBA
infrastructure, It should go without saying that like all kinds of infrastructure, housing should be well integrated, well designed, well located and safe to use. It is not to our credit that social housing is often deliberately planned in the least desirable locations.”
On council housing: “Sustainable communities are places where people want to live and work, now and in the future. They meet the diverse needs of existing and future residents, are sensitive to their environment, and contribute to a high quality of life. They are safe and inclusive, well planned, built and run, and offer equality of opportunity and good services for all.”
On a crucial role for the public sector: “When supply is short, the value of land approved for housing development generally dwarfs existing use value, particularly for agricultural land. Strategic land assembly is therefore a major challenge. In free market economies this disparity can give rise to a feeding frenzy of speculation, with social wellbeing an early casualty.”
Looks like I’m on the record as fully signed up to much of Burnham’s Manchesterism!
But even as I reach out for this lifeline, we have to hope that, two fifths of the way through the current parliament, there’s time and opportunity enough remaining to pull off the rescue. Success will rely on Burnham’s policy agenda building on the foundation of the progress that has already been made.
An early sign would be the revised NPPF being published ahead of the summer recess, as planned. If his policy team succumbs to the temptation of delay, or worse unpicking the work already done we’ll be back in a world of drift, whereupon many, like me, may lose our grip on the tow and sink below the waves. n
First published in BDonline
Heatherwick's Kensington Olympia unveiled
Heatherwick Studio and SPPARC have revealed the first completed elements of the long-awaited regeneration of Olympia in west London. Originally opened in 1886, the Grade II-listed landmark has been reimagined as a new cultural destination that combines exhibition halls, performance venues, workplaces, hospitality and public realm across a 5.7-hectare site. The project seeks to reconnect Olympia with the surrounding city while preserving the character and function of one of London’s most recognisable Victorian buildings.
For much of its history, Olympia operated as a largely inward-facing complex. Although it hosted everything from international exhibitions to landmark concerts and fashion shows, its kilometre-long
perimeter remained closed to everyday public life. The new masterplan addresses this condition by opening the site through a network of streets, squares, gardens and elevated walkways that reestablish historic routes between the exhibition halls and create new connections to the surrounding neighbourhood.
A key component of the strategy has been the relocation of servicing and logistics infrastructure below ground. This has freed up substantial areas of the site for public use, creating approximately one hectare of accessible outdoor space and allowing the historic buildings to engage more directly with the city.
The most visible element of the first phase is a new public canopy that forms a gateway into the
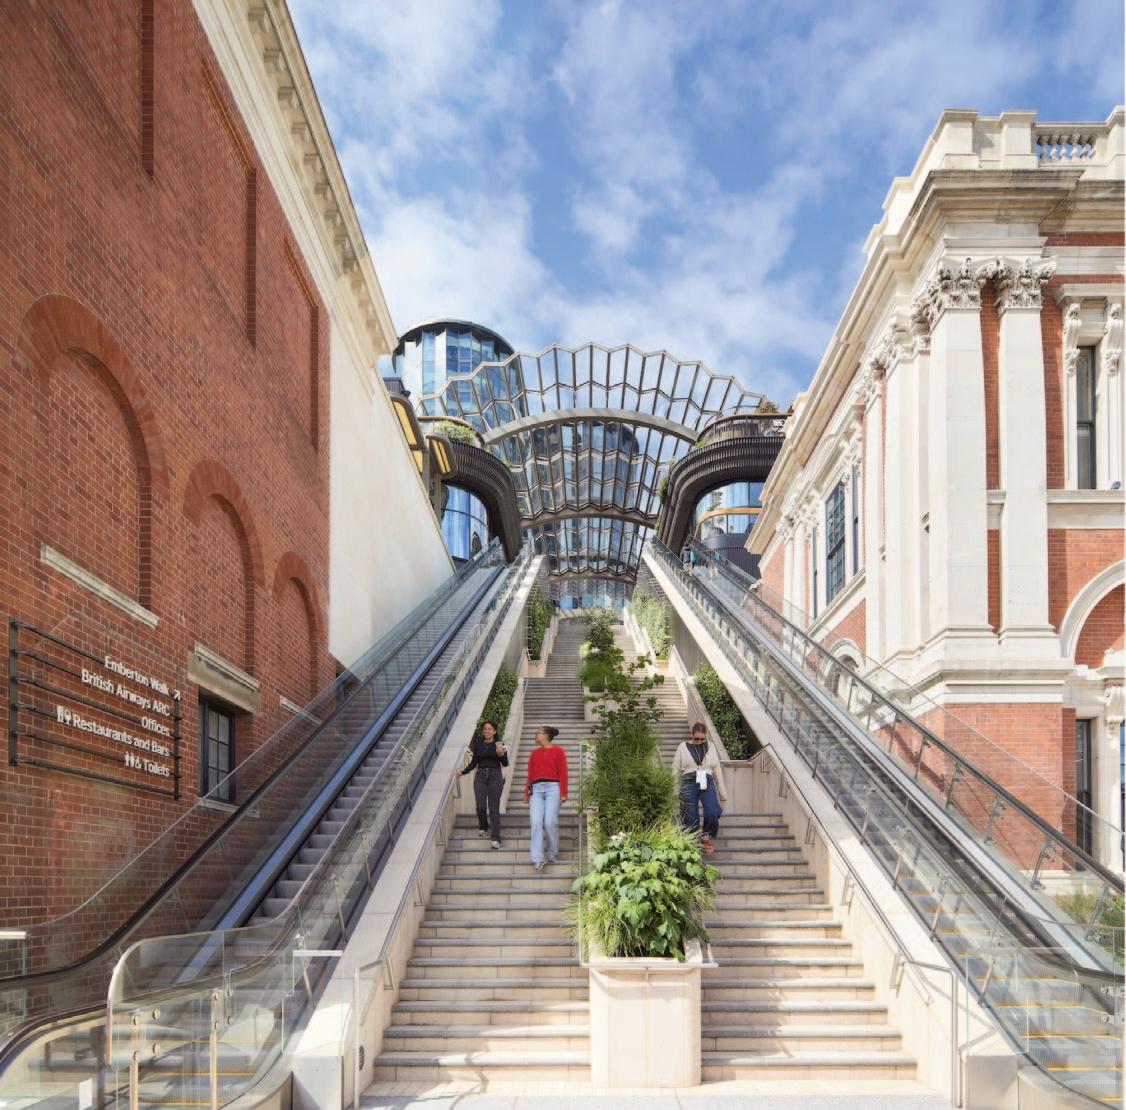
heart of the development. Positioned above the exhibition halls at second-floor level, the structure introduces almost 1,000 square metres of public space overlooking Olympia’s distinctive Victorian rooftops. Rising above a new public staircase and escalators, the canopy establishes a clear point of arrival from Hammersmith Road while offering elevated views across the cast-iron and glass barrelvaulted roofs that define the complex.
Designed by Heatherwick Studio, the canopy draws inspiration from the original architecture of Olympia and, in particular, the work of Sir Henry Edward Coe. Five curved steel arches span 22 metres across the structure, supporting a transparent roof comprising 520 pleated glass panels. The folded geometry is intended to evoke the rhythm and
articulation of the historic Grand Hall façade.
The wider masterplan preserves Olympia’s role as a major exhibition venue, maintaining the existing halls and their capacity to accommodate up to 26,000 visitors. Alongside these historic spaces, the development introduces a range of new cultural, commercial and hospitality uses intended to establish a year-round destination.
Among the major additions are the British Airways Theatre, and the British Airways ARC, both designed by Haworth Tompkins. The former is a
1,575-seat venue that will become the largest new permanent theatre to open in London for almost half a century, while the latter is a live entertainment venue with capacity for 3,800 people. New hotels operated by Hyatt Regency and citizenM will sit alongside more than 30 restaurants and bars, while 51,000 square metres of creative workspace and dedicated rehearsal facilities for local charities aim to support a broader cultural ecosystem.
Throughout the project, the architectural approach has focused on working with the historic
fabric rather than around it. Existing exhibition halls remain at the centre of the development, while new interventions are designed to reveal, celebrate and reconnect the site’s Victorian heritage. Once complete, Olympia is expected to attract around 10 million visitors annually and contribute more than £600 million to the UK economy each year.
Thomas Heatherwick, Founder and Design Director of Heatherwick Studio, said: “Olympia has held a strange place in the hearts of Londoners, sitting at the centre of our city, hosting so many
unusual events, yet simultaneously closed off to most of us. It certainly wasn’t a place to take your family or go on a date. Our work over the last nine years has been about opening it up so anyone can enjoy it, whether they’re going to a play, a music concert, an exhibition, or simply wandering around.
We’ve reimagined it as part of London’s everyday life again, creating a new public street raised up in the air, sitting on top of the old exhibition halls. It’s surrounded by London’s largest theatre to open in 50 years, a music hall, two hotels, offices, plus lots of places to sit and eat and be together. What was once a lifeless perimeter is now a place where you can feel the city’s energy. The new Olympia reflects a quiet confidence, showing that we can take extraordinary British heritage and adapt it with care, imagination and purpose for the future.” n
Photos: Raquel Diniz, Hufton+Crow, Heatherwick Studio
From Heatherwick Studio:
Olympia is a new cultural neighbourhood for London, designed by Heatherwick Studio and SPPARC.
For 140 years, this site has been a showcase for the arts and commerce. While carefully restoring the site’s heritage, the studio’s new scheme reimagines Olympia as a creativity-led district. Crowned with a curved glass canopy, an elevated public realm connects new theatre and music venues, hotels, offices, restaurants, a school and the historic exhibition halls.
Heatherwick Studio developed the masterplan for this £1.3 billion project, as well as designing in detail selected buildings and its new rooftop route of streets, squares and gardens. Unusually for a project of this scale and complexity, the programme also had to ensure the site could remain open throughout construction.
Our starting point for the masterplan was the idea of public spirit. When it opened in 1886, Olympia aimed to bring the marvels of the day to Londoners. The studio’s designs have been guided by this same ethos of opening up Olympia to everyone.
The venue’s expansion over the decades had meant that its 14-acre site (the size of eight football pitches) had become inaccessible to people without an event ticket. The first step to counter this was the creation of an underground logistics centre, which has allowed Olympia Way—an arrival
point once clogged with lorries and Portacabins— to become an attractive pedestrian-first street.
From Olympia Way, visitors are welcomed up escalators and steps that rise between the exhibition halls. Here, a new rooftop street gives sweeping views of the city. Surrounded by bars, restaurants and plant-filled terraces, this social space is covered by a glazed canopy – a barrel-vaulted structure that echoes the roofs of the Grade II*and Grade II-listed Grand and National Halls. The canopy’s 520 glass panels fan outwards, beckoning the public upwards while sitting lightly within the historic architecture.
Rather than mimic Olympia’s Victorian design, the new buildings are inspired by its soulful qualities of light, depth, texture and rhythm. The pleated glass pattern of the Great Hall’s roof is a motif reflected in the canopy as well as the exteriors of the British Airways Theatre, citizenM hotel and Olympia Central offices—buildings whose design was led by Heatherwick Studio. You can also find its zigzag presence in the human-scale details the studio has crafted, such as the wooden handrails.
The highest structure, Olympia Central’s 550,000 sq ft of office space, benefits from stepped architecture. That reduces the building’s visual impact from street level, as well as creating a series of large outdoor terraces—up to about 100m in length—which have spectacular vistas.
At five storeys high and with 1,575 seats, the
British Airways Theatre is the largest new purposebuilt theatre in London in 50 years. Its entrance façade of glass appears almost like stage curtains pulled apart. Elsewhere across Olympia, you discover the British Airways ARC music venue, the Wetherby Pembridge school and the Hyatt Regency hotel, new structures for which SPPARC was the lead architect.
With its buildings opening in stages across 2026 and 2027, this new cultural district has a projected footfall of 10 million people every year. It’s a place where both culture and community can thrive. n
Impacts and solution in the context of connection delays
The Great Grid Upgrade is indispensable, but connection certainty has become a scarce commodity, and investors and developers are increasingly forced to plan for uncertainty, explains Charles Hardcastle
The complexity of re-mapping of Britain’s energy system is inevitable. Previously, power flowed out from large stations. Now, with generation increasingly coming from Scotland and the coast, demand growth is uneven and involves two-way flows, storage and new high-intensity loads.
The problem is that investors do not fund principles, they fund programmes with reliable dates. In the last few months, the industry has been reminded that there is a difference between an upgrade strategy and an investable delivery plan.
Following its publication of an Update on delays to connection dates for some TMO4+ Protected Projects, Ofgem admitted frustration that of 340 transmission projects with protected dates, 210 were expected to have their connection date and or connection point changed. Likewise for anyone trying to commit or attract capital, it was disappointing that projects believed to have a degree of certainty were in fact far from certain.
Our team works in the context of consents, land rights and programme delivery and we regularly see the impact of grid delays. A connection date is not just a technical milestone, but the point at which debt can be drawn, construction risk priced, revenue assumptions clarified and supply chain commitments made. Uncertainty in the timing changes not only the programme but the risk profile too.
It is easy to underestimate the true costs of a sixmonth delay. Retaining development teams, and renegotiating land and procurement options can be expensive but what makes the situation more difficult is that the queue itself is changing. Before the reform reset, according to NESO, the pipeline of projects seeking connections was over 700 GW, far beyond what was envisaged.
An inability to connect power has significant consequences. The Greater London Authority’s West London Electrical Capacity Constraints paper warned in 2022 that major new applicants to the distribution network, including housing and commercial schemes, could face waits of several years for connections. The Old Oak and Park Royal Development Corporation went further in its Q4 2022/23 Performance and Finance Report, listing electricity capacity issues in west London as a risk that stalls delivery of new housing.
Oxfordshire has provided similarly direct testimony. Written evidence to a parliamentary committee said over 7,000 homes in Bicester had been paused while awaiting grid connection reinforcement. Furthermore, in a House of Commons debate in December, it was claimed that up to 9,000 homes north-west Bicester were stalled due to a lack of grid capacity.
Then there is strategic demand. Ofgem’s demand connections update shows contracted offers in the demand queue rising from 41 GW in November 2024 to 125 GW by June 2025.
For many, the option of waiting does not exist because capital and supply chains do not pause. The
The only practical response is to plan on the basis of connection uncertainty and design the project so it can survive that risk
only practical response is to plan on the basis of connection uncertainty and design the project so it can survive that risk. There are investment strategies that can mitigate the impact of delay, as I have seen in practice in the work of experienced advisory teams.
One is to treat the grid as a scenario set: model a base case, a delayed case and a reconfigured case, then build decision points into the programme so that early spending buys options rather than locks in irreversible commitments.
Secondly, it can be possible to stage capital in line with deliverability evidence. Enablement works, land
Charles Hardcastle, is Partner Head of Energy & Marine, Carter Jonas
assembly, surveys and consents can move ahead while larger spend is held behind pending the clearance of hurdles such as a confirmed connection offer, secured route or defined reinforcement solution.
There is also the possibility of designing for modularity and flexibility, perhaps accepting a smaller connection earlier and expand later and working in flexible connections, storage and demand management.
Sometimes the answer is co-location and private wire. In others, behind-the-meter generation paired with storage can keep a site operational.
Finally, I advise aligning consenting strategy with delivery risk. Planning consents expire if not implemented. That risk needs managing from the start through phasing, conditions strategy and a clear plan for what constitutes meaningful commencement if a scheme needs to preserve a permission while the grid position is resolved.
The need for the Great Grid Upgrade is indisputable because the alternative is curtailment, higher system costs and investment drifting to jurisdictions that can offer firmer delivery. But confidence will only return through greater transparency, discipline in sequencing where possible and a more joined-up view of future demand. n
How systems thinking can safeguard placemaking in the next generation of new towns
Coutinho writes: Since the post Second World War period, new towns programmes have created planned settlements across the UK, aimed at tackling housing shortages and supporting regional development. Yet too often, the complex journey from concept to delivery erodes this ambition.
The housing design audit for England found that 75 per cent of new housing schemes delivered “mediocre” or “poor” outcomes, with one in five so poor they should have been refused. These outcomes arise from fragmented delivery, siloed decision making and governance structures which struggle to hold the original placemaking vision intact as programmes evolve.
Architects and designers set a clear vision, only to see their influence narrow once decisions move into delivery structuring, phasing, land release, commercial strategy and construction.
Placemaking is central to wellbeing and longterm community resilience, but the mechanisms that uphold it typically weaken after the early design stages. Architects and designers set a clear vision, only to see their influence narrow once decisions move into delivery structuring, phasing, land release, commercial strategy and construction.
What begins as a coherent, place-led concept can gradually be reshaped by short-term pressures, with design intent diluted along the way. This gap between ambition and delivery is common across complex programmes, where long time-frames, multiple actors, shifting priorities and external pressures – from policy cycles to market conditions – can overwhelm early intentions unless they are actively protected.
The governance gap at the heart of new town delivery
New towns rarely behave like unified major programmes. Instead, they emerge from a constellation of top-down and bottom-up projects, including transport schemes, utilities, housing parcels and community assets, delivered over extended timeframes by a mix of organisations. That reality poses a fundamental question: who holds longterm responsibility for place?
Development corporations can provide the neces-
sary custodial function where they are established. However, many large-scale new settlements now progress outside that model. National agencies, such as Homes England, also have an important role to play. This moment presents a clear opportunity to give equal weight to the quality, resilience and longevity of places as to the number of homes delivered, and to consider what structures and behaviours can safeguard these aims over decades rather than months.
How systems thinking protects design intent
To safeguard placemaking, new towns must be understood as integrated systems rather than a sequence of unrelated projects. Organisations with experience navigating major, multi-stakeholder programmes recognise that success rarely hinges on a single decision. Instead, it emerges from the way that decisions interact and influence one another over time.
A systems approach acknowledges this interplay, how procurement shapes design, how phasing affects community cohesion, and how governance determines whether placemaking principles persist or fade. With clearer visibility of these interdependencies, multidisciplinary teams can anticipate unintended consequences, maintain alignment across diverse partners and keep the original vision alive throughout delivery. This is the kind of discipline required on programmes where thousands of decisions accumulate into outcomes that will define a place for generations. In motorsport, a powerful engine does not win a race on its own; performance comes from the whole system working together. It is the same with new towns. Placemaking is protected when every part of delivery pulls in the same direction, and every decision reinforces the design intent.
Embedding systems thinking to secure long term placemaking legacies
Protecting placemaking requires governance and delivery arrangements that are clear, empowered and resilient. This includes creating frameworks where placemaking principles are genuinely embedded in decision making rather than referenced only at the outset.
It involves keeping the strategic, place-wide
Coutinho is an architect and head of development advisory services at Mace Consult
design custodians engaged beyond early planning stages so that their insight continues to shape how projects evolve. It also relies on clear lines of accountability for place outcomes across the organisations involved, supported by custodial roles, whether within local authorities, combined authorities or national agencies, that maintain continuity of vision throughout the lifespan of a new town.
Ultimately, these arrangements underpin the long term stewardship required to safeguard placemaking quality over decades.
When teams are empowered to challenge assumptions, escalate risks early and collaborate across organisational boundaries, place-led outcomes are far more likely to be sustained
Just as importantly, delivery partners and consultancy teams need a way to understand the cumulative impact of multiple dispersed projects, so that day-to-day decisions continually reinforce rather than dilute the overarching ambition for place.
This is an area where partnerships with experienced delivery specialists, accustomed to integrating complex systems, creating certainty, spotting risks early and driving real outcomes, can help public bodies, development corporations and other programme leaders establish the structures and processes that keep programmes aligned even when circumstances shift.
Experience from major programmes shows that, when teams are empowered to challenge assumptions, escalate risks early and collaborate across organisational boundaries, place-led outcomes are far more likely to be sustained. Delivery leaders who understand how programmes behave in practice, not just in theory, can help to navigate uncertainty, maintain visibility of placemaking priorities and translate ambition into tangible outcomes with clarity and confidence.
Alison
Alison
>>> A moment to reset how we deliver new towns at scale
The UK now has a rare opportunity to rethink how new towns are delivered and governed. By embedding systems thinking and ensuring that placemaking principles endure throughout the lifecycle, it is possible to move from fragmented, output-driven development toward genuinely place-led new towns that create lasting legacies.
Placemaking cannot rely on early ambition alone. It requires systems, behaviours and governance structures which ensure that good intentions
survive the complexities of real-world delivery. Getting this right means the next generation of new towns will not only deliver the homes we need, but also thrive as resilient and valued places where people genuinely want to live, work and grow. n
First published in Building Design, with kind consent
Alison Coutinho is an architect and head of development advisory services at Mace consult Consult, where she leads the UK Development Advisory Services team. She is also a member of the advisory panel for Building Design’s Designing Tomorrow’s Housing campaign.
Seven new towns proposed –what it could mean for you
from MHCLG
The government is proposing to build seven new towns across England to support the biggest housebuilding programme in over fifty years. This will help more people buy a home and live close to jobs and transport links. In addition, it is also announcing more details about the new National Housing Bank, backed by up to £16billion in funding to support building 500,000 new homes.
�� Where will the new towns be?
• Tempsford, Bedfordshire: over 40,000 homes to be built around a new East West Rail station, connecting you to vibrant cities Cambridge, Oxford, London and Milton Keynes.
• Leeds South Bank, West Yorkshire: circa 20,000 homes, capitalising on the city's economic momentum and a £2.1 billion local transport investment.
• Crews Hill and Chase Park, Enfield: up to 21,000 homes to help meet London's housing need
• Thamesmead, Greenwich: up to 15,000 homes unlocking riverside land in London, enabled by a planned Docklands Light Railway extension.
• Manchester Victoria North, Greater Manchester: at least 15,000 homes regenerating the heart of Greater Manchester, with a new Metrolink stop linking residents to jobs across the city.
• Brabazon and the West Innovation Arc, South Gloucestershire: up to 40,000 homes at the heart of a world-class research and advanced engineering economy.
• Milton Keynes, Buckinghamshire: building on its history as one of the original new towns, to take forward the ‘renewed town’ vision to expand the city by around 40,000 homes and reinvigorate the centre with a new local transport system, boosting connectivity in the Oxford-Cambridge Growth Corridor.
�� What will these towns be like?
• Every new town will be designed for modern, everyday life – with neighbourhoods that people can easily get around without a car, shared green spaces and vibrant high streets.
• Every new town will aim for at least 40% affordable housing - these are homes that are priced below the usual market rate, so people on ordinary incomes can afford them.
• At least half of those will be available at social rent - these are properties typically owned by the council or a housing association, with rents set low enough that even people on the lowest incomes can afford a stable, secure home.
�� The National Housing Bank - what is it and how does it help you?
• Launching on 1 April, the new National Housing Bank will be backed by up to £16 billion of public investment which is designed to unlock a further £53 billion of private investment and support the building of over 500,000 new homes.
• This is a government-backed financial institution that will make it easier, faster and less risky for developers to build the homes the country needs, including on large, complex sites that might otherwise sit empty for years.
• With an additional £400 million of support, both the National Housing Bank and regional Mayors will be able to issue loans and investments at lower interest rates to close viability gaps and unlock housebuilding across the country.
• For you, this means more homes being built, sooner, in the places where people want to live.
�� What happens next? • Final locations will be confirmed later this year
after the consultation and an environmental assessment are complete. • The National Housing Bank becomes operational on 1 April 2026.
• Together, all these measures form part of the government's commitment to build 1.5 million new homes this Parliament. n
The good location trap
Matt Harmsworth on why station-proximity doesn't make a simple site
There is a moment that most architects and planning consultants will recognise. The site looks good on paper. It has a strong policy narrative, proximity to a station, existing infrastructure nearby, and the kind of location story that writes itself in a committee report. Everyone involved feels quietly confident.
Then reality arrives.
The UK planning system is currently in the grip of a very particular kind of excitement.
The draft revised National Planning Policy Framework, published in December 2025, has placed station-led development at the centre of its growth agenda. Under policies S5 and GB7, proposed reforms involve establishing in-principle support, effectively a default yes for suitable proposals developing land around rail stations within existing settlements and around well-connected stations outside settlements.
On paper, this makes compelling sense.
Rail stations are well-placed to be the focus of wider investment in housing, local regeneration and the growth of commercial activity and are a natural focus for densification of housing across grey, brown and greenbelt sites. The logic is hard to argue with. Good connections mean less car dependency. Existing infrastructure means lower delivery costs. Higher demand means a stronger financial case. A policy framework pointing in your direction means a smoother planning story.
All true. All genuinely useful.
But here is what the policy does not tell you: none of that changes what is actually on the site.
The oldest mistake in development is to confuse a strong policy narrative with a simple site.
They are entirely different things. In fact, sites that look appealing on account of their location frequently come with more physical, ecological, and arboricultural complexity than their promoters first assume and that complexity has a habit of surfacing at the worst possible moment.
Consider what actually sits between a railway station and a development site. Older station environs often feature mature tree canopies that have been growing largely undisturbed for decades. A comprehensive BS5837 tree survey will outline how best to protect the roots and branches of retained trees, and mapping the Root Protection Area of each
tree ensures that trees within the site remain healthy during and after construction. Those root protection areas do not shrink because the planning policy framework has become more permissive. Under section 197 of the Town and Country Planning Act 1990, local planning authorities are under a specific duty to ensure that, in granting planning permission for any development, adequate provision is made for the preservation or planting of trees.
The trees do not care about Policy S5.
The same principle applies to ecology. Station catchment areas often contain brownfield scrub, boundary habitats, and linear features that are functionally excellent wildlife corridors. Bat presence and absence surveys can only be carried out between May and September, and many protected species surveys required to support planning applications can only be undertaken at certain times of year. Miss the window and you miss the programme. A scheme that could have moved forward in autumn is suddenly delayed until the following spring, and a strong policy position does not buy back lost survey time.
There is also a subtler complexity that tends to get underweighted in the early enthusiasm of a station-proximate site. Tighter site boundaries mean less flexibility in layout. Relationship issues with neighbouring uses, often more varied and intensive around stations, mean more pre-application negotiation. Level changes affecting access and design efficiency are more common than people expect. The cumulative weight of all these factors landing simultaneously, on a site that was supposed to be straightforward, is a story that plays out on planning desks across the country every week.
Design quality and sensitive masterplanning will be crucial to ensure that this new opportunity results in the creation of successful new communities around transport hubs. That is the considered view of those who have examined the draft NPPF most closely. But design quality and sensitive masterplanning require information. They require surveys. They require the kind of early-stage arboricultural and ecological input that gives the design team something real to work with, rather than assumptions that unravel at validation.
The answer is not to be pessimistic about sta-
Matt Harmsworth
is founder of ROAVR Group
tion-led development. It is genuinely a significant policy shift, and the opportunities it creates for wellprepared sites are real. Policy GB7(1h) now includes certain housing and mixed-use development near well-connected stations as not inappropriate development in the Green Belt, thereby circumventing the very special circumstances test and widening opportunities for development. That is meaningful progress for the delivery pipeline.
But the opportunity only becomes deliverable when the site has been properly understood.
Good locations matter enormously. They always have. However, the site still gets the final vote. The sooner the design and planning team let the site speak, through proper tree survey work, through preliminary ecological appraisal, through an honest assessment of what is actually there, the better the scheme usually becomes.
Not because it will be smaller or more constrained, but because the constraints are understood, designed around, and no longer capable of derailing the programme at a critical moment.
We are now in the heart of the survey season. Ecological surveys have narrow seasonal windows, and with bat surveys running only from May to September, the available time for data-gathering is compressing rapidly as summer progresses. Tree survey capacity follows the same pattern.
The policy framework has opened a door. The question is whether the site work is in place to walk through it.
Get the surveys done early. Let the site tell you what you are working with. Then build a scheme that deserves to succeed, because it was designed around reality, not just a railway timetable. n
Matt Harmsworth is the founder of ROAVR Group, a national arboricultural and ecological consultancy.
1.5 million homes, but no one to buy them
Demand side policy was never just about buyers, explains Hugo Owen
A small developer spots a plot of land. She can build nine homes on it. The numbers are tight, and with everything going on in the world, the Middle East, the cost of everything, they are tighter than ever. But she can just about make it work. She lines up the finance. She is ready to go.
All she needs now is some confidence that when the homes are built, people will be able to buy them. And yet for the first time in almost two decades, she has no idea if they will.
Help to Buy was never properly understood for what it was – some viewed it as a buyer subsidy whilst critics called it a developer handout. What it actually did was make the dream of home ownership real for many who wouldn’t otherwise be able to get on the ladder.
We have watched what happened next in our own numbers. The IFS argued last week that Help to Buy mainly benefited higher earners. The data from our own sales tells a different story about its absence. Since the scheme closed, the income of a typical buyer has risen by around 20%, on a home that costs almost the same now as then. At our most recent development, nearly a third of buyers paid cash. The IFS says Help to Buy helped the
wealthy. Our data since closure suggests scrapping it helped them more.
When buyers disappear, so do the developers building for them. Smaller housebuilders borrow money to build homes and pay it back when they sell. Unlike institutional players who can hold an asset against a substantial balance sheet, smaller developers rarely have that luxury. They need to sell to repay the loan and reinvest the profits in the next scheme. There is an immediate a direct correlation between rate of sale and rate of starts.
Help to Buy was the most visible part of the FTB mission but it was not the only part. The whole architecture around first-time buyer access, mortgage affordability rules, LTI caps, stamp duty, and government backed equity products, has been quietly eating away at peoples ability to buy over a number of year. Pocket spent the first part of this year working with Enfield Council on the Rebuilding the Ladder report, handed directly to Secretary of State Steve Reed, which tried to map exactly what needs fixing. The conclusion was not complicated. There are 5 things government can pull on: tenure and access, affordability rules, support schemes, fiscal measures& education. All need to be pulled at
A Pocket Living development: West Green Place in Haringey
Hugo is the policy and politics lead at Pocket Living
the same time.
What came after Help to Buy is illuminating. First Homes was supposed to deliver 10,000 homes a year. In 2024/25 it delivered none. The Mortgage Guarantee Scheme ran for five years. In that time not a single Pocket buyer was able to use the scheme. Not through choice, but because no major lender would apply it to new build flats.
Demand side intervention has always made ministers uncomfortable. The argument that it inflates prices plays well in certain rooms. It has never played well with someone paying London rent while their deposit target moves further away each year. People grasp fairly quickly that if you want them to buy a home you have to help them buy a home.
There is real energy in housing policy right now, we have the most pro-development government in recent memory and all of it is pointed at one question, how do we build more homes. Too little debate is undertaken asking what happens at the other end and what can be done, not just through equity schemes. You can fix every brownfield planning application in London. If the buyer cannot get a mortgage, the developer with a ticking loan does not build.
Every quarter the ONS publishes GDP figures and every quarter the 7am news leads with the same story: growth is flatlining. Dig into the data and construction is consistently one of the biggest drags. It is hard to know what people expect. A whole segment of the market has stopped functioning. Without first-time buyers, new homes do not get built. When they cannot buy, smaller developers do not build, and the growth figures say so.
Demand side policy was never just about buyers. It was the thing that made a whole tier of housebuilding function. Lose it and you do not just lose the buyer. You lose the developer too. n
Wishful thinking: CIL & A/C units
MHCLG published two pieces of advice at the end of June that might be construed as wishful (and therefore potentially misleading) thinking, comments Simon Ricketts
CIL
On 25 June the housing and planning minister wrote to all CIL charging authorities in England in relation to household developer exemptions:
“While the CIL Regulations provide clarity on the criteria that must be met and procedures that must be followed to secure relief or an exemption, the Government is aware of some historic cases where householders have failed to obtain an exemption due to procedural errors, which may have been inadvertent or unintentional.
In some instances, despite meeting the qualifying criteria, householders may not have followed the procedures set out in the regulations, and may not have applied for or received a CIL exemption before commencing development. In others, an exemption may not have been obtained because retrospective planning permission was granted after further works had already begun on a development that had previously benefitted from an exemption or was otherwise not liable for CIL. The Government recognises that this has, in some cases, resulted in the imposition of significant CIL charges under the regulations.”
Too true! See for example my previous blog posts CIL The Merciless (19 January 2019), Trent Won, Cil Nil (14 April 2021) and CIL: There Is No Equity About A Tax (10 July 2021).
So what is it proposing to do? First: “The Government is proposing to consult on a proposed package of targeted regulatory changes to make the operation of CIL clearer and more proportionate for householders and self-builders.“
So far so good (although if you asked me I would either entirely remove CIL liability for householder development or I would entirely remove the selfbuild exemption).
But, the second section of the letter is headed “historic cases” and has three strands:• “First, we strongly recommend all authorities to review their local CIL guidance and communication methods to ensure any household developers in their area are aware of the current exemptions and the necessary procedures to access them.” (What more or better communication does anyone suggest? Authorities do in my experience communicate the position both on their websites and via informatives on permis-
sions – the problem is the complexity of the system itself for people without the sophisticated tax administration advice needed).• “Second, while charging authorities have a duty to collect CIL that is due, they continue to have a degree of discretion over the steps they take to do so and when. This includes considering what is reasonable and proportionate in any given case and the appropriate timescales for enforcement activity. It has been brought to the Government’s attention that escalated enforcement actions, including threats of forced sale or criminal proceedings, have led to serious consequences for some individuals and families. Such action, or similar, is not required by the regulations without regard to local authorities’ broader legal obligations – and the precise approach to CIL collection in any individual case will depend on the specific facts and circumstances.
Exactly what enforcement steps to take, and when, to collect CIL in each case is a matter for the judgement of the authority concerned.”• “Third –where an authority feels this is justified – collecting authorities are able to make ex gratia payments of compensation from their general funds in exceptional CIL cases where payment has been made. Such payments would not constitute a waiver or refund of CIL, but rather a discretionary payment made from general funds, outside the CIL regime. These circumstances may arise where a charging authority considers that redress is appropriate because a householder developer would have been entitled to an exemption but, as a result of an administrative error, failed to claim it in accordance with the required procedure and now faces significant hardship as a consequence. There will be a range of considerations for local authorities in making such a decision, and in all cases, they should seek their own legal advice based on the facts and circumstances of individual cases.”
These last two suggestions in my view paint an over-optimistic picture to those who have incurred CIL liability through (often understandable) mistakes. Just look at the case law cited in the blog posts I mention, or indeed more recently R (Luck) v Bracknell Forest Borough Council (Lieven J, 14 November 2025) which reviews that previous case law:
Simon
Ricketts is a partner at boutique planning law firm Town Legal LLP
Personal views, et cetera
“A number of points in respect of the CIL regime can be drawn from this caselaw:
a. CIL is akin to a tax, see Gardiner at [35];
b. The purpose of CIL is to provide funding for necessary development and to provide certainty to developers and the collecting authority as to when and how such liability arises, see s.205 PA and Heronslea at [120];
c. The statute and Regulations form a detailed statutory code which is self-contained and carefully constructed, see Gardiner at [48];
d. The imposition of CIL is not discretionary, see Shropshire at [44];
e. There is a strict procedure set out in Regulation 54B, which is obligatory, see Gardiner at [57];
f. Liability for CIL must be precisely and reliably calculated on an objective basis, see Gardiner at [63].”
“Given that the Court of Appeal have held that CIL is a form of taxation, it is relevant to consider the caselaw on the scope of HMRC’s powers to waive tax which would otherwise be liable. In R (Clamp) v HMRC [2022] 1 WLR 1067 Butcher J was considering a judicial review concerning HMRC’s powers to enter into assurances with taxpayers as to tax liability.”
Butcher J in Clamp: “HMRC cannot properly, however, make concessions that tax should not be payable, where this is done not to facilitate the overall task of tax collection, but because they consider that a tax which Parliament has clearly imposed should not as a matter of principle or policy, or by reasons of considerations of equity, be payable.”
Lieven J in Luck: “Quite apart from the detail of the Regulations, there are two overarching reasons why it would be surprising if there was a broad discretion to waive CIL. Firstly, as is set out by the High Court in Clamp, one would not normally expect a
tax collecting authority to have an unfettered discretion to waive the tax that Parliament had set. That point is even stronger here than in Clamp, because the local authority under the CIL regime is not in the same position as HMRC with broad management powers and a fairly wide discretion to reach “arrangements” with the taxpayer. So, it is even less likely that the local authority would have such a broad discretion to waive liability.”
“Secondly, to construe Regulation 65(7) as a broad discretion to waive CIL seems inconsistent with the rest of the Regulations. It would be a wholly unfettered discretion, with no criteria set out, in marked contrast to Regulation 55. There is no parallel power in relation to demand notices, so if the liability notice can simply be withdrawn, the court would have to imply into the Regulations a power for the demand notice to be withdrawn or to cease to have effect. The Claimant argues that by withdrawing the liability notice the underlying liability itself ceases. However, for Regulation 65(7) to have this effect would be inconsistent with the Court of Appeal decision in Braithwaite, which held that the liability continues to exist even where the liability notice is withdrawn.”
Yes, the collecting authority does have some discretion as to the enforcement steps it will take. It also specifically has discretion as to whether to impose surcharges. But other than that it has to operate within the narrow tramlines of the legislation. For someone who has made a very expensive mistake which has caused them to lose the benefit of, say, the self-build exemption, the fact that the
authority may (may, no guarantee at all) choose not to resort to prosecution or an injunction to enforce payment is of little consolation if the house is ever to be mortgaged or sold.
As for the suggestion of the authority making ex gratia payments where the householder has made the administrative error rather than the authority… .really?? All that this is going to lead to is many detailed, often heart-wrenching, requests, often backed by increasingly assertive legal submissions, as to why in the particular circumstances an ex gratia payment should now be made. And it’s the hope that kills because surely the authority’s response, after spending time and resources as they “seek their own legal advice based on the facts and circumstances of individual cases” is going to be “no”?
Isn’t all this papering over the cracks rather than making proper repairs?
Air conditioning units
On the same day, 25 June 2026, MHCLG published a blog post, Air conditioning rules. It starts like this:
“There has been media coverage this week suggesting that air conditioning is banned in homes. This is incorrect.
Air conditioning can be installed in both existing and new homes.
In most cases, planning permission is not required to install it for a small home if it would not materially affect the appearance of the building from outside.
However, there is no blanket rule. People should speak with their local council to check the rules, and councils should take a common-sense approach.”
It ends like this:
“A government spokesperson said:
“Air conditioning units are not banned. They can be installed in both existing and new homes and we expect councils to take a common-sense approach to the rules around this, which are there to manage the interests of communities and the environment.”
So let’s assume I’m a member of the public and I’m thinking about installing an air conditioning unit. I assume that government spokesperson is not thinking of one of those internal units with a hose that waggles inefficiently out of the part-opened window?
If it’s a split unit device with an external unit and internal unit, the external unit does not have the benefit of any permitted development rights unless it is in the form of an air source combined heating and cooling unit (for which there is a right subject to limitations and conditions in class G of Part 14). Otherwise the question is one for the local planning authority as to whether in its planning judgment a large white box on the exterior of the building materially affects its external appearance, which will always come down to various site-specific factors. Are you going to check with the authority first before you make your expensive purchase? In many locations, and in the absence of formal government advice (which that blog post is not), I anticipate that officers would conclude that planning permission is required.
CIL and planning officers: I would welcome your respective thoughts on both of these announcements. n
A counterpoint to the death of the high street
Jonathan Eastwood on why saving Britain’s high streets means building a place where people belong
It seems as though we’ve been reading about the high street’s demise for years. Post-covid, signs of revival are emerging as occupiers and shoppers recalibrate how stores fit within a multichannel model. But what if the most profitable thing we can add to a high street isn’t another shopfront, but the ability to slow down?
The first question to ask about our high streets is deceptively simple: do people actually want to be there? In debates about vacancy rates, online competition and shifting retail mixes, a more fundamental truth is often overlooked: streets are not just supply chains for shops, but social environments. Where they succeed, people feel relaxed enough to linger and meet. Where they fail, they are simply conduits: efficient for movement, but poor for meaning. In other words, it isn't only just the retail mix that will save the high street, but rather a focus on connection, calm, managed commerce, fluidity, and humanscale design. All of which create and promote convenience. A practice known as placemaking.
Pedestrianisation and high street recovery: what the data shows Research carried out for Sicilian Avenue in Bloomsbury points to a clear preference for pedestrian-first environments among people who visit London for leisure.
Sixty-three percent of U.K. residents say they are more likely to choose cafés and restaurants on pedestrianised streets, rising to 67 per cent among 16–24s. This preference is not about convenience, but connection, and it aligns with wider findings that people are roughly 50 per cent more likely to spend time in spaces enhanced through placemaking, with large increases in feelings of safety, relaxation and cultural vibrancy.
People are increasingly intentional about where they spend time and money, choosing fewer places, staying longer, and demanding higher quality social experiences. More than half of visitors now seek more premium dining and social options than in 2019, climbing to 64 per cent for 25–34s.
The implications for high streets are profound. For decades, our town centres were engineered to move people through them, maximising flows and minimising friction. That mindset delivered footfall,
but not necessarily dwell time. The evidence reinforces a simple point: designing for dwell, rather than flow, is now the commercial differentiator.
Slowing down to create visitor value
This is not just a theory. Heritage-led pedestrianisation is emerging as a pragmatic, commercially sound strategy. Sicilian Avenue demonstrates how treating the public realm as social infrastructure first, and commercial infrastructure second, changes behaviours. In surveys, 95 per cent of business visitors and 88 per cent of tourists said they would visit the area for high-quality socialising. When the setting encourages people to slow down and connect, the surrounding businesses benefit from longer dwell time, higher average spend and more frequent returns.
This is supported by government-backed research, which finds that retail-led development on its own shows limited wider impact, while positive spillovers occur when schemes have explicit placemaking objectives. For London landlords and developers, this shift reframes value creation. Third spaces – those cafés, courtyards and plazas that sit between home and work – are no longer peripheral amenities; they are core infrastructure that underpins tenant demand and resilience.
Planning and policy: from footfall to dwell-time metrics
This being the case, local authorities face a parallel recalibration of priorities. High street recovery will not be engineered by retail mix alone, nor by chasing headline footfall.
The next phase of regeneration will be defined by metrics that track dwell time, repeat visits, and sentiment – quite literally how places make people feel, as well as convenience. Planning processes need to value human-scale design, reduced carriageway dominance, and friction points that invite people to stop.
Designing third spaces: making retail work better
Of course, none of this negates the importance of good retail. But it does make good retail work better.
Jonathan Eastwood is Head of Retail Agency at Knight Frank
A restaurant with a terrace shielded from traffic, audible conversation, and a view framed by trees does not compete on discounting, but on memory.
A bookshop that spills into a car-free mews, with benches and a kiosk window, converts browsers into regulars.
When the public realm signals calm and care, tenants can elevate their offer and pricepoint without alienating the audience, because the place itself is doing more of the heavy lifting.
A playbook for people-centred planning
• Prioritise people: continuous, high-quality pedestrian routes with safe crossings and generous dwell spaces.
• Embrace heritage: lean into existing textures, from materials to proportion and, façades, and edit, don’t erase.
• Program for pause: seating, micro-activation, and evening lighting that extends the day. Promoting convenience.
Build places that people choose, and performance follows
For those developing or stewarding urban assets, the question shouldn’t be “how do we drive more footfall?” but rather “how do we earn more of people’s time?” Because it is time that is the scarcest, most valuable resource. As shown by the latest government research, design guidance and industry case studies, pedestrianisation and placemaking, carried out with care, is the most reliable way to earn it.
If we build places that people want to be in, the high street will look after itself. n
The health of the high street
Can healthcare help drive town centre regeneration, or is this too far beyond its remit, asks Clare Strachan
The decline of traditional retail has prompted a rethink of what our high streets and town centres are for. As consumer habits have changed and online shopping has grown, many local authorities have been forced to look beyond retail-led regeneration and consider new ways to attract visitors, support local economies and sustain community life. Health hubs, GP practices, diagnostic centres and wellbeing facilities are finding their way into town centre regeneration schemes. At the same time, the NHS is seeking to modernise its estate and deliver services closer to the communities it serves.
Yet while healthcare has much to offer, it is not a cure-all for struggling town centres. If it is to play a meaningful role, it must be embedded within a broader regeneration strategy, rather than simply filling empty units.
Beyond Retail The debate around high streets is evolving. Housing, leisure, culture, education, and community infrastructure are now established ingredients of successful town centres. The National Planning Policy Framework reflects this, requiring local planning authorities to promote diverse uses supporting vitality and viability, and to apply a "town centre first" approach, including in relation to health facilities.
Projects such as the Bromley by Bow Centre in east London demonstrate how healthcare can be integrated with wider community services, creating places that support wellbeing and social inclusion.
The planning system has also created a permissive framework. The introduction of Use Class E in September 2020 brought retail, offices, light industrial, and medical or health services within a single use class. In many cases, former shops and banks can now be repurposed as GP surgeries or physiotherapy clinics without the need for planning permission, removing many of the regulatory hurdles that historically constrained healthcare uses.
An Anchor for Change? Healthcare's appeal as a regeneration anchor is understandable. Unlike many commercial occupiers, healthcare providers are not dependent on changing consumer spending patterns. Demand is driven by population need, giving it a degree of resilience that many other occupiers cannot match.
GP surgeries, outpatient clinics and diagnostic
centres can generate regular weekday footfall, which can support local businesses and increase town centre visits.
Healthcare can also improve accessibility to essential services. Town centre locations are often well served by public transport and can allow people to combine healthcare appointments with other activities. As planners increasingly focus on healthy placemaking, social value and inclusive growth, healthcare within town centres also aligns with wider policy objectives and offers benefits that extend beyond economic regeneration alone.
The Barriers to Delivery If the benefits are clear, why are healthcare-led schemes not more common? The issues are the practical, financial and legal challenges of delivery.
Many town centre properties were never designed for healthcare use. Converting former retail space often requires significant investment to meet accessibility requirements, accommodate specialist layouts and provide the infrastructure needed for modern healthcare services.
Funding remains a major hurdle. While healthcare-led regeneration can deliver significant longterm social benefits, upfront capital costs can be substantial. At a time when both NHS organisations and local authorities face budget pressures, securing funding for new projects can be challenging.
Class E flexibility, while valuable, has limits. It does not assist where the existing use falls outside Class E, or where a proposed health use is sui generis. Nor does it override existing lease restrictions. Even where planning law permits a change of use, a landlord may have granted a lease restricting the premises to retail use only, requiring the tenant to obtain landlord consent or vary the lease before a healthcare use can be introduced.
Cultural barriers persist too. Healthcare has traditionally been delivered from purpose-built facilities, often located away from town centres. Relocating services to high streets may require changes in operational models and investor expectations.
Vacant space alone, therefore, is not enough. Successful healthcare-led regeneration requires the right building, the right location and the right supporting infrastructure. Making It Work If healthcare is to contribute mean-
Clare
Strachan is Managing Associate at Stevens & Bolton LLP
ingfully to town centre regeneration, collaboration will be essential.
Local authorities, NHS Trusts, Integrated Care Boards, landlords, developers and local communities all have a role to play. Healthcare requirements should be considered early in regeneration and strategy discussions rather than introduced later to fill empty units.
There is also considerable potential in co-location. Combining healthcare services with libraries, community hubs, education providers and other public services can help maximise the use of public assets while creating destinations that attract a broad range of users.
Most importantly, solutions must reflect local circumstances. What works in a metropolitan borough may be inappropriate for a market town. Successful delivery depends on understanding local health need, estate capacity, and site-specific constraints.
A Role for the Commission The Health on the High Street Commission has an important opportunity to help move the debate forward.
By bringing together planners, healthcare providers, local authorities and regeneration professionals, it can help identify barriers to delivery, share best practice and encourage more joined-up thinking between the health and planning sectors.
Healthcare is unlikely to rescue every struggling high street. But where it forms part of a coherent, long term strategy, it has the potential to become a valuable component of town centre renewal.
The real opportunity lies not in replacing retail with healthcare, but in using healthcare as one component of a broader vision for healthier, more resilient and better-connected places. The challenge now is aligning planning, funding and delivery to realise that vision. n
Simplify pre-commencement conditions for BNG
The simplest win for planning reform would be to streamline pre-commencement conditions for BNG and unblock delivery, says Nicky Brock
There is no question that the planning system requires more speed and more certainty and much of what the government has put in place in the last year is on track to achieve this. But while, on a macro level, planning reform is heading in the right direction, for those of us dealing with planning applications day-in, day-out, it’s the small procedural frictions that cause the biggest frustrations.
The requirement for local planning authorities to approve pre-commencement conditions for biodiversity net gain (BNG) is perhaps one of the most important to unpick. BNG is doing exactly what it was designed to do: placing nature recovery at the heart of (almost) all development. The problem is how it is being sequenced. The current approach requires an extra post-consent approval step that can cause material delays.
If government wants a simple win that supports both nature recovery and delivery, it should focus on streamlining the pre-commencement mechanics of BNG.
How the problem manifests itself. I recently gained planning consent for a mid-sized greenfield housing scheme in Oxfordshire. Planning consent was issued within three months. The BNG solution, which was off-site, was straightforward: the units were purchased and the certificate submitted; yet eight weeks after consent we were still waiting for the BNG approval outcome. The knock-on effect is delays to housing delivery, including affordable housing, and to wider economic activity.
Where a scheme has already secured off-site units, the local authority is not being asked to weigh up competing habitat proposals or negotiate a bespoke ecological strategy: the developer is presenting a package that is designed to be compliant. Yet the statutory framework still requires a formal approval period before the condition is discharged and commencement can take place lawfully. This is not a theoretical scenario. Historically, I would work hard to avoid pre-commencement conditions and potential delays by submitting all necessary documentation at application stage so that technically, a development could start the day after consent. BNG is the outlier – and this sequencing is particularly hard to justify where the off-site gain is already verified and could be paid for.
What makes BNG different. We are used to precommencement conditions. They are a routine feature of planning permissions, and they exist for good reasons. Contamination, archaeology, drainage strategies, construction management and ecological mitigation can all be controlled through conditions that must be discharged before works start. The difference is that these conditions can usually be addressed either by providing the supporting information alongside the planning application or by discharging them swiftly following consent. In the case of BNG, however, legislation requires a specific document, the Biodiversity Gain Plan, to be submitted and approved after permission is granted and before commencement, as a requirement of the statutory ‘general condition’ introduced through the Environment Act changes to the Town and Country Planning Act. There is no flexibility for LPAs to alter this process because the mechanics are embedded in the regulatory framework for BNG, The Biodiversity Gain (Town and Country Planning) (England) Regulations 2024. What’s more, the Regulations (Paragraph 031) are explicit that the biodiversity gain plan must be submitted no earlier than the day after planning permission has been granted.
The broader impacts. Not only does this issue cause delays to specific schemes, it also exacerbates pressures on local authority planning departments precisely when capacity is most stretched. BNG submissions are arriving at scale, while many authorities are still bedding in a new regime and dealing with skills gaps that often include ecology and biodiversity. It also produces inconsistency. Some authorities require a full biodiversity gain plan to be submitted as part of the application and then a post consent pre-commencement condition discharge, thus double counting while others are willing to accept an outline approach with details to be submitted post consent. For developers, that variability makes programmes harder to manage and increases risk.
Another important point is that BNG can become uniquely rigid in a system where other forms of planning gain are often subject to negotiation and viability testing. It is hard to defend a process where some obligations may be revisited
when viability is tight, yet BNG has so little flexibility, even when compliance is not in doubt.
The need for a review. Defra has now published its response on improving the implementation of BNG for minor, medium and brownfield development. The proposed changes focus on proportionality; particularly exemptions, the small sites metric and access to the off-site market
All of that is useful, but it fails to address the key question of how the requirement for BNG can be realised without significantly delaying the planning process.
What a workable reform could look like. Streamlining does not have to mean weakening. A better approach is to align BNG with how we already manage other technical matters: clear principles at decision stage, with proportionate detail secured through staged approval and enforcement.
My recommendation is, where appropriate, to allow the required biodiversity gain plan to be approved prior to determination.
Crucially, this is a practical solution that should not require primary legislation. The Environment Act sets the principle, but much of the operation is controlled through regulations and guidance. Government could amend the Biodiversity Gain (Town and Country Planning) (England) Regulations 2024 and update Planning Practice Guidance to create flexibility around timing while maintaining enforceable outcomes.
BNG should remain non-negotiable in principle, but it should not be uniquely immovable in practice. If we want planning permissions to translate into homes and infrastructure quickly, streamlining the pre-commencement mechanics of BNG is one of the most straightforward changes that could be made - and one that could improve both delivery and confidence in the system. n
Nicky Brock is a partner with Carter Jonas
Culture in the City
The City of London urgently needs a cultural strategy – with architecture at its heart, says Leanne Tritton
The announcement that Universal Studios in Bedfordshire is going ahead has prompted a great deal of excitement.
The country’s most senior politicians have celebrated the arrival of the proposed £5 billion theme park, and we have heard about visitor numbers, economic growth, jobs, tourism and international profile. All worthwhile ambitions.
But why are we so focused on creating a new visitor destination when one of the world’s greatest cultural destinations already exists, yet isn’t properly fulfilling its promise – the City of London.
The comparison highlights something curious about the way Britain thinks about culture and place. We seem far more comfortable investing in the creation of new attractions than recognising the extraordinary value of those we already possess.
The City contains one of the most remarkable collections of architecture, public spaces and historic environments anywhere in the world. Within a relatively compact area, visitors can experience nearly 2,000 years of urban evolution, from Roman remains and medieval churches, to Victorian engineering and some of the most ambitious contemporary architecture on the planet.
Generations of architects, engineers, craftspeople, merchants, institutions and communities have
collectively created something extraordinary in the square mile and, unlike a theme park, it is entirely real.
Its stories are authentic. Its history is lived. Its streets reveal layer upon layer of human ambition, ingenuity, conflict, faith, commerce and reinvention. Yet despite this, architecture and the built environment continue to sit surprisingly low in our cultural thinking.
That feels like a missed opportunity. It is precisely why The London Society has recently led a collective response to the City of London Corporation’s Cultural Strategy consultation, bringing together organisations and individuals who share a belief that architecture and the built environment should sit much closer to the heart of the City’s cultural offer. Our argument is a simple one: architecture is not a specialist interest.
Every year, hundreds of thousands of people attend the Open House Festival. The London Festival of Architecture continues to grow. Visitors queue to enter buildings, explore neighbourhoods and discover the stories behind the places around them. What is currently missing is not public demand; it is coordination, ambition and yearround delivery.
The City already possesses many of the ingredients required to create a world-leading cultural
Leanne Tritton is chair of The London Society
programme centred on architecture and place. The London Centre, Open City, the NLA, the RIBA, the London Society, Blue Badge Guides, Livery Halls, cultural institutions and building owners all contribute valuable pieces of the puzzle.
But we have yet to bring them together into a coherent proposition.
Imagine if we treated architecture with the same seriousness that we apply to other cultural sectors.
Imagine if visitors could access a coordinated programme of tours, talks, exhibitions and open buildings throughout the year. If every significant building, public space, alleyway and route helped tell part of a larger story about London and Britain? If the City’s streets themselves were recognised as one of the country’s greatest cultural assets.
The economic benefits would follow naturally. Longer dwell times. More repeat visits. Greater footfall for cafés, restaurants and local businesses. Stronger civic identity. Better public understanding of how cities evolve and function. Open City already has the data that shows this to be true.
Most importantly, we would be making better use of a cultural asset that previous generations have already invested centuries in creating.
It’s surely right that Britain should be ambitious and invest in new destinations. But perhaps the greatest opportunity is not always to build something new. Let’s look at what we already have and finally recognise its value.
The City of London is not a museum. It is a living, evolving urban landscape that tells the story of Britain better than almost anywhere else. The question is whether we are prepared to start treating it as one of our greatest cultural assets. n
First published in the AJ
CIL and viability
Government’s
ability to influence delivery through viability policy is limited unless accompanied by more flexible, market-responsive planning and a stronger focus on land supply, argues Andrew Golland Dr Andrew Golland specialises
There is no shortage of commentary in the planning and property press about the challenge of delivering housing in a market where construction costs continue to rise while sales values remain stubbornly flat. Developers are understandably focused on maintaining viability, but local authorities face a parallel challenge: how to fund the infrastructure needed to support new communities when market conditions are so fragile.
Where planning obligations can be negotiated, there is usually scope to find a workable solution. But what happens when the charge is fixed? That is the fundamental problem with the Community Infrastructure Levy (CIL). Unlike Section 106 obligations, CIL is a non-negotiable charge based on floor area. It operates, in effect, as a tax on development.
For years, government has wrestled with the balance between certainty and flexibility. The previous Conservative administration proposed replacing CIL and much of Section 106 with a single Infrastructure Levy. Fortunately, that proposal has been shelved. A rigid, nationally applied levy would almost certainly have rendered many developments undeliverable, particularly in weaker housing markets.
Has CIL been a success? The evidence suggests not. Only around half of English planning authorities have adopted CIL, while in Wales just three authorities have implemented it. Many councils in the Midlands and North examined the system but concluded that local market conditions simply could not support it. Politics has also undermined its effectiveness. Councillors often welcomed the principle of CIL until it became clear that receipts are pooled and redistributed across a wide area. Communities expecting direct benefits from nearby development frequently discovered that funding would instead support projects elsewhere.
London has been the notable exception. Stronger development values have made CIL more workable, and the Mayoral CIL has successfully contributed towards strategic infrastructure projects such as Crossrail, where the benefits extend across the whole capital.
Even there, however, questions remain about how CIL receipts are spent. Authorities have accumulated significant unspent balances because suitable projects have not been identified or delivered. Neighbourhoods entitled to a share of receipts often receive sums too small to fund meaningful improvements.
While Section 106 contributions have also experi-
enced delays, particularly because of the difficulties housing associations face in delivering affordable housing, CIL has hardly proved the simple, effective funding mechanism originally envisaged.
The challenge of setting CIL. Establishing CIL charging schedules has always been difficult. Preparing a CIL Viability Study requires local planning authorities to make difficult choices about which infrastructure should be funded through CIL and which should remain the responsibility of Section 106 agreements. The process often produces cautious outcomes. Either land value benchmarks are increased to ensure development remains viable, or CIL rates themselves are set conservatively for the same reason. In neither case is infrastructure funding maximised.
The relationship between CIL and affordable housing thresholds also creates anomalies. Smaller residential developments escape affordable housing requirements but frequently pay the same CIL rates as larger schemes carrying substantial Section 106 obligations. Only rarely are CIL rates adjusted to reflect this imbalance.
Site-specific complications. Despite its reputation as a straightforward levy, CIL is far from simple. Although the basic rules are clear—charging only applies to net increases in floorspace, with exemptions for certain forms of development such as self-build housing—the detailed regulations surrounding occupancy and existing floorspace are highly technical. For example, buildings that have not been occupied for the required period cannot have their existing floorspace deducted from the CIL calculation, dramatically increasing liability.
Administrative arrangements can make matters worse. Planning permission and Section 106 agreements may be completed before a separate CIL officer identifies an occupancy issue, forcing agreements to be revisited because the CIL liability is substantially higher than originally anticipated.
Such complexities introduce uncertainty into a process that should facilitate, rather than hinder, development.
Exceptional Circumstances Relief. Recognising the rigidity of CIL, the regulations allow authorities to offer Exceptional Circumstances Relief (ECR). However, this is available only where authorities have adopted the relief, a Section 106 agreement is already in place, and a viability assessment
in the field of housing, planning and regeneration
demonstrates that CIL itself makes the scheme unviable.
In practice, obtaining relief is far from straightforward. CIL is often a relatively modest component of overall development costs. Affordable housing obligations typically have a much greater effect on viability than the levy itself. Consequently, many schemes are already unviable before CIL is considered, making it difficult to demonstrate that removing CIL alone would enable development to proceed. Developer profit assumptions also become heavily scrutinised, with debates over whether reduced returns might restore viability.
While ECR can unlock individual developments, it remains the exception rather than the rule.
Time for reform. Current market conditions expose the fundamental weakness of a fixed, nonnegotiable levy. When development values are rising, CIL can usually be absorbed by adjusting other planning obligations. When values stagnate and costs continue to increase, however, every fixed charge adds significantly to development risk The system has also become unnecessarily complicated, undermining one of its original objectives— greater certainty.
Ultimately, infrastructure is best funded through a healthy land market, where landowners bring sites forward at prices that properly reflect infrastructure costs. Where that cannot be achieved, local planning authorities need flexible mechanisms that allow infrastructure contributions to be negotiated according to changing market conditions.
Rigid national thresholds, such as those governing affordable housing and Section 106 contributions, run counter to that objective.
Infrastructure delivery should be guided by flexibility rather than inflexible rules. The Government should therefore take this opportunity to undertake a fundamental review of CIL. If the levy is to survive, it should be replaced by a system that is simpler, more responsive to viability, and capable of reflecting the realities of today’s development market. n
Planning appeals
Appeals are increasingly a route to planning consent - but at what cost? asks Andy Cowan
As appeal activity rises, it is becoming necessary to question why local authority approval so often struggles to reach a timely conclusion.
A planning appeal should be a safeguard, not a default planning strategy. Yet, in the current market, an increasing number of applicants are advised to see appeal as a rational commercial option rather than a last resort.
In our experience applicants are not necessarily eager to appeal, as appeal is expensive, uncertain and rarely helpful to relationships with local authorities or communities. Furthermore, we cannot assume that an inspector will take a more favourable view than the council. But where a policy-compliant scheme moves slowly, Section 106 negotiations drift or members refuse against officer recommendation, appeals may become the preferred option.
The Planning Inspectorate’s latest figures point towards a rise in appeal activity: Section 78 appeals received in January to March 2026 were 18.2% higher than in the same period in 2025, while the allowed rate for Section 78 appeals was 32% for April 2025 to March 2026.
In England, the government has put in place reforms intended to make appeal less necessary. The revised NPPF is more supportive of housing delivery. Planning committee reform and the proposed national scheme of delegation should make routine
and technical decisions less dependent on committee cycles. New call-in arrangements require authorities to consult the Secretary of State before refusing applications for 150 homes or more. The Section 106 roadmap also signals that delay and inflexibility are no longer tolerable.
These measures are about speed and certainty. They also carry the risk of creating the perception that as more decision-making moves upwards, local voices appear to become more absent. Is this a genuine threat to local democracy, or more a question of appearance than the reality?
My sense is that any democratic concern should not be overstated. Appeals do not remove local input, because inspectors must still take account of the local development plan (itself adopted by the LPA) and responses to consultations on a planning application made by members of the public or consultees. In non-determination cases, councils can still take an application to committee to determine what their view would have been or respond to changes in circumstances. For example, Wrexham Council’s members reintroduced reasons for refusal on a housing scheme after a legal decision on the adoption of their Local Development Plan.
The appeal route is not a democratic void but part of the planning system that Parliament has created. It can test whether local objections are planning
Andy Cowan is an Associate Partner, with Carter Jonas (Manchester)
objections, whether a refusal is robust and whether delay has become unreasonable.
Another way of looking at this is how towns and communities are impacted when policy-compliant development is delayed. With housing delivery facing acute pressure and the Government’s housing targets looking increasingly challenging, there needs to be a mechanism whereby a timely decision can be made. That said, when more decisions move away from committee, what is lost is the visible, public part of local planning: the debate in the room, the local explanation and the sense that a decision has been argued through in the place affected by it.
Committees can be political and inconsistent, but they can also provide a valuable forum in which local trade-offs are made in public. If residents believe that committee is only a staging post before the real decision is made by an inspector or minister, trust may suffer.
For this reason, appeal should not become the default answer to delay. Instead, for developers it should remain a strategic decision with risk attached. For councils, every avoidable appeal is a sign that the local process has not worked as it should. For government, a faster appeal system may help delivery in the short term, but it cannot substitute for wellresourced planning departments, up-to-date local plans and committees that are trained and willing to make difficult decisions.
The appeal system will remain necessary and important for as long as demand for new homes exceeds the capacity of local authorities to determine applications efficiently. The aim should not be to weaken appeal rights but to restore confidence in first-instance decision-making, so that appeal returns to its proper role as a safeguard for difficult cases, rather than the route by which too many acceptable schemes finally secure consent. n
Geospatial data for planning
Planning reform is accelerating, but the 2025 data shows a system still operating below capacity, says Josh Rains
Total application volumes remained subdued in 2025, with the national rate falling to 995 applications per 100,000 people – the lowest level in our dataset – and just under 690,000 applications processed nationwide.
Policy intent is clearer, but delivery conditions are tougher The Government’s pledge to deliver 1.5 million new homes in England, alongside the December 2025 draft National Planning Policy Framework (NPPF) reforms and the wider planning reform programme, signals an unmistakable “build” agenda.
Alongside this, the Planning and Infrastructure Act is intended to streamline the delivery of homes and major infrastructure, and to create greater certainty in how decisions are made. However, although reform can improve the mechanics of planning, delivery will ultimately be shaped by the interplay of people, process and technology. Progress will only move at the pace of the slowest of these three.
Lower-risk delivery, not expansionary delivery Last year, I suggested we were likely to see continued focus on feasibility and lower-risk pathways to delivery, with smaller residential activity remaining muted until confidence returned. The 2025 data supports that hypothesis.
Extensions fell again to 193,721 (28.1% of all applications) and new-build volumes declined to 198,240 (28.8%), while alterations and conversions rose to 274,366, now accounting for 39.8% of all planning activity.
In plain terms, the market is adapting, reusing and optimising what already exists rather than expanding at scale.
Decision outcomes reinforce the same picture of caution rather than collapse. In 2025, 463,089 applications were granted, with the national grant rate easing to 67.2% (down from 68.4% in 2024). Refusals accounted for 8%, slightly lower than the previous year. Stable decision rates, however, do not automatically translate into delivered homes.
Planning capacity is the limiting factor – and it is now widely acknowledged
Even if reforms simplify decision-making in principle, delivery will not accelerate at the pace intended unless local authorities have the resources and specialist capability to process and evaluate schemes effectively. Without sufficient planning capacity, expertise and resourcing, the people element remains a significant constraint.
At the same time, expectations around technology – from digital plan-making to the use of data and artificial intelligence – are rising faster than many parts of the system can currently absorb. Planning reform will only deliver its full benefits when these three pillars are aligned and working in concert.
Brownfield first, intensification and well-connected growth
This year’s data also makes clear that delivery is no longer defined purely by speed. It is increasingly defined by certainty and by the ability to assess risk, feasibility and policy alignment at an early stage.
England’s policy direction now firmly prioritises brownfield-first development, greater density and growth in well-connected locations. That places greater emphasis on understanding both the location and the context of development long before capital is committed.
Making place real through earlier data-based decisions
All of this reinforces the core point: reform may improve the how of decision-making, but delivery will ultimately be determined by the where, the whether and the constraints.
In 2025, we saw subdued application volumes and a clear shift towards adaptation and reuse.
Josh Rains is Managing Director, Landmark Geodata
Meanwhile, England’s policy direction points to brownfield-first development, greater density and better-connected locations.
This is where placemaking moves from principle to practice. Creating successful places requires more than allocating land or securing planning consent; it depends on accessibility, infrastructure capacity and the availability of the everyday amenities that make locations liveable and sustainable over time.
Data allows these qualities of place, often regarded as subjective, to be assessed more rigorously. By quantifying access to transport, services and community infrastructure, developers and planners can test whether a location genuinely supports the type of place they are seeking to create.
In this environment, geospatial and planning data become enablers of better outcomes, not simply faster decisions. They help identify constraints earlier, reveal opportunities with greater confidence and align schemes with policy objectives before risk escalates. In short, they help make place real at the point decisions are made, rather than after planning permission has been granted.
As our report shows*, reform may change how decisions are taken, but delivery will depend on where development is located, how well it is supported, and how effectively people, process and technology are brought together. In a planning system under pressure, early certainty and data-led insight are no longer nice to have; they are fundamental to turning ambition into delivery. ■
Landmark Geodata’s report: Data insights report: Planning Applications 2025 may be found here: https://tinyurl.com/bdzzfzhk
‘This beautifully illustrated survey brings fresh perspectives and insights to some of the world’s most celebrated and debated houses, with a special focus on the Modern Movement and what has come after. Few people will get the chance to visit all of these dwellings, but Owen Hopkin’s lively and engaging survey is the next best thing.’
Simon Bradley
Deloitte London Office Crane Survey
Deloitte London Office Crane Survey: Occupiers continue to prioritise best-in-class space, but development pressures deepen
• New construction starts fell by 35% year-on-year to approximately 4.8 million sq. ft., with refurbishments accounting for two thirds (66%) of all new start volume;
• 2025 saw the delivery of 7.1 million sq. ft. of new office space in central London, up 8% on 2024 and the third highest annual volume in the Crane Survey’s 30year history;
• Deloitte analysis points to a more selective development pipeline and a potential office supply gap from 2027 to 2030.
The latest edition of the Deloitte London Office Crane Survey has revealed a decline in new office construction starts and a drop in new builds, resulting from viability challenges and occupiers demanding the best-in-class space.
The survey – which collected data between 1 January and 31 December 2025 - noted that new start volumes in 2025 dropped to approximately 4.8m sq. ft. across 57 schemes. This was down from 7.5m sq. ft. in 2024 and 8.7m sq. ft. in 2023. This is also below the five-year average of 6.5m sq. ft.
New build projects more than halved year-onyear, accounting for 1.6m sq. ft., down from the 3.6m sq. ft. recorded in 2024. The strategic pivot to refurbishment projects continued, with 3.1m sq. ft. commencing. This represented two thirds (66%) of new starts, though this was down from 3.8m sq. ft. in the previous year. Refurbishments have now outstripped new development throughout the post-Covid period.
In 2025, 7.1m sq. ft. of office space was delivered to market, a rise of 8% from 2024. This also marks the third highest volume recorded in the Crane Survey’s 30-year history, surpassed only by 2003 and 2023.
This survey points to a potential supply gap from 2027 to 2030, as fewer new schemes have
started or completed, as developers are tending to bring forward only the most robust opportunities.
However, developers are confident about the resilience of demand among occupiers for grade-A office accommodation. Most developers anticipate that their office pipeline will either ‘increase’ (58%) or ‘remain stable’ (34%)’ over the next 12 months. Three quarters (75%) of developers also reported feeling more positive about leasing demand than 12 months ago. The report also noted that prime rents hit £187 per sq. ft. in the West End, where vacancy sits at just 1%.
Caroline Waldock, partner, real estate sector lead for Deloitte, said: “London’s office market remains attractive, and the capital continues to attract global investment, talent and businesses. Occupier requirements and demand for best-inclass space is strong and is underpinning record prime rents.
“Larger tenants are facing scarcity, with competition for high-quality assets that are suited to companies’ changing sustainability and technology requirements. However, while developers are confident in their pipeline, there are real delivery constraints, which brings with it a potential future supply gap.”
Philip Parnell, partner and head of real estate valuation at Deloitte, added: “Developers are once
again facing rising construction costs and financing uncertainty alongside planning complexities associated with delivering projects in the capital. The continued shift to refurbishments goes beyond sustainability requirements and represents challenges around scheme viability, delivery risk and addressing occupiers’ evolving needs around quality and flexibility.” n
Deloitte’s London Office Crane Survey measures office development activity across Central London and covers only new-build construction and significant or comprehensive refurbishment schemes of 10,000 sq. ft. and above. The survey covers the City, West End, Docklands, King’s Cross, Midtown, Paddington and Southbank.
Survey construction metrics exclude cleared sites with no construction activity, demolition-only or strip-out-only sites, and schemes where construction has halted prior to completion.
In the context of the survey, new builds are schemes that create a new structural frame (typically on cleared sites or following demolition of the previous structure).
Refurbishments are significant or comprehensive works to an existing building that retain the existing structural frame.
From this edition onwards, the annual survey period runs from 1 January to 31 December
London's office market remains structurally attractive. Demand has not disappeared. It has concentrated, with occupiers prioritising the best space, investors continuing to favour resilient assets and developers seeing key opportunities in prime locations. London's role as a global business hub continues to support that demand
But the market is becoming materially harder to serve. Construction costs, planning delays, selective capital and geopolitical uncertainty are all putting pressure on development viability. At the same time, ESG has become a baseline expectation, whilst Al is starting to raise the bar again by increasing the demand for secure, connected and digitally resilient buildings. The gap is widening between assets that are future-fit and those at risk of obsolescence.
The question, then, is not whether demand for London offices remains, but which assets will be best placed to capture it. How should developers, investors and occupiers respond when quality is being rewarded more strongly than ever, but is also becoming more expensive, more complex and more difficult to deliver?
The answer from this report is clear: London's office market is becoming a market of selective winners. Future value will concentrate in assets that are prime, sustainable, digitally resilient and capable of meeting more demanding occupier needs. As viability pressures constrain delivery, those able to plan early, invest selectively and execute with discipline will be best placed to capture demand.
BRIEFING BRIEFING
LETTERS
Agglomeration benefits
From: Mark Willingale, Willingale Associates
Yesterday’s Forum meeting (June) was very interesting. After the discussions, just a thought on the subject of agglomeration benefits and a suggestion that the London Planning & Development Forum could invite some of the key proponents to present their models, given their perceived influence on and prevalence in planning policy eg the London Plan, Northern Powerhouse, East-West Rail, Crossrail/Elizabeth Line and now Central London offices?
At the Forum, Alex Jan's analysis of the demand and productivity of Central London offices was driven by the deemed advantages of environmentally sustainable accessibility by public transport and the agglomeration benefits of the Elizabeth Line, even though these benefits have been accompanied by a decline in Central London office use since the opening of the line as a result of changes to hotel and residential use, particularly in Westminster.
There's still much debate on the modelling of agglomeration benefits depending on the system being analysed, for example the Overground orbital, LTC Option C, East-West Rail or Crossrail/the Elizabeth Line and debate on the degree to which it is a focused Jane Jacobs effect rather than a diffuse function of urban mass and population.
Alex mentioned Dan Graham (Imperial College) and Tony Venables (LSE) as key sources for algorithms on agglomeration benefits, to which you can include Prof. Ian Gordon, who was ready to raise questions on them yesterday.
To add my view, I would agree that agglomeration benefits seem to be a focused effect i.e. to enjoy the Jane Jacobs effect you need to be on the same street or in the same neighbourhood for a specific demand. To that extent you would expect the accessibility of
The LSX Leicester Square project
Plans by Soho Estates to redevelop eight properties on Leicester Square into a major new visitor attraction with a four-storey LED screen on its facade are set to be submitted for planning permission next month. The LSX Leicester Square project by MATT Architecture would create a ten-storey “immersive” experience with a Piccadilly Circus-style exterior screen and four basement levels next to the square’s Odeon cinema. Soho Estates, which started acquiring the site’s buildings in the 1990s including the Burger King located at the corner of the square and Bear Street, said it wanted to “transform this corner of Leicester Square, unlocking its full potential and establishing it as a destination that plays an active role in the life of the Square.”
the Elizabeth Line to reinforce the specific demands for the City and Soho as mapped at the meeting.
But there is also another agglomeration effect, not mentioned, but profound in the development of London resulting from the absorption of satellite settlements leading to people aspiring to live or work in Bloomsbury, Islington, Kensington or Croydon etc. Each former satellite sustains its own Jane Jacobs agglomeration effect. Consequently, an orbital line that might not be regarded as providing agglomeration benefits comparable to a radial line like Crossrail can still generate significant benefits by increasing mutual access to a ring of separate agglomeration foccii served by the orbital.
The success of the Overground would be an example. It would be interesting to see how the proponents of agglomeration and their models would quantify this benefit. n
We will try to bring this discussion to the 9th September Forum which is being hosted by Prof. Ian Gordon at the LSE. – Ed
'Affordability
not shortage is behind housing crisis'
Unaffordable housing costs sit at the heart of London's housing crisis and cannot be explained simply as a supply problem, says the Centre for London
In the past two decades, house prices have risen far faster than earnings, the think tank says, drawing on ONS population and dwelling data and GLA affordability statistics.
It said its examination of housing stock and affordability data shows that overall housing availability in the capital has barely changed over the past two decades.
In 2002, London had about 421 homes per 1,000 people, a figure that dipped slightly after the financial crisis but has returned to a similar level in recent years.
The number of dwellings per household has also risen over that period, increasing from around one home per household to just over 1.1 today.
Rob Anderson, research director at the Centre for London, explained that at the heart of the problem is a fairness and distribution problem.
The homes that do exist are increasingly owned by fewer people, and in ways that do not help ordinary Londoners - by renting them out expensively, leaving them empty and selling them at prices most people cannot afford.
In research shown to the Local Democracy Reporting Service, he argued that the inflation comes from factors such as who is buying up the housing stock, which includes foreign investors who buy London property as an asset rather than a home, pushing prices up.
Anderson added: "There are as many owneroccupied homes per person today as in 2010, but
CLIPBOARD CLIPBOARD
houses are much more expensive. Home ownership is 270% more expensive than it was in 2002.
"Private rented homes are much more common, but rents have risen significantly as a share of incomes and now take up 42% of average private renter income."
He added that the data revealed that London had "experienced a deepening crisis of housing distribution" which had been driven by demand-side factors (economic policies and market forces driven by consumer demand) and changes in the tenure mix (such as owner-occupier, social housing) – as much as overall housing supply.
"The availability of social and affordable housing has collapsed and – while the relative availability of private housing has increased – the accessibility of private housing has fallen dramatically due to price inflation relative to incomes," he added.
In addition, he said although London was particularly susceptible to other factors such as macroeconomic forces and the tax system, they were "too often absent from the conversation about the city's housing problems".
He added: "London's present housing crisis should be understood as a 'winner-takes-all' problem where changes in tenure mix and the distribution of stock are central to the collapse in meeting housing need."
The solution, he said, requires the acceleration of the private market supply of homes in London, expanding the delivery of social and affordable homes and addressing "demand-side" issues.
Industry figures say this could come in the form of cracking down on foreign investors, implementing rent controls and providing low-interest loans to housing associations to build social homes.
London Mayor Sir Sadiq Khan has repeatedly argued for rent controls, most recently listing rent control powers among his key devolution demands.
Both Conservative and Labour governments have rejected granting these powers, arguing rent controls would reduce supply and worsen affordability.
– BBC News
Court clears Gatwick plan
GATWICK Airport has moved a step closer to breaking ground on its eagerly anticipated expansion after a court dismissed a pair of legal challenges brought by local campaigners.
Queen Elizabeth II garden by HTA Design in Regent’s Park
“It’s there if you want to see it,” says HTA Design partner James Lord of the subtle symbolism within the practice’s design of the new Queen Elizabeth II garden in Regent’s Park, conceived as a celebration of the late monarch’s life, legacy and love of nature.
As they stroll around the tranquil garden, sharp-eyed visitors may well spot motifs in the folly metalwork referring to the four home nations. But they will surely have no idea that the pergola’s 56 steel uprights refer to the number of countries in the Commonwealth, for example, or that the number of sections in the cast terrazzo pathway equals the years of the late sovereign’s reign.
And that’s the way the designers like it – they are happy for the garden’s planting, and its overall air of calm and wellbeing, to be the story.
“We’re not trying to excite people in the design. It’s very recessive and lets the planting be the main exhibit,” adds Lord.
Despite the background hum of the city, the garden is a place of calm and birdsong. Created on a former storeyard, the project has been designed as a biodiverse, climate-resilient garden with a particular emphasis on material reuse, including a surprising second life for the concrete on the brownfield site. HTA took cues from both the Queen’s favourite gardens and the surrounding park for the layout and content of the new landscape, which is part of a long traditional of individual gardens within the Royal Parks.
In a ruling, High Court judge Mr Justice Mould said the government's assessment of the project's environmental and climate impact was "lawful and reasonable" and branded the local opposition's complaints as being "without foundation".
Campaigners had argued that Heidi Alexander, the secretary of state for transport, failed to lay out a feasible means of funding essential infrastructure or improve local sewage treatments in her department's biueprint for the expansion published in September.
The Communities Against Gatwick Noise Emissions (CAGNE) also objected to the increased noise burden and detrimental effect on air quality that the £2.2bn expansion would have.
But the judge dismissed the group's two claims for a judicial review, in a decision that paves the way for the expansion of Britain's second-largest airport.
A spokesperson for Gatwick Airport hailed the judgment as a "victory for common sense", adding: "Our exciting plans will deliver significant business,
tourism and trade benefits for the UK, including 14,000 new jobs and a Elbn boost to the economy every year." A spokesperson for the Department for Transport said: "This is a project that balances our environmental and climate commitments with huge economic benefits."
Alexander approved plans for the multi-billionpound project last autumn, which will see the south London hub convert its existing emergency runway into a fully functional strip.
The aviation hub will need to shift the runway 12 metres north in order for it to be used full-time for the departures of smaller, short-haul planes. The expansion is expected to create as many as 14,000 new jobs and provide a Elbn annual boost to the UK economy.
Alexander hailed the development, which could be wrapped by 2029, as a "no-brainer" in the government's battle to revive Britain's stuttering economy.
– CityAM n
¡¡ PILLO! PILLO!
A housing system
inflicting both feast
and famine
England has two types of housing support. First, tenants in social housing enjoy discounted rents. Second, anyone deemed needy after a means test, whether in a private home or a social one, can receive a rent subsidy ("housing benefit"). The Economist crudely calculates that discounted rents to the first group add up to an implicit subsidy of f2obn ($25bn) a year.
For the two-thirds of social-housing tenants who are on welfare, this saving is mostly recycled within government, lowering the benefit bill needed to cover rent. But for the remaining onethird not on welfare, it's a bonanza.
New social lets in Kensington and Chelsea were nearly 80% below market rents in 2024-25, a f32,000 annual saving per household. Social tenancies are often for life and can even be inherited. Once you're in, there's no more means-testing, regardless of how much your fortunes improve. Of the 4m households in social housing in England, more than 10% have incomes in the national top 40%. Some are rich. The wife of the president of Sierra Leone, who lives in a palace, was recently found to have a council home in London as well.
Thus, some high earners enjoy ultra-cheap social housing, while more than 1m households
Crinkle-crankle wall featured in Kensington Gardens pavilion
Mexican practice LANZA atelier’s concept for the annual commission in Kensington Gardens references a traditional type of English garden wall known as a serpentine, or a crinkle-crankle wall.
Called A Serpentine, the scheme is an enclosure surrounded by a one-brick-thick wall with the typical undulating shape of crinkle-crankle walls, which provide stability.
The pavilion, which allows light and air to permeate the space, aims to challenge the idea of walls as features of division by inviting visitors to see through the scheme.
on benefits rent from private landlords. In much of the country, housing benefits are stingy and rents are high, so this latter group is at risk of homelessness.
A system that arbitrarily foists feast on some and famine on others is not just.
– The Economist
The actual countryside...
Ben Goldsmith says the meadows, orchards and fruit and vegetable gardens in their estate — as well
BELOW: There is good news for unbearable bladders as new toilets have opened up at Morden Tube station. They are part of TfL’s “Equity in Motion” plan to expand provision across the network.
as Ham Common and 2,500-acre Richmond Park next door - were what convinced him and Zac to become ardent environmentalists. "I grew up with a feeling that I was in the countryside. And, in fact, when I went to the actual countryside I remember being incredibly disappointed," he says.
Despite the extraordinary memories, however, the Goldsmith dynasty, Lady Annabel having died last year, have decided to say goodbye to Ormeley Lodge, which is on the market for £25 million.
– The Times
RIBA president calls for ‘strong leadership’
RIBA president Chris Williamson has called for ‘strong leadership’ to provide stability to the built environment sector following Kier Starmer’s resignation.
With former Manchester mayor Andy Burnham to become Prime Minister, Williamson said Starmer had made “some positive changes” to the UK during his two years in power.
But he warned that any change in leadership would create uncertainty at a “critical time” for the built environment sector amid ongoing housing, climate and cost of living crises.
“Strong leadership is needed to provide the stability and focus needed to realign national priorities and accelerate action to address them. n
The number of applications received down 10 per cent from the same quarter last year
Latest planning performance by English districts and London boroughs: planning applications in England during January to March 2026
OVERVIEW
Between January to March 2026, district level planning authorities in England:
• received 79,600 applications for planning permission, down 10% from the same quarter a year earlier;
• decided 68,400 applications for planning permission, down 4% from the same quarter a year earlier;
• granted 59,400 decisions, down 3% from the same quarter a year earlier; this is equivalent to 87% of decisions, unchanged from the same quarter a year earlier;
• decided 91% of major applications within 13 weeks or the agreed time, unchanged from the same quarter a year earlier; and decided 19% of major applications within the statutory period of 13 weeks, unchanged from the same quarter a year earlier;
• granted 6,700 residential applications, down 5% from the same quarter a year earlier;
• granted 1,300 applications for commercial developments, down 10% from the same quarter a year earlier; and
• decided 33,500 householder development applications, down 7% from the same quarter a year earlier. This accounted for 49% of all decisions, down from 51% a year earlier. In the year ending March 2026, district level planning authorities:
• granted 259,600 decisions, down 2% from the year ending March 2025; and
• granted 28,100 residential applications, down 4% from the year ending March 2025.
To view this data in more detail please see our interactive dashboard
Planning applications received
During January to March 2026, authorities undertaking district level planning in England received 79,600 applications for planning permission, down 10% from the same quarter a year earlier. In the year ending March 2026, authorities received 315,900 planning applications, down 5% from the year ending March 2025 (Live Table P134, PS1 Dashboard). The applications in these figures include applications for outline planning permission, applications for approval of reserved matters, applications for full planning permission and applications to vary or remove a planning condition.
The figures collected by the department are the total numbers of planning applications submitted to local planning authorities, and don’t include a breakdown of the type of application or, in the case of residential applications, the number of units included in each application, such as the number of homes in the case of housing developments. The department supplements this information by obtaining statistics on housing applications from a contractor, Glenigan.
The Glenigan applications data is a new addition to MHCLG’s Planning Application Statistics series this quarter. Data up to December 2025 has undergone quality checks by MHCLG and is published below.
Residential units - outline applications
The latest provisional figures show that 3,110 outline residential applications were made in the year to December 2025, down 3% from the 3,200 outline residential applications made in the year to December 2024. Within these applications, 206,000 units were applied for in the year to December 2025, up 54% from the 134,000 units applied for in the year to December 2024.
Residential units - detailed applications
The latest provisional figures show that 20,430 detailed residential applications were made in the year to December 2025, down 3% from the 21,030 detailed residential applications made in the year to December 2024. Within these applications, 303,000 units were applied for in the year to December 2025, up 19% from the 254,000 units applied for in the year to December 2024.
Planning decisions
Authorities reported 68,400 decisions on planning applications in January to March 2026, down 4% from the same quarter a year earlier. In the year ending March 2026, authorities decided 298,100 planning applications, down 3% from the year ending March 2025 (Live Tables P120/P133/P134, PS1/PS2 Dashboard).
Applications granted
During January to March 2026, authorities granted 59,400 decisions, down 3% from the same quarter a year earlier. This represented 87% of all decisions, unchanged from the same quarter a year earlier. In the year ending March 2026, authorities granted 259,600 decisions, down 2% from the year ending March 2025. Authorities granted 87% of all decisions, up 1 percentage point from the year ending March 2025 (Live Tables P120/P133, PS2 Dashboard).
Applications on hand
Authorities reported that they had 107,500 applications on hand as at 1 January 2026, up 2% from the same quarter a year earlier. This is 57% above the number of decisions made during the quarter. The corresponding figure for the same quarter a year earlier was 49%. Taking account of numbers of applications received, decisions made and applications withdrawn during the quarter gives a total of 114,600 applications on hand as at the end of March 2026, down 3% from the same quarter a year earlier (Live Table P133, PS1 dashboard).
Historical context
Figure 1 shows that, since about 2009-10, the numbers of applications received, decisions made and applications granted have each followed a similar pattern. As well as the usual within-year pattern of peaks in the Summer (July to September quarter) and troughs in the Autumn and Winter (October to December and January to March quarters), there was a clear downward trend during the 2008 economic downturn, followed by a period of stability. There was a large dip in 2020 following the start of the pandemic and a subsequent recovery in early 2021, including a particular peak in applica-
Planning decisions by development type, speed of decision and local planning authority.
All tables and figures can be found here:
Source: DLUHC/ONS
tions received, but since the peak there has been a steep downward trend.
Regional breakdowns
Table 1 shows how numbers of applications received, decisions made and decisions granted varied by region. It also shows how the percentage of decisions granted varies widely by region, from 81% in London to 90% in South West (Live Table P133, PS1/PS2 Dashboard).
Speed of decisions
In January to March 2026, 91% of major applications were decided within 13 weeks or within the agreed time, unchanged from the same quarter a year earlier. 19% of major applications were decided within the statutory time period of 13 weeks, unchanged from the same quarter a year earlier.
In the same quarter, 87% of minor applications were decided within 8 weeks or within the agreed time, down 1 percentage point from the same quarter a year earlier. 38% of minor applications were decided within the statutory time period of 8 weeks, down 1 percentage point from the same quarter a year earlier.
Also in the same quarter, 90% of other applications were decided within 8 weeks or within the agreed time, down 1 percentage point from the same quarter a year earlier. 56% of other applications were decided within the statutory time period of 8 weeks, down 2 percentage points from the same quarter a year earlier.
Use of performance agreements
‘Performance agreement’ (PA) is an umbrella term used here to refer to Planning Performance Agreements, Extensions of Time and Environmental Impact Assessments (EIAs). The EIA process is undertaken to assess whether a project will have a substantial impact on the environment, with applications having an accompanying Environmental Statement[footnote 3] (see Technical Notes for further definitions of PAs). Between January to March 2026, 43% of all planning application decisions involved a performance agreement. Major developments were more likely to involve a performance agreement compared to minor and other develop-
ments with 77% of major decisions involving a performance agreement, compared with 54% of minor decisions and 37% of other decisions (Reference Table 2, PS2 Dashboard).
Figure 4 shows, from April 2010, the numbers of decisions on major, minor and other developments made involving a performance agreement, compared with numbers without a performance agreement. Notwithstanding definition changes, there has been a marked increase in the use of agreements since early 2013 (see Technical Notes for more information). This longer upward trend has been driven by both the additional scope for recording them and their additional use (Live Table P120, PS2 Dashboard).
Performance of individual district level local planning authorities
The existing approach to measuring the performance of authorities was introduced by the Growth and Infrastructure Act 2013 and is based on assessing local planning authorities’ performance on the speed and quality of their decisions on applications for major and non-major development (minor, change of use and householder developments). Where an authority is formally designated by the Secretary of State as underperforming, applicants have had the option of submitting their applications for the category or categories for which the authority has been designated
(and connected applications) directly to the Planning Inspectorate (who act on behalf of the Secretary of State) for determination. See Improving planning performance: criteria for designation for more information. Further details of designated authorities, including of applications submitted to the Planning Inspectorate, are available at Planning Applications (s62A).
Speed of decisions
The designation thresholds, below which a local planning authority is eligible for designation are:
For applications for major development: less than 60% of an authority’s decisions made within the statutory determination period or such extended period as has been agreed in writing with the applicant;
For applications for non-major development: less than 70% of an authority’s decisions made within the statutory determination period or such extended period as has been agreed in writing with the applicant.
Quality of decisions
The threshold for designation on applications for both major and non-major development, above which a local planning authority is at risk of designation, is 10% of an authority’s total number of decisions on applications made during the assessment period being overturned at appeal.
Once the figures for the relevant period have been published in Live Table P152 or P154, which identify local planning authorities are at risk of designation by exceeding the threshold, they are invited to contact departmental officials with any data corrections, and information on any exceptional circumstances applying to the authority that might be used as reasons why the Secretary of State should not designate them. The Secretary of State then takes this evidence into account when making decisions on which authorities should be designated. See Live Tables P152/P154
Ten local planning authorities are currently designated by the Secretary of State in relation to the quality of decision-making for major applications. These are:
Cherwell District Council
Dacorum Borough Council
Epping Forest District Council
Hertsmere Borough Council
Lewes District Council
Malvern Hills District Council
Rossendale Borough Council
South Tyneside Council
Staffordshire Moorlands District Council
Wychavon District Council
Lewes District Council was designated on 8th May 2024, while the rest were designated on 15 June 2026.
Residential decisions
In January to March 2026, 8,900 decisions were made on applications for residential developments[footnote 4], of which 6,700 (76%) were granted. The number of residential decisions made was down 3% from the same quarter a year earlier, with the number granted down 5% from the same quarter a year earlier. 900 major residential decisions were granted, down 2% from the same quarter a year earlier and 5,800 minor residential decisions were granted, down 5% from the same quarter a year earlier (Live Table P120A, PS2 Dashboard). In the year ending March 2026, 37,200 decisions were made on applications for residential developments, of which 28,100 (76%) were granted. The number of residential decisions made was down 6% from the previous year, with the number granted down 4% from the year ending March 2025. 3,600 major residential decisions were granted, down 3% from the previous year and 24,500 minor residential decisions were granted, down 4% from the previous year.
Residential units
The figures collected by the department are the numbers of decisions on planning applications submitted to local planning authorities, rather than the number of units included in each application, such as the number of homes in the case of housing
developments. The department supplements this information by obtaining statistics on housing permissions from a contractor, Glenigan.
The latest figures on the number of residential units permitted provided by Glenigan have been removed from this publication while MHCLG and Glenigan undertake further quality assurance. We will publish the estimate as soon as possible, once data quality has been further assured.
Commercial decisions
In January to March 2026, 1,500 decisions were made on applications for commercial developments[footnote 6], of which 1,300 (90%) were granted. The number of commercial decisions made was down 12% from the same quarter a year earlier, with the number granted down 10% from the same quarter a year earlier. 300 major commercial decisions were granted, down 22% from the same quarter a year earlier and 1,100 minor commercial decisions were granted, down 7% from the same quarter a year earlier (Live Table P120B, PS2 Dashboard).
In the year ending March 2026, 6,300 decisions were made on applications for commercial developments, of which 5,700 (90%) were granted. The number of commercial decisions made was down 8% from the previous year, with the number granted down 7% from the year ending March 2025. 1,200 major commercial decisions were granted, down 9% from the previous year and 4,500 minor commercial decisions were granted, down 6% from the previous year.
Trends in the percentage of residential and commercial decisions granted SEE Fig 6 BELOW
Householder developments
Householder developments are those developments to a residence which require planning permission such as extensions, loft conversions and conservatories (see Definitions section of the Technical Notes).
The number of decisions made on householder developments was 33,500 in the quarter ending
March 2026, accounting for 49% of all decisions, down from 51% of all decisions made in the quarter ending March 2025. Authorities granted 91% of these applications and decided 93% within eight weeks or the agreed time (Reference Table 2, PS2 Dashboard).
In the year ending March 2026, 151,900 decisions were made on applications for householder developments, accounting for 51% of all decisions, unchanged from 51% of all decisions made in the year ending March 2025. Authorities granted 90% of these applications and decided 93% within eight weeks or the agreed time.
Permission in Principle/Technical Details consent decisions
Since April 2017, local planning authorities have had the ability to grant permission in principle (PiP) to sites which have been entered on their brownfield land registers. Where sites have a grant of permission in principle, applicants have been able to submit an application for Technical Details Consent (TDC) for development on these sites. In addition, since June 2018, it has also been possible to make an application for PiP for minor housingled development as a separate application, independently of the brownfield register. Where a site has been granted PiP following an application, it is possible to apply for a TDC.
Figures on PiP/TDC decisions have been collected on the quarterly PS2 return from January 2020. During January to March 2026, local planning authorities reported 429 PiP (minor housing-led developments) decisions, 35 TDC (minor housing-led developments) decisions and 1 TDC (major developments) decisions. The number of PIP decisions has increased notably since 2020, when there were about 60 decisions per quarter. The figure of 429 in January to March 2026 is up 137% from the same quarter a year earlier. (Live Table PiP/TDC1, PS2 dashboard).
Permitted development rights
Planning permission for some types of development has been granted nationally through legislation, and the resulting rights are known as ‘permitted development rights’ (PDRs). For certain permitted development rights, if the legislation is complied with, developments can go ahead without the requirement to notify the local planning authority.
Hence no way of capturing this data exists and these are not accounted for in this report. In other cases, the permitted development right legislation requires an application to the local planning authority to determine whether or not prior approval is required and to determine as appropriate (see the Definitions section of the Technical Notes).
Between January to March 2026, 5,200 applications were reported, of which prior approval was not
required for 2,700, permission was granted for 1,500, and 1,000 were refused. This resulted in an overall acceptance rate[footnote 7] of 81%. Large householder extension accounted for 53% of all PDR applications reported, with 32% relating to All others, 6% relating to Agricultural to residential, and 6% relating to Commercial Business and service to residential (Live Tables PDR1/PDR2).
In the quarter to March 2026, 700 permitted development right applications were made for changes to residential use, of which 500 (69%) were given the go-ahead without having to go through the full planning process.
Overall during the 48 quarters from April 2014 to March 2026, district planning authorities reported 380,300 applications for prior approvals for permitted developments. For 209,900 of them prior approval was not required, 91,700 were granted and 78,700 were refused (Live Table PDR2).
Delegated decisions
Of the 68,400 decisions made during the quarter, 65,900 (96%) were delegated to officers. This percentage has been stable since 2014, having previously increased from around 75% in 2000 (Live Table P133).
Enforcement activity
During the quarter, authorities issued 1,435 enforcement notices and served 1,411 planning contravention notices, 180 breach of condition notices, 18 stop notices and 73 temporary stop notices, while 9 enforcement injunctions were granted by the High/County Court and 0 injunctive applications were refused. In recent years, this level of activity has remained broadly proportionate to the number of planning decisions made (Live Table P127). n
Living on London's waterways; Underspending of developer CIL and s106 contributions; Emergency measures in relation to the predicted shortfall in office space; Visitor numbers to London
Account of the London Planning and Development Forum meeting on Tuesday 9th June 2026 hosted by London Councils
Report also at www.planninginlondon.com >LPDF
TOPICS
More people are living on London's waterways than ever and that there are more opportunities to develop more waterside housing in the city. Steve Craddock, Canal River Trust’s Planning Manager for London & South East
The underspending of developer CIL and s106 contributions
James Stevens, Director for Cities at the HBF and Laurence Thompson, the author of the report chaired by Lee Mallett
The LPA report calling for emergency measures in relation to the predicted shortfall in office space in London
James Wickham, Partner Newmark and WPA Chair of the Planning Consultants Group and Andrea Williams, Policy & Communications Director, London Property Alliance
How events in the middle east are now hitting visitor numbers to London?
London and Partners L&P could not attend but their presentation is included in this report
Attendance on Tuesday 9th June 2026 hosted by London Councils
Brian Waters, chairman, Brian Whiteley, RTPI
Katharina Winbeck London Councils
Michael Jubb, Chair London Forum of Amenity Societies
James Thorpe, wbd-uk, Nigel Bidwell, JTP architects, Tim Gough, Austin Winkley, James Harris, Lichfields, Lars Christian, Mattiasanti, sasi-studio
Speakers:
James Wickham, Newmark
Alexander Jan, CWPA
Andrea Williams, CWPA
Alex Paterson, Canal River Trust
Steve Craddock, Canal River Trust
James Stevens, HBF
Laurence Thompson, HBF
Apologies:
Riette Oosthuizen HTA Design
Wamiri Fuller London and Partners
Nick Smith@londoncouncils
Prof Michael Edwards, UCL,
Professor Jessica Ferm, UCL
Maria Diaz, GLA
Tom Dobson Quad
Michael Bach, London Forum of Amenity Societies
Peter Eversden, London Forum of Amenity Societies
Canals and rivers: managing a fragile national asset
Alex Patterson and Steve Craddock of the Canal & River Trust think Britain’s canals are far more than heritage backdrops. They are working infrastructureageing, complex, increasingly under pressure
Craddock, planning manager for the Trust’s southern region, set out the scale of the operation. Since taking over from British Waterways in 2012, the charity has managed 2,000 miles of canals and rivers across England and Wales. Much of this network is man-made and around 250 years old, with tunnels, embankments and cuttings, never designed to modern engineering standards.
‘These are fragile assets,’ Craddock noted, ‘and they’re becoming more so in a changing climate.’
Large sections carry ecological protections. Thousands of structures are listed. The Trust insists it should be understood as a major infrastructure provider - not simply a leisure operator. Alongside boating and tourism, canals play a role in water supply, including potential large-scale water transfer projects such as moving water from the Midlands to the South via the Grand Union Canal.
They also host other infrastructure: roads, rail, utilities and digital networks often intersect with or run alongside waterways. ‘We’re not just managing canals,’ Craddock said. ‘We’re supporting a wider infrastructure system.’
Beyond engineering, the Trust emphasises its role in providing green and blue space. With free public access along towpaths and waterways, the network delivers health, social and economic benefitsencouraging active travel, supporting waterside businesses, and contributing to urban regeneration.
In London the Trust manages 60 miles of waterways, including docks at Canary Wharf. Around 1.5 million people live within a short walk of this network, across 16 boroughs. Many of the capital’s major development zones - King’s Cross, Old Oak Common, and the Olympic legacy area - intersect with canals.
That proximity makes planning critical. The Trust has three statutory roles: it is a consultee on planning applications, on nationally significant infrastructure projects, and - more recently - on local plan preparation. The aim, Craddock stressed, is early engagement. ‘We try to design out problems before they arise.’
In practice, the Trust objects to only around 1% of applications. More often, it works with developers to mitigate risks - particularly where construction could destabilise embankments or damage canal walls. Early advice can prevent costly redesigns.
The risks are real. Craddock pointed to cases where inadequate consultation led to structural failures, including water leakage through canal walls. Some risks are less visible. In Islington, for example, major development sites sit above the Regent’s Canal tunnel. Without careful planning, works above ground could compromise infrastructure below.
Alongside protection, the Trust is increasingly focused on placemaking. Through joint ventures and
partnerships, it has helped deliver developments such as Brentford Lock and schemes in Tottenham and Bow. It works with local authorities on policy and design, as seen in its collaboration with the Old Oak and Park Royal Development Corporation.
These partnerships aim to integrate canals into new development - improving public access, creating active frontages, and introducing uses such as moorings, bridges and public realm enhancements. ‘It’s about making the canal part of the place, not the back of it,’ Craddock said.
There are also emerging opportunities. Canals can support low-carbon infrastructure, including water-source heat pumps for heating and cooling. They can contribute to biodiversity net gain and, in some cases, provide routes for transporting construction materials by water - though this remains underused.
The Trust sees potential for more intensive use of water itself. Floating development is one area of interest, particularly in docks. However, planning
policy often treats waterways as protected open space, limiting such innovation.
A more immediate challenge is the rapid growth in boat living, particularly in London. The number of boats on the network has risen sharply, with around half used as homes at least part-time, driven by housing pressures. The system is struggling to keep up. The Trust has limited powers to control boat numbers and faces constraints in providing infras-
tructure such as moorings, electricity and waste facilities. Continuous cruising rules - requiring boats to move every two weeks - are increasingly difficult to enforce.
‘We see this as a housing as much as a waterways issue,’ Craddock said, arguing planning policy should do more to support permanent residential moorings. At present, these require planning permission and often conflict with policies protecting waterways as
open space.
Funding is a persistent concern. The Trust operates as a charity, drawing income from a mix of government support, property assets, boating licences, utilities and commercial activity. While it retains a government settlement, this has reduced over time, increasing pressure on other income streams.
Freight is another underdeveloped area. While canals can support the movement of materials, practical constraints - limited wharf space, competing land uses, and cost - mean uptake is limited, particularly in London. Existing facilities are under pressure from redevelopment.
Despite these challenges, the Trust continues to promote a proactive approach. It offers free preapplication advice - unusual among statutory consultees - and is developing guidance to help designers respond to canal contexts. Rather than prescribing solutions, guidance emphasises a context-led approach.
The message to developers and planners is clear: engage early, think holistically, treat canals as active, complex systems rather than passive edges.
Questions arising included whether new canals might be built, how the network can be funded, and whether its infrastructure is sustainable. The Trust’s focus remains on managing what it already has: a historic network carrying modern demands, and requiring careful stewardship to remain viable.
‘It’s a national asset,’ Craddock said. ‘But one that needs constant attention - and better understanding of what it really is.’ n
A £9bn scandal of unspent developer contributions
The Home Builders Federation says this is an issue that is 'about to boil over'
James Stevens, Director for Cities at the Home Builders Federation (HBF), and Laurence Thompson, Policy and Campaigns Office reported ‘a simmering issue in England’s planning system is beginning to boil over: billions of pounds paid by developers for infrastructure and community benefits are sitting unspent in local authority accounts’ – according to the HBF’s latest annual report on this issue. If developers are paying, why aren’t communities seeing the results?
A system under strain
Local authorities in England are holding around £9 billion in unspent Section 106 and Community Infrastructure Levy (CIL) contributions - an increase of £800 million on the previous year. Developer contributions are a core part of how infrastructure is funded. Government estimates suggest they total around £6 billion annually, equivalent to nearly half of all local authority spending on housing and community development. The private sector is underwriting a significant share, yet much of that money is not reaching the ground.
Developers don’t object to paying. As one speaker put it, ‘most housebuilders are very keen to make these contributions.’ Their frustration is they want to see tangible delivery - schools, roads, housing - to demonstrate the value of development to often sceptical communities. Without that visible link, trust erodes.
Section 106 vs CIL: where the money sits
The majority of the unspent funds - around £8 billion - sit in Section 106 agreements, rather than CIL. This surprised even some analysts, who had assumed CIL, with its need to accumulate funding for large projects, would dominate. Instead, Section 106 - intended to mitigate the direct impacts of development - accounts for the bulk. Even more concerning, around one-third of these funds have been held for over five years. That delay raises difficult questions. Section 106 contributions are legally tied to specific developments. In theory, they should be spent relatively quickly to offset impacts such as increased demand for schools or transport. In practice, they are often
left idle.
CIL, by contrast, is more widely used in London and the South East, where it supports major infrastructure. Outside those regions, authorities still rely heavily on Section 106.
London: a microcosm of the problem
Data from 28 boroughs shows £1 billion in unspent Section 106 funds and £740 million in unspent CIL - around a fifth of the national total. On average, each borough is holding roughly £35 million.
Some boroughs stand out. Tower Hamlets, Wandsworth and Hammersmith & Fulham are among those with the largest accumulated balances. These are also areas with ambitious affordable housing targets - often around 50% - which may partly explain the build-up of ‘in-lieu’ payments where on-site delivery proves unviable.
Education accounts for the largest share of unspent Section 106 funds - around £2 billion nationally, or 30% of the total - and is particularly prominent in London. This reflects the long timelines of major developments: it can take years before population impacts are clear enough to justify new school capacity.
Why isn’t the money being spent?
Throughout the discussion, a consistent theme emerged: capacity constraints within local
authorities.
Staff shortages, limited expertise, and competing demands slow decision-making particularly in planning departments - from negotiating agreements to delivering projects. One participant described the problem bluntly: ‘under-resourcing is seeping into every aspect of the process.’
Fragmentation compounds the issue. Section 106 agreements are often negotiated by one team but delivered by another, with little coordination. As one developer put it, ‘there is a Chinese wall between teams, and conversations are not happening.’ Money accumulates faster than it can be deployed.
There are structural challenges. Infrastructure projects - schools, transport upgrades or housing schemes - require significant upfront planning and capital. Identifying viable projects, securing approvals and coordinating delivery can take years.
Funds earmarked for specific purposes - such as education - may no longer match local needs by the time they are ready to be spent. Yet legal constraints limit flexibility, leaving money stranded.
A question of priorities
For developers, the issue is not just inefficiencyit is viability. The cost of building homes has risen sharply in recent years, by as much as £76,000 per unit, and closer to £98,000 in London. At the same time, developers face an expanding policy
requirements: environmental mitigation, biodiversity targets, water neutrality measures. Each requirement chips away at viability.
‘There is a limit to how much value can be extracted from development,’ one speaker argued. ‘We may have reached it.’
This is particularly acute in London, where rising costs, complexity and investor sentiment are dampening development activity. Several major housebuilders have scaled back their work in the capital, while international investment has cooled.
If money is being taken from development but not used effectively, it raises fundamental questions about the system’s purpose.
The affordable housing dilemma
Affordable housing sits at the centre of this debate - and illustrates its contradictions.
Section 106 has become a primary mechanism for delivering affordable homes, either on-site or through financial contributions. But in practice, delivery is often constrained by viability, funding gaps and the capacity of housing associations.
In many cases, developers make payments in lieu of on-site provision. These funds are then held by local authorities - but, as the data shows, are not always deployed.
This has led some to question whether Section 106 is the right tool for the job. Would affordable housing be better funded directly by central government, rather than relying on negotiated contributions?
The idea is gaining traction, particularly among smaller developers who struggle with the complexity and uncertainty of Section 106 negotiations.
Visibility and trust
One of the more striking themes of the discussion was the lack of visibility around developer contributions.
Communities often perceive that developers are not paying their fair share. In reality, billions are being contributed - but the benefits are not always visible.
Improving transparency could help bridge this gap. Clear reporting on how funds are used - and why delays occur - might build public confidence and reduce opposition to development.
Some authorities already publish detailed infrastructure funding statements, but compliance is
inconsistent. In fact, the proportion of councils producing these statements has declined.
Better communication, participants argued, is essential. ‘It’s not going to solve everything,’ one speaker noted, ‘but it’s not going to hurt.’
Reform or rethink?
What can be done? The report’s recommendations focus on improving the existing system:
• Spend funds more quickly, particularly Section 106 contributions.
• Maintain flexibility to use funds where needs change, while preserving the link to development.
• Take account of existing balances when assessing new infrastructure requirements.
• Strengthen local authority capacity, including staffing and expertise.
There is also support for allowing unspent funds to be redirected to alternative infrastructure serving the same development, rather than reverting to developers. Some participants argued that incremental reform may not be enough.
Critics describe the current system as ‘broken,’ pointing to its reliance on negotiated contributions to fund major public goods. Others called for obligations to be tied to mitigating development impacts - and for broader infrastructure and housing funding to come from central government.
More radical ideas included the use of municipal bonds to give local authorities greater financial autonomy, or the creation of larger delivery bodies to pool and deploy funds more effectively.
There is tentative optimism for greater collaboration. Developers, commercial property groups and local authorities all share an interest in making the system work. Historically, coordination has been limited. There are signs this may be changing. Industry bodies are beginning to align their messaging, particularly around the need to spend contributions and demonstrate public benefit. If momentum builds, that could strengthen the case for reform.
The bigger picture
The debate over unspent Section 106 and CIL funds reflects a deeper tension in the planning system. Development is expected to fund a wide range of public goods - housing, infrastructure,
environmental mitigation, skills training and more. But the system struggles to deliver those outcomes.
This tension becomes self-defeating. As costs rise and viability declines, development slows. As development slows, contributions fall. As contributions fall, the system’s ability to fund infrastructure weakens.
Breaking that cycle requires more than technical fixes. It demands clearer priorities, better coordination, and a more realistic assessment of what development can - and cannot - be expected to deliver.
£9 billion sitting in local authority accounts is a scandal, and a stark reminder of the gap between intention and delivery.
Too little of the right sort of office space is available in a highly polarised workspace market. It has damaged London’s economy, say James Wickham, and Alexander Jan
A joint presentation by James Wickham, Partner, Newmark and Alexander Jan, Chief Economic Adviser, London Property Alliance argued that something potentially damaging is happening in the central London office market. At precisely the moment when demand for high-quality workspace has rebounded, supply is tightening - structurally, stubbornly, and potentially dangerously.
This is not a story about empty offices postCOVID. It is a story about scarcity: too little of the right space, in the right places, for the businesses that drive London’s economy.
There is a growing mismatch. Demand for toptier, ‘Grade A’ space is robust. Take-up across central London is running above long-term averages, with demand around 7% higher than historic norms. Vacancy rates are low. In Westminster, availability of prime space has fallen to below 1%. This means there are companies that want to be there but can’t find space.
Supply is failing to keep pace. Planning applications - especially major ones - have declined sharply over ten years. In Westminster, they have fallen by three-quarters. There is a growing shortfall, estimated at one million square metres of prime space.
The problem is made more acute because of quality. Demand is concentrated for the best buildings - new, well-located, amenity-rich. These are thriving. Secondary and tertiary stock is not.
Data tells a stark story. Take-up of prime has surged dramatically since 2020. Demand for lowergrade offices has stagnated or declined. Grade C space has seen take-up fall by up to 75%. The ‘flight to quality’ defines the market. This is causing tension. While demand rises for high-quality space, supply of that space is constrained or shrinking.
Across inner London, there has been a loss of offices, converted to residential use, or to hotels. In Westminster this trend is pronounced. Unlike New York, where zoning flexibility allows for vertical expansion and rebalancing, London’s planning framework makes such changes effectively permanent. This matters because offices are economic infrastructure, not just buildings.
Central London’s office-based sectors - finance,
professional services, information and communications - generate high levels of output per worker and support big supply chains. For every 100 office jobs, an estimated 18 additional jobs are created in retail, hospitality, and other services.
The concept of agglomeration, firms and workers clustering together, is central to how modern urban economies function. Dense networks of businesses enable knowledge sharing, innovation, and access to specialised labour markets. Infrastructure investment is justified on this basis. The Elizabeth line was not simply about faster journeys or reduced congestion. Its economic case rested on its ability to bring an additional 1.5 million people within a 40-minute commute of central London.
Infrstructure alone is not enough. If planning policy constrains development of buildings that enable agglomeration, then investment can be undermined. London has invested billions in improving access to its core. Yet in key locations, office capacity is declining. The consequences are visible in the city’s poor economic performance.
Since 2008, productivity growth in London has slowed dramatically. Once growing at around 2–3% annually, it has stagnated. London’s slowdown is particularly significant because of its outsized role in the UK economy. Central London accounts for 12% of national output. When its productivity slows, effects
The causes of this slowdown are housing costs, global economic shifts, Brexit, and changes in working patterns. There is growing evidence constraints on high-quality office space are part of the picture. Some of London’s most productive sectors - finance, professional services, and technology - are most affected.
The structure of London’s economy has also shifted. Real estate has grown as a share of output, while knowledge-intensive exporting sectors have declined. This reflects rising property costs and the ‘financialisation’ of assets. But it also reflects a failure to expand supply. When space is scarce, costs rise and some firms are priced out. And when those firms are among the most productive the national consequences are significant. London generates a big fiscal surplus - estimated at £40 billion - which supports public spending across the UK – or not.
What is driving the constraints? Planning policy is central. A combination of recent objectives has restricted office development. Environmental concerns, around embodied carbon, have led to tighter controls on demolition and redevelopment. Retrofit can limit the ability to deliver the kind of buildings that modern occupiers demand.
ripple across the UK - lower wages, reduced tax revenues, and diminished capacity to fund public services.
Heritage considerations, design requirements, and a proliferation of detailed standards - from cycle parking to amenity space - add complexity and cost. Collectively these factors can become prohibitive.
Financial incentives for local authorities are weak. Much of the additional tax generated by commercial development is redistributed nationally. For boroughs the benefits are not sufficient to outweigh the political costs. The system discourages the development it needs.
Central London is, in many respects, one of the most sustainable places to locate employment. Its transport network, high employment density, and efficient buildings mean the carbon footprint per worker is lower than the national average. If the goal is to reduce emissions while supporting economic growth, then enabling well-designed, high-quality office development should be part of the solution, not a casualty of it.
There must be a clearer recognition that offices are critical economic infrastructure. They are fundamental to delivering the UK’s industrial strategy. Planning policy should more explicitly support development of high-quality commercial space in central locations. This means giving greater weight to the economic benefits of such development.
There needs to be a more realistic assessment of future demand. Current projections for employment growth notably in Westminster, appear pessimistic. Underestimates will constrain supply.
There should be a reassessment of the cumulative impact of detailed policy requirements. Where standards are out of line with usage - such as underused cycle parking provision - they should be revisited.
This is about productivity, competitiveness, and the long-term health of the national economy. London has spent decades building its position as a global centre for business. It has invested heavily in infrastructure to support that role. The question now is whether its planning system will enable or constrain the next phase of that growth, and potentially see that role go elsewhere. n
▪ ?0*61&'@"A(#'&#"712(#&'*7)%1&@%7&'0"1'*@2#()%B' /(77%/&*)*&C, “the contraction of office space has constrained its ability to drive productivity gains” !"#$%&'()*+#,(-.*(/.#0.#(1*.23*'4(566$+#738(9:9;<
7#2+&30$6'2('2$0'*30$3)+"'&,+,#/$(../60&$8/* 9:; /8 the Capital’s land and 47% of its GVA ▪ !"#$%&'()*+,-,+.$/0'1('12$"3/$4'/+0.$5##2$(&,-#2$,2$ *#2+&30$6'2('2$0'*30$3)+"'&,+,#/ ▪ 7'&#$*,+.$*#2+&#$%&'()*+,-,+.$8&'1+"$9#00$9&'4 <=>; 4)* (006' :;<<=$+'$;<<>?$+'$:=?;$:;<<>$+'$;<@A?
▪ >.%&,2%#"#9&,?&5.%&I3"J/B%5.&3"#%&F2/"-&?,1&3/19%38&B8&+,#-,#K&21,7"-%-&/&@/L,1&,22,156#"58&5,& -1"7%&21,-6$5"7"58&91,45.&– but it has only partially been seized to date…
▪ Without “picking winners” economic growth should be given greater weight in planning decisions F#/5",#/338*&+,#-,#&P3/#&/#-&"#&3,$/3&23/#0K
▪ Doing so would help to secure growth in output and employment in the UK’s most sustainable 3,$/5",#*&?,1&5.%&$,6#518&/0&/&4.,3%
Tourism in London: impact of the Iran war
Will Amiri-Fuller, head of public relations, London & Partners, London’s growth agency was unable to join the Forum meeting but sent this presentation
At a macro level, the biggest concern isn’t just the immediate conflict, but the knock-on effects –particularly energy prices and ongoing supply chain disruption. If that continues, there’s a real risk of slower global growth, which inevitably feeds through into travel demand.
But for tourism specifically, the bigger story is actually about sentiment. Travel is incredibly sensitive to perceptions of safety, and what we’re seeing is a sharp drop in demand into the region – around a third down – with impacts likely to last for several months even if conditions stabilise.
There are also wider implications because the Middle East is such a key global aviation hub. Disruption there doesn’t just affect the region – it impacts global connectivity, particularly for longhaul routes and markets like Asia-Pacific.
So, what does that mean for London?
In the short term, we are expecting a decline in visitors from the Middle East – around 25% yearon-year – particularly from markets like Saudi Arabia
However, it’s important to put that in context. This follows a period of strong growth, and overall the outlook suggests this is a short-term shock rather than a long-term structural shift
We’re likely to see some near-term softness from this market, alongside a bit more volatility in global travel flows – but the fundamentals remain strong, and demand is expected to recover as sentiment and connectivity stabilise
Saudi Arabia still expected to rank within the top
20 inbound markets to London this year based on visits in overnight accommodation (Source: Oxford Economics).
The Middle East is a relatively low priority in L&P's experience economy strategy as a result, with priority focus on US, near Europe, and domestic markets as per the rank in visits. n
As a certified pedant, Andy Rogers says let us turn once again to the topic of the meaning of words, and the many uncertainties that exist in our planning system
In the States a bedsitter is classified as an SRO (Single Room Occupancy) and at around 27 square metres can be smaller in an affordable housing (Social Services Client) scheme in New York than is otherwise legally allowed.
Then again, only 17% of the families living in NY have children. [Sometimes the words we use are transported to the USA in a form of ‘linguistic crosspollination’. Apparently some Americans now use ‘queue’ for ‘line’, ‘ginger’ for ‘redhead’, ‘bits’ for ‘parts’ and ‘full stop’ for ‘period’. But, as one commentator over there has remarked: “There is simply no excuse for calling an ‘appetizer’ a ‘starter’.”]
Other translations that might be useful when dealing with planning matters include: breeze block = cinder block, central reservation = median strip, car park = parking lot, holidaymaker = vacationer, paddling pool = wading pool, pedestrian crossing = crosswalk, pushchair = stroller, roundabout = traffic circle, aerial = antenna, articulated lorry = tractor-trailer, terraced house = row house, puncture = flat, flat = apartment, and (most con-
fusingly) road = pavement and pavement = sidewalk.
Finally, here are some uselessly vague terms that will need specific examples: amenity, undesirable, beautiful, in keeping, dominant, and subservient - all often used by planners and effectively meaningless because they are too general without specific examples .
I will return to this topic later. Meanwhile don’t forget Donald Rumsfeld’s famous explanation of policy changes: “There are known knowns. These are things we know that we know. There are known unknowns. That is to say, there are things that we now know we don’t know. But there are also unknown unknowns. There are things we don’t know we don’t know.”
When is an outbuilding an extension?
By way of comment on the analysis below, to some extent this decision just represents “business as usual”. It confirms that “extension of a building” in NPPF 154(c) can include outbuildings
When is an outbuilding an extension?
04.OCT.2024: Roderick Morton analyses a High Court ruling on whether in order to be an extension for the purposes of the National Planning Policy Framework, a structure said to be an extension must always be physically attached to the building of which it is purportedly an extension.
In the recent case of Warwick DC v SSLUGC and others [2022] EWHC 2145 (Admin), the High Court had to consider whether a detached garden room could be an extension for the purposes of the exceptions to inappropriate development in the Green Belt (currently at NPPF 154(c)). The owners of a property in a village in Warwickshire sought permission to demolish a 10sqm existing derelict structure and replace it with a 16sqm garden room/home office. Both the existing structure and the proposed new outbuilding were detached from the main house, sitting some 20m from the house. The property was in the Green Belt. Permission was refused. Development in the Green Belt is inappropriate unless it falls within one of the exceptions set out at NPPF. Permission was refused because, while the new outbuilding was a replacement building, it was materially larger than the previous structure and therefore not within 154(d). Its status as an extension within 154(c) was not considered. It was therefore inappropriate and there were no very special circumstances to outweigh the harm. An appeal was made. At appeal, the owners argued, amongst other things, that it was an extension within 154(c). The Inspector allowed the appeal and granted permission. She agreed that the development was materially bigger, excluding 154(d). But she decided that it was an extension within 154(c) because it was a “normal domestic adjunct” to the main house, within a group of buildings relatively close to the main house and used for purposes related to the main house. The LPA appealed to the High Court.
Two points were before the High Court. First, was the interpretation of the words “the
Andy Rogers is a planning consultant and former director in architects
The Manser Practice
which are normal domestic adjuncts to the building; in that respect, the differences between the NPPF and PPG2 have not affected policy. That said, it is not the obvious meaning of “extension”, as the court acknowledged. It is not the meaning used in the GPDO where extensions are within Class A and detached outbuildings are within the less restrictive Class E and there are cases about sham detachment.
It is not even the meaning used consistently in other parts of the NPPF. The case is restricted to interpretation of a particular part of the NPPF. It would be a mistake to read it across into other legislation. n
extension of a building” within 154(c) a matter of law for the court to decide or a matter of fact and degree for the decision maker? Second, was a detached outbuilding an extension within the 154(c) exception? On the first question, the court held that the interpretation of planning policy was a question of law and was for the court. On the second, there was case law, particularly Sevenoaks DC v SSE and another [1997] EWHC 1012 (Admin), in support of extensions including detached outbuildings. That case law, the LPA said, was no longer applicable to current guidance. PPG2, in force when Sevenoaks was decided, used the words “extension of existing dwellings”, rather than “extension of a building” as used in NPPF 154(c). The court agreed that it was not safe to assume a simple read across or to assume that “dwelling” was the same as “building”.
However, the court found there was merit in PINS’ argument that, if 154(c) were interpreted restrictively, then the NPPF would have restricted the scope for extensions in the Green Belt. The purpose of the relevant paragraphs had been to widen the possibility of extensions (ie beyond dwellings to eg commercial buildings), not to restrict it. That was a reason to favour a less restrictive interpretation. The court accepted that a “normal domestic adjunct”, such as a garage or other outbuilding, could be physically separate from the main building. It noted that an extension would itself be a new “building” given the definition of “building” in the TCPA. It noted that some detached outbuildings had less impact than an attached extension; a focus on whether the extension was attached or not therefore had potential for some arbitrary results which did not further the purposes of the Green Belt. The court concluded that, in isolation, the language in NPPF 154(c) seemed to require an extension to be attached. However, in the round, there were other factors which pointed to a less restrictive definition which accorded with the content and purpose of the Green Belt treatment in the NPPF. The inspector had therefore interpreted the paragraph properly and the appeal would be dismissed.
Nicholas Falk argues that a green and blue web can use the power of nature to boost economic and social development and overcome inertia.
Smarter growth around stations
While substantial development has taken place in the hearts of many of our cities, especially in Central London, it is the areas at the edges and centres of mid-sized towns and cities that now face the greatest challenges. Shopping on the internet is displacing the out of town stores developed on the sites of former factories and mills, which was the first wave of urban regeneration. Services have replaced manufacturing industry. There is a mass of underused land and property on the edge of town centres and often around the railway stations that could form the basis for sustainable urban renewal. But development depends on land in different ownerships being assembled through a mechanism to bring the different interests together.
Practical solutions were set out in URBED’s Capital Gains report on land assembly for the Greater London Authority, which drew on expert advice from lawyers and surveyors along with case studies of what worked. For example in France ZACs (Zones d’Amenagement Concertes) are used to join up public and private investment. The legal firm of Dentons used their experience to propose designating ‘Land Assembly Zones’ along with other measures to make development easier. The National Wealth Fund, which was set up to support economic growth and clean energy, could now play a similar role to European state banks such as the Caisse des Depots. But efforts need to be focused on places with real growth potential, which requires spatial planning at the regional level. The slow progress in developing Ebbsfleet in Kent or Northstowe in Cambridge, new settlements that were to serve as prototype ‘ecotowns’, should be a warning that policies and targets are not enough. So in a situation when uncertainties are slowing everything down, how can development be accelerated to meet changing priorities, and Spatial Development Strategies be used to bring different interests together?
Green Webs and Social Cities
The overwhelming challenges for spatial planning and building housing at scale in the future will not only be addressing climate change and also the social inequalities which are causing communities to break up and wildlife to die. In the UK we urgently need to reduce the impact of the private car, and to promote alternatives such as public transport and active travel. We also have to much better use of our existing housing stock, and to use ‘green wedges’ or ‘fingers’ as in parts of Scotland or Copenhagen to change the images of former industrial areas. Where land in the Green Belt is required for development, as Labour is proposing, not only should part of the uplift in value be used to fund local infrastructure but it should also be used to improve access for leisure, starting with making walking easier and safer. So instead of treating the green belt as a sterile corset or girdle the best of town and country could be combined in new development through what I call a Green Web.
What Ebenezer Howard called the Social City in his original pamphlet Tomorrow: a peaceful path to real reform in 1898 still offers a useful model. A compilation of my articles published in Town and Country Planning on Building Social Cities over a decade on Growing Social Cities brings his ideas up to date. The basic ideas are still is to link a cluster of settlements with high quality public transport, to maintain the spaces in between so that more people look out to green space or water, and to use the resulting uplift in land values to improve and maintain the local environment . Instead of separating town from country, they should be woven together to form a green web. Existing streets can be rapidly transformed by using trees and landscaping such as parklets, which is a cost-effective way of securing public support for new housing.
Speedy delivery and ongoing maintenance will be key. The best mechanism to achieve the government’s objectives and reconcile the different interests is the Mayoral Development Corporation. Examples are the Milton Keynes Parks Trust, which was funded from the rentals paid by small shops, and the park between Stratford and Hackney Wick, which was created from land used for the London Olympics by the London Legacy Development Corporation. A body like the National Infrastructure Commission needs to identify the best places for growth or renewal, using Digital Intelligence to bring the data together and hence side-step vested interests. Spatial Development Strategies should show where new homes and other development are best concentrated, and how these link up with future sources of employment. The complex and time-
Dr Nicholas Falk is the founder of URBED and executive director of The URBED Trust
consuming process of assembling the land and upgrading the local infrastructure can then proceed with the prospect of Outline Planning Permission for homes that meet certain standards. The back-up power of Compulsory Purchase powers can avoid land speculation.
Generating confidence, and even the hope that things can be improved, will be difficult in the current financial climate. So it is important to come up with a programme for conserving and improving the natural environment that will yield early results and engage the interest and support of local communities who might otherwise be opposed. The success of places like the New England Quarter in Brighton, which URBED masterplanned, or the former railway lands in Kings Cross show how an incremental approach can work when you start next to a railway station. .A Green Web can revive hope and development trusts can put waste space to good use with a mass of social and environmental benefits. A study by planning and development consultants Lichfields has revealed the many well-connected stations around England where housing development is viable. In total these could well meet most of the UK’s immediate housing needs.
Furthermore, instead of having to wait for the facilities needed to create a community, the process will add value to what might formerly have been written off as waste land. This was the model used to develop London’s Metroland in the Interwar period. The Board of the Metropolitan Railway promoted new housing on surplus land bought for new stations in some eight locations in North West London, which became some of the most attractive places to live. A similar recent story can be told of the
CAPITAL GAINS:
A BETTER LAND ASSEMBLY MODEL FOR LONDON
Research commissioned by the Greater London Authority
area around Kings Cross or on the London Overground that runs through London’s East End through neighbourhoods such as Dalston and Rotherhithe. Frequent modern trains and upgraded or new stations, are now bordered by distinctive apartment blocks in areas once notorious for criminality and vice. New green spaces such as Dalston’s Eastern Curve have used ‘wilding’ to create great places to relax in former wastelands.
The UK has a unique opportunity to make the most of its rich heritage of urban green spaces, which include canals and cemeteries and the front gardens that border tree-lined suburban streets. It also has an abundance of under-used suburban railway lines, with plenty of scope for promoting integrated transport in provincial cities to match their European counterparts. Reducing the amount of traffic in urban areas would release space for walking and cycling, as progressive cities like Copenhagen or Freiburg have done through planned urban extensions combined with upgraded light rail systems. The results are evident in longer active lives and greater feelings of wellbeing which should lead in turn to reduced pressures on the NHS and lower health insurance claims.
Implementing a green transition
Green webs need champions. Local trusts serve as a valuable third force in restoring run-down areas to life. Organisations such as Groundwork or Wildlife Trusts have transformed isolated
ABOVE:
The image on the front cover of our report for the GLA shows quite well how cities grow over time. The client was James Murray who was then Deputy Mayor and is now Health Secretary
https://www.youtube.com /watch?v=hGjoMVzHmKg
In this short video I share what 40 years of regenerating King's Cross has taught me about placemaking. From an area once defined by drugs, prostitution and derelict industrial land, to today's thriving "knowledge quarter" - I trace the steps: building a sense of security, taming traffic, repurposing heritage assets like the Coal Drops and Granary Building, and turning old gas holders into some of London's most desirable housing. I distil the process into a simple formulaAmbition, Brokerage, Continuity - and ask a question I think matters for our profession: how far can this be replicated elsewhere?
neglected areas with the help of nature, voluntary efforts and public pump-priming. Community Land Trusts are helping people to house themselves when they get support from local land owners. (www.communitylandtrusts.org.uk). Asset Based Community Development (ABCD) with a stake in property would provide neighbourhoods with the extra income needed to maintain an extended public realm. The Green Corridor initiative in the North East is a promising £3 million project with a range of partners and funded by a research body that needs to be replicated in every region.
Design Codes and Charters will help raise standards and engage communities in a positive way. The Cambridgeshire Charter for Quality Growth, published in 2010, offers a model that has endured, and the mixed use developments around Cambridge Station show how to combine high density new housing with publicly accessible green spaces. Significantly Microsoft moved their base there from a peripheral science park The former Railway Lands at Kings Cross offer an even greater example of the transformation that can follows from an initial investment in landscaping and improving public access. But a fresh source of seed capital is needed to address the parlous state of most local authorities, the long times it takes to get projects agreed, and the reluctance of private developers to invest unless they can literally see improvements are underway.
So to boost confidence in the government’s plans how about some kind of Common Wealth Fund to complement the National Wealth Fund and to support ‘transformational projects’ or ‘environmental ‘beacons’? The funding could come from a slice of the uplift in land values from areas that benefit from renewal, or form part of much needed property tax
reforms. At a city region level some form of Local Infrastructure Financing Trusts (LIFT) could bring public and private resources together and be the vehicle for corporate investment in projects that serve as beacons for a green transition. My policy paper for the TCPA on Sharing the Uplift in Land Values provides the evidence.
The priority should be to transform areas that are easiest to access and are highly visible. By mapping land that is publicly owned and close to railway stations and town centres areas for intensification can be systematically identified and vested interests overcome. The potential Rate Yield from bringing under-used land and properties into beneficial use should make the economic arguments for urban intensification overwhelming. Brightening up the most visible areas will also provide immediate signs that improvements are underway and that the government’s policies go beyond targets.
Profitable developments around stations in much of London already prove the viability of a mix of people living at higher densities. Well-designed and managed neighbourhoods in areas close to railway stations with access to open spaces could transform the image and appeal of run-down areas in the country at large.
Mid-rise residential development around courtyard gardens can also cater for a wider range of ages and incomes. The key is a development framework that serves as a trellis, not a blueprint. Like a garden the results look best when there is rich mix of uses with a variety of people living and working together to provide the necessary stewardship. A green and blue web can use the power of nature to boost economic and social development and overcome inertia. n
Berkeley and Peabody complete 733-homes at Lombard Square
Berkeley Homes and Peabody have marked the completion of the first 733 homes at Lombard Square in West Thamesmead, including 381 affordable homes.
The milestone marks major progress in transforming a derelict former industrial site into a new green neighbourhood close to Plumstead Station, with a 1.8-acre park, children’s playground and convenience store also now delivered.
Lombard Square sits within the Thamesmead and Abbey Wood Opportunity Area and, once complete, will provide nearly 2,000 homes, including 765 affordable homes, alongside new public space and employment space. The opportunity area is designated for 8,000 new homes and 4,000 new jobs by 2041.
An update on the GLA 2024based demographic projections
Ben Corr provides a brief update on the timing of the upcoming release, what it will include, and some of the changes being introduced with the new projections
When will the projections be released?
The projections will be published alongside the Draft London Plan and the London Strategic Housing Land Availability Assessment (our release is tied to these because the projections incorporate housing assumptions based on the SHLAA).
The publication date for the Plan has yet to be announced, but we are currently working on the assumption of a July release. [note: updated housing-led projections are already available to users in London local authorities via the GLA population projection service]
In the meantime, we have released an updated set of trendbased projections as research outputs. These incorporate a number of changes from the initial set published last August and should be much closer to the final outputs.
What will be included in the publication?
• Trend-based population projections for local authorities
• Housing-led population projections for electoral wards and MSOAs
• Household projections for local authorities, with variants based on alternative scenarios of future population growth and household formation.
What is new in the projections?
This will be the first full update of the population projections since the publication of the 2022-based outputs in August 2024, and the first release of household projections since 2021.
It will also be the first set of projections to incorporate data from the new London SHLAA – the first major update to the housing assumptions used since 2017.
There are some other important changes coming with the new round of projections, including:
• Adjustments to the underlying population estimates to account for issues with official data for children
• Introduction of improved fertility rate estimates and projection methods
• Expansion of the housing-led population model beyond London
Ben Corr is Demography Manager at the GLA
Adjustments to population estimates of children
Earlier this year we identified problems with the numbers of children in official population estimates. We believe that there are two separate underlying issues:
• Underestimation of young children in the 2021 census.
• Inflated estimates of annual net international migration of children from 2021-22 onwards.
These issues are similar to those that affected estimates over the course of the previous decade, though that case the impacts were mostly limited to local authorities in London,
whereas the current problems appear to affect estimates across England.
It took us a long time to understand the original issues and to develop a reliable method for adjusting the estimates to mitigate the impacts on population and school roll projections. That experience proved useful this time around, helping us to identify and address the problems much more quickly.
My colleague Donal will be writing more about the issues and his work to create the adjusted series in an upcoming post.
New fertility rate methods
Izabel previously wrote about her work to make detailed fertility rate estimates accessible to the analytical community and she will be sharing an update on recent progress soon.
This data has already allowed us to implement new methods for projecting fertility rates in the models, with the 2024based projections featuring two improvements:
• Projected fertility rates are produced using a new timeseries approach that provides a more robust and flexible approach to creating scenarios than before.
• Age-specific rates for small areas (e.g., wards and MSOAs) now much more closely reflect local patterns.
Expansion of the
housing-led
population model
Perhaps the biggest change to the models is that the housing-led population model has been extended to cover areas beyond the Greater London boundary.
There are a few advantages to expanding the coverage of the model, but the primary reason for making this change now is to better accommodate the potential impacts of recent changes to the planning system.
Changes to the planning system in England
At the point when the current Plan was developed, the accepted approach for determining future housing need in England was to take projected growth in the number of households and add an allowance for any existing backlog.
For the majority of the country, housing need was assessed at the level of individual local authorities. For London overall need was calculated for the region as a whole, and the GLA allocated housing targets to local authorities based on their capacity to delivery additional housing, as determined by the SHLAA.
In 2024, the government introduced changes to the National Planning Policy Framework, including a new standard method for calculating housing need in England. In the new method, housing need is entirely independent of demographic projections and based only on the existing number of homes in the area and local affordability measures.
Under the old system, housing targets for the region of London and individual local authorities elsewhere had a level of
inherent consistency with trend-based projections. As such it was generally reasonable to use trend-based population projections for these areas without making any additional consideration for the impact of delivering homes in line with assessed need. The role of housing-led projections was primarily to determine the spatial distribution of the population within those areas.
The new standard method results in need figures that are, for most areas, significantly higher than projected increases in population and households given by trend-based projections. In the case of London, the new standard method gives a need figure of approximately 89 thousand homes per year, whereas official household projections give annualised growth of under 30 thousand.
The wide disparities between indicative housing need figures and current projections has complicated the use of trend projections for determining future growth in London and elsewhere.
The expanded model
The approach we are taking to address this issue, is to use trend projections to determine the overall population of a much larger area than the administrative region of London –something that better approximates London’s true housing market area – and then to use housing-led projections to distribute population within this area.
This approach hinges on the idea that migration can be categorised into two distinct types:
Long-distance or international moves tend to be linked to:
• Pursuit of higher education
• Employment opportunities
• Relocation to be closer to family
Shorter distance moves, often labelled “residential mobility”, are primarily the result of changes to:
• Housing needs, e.g. linked to life events such as family formation or separations
• Tenures, e.g. purchasing a home and moving out of private rental accommodation
• Priorities for amenities, e.g. moves to be closer to schools and green space after having children
We can use this distinction to define a set of Housing Market Areas (HMA), intended to represent areas where most moves within them can be considered as “residential mobility”, i.e. primarily driven by factors related to housing, and most moves between them can be considered as long-distance migration, where other factors dominate.
To generate the housing market areas used in the model, we drew on academic work originally commisioned by the National Housing and Planning Adisory Unit. My colleague Sebastian will be posting soon about his work building a tool that allows users to generate alternative housing market area geographies for England and Wales based upon their choice of commuting and migration ‘enclosure’. This tool and the code behind it will be made publicly available in the coming weeks.
Some useful side benefits
While extending the model beyond London came with some challenges – not least that we have limited information about planned housing delivery in other regions – it does have some advantages.
Firstly it provides us with the ability to generate housing-led projections for small areas across all of England and Wales. These aren’t something we have plans to publish, but they allow us to better support the transport demand modelling work of our colleagues in TfL.
Secondly it provides us with additional levers for creating scenarios for use in sensitivity testing. Changing the amount of housing development assumed for the rest of the housing market area changes the share of the overall area’s population growth that London receives.
And finally it opens some potential opportunities to collaborate with colleagues in other regions. Please get in touch if that’s something you would be interested in exploring. n
Planning and Environment Reference Guide
Please notify any changes immediately by e-mail to planninginlondon@mac.com with the subject ‘planning in london directory’.
London Borough of Barking and Dagenham Barking Town Hall Barking IG11 7LU 020 8215 3000
Sarah Allan, head of design designquality@levellingup.gov.uk
Simon Gallagher, director, planning Magazine of the Year (non-weekly) WINNER 2007 & finalist 2006 – 2012 & 2016 & 2018 International Building Press
Keep taking your PiL
Please complete and mail the form below with cheque for £99.00 or click SUBSCRIBE at www.planninginlondon.com and pay with PayPal or credit card
China National Publications, Deloitte, Womble Bond Dickinson, Avalon Planning, L B Barnet, Gilmartinley, Harvard College Library, London Wharf PLC, L B Islington, L B Greenwich, Sport England, Entec UK, Berkeley Group, Workspace Group, LB Bexley, RBK&C, RTPI, LB Bromley, PRP Architects, Durrants, L B Islington, CBE, GL Hearn, Holistic Group, White Young Green, Dentons, i-Document Solutions, Trowers & Hamlins, Montagu Evans, Hayes Davidson, Precise Media, NLP, L B Merton, Cluttons Planning, Speechly Bircham, TP Bennett, The London Society, Ebsco, Brockton Capital, Turley Associates, Munkenbeck & Partners, Terence O'Rourke, Assael Architecture, Metropolitan Workshop, PRP, Urban Research, AMEC, GLA, LCR Stations and Property, Terence O'Rourke, Rolfe Judd Planning, Southbank University, Lurot Brand, Alliance Planning, Cluttons, DPP, Savills, Henley Business School, Grosvenor, Sainsbury's, Hamptons International, Barratt Homes, National Grid, Network Rail, Foster + Partners, Gorkana Group, London & Continental Railways, London Communications Agency, Cardiff University, L B Ealing, MHCLG, Transport for London, LSE Library, Deloitte Real Estate, London Councils, Circle 33 Housing Trust, P&O Estates Ltd, Greenwich University, Steer Davies Gleave, City of Westminster, British Architectural Library, CBRE, Delancy, PDP London, Bellway Homes, Jestico & Whiles, London & Quadrant, Ecology Consultancy Ltd, Tesco Plc, Ramboll, Dominion Properties, BWCP Architects, WSP Indigo, Slaughter and May, LSE library, British Land Company, Dentons, HTA Design, Howard Kennedy, ...
... Just some of the firms and organisations who have taken their Planning in London subscription. ONE YEAR FOR JUST £99
To subscribe: click on www.planninginlondon.com or please return this form. Bank transfer: HSBC 40-07-13 a/c 91551655 'Planning in London'. A subscription is a licence for 5 copies emailed in PDF format. Please supply up to 5 email addresses to planninginlondon@mac.com
I would like to subscribe from: last issue 137 April 2026 this issue 138 July 2026 next issue 139 October 2026
Go to planninginlondon.com > Subscribe and pay online with
I enclose a cheque for £99.00 (no VAT, payable to Planning in London) I am interested in advertising in the Advice directory (£300 for one year)
Please debit my card £106 (£99+£6.00 for credit card administration, no VAT payable)
Card type: VISA MASTERCARD
Card number:
Expiry date: security no:
Signature:
Name on card:
Firm:
Card billing address:
Delivery address if different:
Tel: Up to 5 Email addresses:
Post cheque to: Planning in London, Studio Petersham, Gorshott, 181 Petersham Road TW10 7AW for the attention of Melanie Hern
Thirty-two RIBA National Awards have just been announced. London dominates
RIBA National Awards
Across the 17 London award winners there is an interesting cluster with three in the London Borough of Newham, all around the Queen Elizabeth Olympic Park, showing the ambition of cultural and university investment in the seventh most deprived local authority area in the UK.
Clients for these award-winning buildings
As ever the clients are as mixed as the projects themselves, though ambition is always high.
British Land continues to pioneer good architecture and high standards with two projects on the National Awards shortlist: Norton Folgate, an office-led development by a clutch of architects knitting old and new on the edge of the City of London, and housing at Canada Water.
Private clients make a significant contribution as drivers of design excellence – there are seven private houses on the awards list, including three for architects designing for themselves and
2026 RIBA UK London Awards winners
For photo credits and details go to:
https://www.ribaj.com/riba-awards/2026/london
RIGHT:
Stiff + Trevillion’s exemplary department store refurbishment and retrofit challenges the prevailing climate of high-street decline, earning a 2026 UK RIBA London Award
BELOW:
Sited between dense urban areas and woodland, Morris+Company and White Ink’s affordable housing scheme offers exemplary design quality, winning a 2026 UK RIBA London Award
BELOW RIGHT:
Morris+Company’s pink concrete health centre is both a landmark civic building and a welcoming patient-focused space. It deservedly takes a 2026 UK RIBA London Award
their families. These will go forward, along with others from the regional awards, to the House of the Year.
Education accounts for five of the projects: two from University College London (UCL), two from Cambridge Colleges and one private school.
There are no central government clients but, encouragingly, four local authorities make the list. East Hertfordshire District Council is one for its upgrade to the 1970s BEAM, with Bennetts Associates and Worcestershire County Council for the Kepax Footbridge with Moxon Architects.
Meanwhile Croydon’s brave attempt to build homes with its development company Brick by Brick, which was finally wound up this year, has a lasting legacy in the elegantly planned housing at Lion Green Road designed by Mary Duggan Architects and delivered by RUFF Architects.
And Southwark takes a prize for the Harold Moody Health Centre on the Aylesbury Estate, designed by Morris + Company. n
TOP LEFT:
2026 UK RIBA London Award goes to Maich Swift Architects for its industrialbuilding-to-family-home conversion that sticks firmly to the principle of doing only what is necessary, and doing it well
ABOVE:
This ambitious and multifaceted City-fringe office-led development, designed by Allford Hall Monaghan Morris, Stanton Williams, Morris+Company, DSDHA and East, has won a 2026 UK RIBA London Award
LEFT:
Renzo Piano Building Workshop and Adamson Associates redefine arrival to one of London’s most significant transport hubs and win a 2026 UK RIBA London Award
ABOVE LEFT:
Levitt Bernstein’s Passivhaus council housing development combines humanity, propriety and good design, winning a 2026 UK RIBA London Award as well as the London Sustainability Award
LEFT:
O’Donnell + Tuomey’s dance theatre and school of choreography at the Olympic Park presents a sense of accessibility to the whole community, winning a 2026 UK RIBA London Award
ABOVE:
An imaginative act of urban intervention on the unused roof of a Victorian warehouse brings David Kohn Architects a 2026 UK RIBA London Award
LEFT: London Award and Conservation Award go to Squire & Partners et al for their BREEAM Outstanding office scheme that exemplifies adaptive reuse.
RIGHT: Allford Hall Monaghan Morris, Howells and Maccreanor Lavington deliver a benchmarksetting town-centre renewal scheme for a London Award
BELOW: Morris+Company has broken down the massing of this City fringe office block, skilfully reducing its perceived scale and impact, and winning it a 2026 UK RIBA London Award
ABOVE:
Coffey Architects creates a distinctive mixed-use scheme on a historic Bermondsey industrial site, bringing together residential and creative uses and winning a 2026 UK RIBA London Award
LEFT: Stanton Williams’ giant academic building on the Olympic Park delivers a new vision for interdisciplinary teaching, learning and practice, winning a 2026 UK RIBA London Award as well as being named London Building of the Year
BELOW LEFT: Lifschutz Davidson Sandilands’ combined student living and teaching spaces for UCL East is a highly sophisticated building that also welcomes non-students, winning a 2026 UK RIBA London Award
BELOW: Feilden Fowles reshapes the National History Museum’s gardens into a living exhibition, earning a London Award and Project Architect of the Year