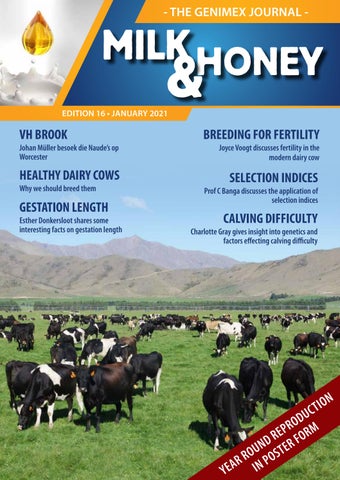
- THE GENIMEX JOURNAL -
EDITION 16 • JANUARY 2021
VH BROOK
Johan Müller besoek die Naude’s op Worcester
HEALTHY DAIRY COWS Why we should breed them
GESTATION LENGTH
Esther Donkersloot shares some interesting facts on gestation length
BREEDING FOR FERTILITY
Joyce Voogt discusses fertility in the modern dairy cow
SELECTION INDICES
Prof C Banga discusses the application of selection indices
CALVING DIFFICULTY
Charlotte Gray gives insight into genetics and factors effecting calving difficulty
N O I CT
U D O R P E ORM R D ER F N U ST O R PO R A IN YE
Die plaas op Tweefontein waar Henri Naude en sy seuns reeds 33 jaar boer. Die woonhuis is in 1901 gebou.
Contents
- MANAGEMENT Milk & Honey Edition 16
4
Breeding for fertility in the Modern Dairy Cow
6
VH Brook maak groot verskil
GENIMEX OFFICE Tel: 081 818 5352 Fax: 0866 363 199 Email: info@genimex.co.za www.genimex.co.za Chris Cloete Tel: 081 818 5352 Cell: 082 807 1433 Email: chris@genimex.co.za
- SALES REPRESENTATIVES -
2
8
Interesting facts about gestation length
9
Conception rates: The facts
11
Voordele om slegs Viking Jersey Bulle te gebruik
12
Saved Feed Index
13
Effektiewe en akkurate databasis vir suiweldiere in Denemarke
14
Year Round Reproduction
16
Useful repro stats and facts
18
Application of Selection Indices
20
Beamer on a million doses
21
Heat Detection
22
Being Nitrogen efficient on Dairy Farms
24
Calving Difficulty
26
Why you should consider breeding for healthier dairy cows
EASTERN CAPE Hendrik Bezuidenhout Cell: 083 458 1709 Email: hbez@telkomsa.net SOUTH & EASTERN CAPE Johan Müller Cell: 082 807 1548 Email: muller@capegs.co.za GAUTENG, Ferdi Myburgh SOUTHERN MPUMALANGA, Cell: 060 858 2122 NORTHERN KZN Email: ferdi.myburgh.11@gmail.com SOUTHERN CAPE Willem van Lingen Cell: 082 375 1252 Email: willemvanlingen@telkomsa.net EAST SOUTHERN CAPE Shawn Buckley Cell: 082 828 8481 Email: ebuckley@telkomsa.net KZN MIDLANDS Britt Stanton Cell: 082 575 9387 Email: britt@genimex.co.za MPUMALANGA, Simon Alderson-Smith GAUTENG AND Cell: 083 379 4656 EXPORTS Email: simon@genimex.co.za EAST LONDON Dave Swift Cell: 083 440 7291 Email: swiftfamily@discoverymail.co.za No portion of this newsletter may be reproduced in any form without the written permission of the publisher. Views and opinions expressed in Milk & Honey are those of management and any relevant information seemed fit to project Genimex views and interests in the dairy industry. They can accept no liability of whatsoever nature arising out of or in connection with the contents of the publication. Many of the articles placed have been edited. Complete article are available from the editor.
Foreword By Chris Cloete the traits other than production that need to be part of the formula. See the very interesting article on this topic written by Professor Banga of the ARC. Thank you Prof Banga for your contribution to the Milk & Honey. Genimex plans to work with milk buyers, dairymen/ladies and other semen suppliers to see if a SA index can be developed. As 2020 draws to an end I would say that there are many people that will be wishing it away. Unfortunately wishing it away will not make 2021 any better or easier. 2020 has had its challenges but fortunately for all of us in the livestock industry we have been allowed to carry on with our businesses within the challenges of the lockdowns that we have been faced with.
Another development that struck me between the eyes this year was when visiting a client he advised of a new breeding program punted by another semen supplier. “Mate all your heifers to sexed semen to breed your replacements out of and mate the rest of the herd to Beef”. I just cannot get my head around that program.
Our biggest challenge as a company supplying Genetics has been to ensure that our clients receive their semen orders on time. It has been a challenge because of the uncertainty of moving freight internationally. We have had our fair share of semen flasks, shipments of Genimex Patches etc bumped off flights.
Your heifers, even when using sexed semen CAN NOT supply you enough replacements. To get 200 replacements into your herd you need to start by mating 260 heifers and if my calculations are correct you will in five years time only have 120 heifers to mate to breed all (200) of your replacements from. A real no brainer.
With all that said and done we got through it all and thank our customers for understanding and working with us.
Looking at genetic gain. Why ignore the great mature cows in the herd and not breed replacements out of them. Not all the heifers in the herd are better than all the cows, remember genetic gain is slow and cumulative so breed the best to the best to get the best replacements.
There have been a few interesting developments this year. Over the years we have discussed the possibility of developing a SA breeding index. The challenge has been to put financial weightings on the various traits that are deemed as important. Earlier this year we were advised by one of our clients that his milk buyer insists on seeing the profile of every bull he intends to use, the buyer wanted to make sure the bulls are A2A2 for Beta Casien. At first I was a little annoyed as to how can he demand that. On a trait that is simple to select for and for which there is no concrete scientific evidence that it is of value to the consumer. I then realized that we should turn this “demand” around and invite the milk buyers to sit around the table with the semen industry to determine what they, the milk buyers, need in 10 years time and how the semen industry must redirect the selection of bulls to reach those goals. Yes, you may say that is pie in the sky with the huge differences in milk payment structures that exist in our country with so many milk buyers. Further to that, milk from producers is mixed during transport, devaluing the high quality milk of some producers with that of low quality milk from other producers. But let’s start some where even if it’s with only one or two of the major players. It is also a challenge to put economic values onto Milk & Honey I JANUARY 2021
I can’t work out the motive for such a dumb, the only way to describe it, program. Do they have a surplus of sexed semen, of inferior bulls to dump in SA or do they want to make our Dairy farmers into Beef farmers? Much has been said about breeding efficient cows to save on feed usage and to reduce the carbon footprint by dairy cows. Both our suppliers have over the last year developed indexes for this. These indexes are not only available on their own but they have been incorporated into their overall composite index. See the two articles in this issue of Milk & Honey on this topic. Once again I would like to thank all those that contributed to this edition of Milk & Honey. Specifically I would like to thank DairyNZ for allowing us to use the table as printed on pages 14 and 15. Should any of our clients require a larger version of the table please contact me as we have permission to print posters thereof to put up on the office wall. There remains little for me to say but to hope and trust that you enjoy this the 16th edition of my Milk & Honey and may 2021 bring you and your families great health and prosperity. Chris 3
BREEDING FOR FERTILITY
Breeding for fertility in the modern dairy cow
Traits important to farmers commonly include production, fertility, longevity and workability traits. Not all traits are equally heritable but those with sufficient genetic variation provide scope to improve. Research demonstrates that even in low heritability traits such as fertility, annual gains are cumulative and can make a significant difference over time. For detailed information on genetic fertility, refer to page 39 of the InCalf book for New Zealand Dairy Farmers. The principles apply everywhere, so let’s take a look at what’s been happening of late in New Zealand with: • DairyNZ fertility research, • performance of cows by fertility BV in commercial herds, and • the latest national reproduction statistics
FERTILITY RESEARCH UPDATE Recent research by DairyNZ has focused on understanding the performance and physiology of cows with divergent fertility breeding values (BV), with the aim to accelerate genetic fertility through improved accuracy of prediction. The research has confirmed that the fertility BV does work in practice. Initial findings include: • Large differences in 3-week submission rate, 6 week in-calf rate and not in-calf rate in the purposebred research animals made up of two extreme fertility BVs groups (BV +5 and -5). • Discernible differences were seen between the two groups as yearling heifers. High fertility BV heifers achieved puberty earlier and at a lower percentage of their own expected mature liveweight. • Modelling research also suggested that genetic fertility delivers more benefit in lower-performing herd environments.
4
• To find ways of identifying high genetic fertility animals earlier in life, new candidate predictor traits are being investigated.
ON-FARM COW PERFORMANCE BY FERTILITY BV At a population level, figures from over 2.3 million cows with early aged pregnancy testing results support the research herd findings. Figure 1 shows a significant difference in performance at the extremes of cow fertility; BVs of +5 and - 5. It appears from this dataset that the relationship is not linear. Gains in 6 week-in-calf rate appear to taper off as BVs increase, particularly at BV +3 and beyond. It is important to keep things in context as well. Few cows have extreme +/-5 BVs in the NZ national herd, as illustrated in Figure 2 which plots the Fertility BV distribution of the 2.38 M cows analysed. The majority of cow Fertility BVs sit between -1 and + 2. The figure also shows the average fertility BVs of balanced index LIC bull teams marketed in the same year. This illustrates, at a national level, the potential scope for improvement of cow genetic fertility while keeping focus on other important traits. The scope within individual herds will depend on the herd’s own spread of BVs. While creating and maintaining a high herd level of genetic fertility is important, the impacts of increasing BV may eventually taper off. 80% 70%
6-Week In-Calf Rate
Every herd has a range of cow types and performance within it. Every year brings forward a new crop of calves and an offering of elite bulls for breeding. The herd’s ‘cycle of life’ gives an annual opportunity to improve important genetic traits, herd quality and farm profitability and sustainability.
60% 50% 40% 30% 20% 10% 0
-5
-4
-3
-2
-1 0 1 2 3 Fertility BV 6-week in-calf rate Not-in-calf rate
4
5
Figure 1. 6 week ICR and Not ICR by Fertility BV based on 2.3M NZ cows with detailed FFR
Milk & Honey I JANUARY 2021
Joyce Voogt, BVSc. LIC International Technical Manager
Farmers with high fertility herds may wish to set minimum thresholds for bull teams or to focus effort on their lowest fertility BV cows. Of the things you can influence on farm, picking the right straw is the easiest to implement. When selecting genetics for South Africa from elite daughter-proven New Zealand bulls, Genimex focuses on breeding values for important traits including fertility. Use LIC’s elite bulls to underpin your herd reproductive performance as you implement the other 7 key management areas; calf and heifer management, calving pattern, body condition and nutrition, heat detection, AI practices, cow health and stock bull management. 600,000
Fertility BV Distribution of New Zealand Cows (Source LIC 2020)
Number of Cows
500,000 Bull Teams
400,000 300,000 200,000 100,000 0
-5
-4
-3
-2
-1 0 Fertility BV
1
2
3
4
5
Figure 2. Fertility BV distribution of 2.3million NZ cows with detailed FFR.
LATEST NZ NATIONAL STATS SET NEW RECORDS On the phenotypic side, the national 6 week in-calf rate hit another high point in 2019 at 67.8% 6 week in-calf rate. This increase followed on from gains in the previous 2 seasons. Average total joining length has now reduced to 10.7 weeks, the shortest on record. These latest season’s repro results are based on 2,377,370 cow records in 4430 seasonal calving herds throughout New Zealand with a detailed Fertility Focus Report in LIC’s MINDA™ herd recording software. M&H
Fertility BV Trends New Zealand Cows (Source NZAEL)
NZ 6 Week In Calf Rate Trend (Source LIC 2020)
2.5
FXJ
68.0
2.0
Jer
67.5
1.5
HF
1.0 0.5 0.0 -0.5 -1.0
2014
2015
2016
2017 Year
2018
2019
Figure 3. NZ cows Fertility BV by Breed
Your Genimex sales team can advise on the bulls available and their fertility BVs. Milk & Honey I JANUARY 2021
6 Week in-calf rate (%)
Fertility BV
Latest industry stats from NZ show genetic fertility and phenotypic reproductive performance are trending positively in the national herd. Fertility Focus reportbased statistics are setting a few new records since monitoring started 10 years ago. By breed, genetic daughter fertility BV remains high for Jerseys and it is pleasing to see both HF and F X J cows now closing the gap as high fertility BV bull teams make an impact, (see figure 3).
67.0 66.5 66.0 65.5 65.0 54.5
2014
2015
2016
Year
2017
2018
2019
Figure 4.6 week ICR by year, NZ herds with detailed FFR
5
Die plaas Tweefontein Over Hex Worcester
VH Brook maak groot verskil in Worcester Holstein kudde Pierre Naude boer sedert 2008 op Tweefontein saam met sy pa, Henri en broer Philip. Pierre se verantwoordelikheid is die suiwelvertakking met ‘n 600 koei Holsteinkudde. Philip hanteer die wingerd en akkerbou vertakking. In 2013 het hulle die eerste fase van ‘n onderdak - voerstelsel voltooi. Hul volvoerstelsel behels hoofsaaklik die gebruik van so veel as moontlik mielie en hawerkuilvoer wat onder spilpunte verbou word.
proteïen en bottervet met ‘n kg melk teelwaarde van hoër as 100 en persentasies wat bo gemiddeld is, is die vereiste. Tweedens is die gesondheids-eienskappe met veral uiergesondheid en vrugbaarheid baie belangrik. Hul teelbeleid begin beslis resultate lewer. Die kudde het die afgelope jaar ‘n gemiddelde bottervet persentasie van bo 4% en ‘n proteïen persentasie van bo 3.4% gehandhaaf. (Melk Produksie - 30.5 kg per dag (2x per dag melking)
Water is die beperkende faktor en daarom het hulle waarskynlik reeds hul doelwit wat koeigetalle aanbetref bereik. Daar is 220 hektaar onder besproeïng waarvan 66 hektaar wingerd is. Pierre maak gebruik van die bestuurs konsultante van “Dairy Management Consulting” met Justin Moolman wat op ‘n maandelikse basis voorleggings en terugvoering gee oor hulle verskeie bestuursaspekte. Volgens Pierre het hy sedert hulLe deel van DMC is, geweldige verbeterings, veral wat algemene bestuur aan betref, ervaar. Kalf - mortaliteit asook vrugbaarheid het drasties verbeter.
VH BROOK
TEELBELEID TWEEFONTEIN Hul teelbeleid behels hoofsaaklik die gebruik van die beste Deense genomiese bulle asook beproefde bulle wat hul man kan staan teen die jong en hoër NTM genomiese bulle. Klem word veral op produksie gesit met die produksie formule van VikingGenetics as basis. Die produksie van die hoogste gemiddelde kilogramme
6
Die bul VH Brook is ‘n goeie voorbeeld van ‘n bul wat geïdentifiseer was as genomiese bul. Hy is swaar gebruik vanweë sy uitstekende ontleding vir veral die produksie van vastestowwe. Sy algemene gesondheids teelwaardes is ten spyte van hoë produksie, ook bogemiddeld. ‘n Positiewe ontleding vir uiergesondheid asook goeie lanklewendheid dra by tot sy gewildheid. Brook het in die laaste kwartaal van 2019 sy eerste ontleding as beproefde bul gekry.Hy het meer as 2000 dogters in melken sy ontleding bly stabiel met ‘n uitstekende NTM (Nordic Total Merit) van 31. Sy indeks vir kilogramme bottervet is ‘n ongelooflike 140. Met hierdie uitslae en prestasies was daar geen twyfel by Pierre dat hy die bul nog moes gebruik nie. Hy het reeds meer as 100 dogters in die kudde en 24 eerste laktasies dogters het reeds, of hul laktasies voltooi, of is meer as 200 dae in melk. Meer as 95% van hulle is reeds dragtig
Milk & Honey I JANUARY 2021
Johan Müller, Genimex
of het reeds vir hul 2de laktasies gekalf. Die gemiddelde produksie van die eerste 17 dogters is meer as 9500 kg oor 305 dae. (2 x per dag melking.) VH Brook se Moeder het ‘n produksie rekord wat ongewoon is vir Holsteins. Haar gemiddelde produksie rekords van 10 000 kg met ‘n 5.54% bottervet en 3.71 % proteïen, is uitsonderlik. Dit is ‘n totale vastestof persentasie van 9.25%!
VIKING POPULASIE In 2017 was Pierre saam met Genimex op ‘n studietoer waar hy waardevolle inligting aangaande die stelsel op gedoen het. Die Deense Holstein populasie gemiddelde van 596 000 koeie is baie indrukwekkend. Die gemiddelde produksie van 11 011kg melk per koei (305 dae )met ‘n 4.00% bottervet en 3.39% proteïen, is tans die hoogste totale kilogramme vastestowwe produksie ter wêreld. M&H
VH Brook – (Balisto x Denim)
Brook dogter : Koei 18037 1 ste lakt 2jr 8 mnde 271 dae in melk piek prod 39 kg - tans 36 kg
Brook dogter : Koei 18013 2de lakt. 2 jr 9 mnde 48 dae in melk 46 kg per dag
Henri en Hester Naude by hul twee seuns Pierre en Philip
Milk & Honey I JANUARY 2021
7
INTERESTING FACTS ON GESTATION LENGTH
Esther Donkersloot ,LIC International
EARLY, LATE OR BANG ON TIME - Fun facts about gestation length With calving in full swing, farmers will be noticing the actual arrival date of calves compared to expected arrival.
While many will be arriving on or close to their due dates, some may be quite a few days either side of when they were expected. Let’s take a closer look at gestation length. Gestation length is a highly heritable trait, with genetics contributing around half of what you see on farm. That’s why we’ve been able to target it successfully at LIC and why we report the figure for farmers to use if this is a priority for them.
INTERESTED IN UNDERSTANDING MORE ABOUT THIS TRAIT? Here are a few interesting points about gestation length and what drives it, from a recent study of 58,000 animals (Donkersloot, 2014).
• Gestation length is highly heritable and explains about 52% of the genetic variation in birth date for calves. On top of that there is a natural distribution around the expected due date. 95% of calves will be born within ±9 days of their expected calving date. This applies to both normal and shorter gestation length sires, although sires selected on gestation length may have a slightly tighter calving pattern around due date. Practically this means if 100 heifers were expected to calve on 20th March, 95 of them should calve between March 11th and 29th. The other five heifers are expected to calve outside of this window.
• Calf gender also has an impact. Heifer calves are born about one day earlier than bull calves. Averages in the study were:
8
– 282.7 days for bull calves – 281.2 days for heifer calves
• Twin versus singleton: Twins are born about six days earlier than singletons • Dam parity: Gestation length is about one day shorter for first-calvers than second-calving cows • Genetic trend: The national herd gestation length BV has shortened slightly. Compared to the average gestation length of New Zealand’s 2005-born cows (genetic base cow, which was 281 days), by July 2016 the average gestation length of all herd tested cows was 1.3 days shorter. • Breed impacts: On average for NZ genetics, crossbreds have the shortest gestation length and Jerseys the longest. In 2016, the New Zealand average gestation length breeding value (BV) of herd tested cows of various breeds was: – -1.3 days for Friesian cows – -1.5 days for Kiwicross cows – -0.9 days for Jersey cows Gestation length is of interest with many farmers because it impacts both the days in milk a dam achieves and the amount of recovery time she has after calving before her next mating. Using SGL option bulls (e.g. SGL + BW or SGL Hereford) can deliver some of this time advantage to cows. Current dairy breed bulls in the Premier Club have a range of gestation lengths and include some with very short gestation lengths (eg. promising recent graduate Tirohanga Take Note at -10.6 days), while the SGL Hereford team have been bred by Shrimpton’s Hill for this trait. M&H
Milk & Honey I JANUARY 2021
CONCEPTION RATES
Joyce Voogt, Technical Manager, LIC International
CONCEPTION RATE MATTERS For any AI insemination, the goal is a pregnancy, a healthy calf and a new lactation for the cow next season. Even better if the calf is a high quality replacement heifer. Six-week in-calf rates are driven by both submission rate and conception rate, each of which is impacted by many of the same underlying factors. In this article the focus is primarily on conception rate (CR) and what can influence it.
UNDERSTANDING CONCEPTION RATE Conception rate measures the percentage of inseminations that are successful1. A myriad of factors influence the outcome of each insemination. Genetics plays an important role in pregnancy rates, and must remain a focus in breeding. Heritability of fertility is low however, with over 90% of the outcome due to factors outside additive genetics. These other effects are grouped under the descriptor ‘Environment’. It is well accepted that providing a good breeding environment for cows has a huge impact on final results. Genetics and environment also interact. While genetics affects cow reproductive performance across all farms, research suggests that high genetic fertility provides more than twice the benefits in the bottom 30% of herds than in the top 30%2. Poor genetic fertility can be rapidly exposed in seasonalcalving grazing farm systems such as New Zealand’s, where there is little opportunity to ‘roll over’ the empty cow into another calving block. In such systems, high genetic fertility is essential and the top 25% of New Zealand herds currently achieve high conception rates by international standards, averaging 60%3. How is this achieved? Cow fertility, calving early in the calving block in first and subsequent lactations, good transition management, premating heats and good uterine health are all factors that result in higher than average conception rates4.
Milk & Honey I JANUARY 2021
Establishing a pregnancy is like a highly choreographed physiological dance. In the conception process, cows with higher quality eggs and a healthy uterine environment will perform better. Good quality semen, handled carefully and inseminated correctly at the right time will reach and fertilise the eggs. Signals are then exchanged between the embryo and the dam, resulting in the required hormonal changes and uterine conditions to establish and support the pregnancy, at around day 16.
Submission error 5.6% Fertilisation failure 14.7% Pregnant at day 70 53.9%
Early embryo loss: day 1.5 to 7 15.9% Early embryo loss: day 8 to 15 6% Lateembryo/earlyfoetal loss:day16to 35 <0.5% Foetal loss: day 35 to 70 3.4%
Figure 1. Causes of pregnancy failure after first insemination at key stages. Source: dairynz.co.nz, downloaded 11.11.2020
Recent New Zealand research (Figure 1) shows that most (85%) eggs are successfully fertilised, however by week 10 over one third of those pregnancies are lost, most within the first two weeks. Research continues into why these early pregnancies are lost and how we can retain more of them.
KEY AREAS OF INFLUENCE: The top quartile of New Zealand dairy farmers achieve 6% higher conception rates than the average of 54%, so let’s look at the influencing factors.
9
CONCEPTION RATES (continued) CALVING PATTERN:
COW HEALTH:
Top 25% farmers have 88% of their herd calved by week 6 of calving. The chance of conception increases by 13% with each extra week post-calving before first service4. Aim to have 87% of your herd calved by week 6.
Disease can affect conception rate significantly at both a herd and individual cow level. Uterine health is just one area. Metricheck™ positive cows can suffer between a 7-23% lower first service conception rate. Seek help if more than 10% of your herd is positive 4 weeks out from mating start. Diseases such as BVD can also reduce conception rate. Talk to your vet about herd health risk factors.
BODY CONDITION SCORE (BCS) & NUTRITION Cows that meet BCS targets have better conception rates than thinner cows. Cows reaching BCS targets and who transition well are believed to have better quality eggs (oocytes)5 and a healthier uterine environment.6 Aim to have cows at NZ BCS 4.5-5 (5.5 for 2 & 3 year olds) at calving and NZ BCS ≥4 at mating.
HEAT DETECTION EFFICIENCY: Top quartile farmers find more heats, submitting 7% more early calved mature cows in the first three weeks3. While incorrectly identified heats result in failed inseminations, on most farms the impact of ‘missed heats’ on final incalf rates will be much greater. Aim to have 95% of earlycalved mature cows mated in the first 3 weeks.
HEIFER MANAGEMENT: Grow heifers well and get them in calf early. Top quartile farmers had 81% of first-calvers calved by week 3. Having heifers at 60% of their expected mature live weight at 15 months improves conception rates and reduces the risk of being empty7.
GENETICS Cows: High NZ fertility BV cows have better quality eggs and conception rates5. The relationship is also seen at a population level, where a 1BV increase in Fertility BV is associated with approximately a 1% lift in conception rate, tapering off above BV 3 to about 55% CR8. Aim to use bulls with positive daughter fertility BVs. Bulls: Conception rates are similar for most AI bulls and will vary over the bull’s lifetime9. Bull fertility is managed at AI centres with strict semen quality criteria in place for eligibility. At a population level bull fertility cannot be measured any more precisely than within ± 2-3 % due to a wide range of factors,10 so it is important to not overinterpret AI bull fertility figures. Use AI bulls carrying the key traits you require9.
AI PRACTICES: Good semen storage, handling and AI technique are important for high conception rates1. Avoid exposure of semen to chemical fumes (including cigarette smoke!) sunlight, rain and dust on farm. Handling cows quietly in good facilities for the inseminator will also help achieve good results.
10
COW AGE: Conception rates drop as cows age - there are significant drops from 6 years old but particularly so once cows are 8 years old and older. Try to limit numbers of old cows and just keep the early calving ones. Focus on preventing calving pattern slippage in young cows.
MILK PRODUCTION Volume and fertility have a negative genetic association, but if you are using New Zealand genetics there is no evidence of compromised conception rates in high genetic merit, high producing cows. DairyNZ Fertility trial research saw wide differences in reproductive outcomes in the two high and low fertility BV groups, and this was unrelated to milk production12. In summary, a strong focus on meeting body condition targets, growing heifers well, good heat detection efficiency, AI practices, cow health and nutrition and using underlying good fertility genetics helps achieve high submission and conception rates and a compact calving year on year. M&H Note: Take care when assessing CR at a farm level. As a binomial statistic, chance plays a part and it needs a large number of inseminations included to be meaningful. E.g. Two inseminations can result in 0, 50 or 100% CR, simply due to random chance. References: 1. The InCalf book for New Zealand dairy farmers2nd edition (2017), DairyNZ, Hamilton, New Zealand 2. Craig et al. (2018) Genotype by environment interactions in fertility traits in New Zealand dairy cows J Dairy Sc. 3. https://www.lic.co.nz/tips-and-advice/reproduction/nationalreproduction-results/ 4. https://www.dairynz.co.nz/about-us/research/pillars-of-a-newdairy-system/most-pregnancy-losses-occur-in-the-first-weekafter-breeding/ 5. https://www.dairynz.co.nz/news/better-oocytes-in-our-sights/ 6. https://www.dairynz.co.nz/about-us/research/pillars-of-a-newdairy-system/endometritis-reduces-in-calf-rates/ 7. https://www.dairynz.co.nz/media/5790418/heifer-factsheet-12. pdf 8. LIC data( 2019) 9. DataGene (2016) Technote 9, Semen Fertility https://datagene. com.au/technote 10.DeJarnette, J.M. (2010) Proceedings of the 23rd Technological Conference on Artificial Insemination & Reproduction 11.https://www.dairynz.co.nz/about-us/research/pillars-of-a-newdairy-system/endometritis-reduces-in-calf-rates/ 12.https://www.dairynz.co.nz/about-us/research/pillars-of-a-newdairy-system/fertility-bv-animal-model/ Milk & Honey I JANUARY 2021
VIKING JERSEY VOORDELE
Dr Johan Jooste
Voordele om slegs Viking Jersey bulle te gebruik in SA Jersey kuddes VikingGenetics Jerseys voer Jersey semen en diere uit na 50 lande in die wêreld. Daar is ‘n aanvraag na hulle produk as gevolg van die goeie resultate wat oral verkry word. Die gehalte van die teling wat hulle beskikbaar het pas ideaal in by vandag se kommersieël georienteerde telers se behoeftes.
Viking Jersey het teelstukture geskep wat uiters suksesvol bestuur word. Gesondheidseienskappe is belangrik in alle lande en die verbruiker van suiwelprodukte vereis dit vandag. Die Viking Jersey gesondheidsindeks neem alle reproduksie probleme, die voorkoms van ketose, metaboliese toestande, uiergesondheid en klougesondheid in ag. Dit neem baie generasies se intense seleksie vir hierdie eienskappe om dit in ‘n populasie vas te teel. Dat Viking Jersey suksesvol was hierin kan geïllustreer word in die lae vlakke antibiotika se gebruik. Die Deense populasie gebruik 7.1mg/PCU (population correction unit) per koei per jaar teenoor die VSA wat 237mg/PCU gebruik. Dis hoofsaaklik as gevolg van die inherente siekteweerstand van hulle beeste plus natuurlik goeie bestuur om die vlak te bereik. Die gebruik van hormone is minimaal in die Skandinawiese lande. Viking Jersey is die beste opsie om beide produktiewe en gesonde koeie te teel. Die rede hiervoor is onder andere hulle uiergesondheids indeks van 101 teenoor die 90 van die VSA Jersey, asook die vroulike vrugbaarheidsindeks van 101 vs die 90 van die VSA se Jersey koei. Beide is beduidende verskillend. Dis logies om hierdie bogemiddelde sekondêre eienskappe te behou. Gebruik Milk & Honey I JANUARY 2021
dus Viking Jersey bulle konstant op Deense teling in SA. Anders word die vordering vir die eienskappe in een generasie ongedaan gemaak. Inteling word suksesvol nasionaal bestuur vir die Deense Jersey. Hulle het diversiteit in hulle Jersey populasie behou. Dis nie nodig om in ander Jersey populasises vir laer verwante bulle te gaan soek nie. Bouvorm seleksie deur Viking Jersey beklemtoon al die eienskappe wat positief gekorreleerd is met produktiewe lewe. By uierbouvorm word die swaarste gewig op uierdiepte en vooruieraanhegting geplaas. In SA word daar steeds te veel koeie uitgeskot as gevolg van te diep uiers. Laasgenoemde tipe uiers is die hoë Somatiese Sell Telling en mastitis koeie in ‘n kudde. Indien vlak uierdiepte met hoë produksie gekombineer kan word is dit groot vooruitgang. Hulle huidige nasionale gemideld is 7552 Kg M, 6.00% BV, 4.26% Prot met ‘n gekombineerde Kg Botter Vet en Protein van 850. Hoë vastestowwe bly die Jersey ras se grootste bate.
OPSOMMING: 1. Viking Jersey se teelprogramme lewer optimale resultate vir gesondheids eienskappe, lang produktiewe lewens en hoë produksie. 2. Antibiotika en hormoon gebruik word sterk ontmoedig 3. Die Nordiese lande teel al al 40 jaar vir gesondheidseienskappe. M&H
11
SAVED FEED INDEX
Uliana Kovaleva Langeland, VikingGenetics
Saved Feed Index now in the Nordic Total Merit The Saved feed index is now part of the Nordic Total Merit Index (NTM) for the genetic evaluation of Holstein, Jersey and Red Dairy Cattle. The aim is to improve efficiency, reduce feed costs at farm level and ensure a more resource-efficient production.
maintenance efficiency is based on different measures of live weight with the conformation traits like stature, body depth and chest width used as indicator traits.
With the Saved feed index is possible to achieve even more environmentally friendly milk production by reducing greenhouse gas emissions per litre of milk produced. At the same time, the production profitability is streamlined.
The researchers continue to collect data on the live weight of cows in herds that are included in the research. Besides, the Natural Resources Institute Finland (Luke) is also investigating whether the slaughter weights can be used as a measure of the size of the cows in the calculations.
ECONOMIC IMPORTANCE
THE SIZE OF THE COW MATTERS
The fact that the Saved feed index has now become part of NTM reflects the importance of this aspect in the three VikingGenetics´ breeding programmes: VikingHolstein, VikingRed and VikingJersey.
By adding the Saved Feed Index to the NTM the idea is also to have a better control of two aspects that are of high relevance for daily dairy farming:
From an economic point of view, breeding for improved feed efficiency is an important area to focus on. According to Nordic Cattle Genetic Evaluation (NAV), up to 88% of the variable costs on a dairy farm relates to feed costs.
2. Improve cows´ feed conversion ability.
The Saved feed index describes the animal´s genetic ability to save feed costs as a result of improved feed conversion ability and lower maintenance. The higher the index, the more efficient a cow is in turning feed into milk.
MAINTENANCE AND METABOLIC EFFICIENCY The Saved feed index consists of two parts: Maintenance efficiency and Metabolic efficiency. Maintenance measures how much energy a cow uses due to her body size. It is well known that heavier cows use more energy than less heavy cows at the same production level. Metabolic efficiency measures how efficient the cow is in converting feed energy in her body. This is energy used, for instance, to support milk production. This new index has until now only consisted of the maintenance efficiency aspect. The breeding value for
12
1. Set a limit to the size of the cows. The fact that cows are getting bigger is unprofitable because it leads to higher feed costs and poorer durability. There is a negative genetic link between the cow´s growing size and its longevity.
ARTIFICIAL INTELLIGENCE TO INCREASE RELIABILITY We are working to develop an extensive registration system to make data for individual cow´s feed intake over her lifetime available. We focus on collecting the data that are comparable across the breeds and herds. As one of the first movers, we are exploring the missing link in the feed efficiency equation – the individual cow feed intake. VikingGenetics has developed a 3D camerabased solution to make individual feed intake records on cows in commercial farms. The analyses of the data collected on cows´ weight, feed intake and milk production will contribute to identifying which cows have the most efficient energy intake. Milk & Honey I JANUARY 2021
HIGHLIGHT The cost of feed is a dairy farm´s largest item of expenditure, therefore there is a demand to genetically develop the animals so that they use the feed more efficiently than before.
WHAT’S IN IT FOR ME? • With the Saved Feed Index, farmers can breed for more efficient and high-yielding cows with a long productive life to ensure a more resource-efficient production. • The data is collected from commercial farms which means farmers are engaged in the making of the new index. • From November 2020 proof run Saved feed index will include the breeding value for metabolic efficiency. The new index will comprise feed intake records on cows in both commercial and research farms. • With the Saved feed index farmers can reduce the size of the cows. The bigger the cow, the more energy it needs to maintain itself. • There is a negative genetic link between the cow´s growing size and its longevity. M&H M&H
Effektiewe en akkurate databasis vir suiweldiere in Denemarke deur Dr. Johan Jooste
Met hierdie volledige en geïntegreerde databasis lewer Viking Jerseys so ‘n groot bydrae tot die Jersey ras wêreldwyd. Data word ingesamel vanaf verskeie bronne:
• Alle Jersey kalwers moet binne 24 uur geïdentifiseer en gemerk word • 95 % van die koeie is in amptelike melkaantekening • Voerinnames word gemeet met die nuutste tegnologie • Alle gesondheidseienskappe word aangeteken deur die teler en konsulterende veearts • Hoefgesondheid word aangeteken deur die hoefsmit • Reproduksie verwante eienskappe word volledig aangeteken • Data oor kalwingsgemak en vrektes word rekord van gehou • VikingGenetics voorsien die nuutste teelwaardes Bogenoemde data kom uit onder andere die kudde eienaar of bestuurder, die finansiële en voedingsadviseurs, die KI tegnici, veeartse, laboratorium uitslae en abattoirs.
het ‘n span deskundiges wat hulle hier bystaan. Die program word gebruik vir die formulering van die kudde se rantsoene, opvolg na rantsoenformulasies, produksie vooruitskatting en afwyking van doelwitte, melkery begroting en opvolg van afwykings en “key performance indicators”. Die kudde eienaars of bestuurders gebruik hulle selfone om baie vining data in te sleutel terwyl hulle tussen die koeie beweeg. Veral hitte waarneming baat hierby. Met ‘n selfoon kan hulle onmiddelik antwoord gee op ‘n vraag soos wat is die koei se huidige produksie met vastestof % asook die stamboom van ‘n bees met teelwaardes. Deur die data gedurende die dag aan te teken vereis dit net ‘n verdere 15 tot 20 minute aan die einde van die dag om alle data volledig op die stelsel te plaas. Met die gebruik van DMS bou hulle aan die doelwitte van die Danish Dairy Concept. Laasgenoemde streef na volhoubare suiwelproduksie in kombinasie met hoë produktiwiteit maw “profitable, sustainable growth”. Die in lyn met die politiese aanslag vanaf die verbruikers in die EU:
Daar is deurlopende en deeglike monitering van bees siektes. Denemarke is vry van Bek-en-Klou, Brusellose, IBR, BVD en Bees Leukose.
• Gesonde en natuurlike produkte
DAIRY MANAGEMENT SYSTEMS
• Hoë effektiwiteit tov voer en energie verbruik
DMS is ‘n uitstekende bestuursprogram vir suiwelkuddes. Die program word teen ‘n nominale koste aan die suiwelkuddes voorsien deur SEGES die Staat. Kuddes
Milk & Honey I JANUARY 2021
• Welsyn van diere is toenemend belangrik • Klimaat vriendelik • Volhoubaarheid waar uitsprake en beloftes nie net woorde bly maar waar word in die praktyk. M&H
13
Heifer Mgt.
Chapter 9, pages 45-59
Heifer Management
Chapter 8, pages 39-44
Genetics
Genetics
Cow health
• Ensure quality grazier is confirmed and a contract is in place • Schedule routine animal health treatments/procedures • Are your heifers reaching the target liveweights you have set for your farm? • Calving heifers: do they start calving before the cows? Will they calve at body condition score 5.5? • Bring heifers back to the home farm early enough to get them used to the farm and changes in feed
• Cow health problems under control • Transition well managed • Spring rotation planner in place
Body Calving condition & Pattern nutrition
Calving
• Are the fertility breeding values of the new born calves appropriate for your pasture based system?
• Regular contact with graziers, visit heifers if possible • Weigh regularly and manage heifers so they are on track to make target liveweights at mating and calving • What is your pregnancy testing strategy for heifers? • Pregnancy test heifers • Review your reproduction performance with your rural professional team and staff
• Are your heifers reaching the target liveweights you have set for your farm? • Put bulls out with yearlings ahead of the herd, or mate them to AB
• Weigh calves to prepare for weaning • Weigh yearling heifers • Are the heifers big enough to be cycling before mating? • Are you going to synchronise the heifers? • Which bulls have you selected? • How many bulls do you need?
Bull Mgt.
• Early-aged pregnancy test completed • Herd nutrition and BCS on track • Desired plan for dry period in place • Have you submitted your records (heats, non-cycling treatments, mating and pregnancy diagnosis) to your herd improvement organisation so you can receive your InCalf Fertility Focus Report? • First pregnancy scan 14 weeks after the start of mating, for second scan only scan the doubtful cows and those with no result from the first scan • Final pregnancy scan six weeks after the end of mating to verify the empties • Identify and plan the removal of surplus stock • Review your reproduction performance with your rural professional team and staff
Mid-late Lactation
• Are the fertility breeding values of the new born calves appropriate for your pasture based system?
AB Practices
Mating
• Re-visit mating plans, ensure enough semen is ordered and herd improvement company is aware of any synchronisations or non-cycler treatment planned
• Pre-mating cycling on track • Submission rate on target • Heifer weights on target for mating
Heat Detection
Early Lactation
Year Round Reproduction
• Weigh regularly and manage heifers so they are on track to make target liveweights at mating and calving • Ensure teat sealants are booked and administered at the right time if being used
Body condition & nutrition
Dry Period
• Weigh regularly and manage heifers so they are on track to make target liveweights at mating and calving • Plan for transition when heifers return home
• Plans for calving pattern in place • BCS at calving on track to targets • Heifer weights on target for calving
Cow health
• Which cows will be culled and for what reasons?
Body Heifer condition & Mgt. nutrition
Dry off
Source: DairyNZ InCalf® Hamilton, New Zealand. Reproduced with permission. • Consider blood testing cows to monitor mineral and nutritional status • BCS herd ahead of mating and manage cows accordingly, cows should be 4.0 and heifers should be 4.5
• Consider MetriChecking cows at risk of endometritis
• Calving cows: Will they calve at body condition score of 5.0 for mature cows, 5.5 for young cows? • Is the total feed supply sufficient? Are there too many late-calvers?
• BCS at planned start of calving • Monitor condition loss once they calve
• Identify and deal with ‘at-risk’ cows early • Regularly monitor the calving mob for cow health and calving difficulties; record and deal with problems promptly • How will you minimise the number of non-cyclers?
Body Condition & Nutrition
Cow Health
• Review your reproduction and heat detection performance with your rural professional team and staff
• Review your reproduction performance with your rural professional team and staff
• Monitor heat detection performance • Maintain aids • Monitor submission rate • Monitor return intervals
• Monitor semen, order more if required
• Meet with AI technician to review plans and confirm timing • Order consumables for DIY inseminators • Refresh staff / train new staff on AI management
AB Practices
• Review your reproduction performance with your rural professional team and staff
• Cow health tool • Detailed Fertility Focus Report • Length of mating tool • InCalf gap calculator
• Monitor bulls in with heifers • Manage bulls; minimum two in the herd at any time, remove if they become lame and do not use again, rotate every 24-48 hours
• Bull management tool • Intermediate Fertility Focus Report • InCalf gap calculator
• Ensure sufficient numbers of bulls are planned, check out the table on page 136 of the InCalf book
• Cow health tool • BCS during early lactation tool • Non-cycling tool • InCalf gap calculator
• Source service bulls, ensure BVD tested and fully vaccinated ahead of contact with the herd.
• Body Condition at calving tool • Heifer rearing tool • InCalf gap calculator
InCalf Tools & Resources
• InCalf gap calculator
DNZ10-020
• Use herd tests to make culling and treatment decisions • Make a dry-cow treatment plan with your vet
• BCS your herd during the dry period to make sure cows reach desired BCS for calving (cows 5.0, 5.5 for first and second calvers) • Make a dry off plan with your advisers based on BCS, calving date and feed budgets
about the
book:
“ This is one of the best reference use, the right texts for farm level of detail.” managers I have seen. It is easy to The InCalf Book is practical knowledgeexcellent... It gave me valuable is limited.” knowledge in the area where my “It makes training in the workplace very easy to fit into a busy schedule.”
farmers say
Dairy cow fertility InCalf Research underpins the viability and productivity involving nearly 40,000 herds across of every dairy Australia dairy cows business. clearly demonstrate in more than reproductive 200 dairy performance d the substantial in most herds. 50,000 cows potential in more than New Zealand to improve Australian 200 seasonal studies involving InCalf research. calving herds, more than back up the findings of For the first the time, New Zealand dairy book covering farmers now the latest have and most managemen reliable information an easy-to-use reference t. on dairy herd reproductive
What dairy
rs
book nd dairy farme
The InCalf for New Zeala
• Calving pattern tool • InCalf gap calculator
• Do your AB facilities meet current guidelines?
• Review spring animal health plan • Regularly check cows at winter grazing and bring any home that are doing poorly • Identify and treat health conditions promptly, including mastitis after dry-off
• Manage dry cows at home to meet BCS and feed budget targets and to minimise pasture damage
• Start preparing for calving eg calf sheds and spring first aid kit • Train staff calving management and first aid
The InCalf
For further information on all topics, refer to the second edition of the InCalf book, free for all levy payers and free to download online: dairynz.co.nz/publications/animal/the-incalf-book
Use the relevant tools to assess risks and likely impact on reproductive performance and milksolid production when targets aren’t being met. Find them at: dairynz.co.nz/incalf
Chapter 15, pages 129-138
Bull Management
Chapter 14, pages 119-128
Chapter 13, pages 103-118
• What is your heat detection strategy? • Create a heat detection plan • Ensure aids are ordered • Refresh staff / train new staff • Pre-mating tail painting - 4-6 weeks prior to planned start of mating • 10 days prior to mating monitor how many haven’t cycled
• Treat non-cycling cows early
• Review feed budget and nutritional plan for winter / dry period • BCS herd and manage cows below 4.0 - options include drying off or putting them on OAD • Plan for drying off herd • Organise winter grazing
• Review your reproduction performance with your rural professional team and staff
Heat Detection
Chapter 12, pages 91-101
Chapter 11, pages 69-89
Chapter 10, pages 61-68
Calving Pattern
for New Zealand dairy farmers
book
STATS & FACTS
Useful New Zealand Repro Stats & Facts Understanding performance and benchmarks can be helpful when assessing your herd’s reproductive performance and potential. Assessment measures vary from country to country, but the drivers of reproductive success are the same – submission rate and conception rate.
Over recent years in New Zealand, the amount of detailed on-farm performance information has grown considerably, providing a substantial benchmarking resource. Here are some useful reproductive statistics from New Zealand, along with high-level comments.
NZ national reproduction results, 2019 season1, (4207 herds) Herd ranking
6 week incalf rate (%)
Top 25% National average Bottom 25%
77 68 58
Overall pregnancy rate (%) 88 84 79
Mating length (days) 71 75 79
• calved faster • found more heats (higher heat detection indicator figure) • had higher 3 week submission rates • had higher overall conception rates • had higher 6-week (6wk ICR) and final in-calf rates, in a shorter mating period Performance by calving pattern - National Herd Fertility Study results2 6-Week In-Calf Rate by Calving Pattern Group
8%
• cows calving after week 6 had significantly lower submission and conception rates. They are more likely to be on a first or second heat, which are of lower fertility3 • the chance of conception increases by 13% with each extra week post-calving before first service5 • cows inseminated less than 23 days after calving have very little chance of conceiving 2,3
17%
65% 35% Calved by 3-6 Weeks
Calved by 6-9 Weeks
Calved >9 Weeks
Source: National Herd Fertility Study, Brownlie & McDougall, Cognosco (2013)2 Achieving a compact calving is very important in seasonal block-calving herds. Similar to InCalf Australia figures3, early calving cows in the National Herd Fertility Study had > 35% higher 6 week in-calf rate and > 20% higher first service conception rate than very late calving cows. Calving earlier conferred a 6 wk ICR performance advantage across the entire period. First 6 weeks of calving: • 3 week submission rate in cows calved in the first 6
16
After week 6
Average 6-week in-calf rate by age group and breed National Herd Fertility Study (NHFS) results2
13%
52%
Calved by 3 Weeks
88 84 80
Est. heat detection (%) 89 86 82
• First service conception rate differed across the first 6 weeks. Cows calved in weeks 1-3 had higher first service conception rates compared to those calved in weeks 4-6
6-Week In-Calf Rate
6-Week In-Calf Rate
NHFS: Brownlie and McDougall, Cognosco 2013
73%
Calved by week 6 (%)
weeks was similar, regardless of when they calved within that block
Top quartile herds
100% 90% 80% 70% 60% 50% 40% 30% 20% 10% 0%
Overall conception rate (%) 60 54 47
3 week submission rate (%) 86 80 73
6-Week In-Calf Rate by Age and Breed
80% 75% 70% 65% 60% 55% 50% 45% 40% 0% 2 yrs
3 yrs
4 yrs
5 yrs 6 yrs 7 yrs 8 yrs Age of dairy cow Friesian Crossbreed Jersey
9 yrs
10 yrs
• Similar 6 week ICR was seen in cows groups aged 2 through to 6 years old, increasing slightly to the age of 5 • Once over the age of 6 years, cow fertility declines more noticeably • 2 year-olds had lower average performance than 3-5 year old cows2. Although the underlying fertility of this group should be high, heifers experience unique challenges as newcomers to the herd. First calvers can benefit from targeted management strategies to help them achieve herd longevity6
Milk & Honey I JANUARY 2021
Joyce Voogt, International Technical Manager, LIC • Heifers grown to reach target liveweight deliver 5% better 6 wk ICR and 1.5% lower empty rates4
Round of mating AI Conception rate 1 (week 1-3)
54%
• Yearling heifer conception rates are usually ≥10% higher than lactating cows due to various factors such age, lactation and disease3.
2 (week 4-6)
49%
3 (week 7-9)
44%
4 (week 10-12)
39%
The NHFS2 saw a breed-by-age interaction: • Crossbreds had the highest performers in all age categories
Mating start date and end dates
• Jerseys were slightly ahead of Friesians, when aged ≤ 7 years old
LIC figures8 suggest pulling mating start date forward impacts 6 week ICR and final not in-calf rate in the subsequent season, likely due to cows having less recovery time before mating start.
• Friesians were slightly ahead of Jerseys, when aged > 7 years old • Overall, the differences between breeds were small Mating period progression As mating progresses beyond week 3, conception rates are expected to decline as the less fertile animals remain in the ‘open cows’ group. This appears to be the case in the LIC 2019-season data8, which showed an average 5% decline in conception rate per round of mating.
Impact of moving mating start date
2019 average impact: 1 day = a 0.5% drop in 6wk ICR, 0.2% increase in not-in-calf rate 2-4 days = 1.5% drop in 6wk ICR, 0.5% increase in not-incalf rate 1 week = 3.9% drop in 6-week in-calf rate, 0.9% increase in not-in-calf rate
The impact of shortening mating length 6 week in-calf rate 40 50 60 70 78
% open 60 50 40 30 22
Mating period length (days) and expected empty rate*(%) 7 8 9 10 11 12 13 47 36 28 23 19 16 14 39 30 23 19 16 13 11 31 24 19 15 13 11 9 23 18 14 12 10 8 7 17 13 10 8 7 6 5
14 12 10 8 6 5
15 10 8 7 5 5
Adapted from the ‘expected empty rate (%) given 6-week in-calf rate and length of mating’ table – The InCalf Book for NZ dairy farmers6 The impact of shortening mating length will vary depending on the herd’s 6 week in-calf rate. For an average performing New Zealand herd, shortening mating length increased empty* rate as follows: • 12 weeks to 11 weeks = 2% increase in empty rate • 11 weeks to 10 weeks = 2% increase in empty rate • 10 weeks to 9 weeks = 2.4% increase in empty rate • 9 weeks to 8 weeks = 3.3% increase in empty rate *Note- ‘empty rate’ refers to the % of cows present at mating start that were not recorded as pregnant, including those missing a pregnancy test result for any reason, including those that were culled prior to pregnancy testing.
Young cow management
milk
production
–heifer/young
cow
Heifer and lactating-cow management can affect productive and reproductive performance4 in the first two years of herd life. Milk production in first and second lactations (2 and 3 year olds) is typically less than that of older herd mates. New Zealand average milksolids production by age, relative to 4-8 year old cow production is: • 2 year olds = 77% • 3 year olds = 90%7 If the young cows are performing below these production averages, it may warrant further investigation.
Mating start and end dates decisions involve a variety of farm factors6. Seek professional advice if you are considering changes and set a robust plan in place to optimise outcomes.
References:
Heat detection
2. NHFS, Brownlie & McDougall, Cognosco (2013)
1. https://www.lic.co.nz/tips-and-advice/reproduction/ national-reproduction-results/
95% of early-calved mature cows (ECM) should have been mated by week 3 of the following mating block. Lower than a 95% ECM 3-week submission rate suggests that some heats were missed.
3. Incalf book for dairy farmers, 2nd edition, Dairy Australia
It is estimated that for every 10% of missed heats, 6-week in-calf rate will drop by 5%3.
6. The InCalf®book for New Zealand dairy farmers 2nd edition, DairyNZ
ECM cows = cows aged > 4 years that calved in the first 4 weeks of the calving block
7. New Zealand Dairy Statistics, LIC & DairyNZ (2019)
#
#
Milk & Honey I JANUARY 2021
4. https://www.dairynz.co.nz/animal/heifers/ 5. https://www.dairynz.co.nz/about-us/research/pillars-of-anew-dairy-system/
8. LIC, pers comm. M&H
17
INDICES SELECTION
Application of Selection Indices in Dairy Cattle Breeding INTRODUCTION Livestock breeders have known, since time immemorial, that the economic value of an animal is influenced by several traits. Genetic improvement should, therefore, aim to improve all economically relevant traits. The selection index, which was developed way back in 1943, remains the most widely used and accepted tool for achieving such multiple trait selection. Essentially, the method combines all economically relevant traits into a single value or index, with each trait being weighted by its relative economic importance. Dairy cattle breeding programs worldwide use selection indices, and regard them as a vital tool for genetic improvement. The traits included in the index and their economic weights vary widely from one country to another, since these depend on the production and economic circumstances peculiar to each country. This article presents an overview of the evolution of selection indices in dairy cattle globally, and reviews their application in South Africa.
HISTORICAL PERSPECTIVE Awarding an overall score for an animal, based on component traits, has always been practiced by livestock breeders. During the early years of selection, conformation was the major focus. Animals were evaluated based on how they looked compared to the gold standard for the breed. This gave rise to the practices of type classification and show competitions, which have pretty much persisted until the present day. It was, however, eventually noted that livestock breeding should focus on improving traits with a direct effect on revenue streams and production costs (i.e. economically relevant traits). This led to the development of indices comprising mainly of production traits and, in most cases, type (conformation) traits as well. In dairy cattle, the main production traits included in
18
the indices were yields of milk, fat and protein. Substantial genetic gains were achieved in these traits in most dairy cattle breeding programs worldwide, notably towards the turn of the 20th century. Functional traits such as health and reproduction were, however, largely ignored due to their low heritability and the fact that they are generally difficult to measure. The omission of other economically relevant traits from these indices was a major shortcoming as it led to their detriment. It was noted with awe and disappointment that, due to an unfavourable genetic correlation, intense selection on production had led to a sustained deterioration in functional traits. This led to drastic efforts to incorporate fitness traits in most national selection indices. Today, practically all national selection indices include some functional traits. In some indices, functional traits actually receive much more emphasis than production. In addition to reproduction and health, functional traits such as workability (milking speed, temperament), and feed efficiency are included in some national indices. The portfolio of traits included in most indices continues to increase, with prospects of including novel traits such as those related to environmental pollution and cow welfare in the near future. Relative economic weights in the different indices are also revised on a regular basis, in line with ever- changing production and economic environments.
DOES CONFORMATION MATTER? Cattle breeders worldwide have long held the belief that type or conformation traits have important influence on cattle performance. It is therefore not surprising that these traits continue to receive considerable attention in most dairy cattle breeding programmes globally. Although traits such as udder and legs and feet conformation are important insofar as they are related to economically relevant traits such as longevity, the inclusion of most type
Milk & Honey I JANUARY 2021
Prof Cuthbert Banga, ARC Animal Production, Irene
traits in selection indices is questionable. Most scientists concur that, generally, far more emphasis is placed on conformation than is justifiable. Moreover, many studies have shown that the direction of selection exerted on many conformation traits in the past was detrimental. For many years, dairy cattle breeders selected for large body size. Research has, however, shown convincingly that cow size should have negative emphasis (i.e. large body size is undesirable). Furthermore, certain body traits, such as angularity, have been reported to bear a strong negative relationship with cow fertility and health. It has also been well documented that body traits are generally of limited value in determining dairy cow profitability and should be eliminated from selection indices. Consequently, type traits have lost emphasis in most national selection indices. In fact, a significant number of selection indices do not include type traits.
THE SOUTH AFRICAN EXPERIENCE In South Africa, dairy cattle selection indices have been used in the Holstein and Jersey breeds for nearly three decades. The Holstein Breeding Value Index (BVI) and the Jersey SAINET, which were developed through a consensus approach, were the original indices. A major characteristic of these indices was that they were production-type indices. The original BVI favoured high protein and butterfat producing cows, with large framed and extremely angular bodies, and, tightly attached udders. On the other hand, the SAINET favoured cows with large body capacity, exceptional dairy form, deep and well attached udders, sound feet and legs, and, producing milk of high compositional quality. A series of refinements were eventually effected on these indices, which mainly involved altering relative economic weights and adding traits such as udder health (somatic cell score) and reproduction (calving interval). Recent developments have given rise to a number of indices and sub-indices for the Holstein breed. The Holstein Solids Index (HSI) caters for the solids market, while the Fluid Merit Index (FMI) has a focus on milk yield. Subindices include the Efficiency Index (EFI), Body Weight Composite (BWC), Conformation, Udder, Feet & Legs (F&L), Logix Type Index (LTI) and Logix Production Index (LPI). For the ranking of commercial animals, the Logix Merit Index (LMI), which was developed by Studbook is used. The current form of the Jerseys SAINET includes reproduction (calving interval) and longevity (functional herd life). A fluid merit index and cheese yield index have also been developed for the Jersey. Based on available scientific knowledge as well as global trends, the following comments can be made about the indices that are currently used in South Africa. • It is commendable that efforts are being made to broaden the selection indices, which has resulted in
Milk & Honey I JANUARY 2021
traits such as longevity, udder health and reproduction being added. The fact that relative economic weights are revised from time to time is also laudable. However, it needs to be stressed that the economic weights should be calculated based on sound scientific principles and the prevailing production and economic environments. • There is big room for further broadening the indices to include more economically relevant traits. A major prerequisite to this is expanded performance recording to include traits such as live weight, calving performance (calving ease and stillbirth) and disease incidence. More comprehensive recording of data is also necessary to replace traits such as calving interval with better measures of cow fertility, such as days open and conception rate. • The continued inclusion of body traits in these indices needs to be examined objectively. Research has clearly pointed to the lack of importance of these traits, and most national indices now exclude them. The positive emphasis placed on traits that promote large body or frame size such as rump height, rump width and chest width is particularly questionable, as it is contrary to the global trend of reducing cow body size. Increased body size has been shown in many studies to be associated with higher maintenance costs, and is therefore undesirable. • Due to changing human dietary patterns, the value of fat relative to protein has increased drastically in the past few years. This is reflected in the relative prices paid for the two milk components in payment systems. A quick survey of milk payment systems of some major local milk buyers shows that fat now has a much higher price than protein. On the contrary, protein has a higher economic weight in the selection indices. This results in reduced accuracy of selection for overall economic merit, which hampers genetic progress.
CONCLUSION Selection indices serve as a valuable tool for achieving genetic improvement in overall economic merit of animals, and have been widely used by cattle breeders for many decades. Based on extensive research, dairy cattle selection indices have evolved significantly over time to become more balanced and in line with changing production environments and market trends. In South Africa, although dairy cattle selection indices have also developed in tandem with global trends, there is large scope for improving the ones that are currently in use. This requires close collaboration between breeders, commercial producers, researchers and other stakeholders. M&H
19
BEAMER ON A MILLION DOSES
Matthew Rennie, LIC Communications Advisor
San Ray Beamer hits the one million mark
from the Anderson’s and with a little luck selected the brother who happened to be the pick of the litter – Beamer.
Ray and Sandra Hocking with Simon Worth (centre) from LIC with Beamer.
One of LIC’s longest-serving bulls has reached the landmark achievement of selling one million semen straws in New Zealand and overseas. Holstein-Friesian bull San Ray FM Beamer ET S2F - better known as Beamer - reached the figure just in time for Father’s Day 2020. This famous bovine father has sired around 170,000 daughters around the country over the last eight years. Beamer is just the fourth bull from LIC to hit the one million straw mark, joining illustrious company with 90274 SRD Dawsons Belvedere, 90281 Kingsmill PA Walesa and 96329 SRB Collins Royal Hugo. His achievement is arguably the most impressive out of the entire group. Ten-year-old Beamer comes from an era where new bulls are superseding older bulls in LIC’s Premier Sires teams at a faster rate than ever before, mainly due to the co-op’s continued investment into genomic technology. This means it is very unlikely that another bull will ever reach the volume of straws that Beamer has delivered. Beamer has proved to be a hit with farmers, with many citing his mix of high breeding worth (BW) and good total overall production traits as a reason for favouring him. He was the number one ranked Friesian daughter proven bull for BW when he became proven in 2015 and his achievements have continued.
BEAMER BENEFITS Beamer was born in April 2010 and was one of three full brothers that were the result of an embryo transfer from the elite dam ‘Bust’ owned by Stewart and Kathryn Anderson of Otorohanga. Long-term pedigree breeders Ray and Sandra Hocking of Carterton purchased a ‘flush’ 20
The combination of the genetics from the LIC Hall of Fame inductee and farmer favourite Mint-Edition, combined with their own dam ‘Skelton Bust’ the breeding mix was a winner from the get go – all three brothers have been marketed through LIC’s Premier Sires teams. At one time, all three were also on the top 10 of Holstein Friesian New Zealand’s ranking of active sires list. LIC livestock selection manager Simon Worth, who has seen Beamer grow up throughout the years, says his contribution to the industry cannot be underestimated. “Beamers influence on this industry will be significant. Not only is he siring impressive daughters that farmers love to milk, but there is no doubt a number of his sons will follow in his footsteps. “It really is rewarding to see one of the industry’s highest indexing bulls contribute so much. And to be recognised further through the likes of Holstein Friesian New Zealand’s award system is just a feather in the cap. In 2015 he won the highly-regarded Mahoe Trophy and more than a dozen of his daughters have won awards as part of senior and junior progeny team awards in the Boehringer Ingelheim Progeny Competition. “Six years in Premier Sires is an outstanding achievement and one we will see less of given the faster turnover of bulls in this genomic era. As a result, I believe Beamer will be the last to sell a million straws in New Zealand.” Beamer’s legacy looks like it will carry on for years to come as well. Three of Beamer’s daughter-proven sons are in the current Premier Sires teams along with multiple offspring in genomic teams, proving a strong line of genetics and highlights the effectiveness of LIC’s genomic program. Son, Meander SB Arrow-ET S2F, currently sits third on the Friesian RAS list. Beamer has been an LIC Premier Sire for 6 consecutive seasons and still ranks amongst the best Friesians, with an impressive BW of 241 (AE 23.10.2020). His first daughters were born back in 2012, and are supplying plenty of information to back his fertility and longevity proof. At Fertility BV+1.5 /rel 99% and total longevity of +507 days*, the figures show Beamer is still hitting the mark. His residual survival stands out in the RAS list Friesian bulls line-up at BV +183/ rel 83%. Beamer is a bull who is delivering the goods - high performing and long-lasting daughters that are well-liked by farmers. M&H Milk & Honey I JANUARY 2021
HEAT DETECTION
Nicola Hemming, Reproduction Solutions Advisor, LIC
Heat Detection
11 Hours
2 Hours 5 Hours 8 Hours Genimex Patches or Scratch E cards ?
Can I use aerosols and other pungent tail paints at the same time cows are being inseminated? Semen is very sensitive to many chemicals, including things considered safe for humans. In the LIC semen labs staff are not allowed to wear perfumes or some deodorants for this reason. Semen is also very sensitive to sunlight, smoke and chloride fumes (such as the ones given off by Chloride of Lime, which may be used as a dairy shed cleaner). The effect will depend on the amount of exposure. Whilst exposure may be small because semen is still inside the straw, avoiding the use of aerosol spray at time of AI eliminates all possible effects. If this has to be done, do it after all cows have been inseminated for the day. Once semen is inside the cow, it is unlikely that aerosols will affect sperm survival. It is best practice that cows should not be tail-painted until the semen is safely in the cow. The same applies to glues used for heat detection aid application. This should not be an issue as it’s usually best to wait until the next milking to reapply her heat detection aids, otherwise they may become reactivated prematurely. Do I need to trim the hair before I put a Scratch E or Genimex Patches (GP) patch on, and how much do I take off? When should I do this? It is not recommended that you trim hair before applying these aids, but do remove any loose hair, dirt or dust from the application site 24 hours prior to application. However, do not do this too vigorously to avoid oils coming to the surface and please refer to the enclosed user instructions. In extreme cases where the winter coat is still present then the excess hair may be removed. My Genimex Patches (GP) was eaten by my yearlings. What should I do? Heifers are curious creatures and may occasionally entertain themselves by pulling at patches. The dye in GP has a very bitter taste to it. While they could potentially chew the patches enough to break them open and get to the dye, they should rarely come back for more. This behaviour should stop when they grow older, however you could try sourcing a repellent spray from your local farm supply store or vets to apply over the aid. Milk & Honey I JANUARY 2021
Should I reapply tail paint or heat detection aids straight after/during insemination, or should I wait until the next milking? Fumes can kill semen, so don’t tail paint while there are loaded pipettes not yet inseminated. As long as the AI session is complete, cows can be tail painted, but you may need to retouch the paint on the girls still riding the next day. An alternative is to do them later in the day or the next day – whichever works best for you. Heat detection aids will need to be applied once the cow is fully off heat. Why do I have cows with tail paint rubbed off, but the Genimex Patches (GP) has not been activated? Tail paint can wear off for a number of reasons and early disappearance may simply be due to poor application or maintenance. It is possible for a cow to be on heat without both aids being activated, so either way further investigation is warranted. Look for other signs of heat. Draft her out (the sexually active group drafted for mating may help with identifying whether she is on heat). Check the position of the GP and the condition of the tail paint when making a decision. If the GP position is incorrect then it may pay to inseminate. If the GP is in the correct position then look for other signs of heat carefully before inseminating, especially if she has been inseminated previously. Which works the best: Genimex Patches (GP) or Scratch E? Both are good and it really comes down to individual farmer preference. The mechanisms of the two devices are different with one being pressure activated and the other friction activated. Genimex Patches have a built-in mechanism that requires a firm standing mount of at least 3 seconds to activate, and give a clear indication when this has occurred. Scratch E’s are a friction activated aid which can add another level of interpretation due to the friction occurring over multiple mounts. With any aid success depends on correct application, maintenance and interpretation. Practice in the pre-mating heat period to ensure you are familiar with the aid you choose to use and make sure your staff are all fully trained. M&H Scientific references can be made available on request. Link to Youtube: Check out ‘5 signs of Heat’ Video youtube.com/ watch?v=T1UHmFvJLvU 21
NITROGEN EFFICIENCY
BEING NITROGEN EFFICIENT ON DAIRY FARMS Helping Farmers Rank LIC Bulls For Environmental Efficiency Nitrogen loss from a dairy farm to the environment is inefficient to the farm system, damaging to the aquatic environment and has a negative impact on the community and consumer perception of agriculture. Managing nitrogen in the high quality, high nitrogen pasture diet that we have in New Zealand has its challenges. There are times of the year where the high nitrogen content of pasture means that cow nitrogen intakes exceed her physiological demands and the excess is excreted, primarily through the urine.
NITROGEN BALANCE Nitrogen cannot be created nor destroyed by the cow; whatever she ingests must be either partitioned into productive outputs or excreted. Figure 1. shows the approximate annual partitioning of all N consumed to the various outputs.
22
Figure 1: Nitrogen balance of a lactating cow
Milk & Honey I JANUARY 2021
Tony Fransen, Environment & Welfare Manager, LIC
LIC’s new HoofPrint index provides farmers with accurate insights for bulls on the relative lifetime nitrogen efficiency of their progeny. HoofPrint index modelling generates two separate metrics displayed in the same index type manner. These reflect the estimated lifetime urinary nitrogen excretion per lifetime milksolids production and the lifetime enteric methane emissions per lifetime milksolids production. These metrics have been used, as it is important to demonstrate the whole impact of the animal over its lifetime, reflecting replacement and longevity as well as the energy requirements for growth, maintenance and production. The main energy and partitioning formulae within the model are derived from the NZ agricultural greenhouse gas inventory methodology, published and reviewed
Milk & Honey I JANUARY 2021
0.10 0.15 0.20 0.25 0.30 0.35 0.40 0.45
LIC HOOFPRINT™ INDEX
Urinary Nitrogen per milksolid (Kg Nu/Kg MS)
• Methods to manage the urine patch after deposition
-400
-200 0 200 400 Breeding Worth - BW (LIC SSAM - 25 Feb 2020)
Figure 2: Lifetime urinary nitrogen per milksolid production related to BW Lifetime urinary nitrogen excretion per milksolid production 0.26
• Breed to increase milk protein levels
0.24
• Dietary changes to balance nitrogen intake
0.22
The main focus areas for New Zealand research are:
Lifetime urinary nitrogen per milksolid production related to BW
0.20
Increasing nitrogen use efficiency and reducing urinary nitrogen leaching is a key goal for the dairy sector. Current research, including DairyNZ’s 7-year ‘Low Nitrogen Livestock’ programme, is looking at ways to help achieve this.
HoofPrint index modelling also shows that over the last 30 years the LIC Premier Sires Daughter Proven Team has reduced the urinary nitrogen per kg of milk solid by 16%. See Figure 3. M&H
0.18
The balance between nitrogen in and nitrogen out must be maintained.
The HoofPrint index modelling shows for every $10BW increase 1.7g less urinary nitrogen per kilogram of milksolid is produced. Figure 2. demonstrates this relationship.
0.16
Changes to dietary nitrogen intake will change the proportion of nitrogen partitioned to each output, as will any change to the level of a component output (i.e. milk production).
by Ministry of Primary Industries (MPI), referencing the most appropriate science to support the calculation.
Urinary Nitrogen per milksolid (Kg Nu/Kg MS)
Across the year the daily level of nitrogen intake and output changes as pasture protein and cow milk production levels fluctuate.
1990
1995
2000
2005
2010
2015
2020
Premier Sires Team (Daughter Proven, All Breeds, weighted averages)
Figure 3: Lifetime urinary nitrogen per milksolid production of Premier Sires team
23
CALVING DIFFICULTY
Calving Difficulty and Genetics Explained
Non-genetic factors are wide ranging and include year, time of year, herd, dam age, calf sex, calf birthweight versus dam size, twins, abnormal presentations, heifer live weight against target, body condition, nutrition, abortions, metabolic state of the dam and climate.
Difficult calvings result in more stillbirths and reduced production, health, fertility and lifespan for cows.
In New Zealand, farmers should aim for fewer than 2-3% assisted calvings. Selecting an appropriate bull is especially important when choosing bulls to mate over yearling heifers, who are more at risk of calving difficulty.
Genetic factors: LIC is committed to helping customers manage the genetic calving difficulty risk for our AI bulls. Farmers should also be careful to manage the risk from stock bulls they use.
Calving difficulty also known as dystocia has a number of causes:
The dairy industry provides information on calvingdifficulty breeding values (BV) for bulls if mated over yearling heifers and cows separately to help farmers pick suitable bulls for AI mating.
Feto-maternal disproportion
Calf birthweight
Cow pelvis size
Gestation length, calf gender, sire, breed, nutrition, climate
Parity?, weight, age, body condition score
Ancestry information and calving assistance records from farmers are utilised by NZAEL’s calving difficulty BV model to produce two separate calving difficulty BVs for enrolled sires. The reliability for the BV indicates the amount of ancestry or progeny information in the BV. More detail sits in the BW Bull file, which specifies the number of calving records feeding into each CD BV for every bull.
Many factors affect the proportion of animals that require calving assistance; cow, farm and season factors. Additive genetics plays a part, but only explains about 4% of the variation seen. Non-genetic factors (‘Environment’), explains the other 96%.
For reference, the average calving difficulty BVs* for sires of various breeds are below: AE Calving Difficulty BV Breed
Heifer
Cow
Holstein-Friesian
2.0%
1.1%
Jersey
-2.2%
-0.9%
HF X Jer Crossbred
-0.2%
-0.3%
*Data source AE 22/05/20
WHAT DOES THE CALVING DIFFICULTY BV MEAN? A sire’s Calving Difficulty Breeding Value (BV) predicts the percentage of assisted calvings expected when he is mated to yearling heifers (Heifer Calving Difficulty), or cows (Cow Calving Difficulty).
24
DairyNZ explains the two calving difficulty BVs ‘Heifer calving difficulty: Heifer calving difficulty breeding value for a sire is calculated from the difficulty its progeny has, being born from a two-year-old. Cow calving difficulty: Cow calving difficulty breeding value for a sire is calculated from the difficulty its progeny has, being born from a three-year-old or older.’ Milk & Honey I JANUARY 2021
Charlotte Gray, Beef Products Specialist, LIC
The BV number gives the expected % of births with calving difficulty greater or fewer than the reference point, which is set as 0. Half of his BV is transmitted to his progeny. For example, a bull with HCD BV of -2 can be expected to have 1% fewer calving difficulty events.
WHERE DOES THE INFORMATION FOR THESE BVS COME FROM? Heifer calving difficulty BV uses all heifer calving assistance records because of the low number of heifer calving records to AI matings. Cow calving difficulty BV uses selected herds based on the quality of their calving records. These are largely made up of progeny test scheme herds or those recording Traits Other Than Production (TOP). It takes approximately 2000 calvings to reach a reliability above 90%.
BEEF BULL CALVING DIFFICULTY BVS – NZAEL VERSUS BREEDPLAN BVS Beef breed societies have their own BREEDPLAN system that allows identification of superior bulls within breed. That means BREEDPLAN EBVs cannot be compared across different beef breeds. The key BREEDPLAN traits of birth weight, calving ease (direct), and gestation length are always considered by LIC when selecting suitable beef sires for use in dairy.
HOW HERITABLE IS CALF SIZE (BIRTHWEIGHT)? It varies. An Australian study in a number of beef breeds found heritability ranged from 0.36-0.46 (Jeyaruban et al., 2016). This means that genetics accounts for between 36% and 46% of the variability we see in birthweight. Traits like calf birthweight that sit between 0 and 1 indicate that a mixture of environmental (non-genetic) and genetic factors have a part to play.
DO FIRST CALVERS HAVE A HIGHER CHANCE OF CALVING DIFFICULTY? Unfortunately, yes. Data suggests that the incidence of calving difficulty is highest in first calvers (Funnell & Hilton, 2016). This is the case for both dairy and beef breeds.
ABNORMAL CALF PRESENTATION AND ITS LINK WITH CALVING DIFFICULTY A US study in beef cattle found that malpresentation of the calf during calving (i.e. breech) occurred in up to 4% of calvings. This accounted for up to 22% of calving difficulties reported and was found to occur more commonly in cows that had more than one calf. In fact, calf malpresentation accounted for up to 40% of reported calving difficulty in cows that had produced at least one calf (Funnell & Hilton, 2016).
HOW CAN CALVING DIFFICULTY BE AFFECTED? A huge number of genetic and environmental (nongenetic) factors play a role in calving difficulty; here are some of them: • Sire Selection It is important that the calf’s sire is carefully selected for calving ease (Funnell & Hilton, 2016). For bulls with reliable NZAEL calving difficulty BVs, selection for low BVs can help reduce the chance of a difficult calving, and for beef bulls these should be used (if available) in conjunction with BREEDPLAN EBVs for birthweight and calving ease traits. • Yearling Heifer Growth Proper heifer development is important, not only for reaching puberty, early and lifelong reproductive efficiency, but also for the prevention of calving difficulty. Poorly grown heifers are more likely to encounter difficulty at calving time (Funnell Hilton, 2016) regardless of the breed of sire used over them. • Dam Nutrition Calf birth weight can be manipulated by cow nutrition, particularly during the third trimester when the calf is at its maximum growth rate. However, there are conflicting reports around the influence of nutrition. In both extreme overfeeding and underfeeding situations the risk of calving difficulty is increased (Funnell & Hilton, 2016; Gunn et al., 2014) This can come about from overly large calves, heifers and cows having excessive fat deposits in the pelvis, whereas in contrast, under-conditioned animals can lack the energy to deliver their calf. There are also some reports that early and midgestation nutrition may have a greater impact on birthweight than late gestation nutrition, as cows that were fed an energy-restricted diet in early pregnancy had heavier placentas than those fed adequately (Rice, 1994; Micke et al., 2010). M&H References available on request
Milk & Honey I JANUARY 2021
25
BREEDING HEALTHIER COWS
Why you should consider breeding for healthier dairy cows Dairy cows are susceptible to a large array of diseases and disorders. Good management practices can help avoid unhealthy cows, but it is also possible to improve livestock resistance and resilience to diseases through breeding. By breeding for better health, your cows will stay longer in your herd. Infectious diseases such as mastitis, pneumonia, foot rot and many others usually require treatment with antibiotics. This is of growing concern to many consumers as the unrestricted use of antibiotics can lead to the development of resistant bacterial strains that can be transferred to humans and challenge treatment of certain diseases. Metabolic disorders such as ketosis, hypocalcaemia and displaced abomasum are a challenge on many dairy farms and require treatment or even surgical procedures. These can be costly treatments and result in significant loss of yield and reduced animal welfare. Reproductive disorders such as retained placenta and metritis can lead to delayed pregnancy or no pregnancy at all, which can result in unwanted culling of cows. A common denominator for all diseases and disorders affecting dairy cows are the financial losses due to reduced milk yield, treatment costs, increased workload, reduced animal welfare, and the undesirable use of antibiotics.
MANAGEMENT PRACTICES Good management practices such a proper feeding, good milking techniques, appropriate bedding, good ventilation, dry floors and many other factors are essential to avoid unhealthy cows. However, it is also possible to improve
26
Lars Peter Sørensen
Hans Stålhammer
livestock resistance and resilience to diseases and disorders through breeding. Adding genetic selection for disease traits to the breeding goal, with the proper weighting, will counteract the negative impact caused by genetic selection for increased production. Traits related to cow health usually have very low heritability from just a touch above zero to around 5%. This, however, does not mean that genetic progress is impossible (see for example Berry et al., 2019). The rate of progress depends on the genetic variance of the trait and reliability of breeding value determined by the number of animals with data and data quality etc. In the Nordic countries, veterinary treatment of dairy cattle for all kinds of diseases and disorders has been recorded since the 70s. Thus, they now possess enough data to form a database for genetic selection for disease traits. Genetic selection for health traits was initiated in the Nordic countries in the early 80s. However, health traits other than those related to udder health are very diversified and, in most cases, have a low incidence. When indices for general health were introduced in the Nordic countries, they were received with a great deal of scepticism in contrast to udder health, mainly because of ‘myths’ related to low heritability. Before 1999, the genetic merit for general health was declining in both bulls and females (Figure 1 and 2). The main reason was low selection pressure due to a low economic weighting. However, general health as a trait worked ‘unexpectedly’ well.
Milk & Honey I JANUARY 2021
Lars Peter Sørensen and Hans Stålhammer, VikingGenetics
110
Genetic trend Nordic Holstein bulls
*Figure 2 - Genetic trend for general health in Nordic Holstein females.
105
105
100
100
95
95
90
90
85
85
1999 2000 2001 2002 2003 2004 2005 2006 2007 2008 2009 2010 2011 2012 2013 2014 2015 2016 2017 2018 2019
Genetic trend Nordic Holstein females
110
1999 2000 2001 2002 2003 2004 2005 2006 2007 2008 2009 2010 2011 2012 2013 2014 2015 2016 2017 2018 2019
*Figure 1 - Genetic trend for general health in Nordic Holstein bulls.
FOCUS ON HEALTH TRAITS RATHER THAN PRODUCTION By around the year 2000, breeding goals in the Nordic countries changed to focus more on health traits and less on production. Also, there was an increasing willingness to include health traits in the selection of sires of sons. After a few years, the genetic trend for bulls changed and became positive. It should be noted that the genetic merit for sires was still lagging behind females in contrast to other traits.
Around 2007, the genetic merit of bulls overtook females and soon the genetic merit of females also started to increase. In 2008, the Nordic Cattle Genetic Evaluation was formed and resulted in a common breeding goal for Denmark, Sweden and Finland. This had a significant effect on the genetic trend mainly thanks to an increase in reliability of the general health index. The latest revision of the Nordic general health index was done in May 2019 (Vilarrasa et al., 2019). It now includes five sub-traits with details shown in the table below.
*Table 1 – Sub-traits added to the Nordic general health index. ERP
LRP
KET
OMB
FL
• Retained placenta
• Hormonal reproductive disorders
• Ketosis
• Milk fever
• Fet and leg problems other than those related to claw health
• Hormonal reproductive disorders • Infectious reproductive disorders
• Infectious reproductive disorders • Other reproductive disorders
• Other reproductive disorders
• Other metabolic diseases • other feed related disorders • Other diseases
ERP: Early reproductive disorders; LRP: Late reproductive disorders; KET Ketosis; OMB: Other metabolic diseases; FL: Feet and leg problems Source: Nordic Cattle Genetic Evaluation
NORDIC GENERAL HEALTH INDEX The Nordic general health index is based on recorded treatments in 1st, 2nd, and 3rd lactation. The ketosis sub index is new and based on individual measurements of BHB (β-hydroxy butyrate) from milk samples in Denmark and Finland. The economic weighting for each sub index has also been adjusted – most weighting on other metabolic diseases. Finally, lactation weights were adjusted to put more weight on in later lactations. The result is more reliable
Milk & Honey I JANUARY 2021
breeding values (both genomic and conventional) for general health. The Nordic general health index is the most complete index today, resulting in the largest genetic progress for resistance and resilience to diseases and disorders other than mastitis. Other countries have also seen the value of genetic selection within this area. Similar indices are now emerging in countries such as Germany and in the United States. M&H
27
How do I identify more cows on heat this season? Self-adhesive heat detectors
GENIMEX PATCHES
2 Hours
5 Hours
8 Hours
11 Hours
Peel and stick heat detectors
SCRATCH E’S
ON APPLICATION
1 MOUNTING
3-5 MOUNTINGS
OVER 5 MOUNTINGS
Easy to apply and secure Gen2 self-adhesive system No experience required to interpret patch results Progressive indication of heat cycle duration and activity levels Design minimises false positives Highly visible colour - can be seen from any angle