Park City Real Estate: Q1 2026 Market Report
Period Ending March 31, 2026
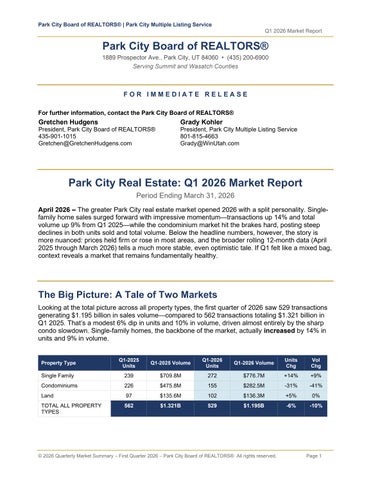
April 2026 – The greater Park City real estatemarket opened 2026 with asplit personality. Singlefamily home sales surged forward with impressive momentum—transactions up 14% and total volume up 9% from Q1 2025—while the condominium market hit the brakes hard, posting steep declines in both units sold and total volume. Below the headline numbers, however, the story is more nuanced: prices held firm or rose in most areas, and the broader rolling 12-monthdata (April 2025 through March 2026) tells a much more stable, even optimistic tale. If Q1felt like a mixed bag, context reveals a market that remains fundamentally healthy.
The Big Picture: A Tale of Two Markets
Looking at the total picture across allproperty types, the first quarter of 2026 saw 529 transactions generating $1.195 billion in sales volume—compared to 562 transactions totaling $1.321 billion in Q1 2025. That’s a modest 6% dip in units and 10% in volume, driven almost entirely by the sharp condo slowdown. Single-family homes, the backbone of the market, actually increased by 14% in units and 9% in volume.
The rolling year-over-year numbers—comparing the 12 months ending March 31, 2026 with the same period a year prior—paint an even brighter picture. Totalmarket volumerose 9% with singlefamily volume up a striking 21% and the combined residential market (single family plus condos) up 11%. These trailing 12-month figures smooth out the seasonal noise and confirm that the greater Park City market has not lost its footing.
Single-Family Homes: The Star of Q1 2026
If the Park City market were a ski resort, single-family home sales would be afreshly groomed blue run—maybe not the daredevil black diamond of the COVID-erafrenzy, but steady, strong, and enjoyable for buyers and sellers alike. Across the MLS area, 272 single-family homes sold in Q1 2026, generating $776.7million in volume.
SINGLE FAMILY HOMES
Park City (Ar 1-9)33$196.7M26$131.2M-21%-33%$4,016K Snyderville Basin (Ar 10-23)66$264.5M78$331.9M+18%+25%$2,869K
Jordanelle (Ar 24-29)14$63.4M30$120.2M+114%+90%$4,204K
Heber Valley (Ar 30-47)64$96.2M59$105.2M-8%+9%$1,292K
Kamas Valley (Ar 50-53)15$33.2M23$21.8M+53%-34%$735K
Standout Stories
Jordanelle:The Quarter’s Most Remarkable
Jump
The Jordanelle area was the runaway story of Q12026 for single-family homes—sales morethan doubled year-over-year (14 to 30 transactions) and volume nearly doubled ($63.4M to $120.2M, +90%). Led by asurge in Mayflower-Jordanelle—which saw sales jumpfrom 2 to11 transactions— this area is clearly absorbing new construction supply with healthy demand.
Snyderville Basin: Broad-Based Strength
The Snyderville Basin—the sprawling area encompassing Canyons Village, Promontory, Jeremy Ranch, Glenwild, and more—was the highest-volume single-family sub-market in Q1, with 78 homes sold for $331.9 million. That’s an 18% jump in units and 25% in volume from Q1 2025.
• Promontory (Area 22): 22 sales at $128.3 million (+56% volume) witha median of $4.8M (+31%).Golf-communitydemand continues to drive premium pricing.
• Canyons Village (Area10): Volume edged down slightly (-4%), but themedian price skyrocketed 98% to $23.5 million on just 3 transactions. Tiny sample—dramatic outlier. New ultra-luxury construction is driving that number.
• Glenwild (Area 18): 5 sales averaging $6.3M each, up 151% in volume—a standout performance in one of Park City’s most exclusive gated communities.
• Jeremy Ranch (Area 17): 67% more transactions and volume morethan doubled to $27.8M. A strong showing in one of the area’s most popular neighborhoods.
Park City Limits: Fewer Sales, Steady Prices
Park City proper (Areas1-9) saw a 21% dip intransaction count (33 to 26sales), and volume fell 33%. But the median price was nearly unchanged at $4.0 million (+1%), suggesting that sellers aren’t capitulating on price—thereare simply fewer homes changing hands. Old Town(Area 01) was an exception: volume soared 41% to$32 million despite one fewer transaction, as higherpriced properties drove the average up to $4.0 million.
Heber Valley: Affordable and Active
Heber Valley’s 59 single-family sales (down slightly from 64) generated $105.2 million in volume, up 9% despite fewer transactions. The median pricerose 21% to $1.29million. Red Ledges, Heber’s premier luxury enclave, logged 11 sales averaging $4.36 million each—strong demand continues for the area’s resort-flavored lifestyle at comparatively accessible price points.
Condominiums: A Significant Reset
If single-family was the quarter’s star, condominiums were its cautionary tale. The overall MLS area saw condo transactions fall31% (226 to 155 sales) and total volume decline 41% ($475.8M to $282.5M). Withinthe Primary Market Area (Summit and WasatchCounties), the decline was 33% in units and 42% in volume. That’s a sharp drop by any measure, and it demands a closer look.
Park City (Ar
2429)59$84.6M38$56.9M-36%-33%$1,570K
Heber Valley (Ar 30-47)21$13.6M9$4.5M-57%-67%$475K
Kamas Valley (Ar 50-53)03$1.5MN/AN/A$501K
What’s Driving the Condo Slowdown?
The story starts in Park City Limits, where condo sales were cut in half (80 sales in Q1 2025 to just 40 in Q1 2026) and volume plunged 54%. The biggest contributor: DeerCrest (Area 04). InQ1 2025, Deer Crest logged 29 condo transactions (largely driven by newFounders Place inventory). In Q1 2026, that fell to just 4. This is not a crisis — it’s supply depletion.The Founders Place wave has largely passed, and there is less new product entering the pipeline to replace it.
Importantly, the rolling 12-monthfigures for ParkCity Limits condos tellavery different story: volume is UP12%, and the median pricerose 17% to $2.25 million. That’s not amarket in distress—that’s a market that consumed an extraordinary amount of luxury supply and is now digesting it.
Bright Spots in the Condo Market
Snyderville Basin:The Steady Performer
Snyderville Basin (Canyons Village, Kimball Junction, Pinebrook, Silver Creek, etc.) wasthe only major sub-market to show positiveQ1 condo results: 49 sales vs. 47 in Q1 2025, and volume ticked up 4%. Canyons Village was the workhorse, with 26 sales generating $48.1 million (+26% volume). The median price of $1.34 million was down 15% but reflects a differentmix of product rather than price erosion in existingunits.
Hideout (Area 29): A Bright SpotNear Jordanelle
Hideout was Q1’s strongest condo performer in the Jordanelle region—18 sales generating $29 million, up 64% in units and 53% in volume from Q12025. Over thetrailing 12 months, Hideout logged 86 condo sales totaling $138.3million (+39% volume)—a community clearly hitting its stride.
Lower Deer Valley (Area 03): Rolling 12-Month Surge
While Q1 was modest (9 sales vs. 10 a year ago), the trailing 12-monthdata shows 53 sales totaling $168.2 million—a 109% increase in volume and a 56% jump in units. Themedian pricerose 30% to $2.85 million. This area is on fire over a longer time horizon.
Speaking of inventory
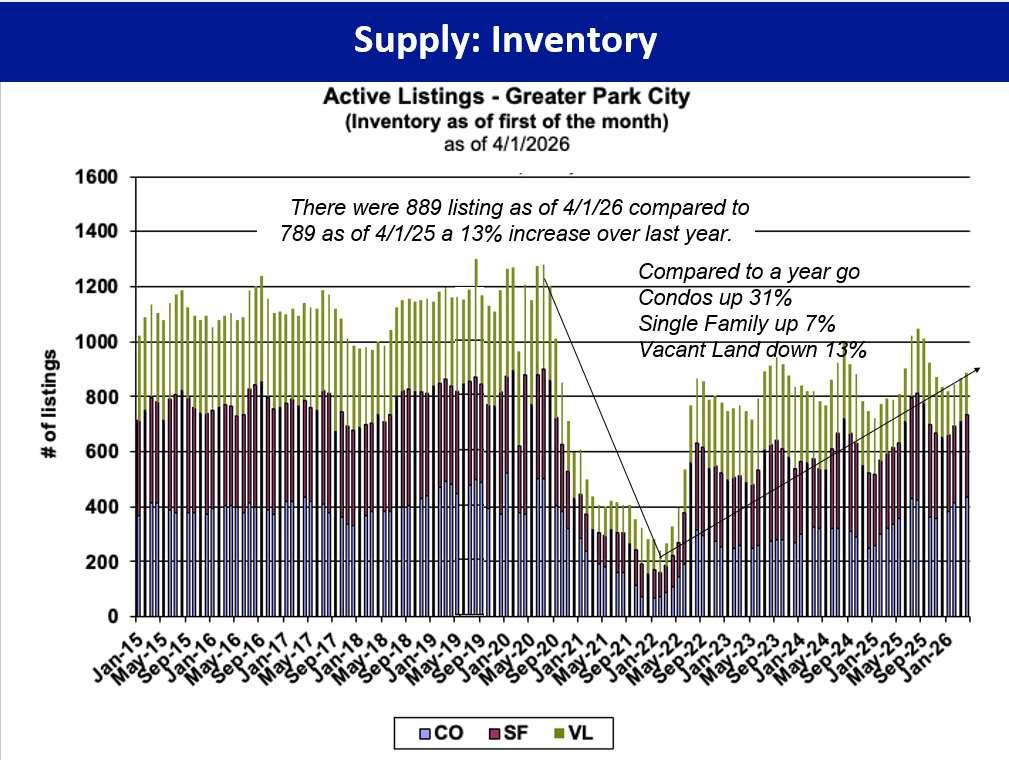
News reports from the national press continue toreinforce the need for millions of housing units to meet continuing demand. The shortage is broadly similar across markets.And the Wasatch Back is not immune.
This graph shows the precipitous drop in inventory following the 2020 pandemic, and the slow but steady recovery since. Pre-Covid, total active listings for all property types settled intothe 1,100 to 1,200 range. Since 2022, seasonalvariances influenced listing inventory which oscillated between 800 and 900 listings, still wellshort of pre-covid levels but considered stable. (Chart courtesy Rick Klein.)
The 12-Month View: A More Balanced Story
Quarter-over-quarter comparisons can be noisy. Looking at the full 12-monthrolling period (April 2025 through March 2026 vs. the same period ayear prior) gives amorereliable read on market direction:
• Single-family homes: Median pricerose 20% to $1.775 million MLS-wide; 18% to $1.975 million in the Primary Market Area.
• Condominiums: 850 sales, a drop from 1,012 (-16%). Despite fewer unitsselling, average prices rose 11% to $1.73 million, demonstrating that the mix is shifting upmarket.
• Land: 459 land sales represented 18% of all transactions system wide. Single digit declines in both units and volume suggest stable land valuations.
• Combined residential (Condos plus Single-family): 2,172 housing units sold in the past 12 months, down 4% from the previous year but strong prices kept sales volume apaceor slightly ahead of the previous period.
• Total market: $5.636 billion across all types, up 9% from the prior 12months.
Headwinds and Factors to Watch
Tariff Uncertainty and Buyer Hesitation
The first quarter of 2026 coincided with significant uncertainty around federal trade policies. Tariff announcements and counter-announcements created volatility in financial markets, whichtends to make high-net-worth buyers—the core Park City customer—pause beforemaking large discretionary purchases.Whether this accounts for some of the Q1slowdown remains speculative, but it’s a factor agents were noting in conversations.
Interest Rates
Mortgage rates remained elevated by historical standards through Q12026. For the luxury segment, where cash buyers arecommon, ratesmatter less. But in themid-market (Heber, Kamas Valley, Snyderville Basin’s more affordable areas), financing costs continue to be a constraint on buyer activity.
Insurance Costs
Fire risk reclassifications continued topush homeowner insurance premiums higher in portions of Summit and Wasatch Counties. Some buyers inwildland-urban interface zones are discovering significantly higher carrying costs than they anticipated—an increasingly important factor in purchase decisions.
The Ski Season Question
After a slow snow start to the 2025-26 winter, conditions eventually improved. The full impact on short-term rental incomeand buyer sentiment will take another quarter tofully assess. The Sundance Film Festival’s planned departurefrom Park City also continues to hang over the shortterm rental market as anunresolved variable.
Outlook: Cautiously Optimistic
The Park City market enters Q2 2026 with more questions than usual—but also with atrack record of resilience that demands respect. The 12-month trend lines remain positive. Prices have not broadly declined. Supply, while improving, remains tight in the most coveted segments. And buyers with the means and thedesire to own in one of America’s premier resort markets continue to show up.
The most likely scenariofor the balance of 2026 is continued market segmentation: luxury singlefamily homes in top locations will remain competitive and well-priced; the condo market will stabilize as the post-Founders Place supply adjustment runs its course; and growth markets like Jordanelle and Hideout will continue to capture demand from buyers who want the Park City lifestyle at amore accessible price point.
In the words of one local agent overheard at a broker open house: “The people who want to be here still want to be here. They’re just being a little more deliberate about it.” That’s probably the most accurate summary of Q1 2026 available.
About the Wasatch Back Market:
Real estate in the Wasatch Back consists of highly segmented markets with nuances that vary significantly from one neighborhood to another and one house to another. Comparisons are hard to read on paper due to the unique features of individual properties, such as amenities, condition, style, location, age, view, and inventory. Buyers and Sellers are advised to contact a local Park City Board of REALTORS® Professional for the most accurate, detailed, and current information.
Note: Only areas with a minimum number of transactions are included in sub-area statistics. Data is preliminary and subject to revision as late-reporting transactions are recorded.
© 2026 Quarterly Market Summary – First Quarter 2026 – Park City Board of REALTORS® All rights reserved.